the relationship between political and economic freedom
TRANSCRIPT

Journal of Private Entetprise, Special Issue, Volume XXII, Number 2, Spring 2007
The Relationship Between Political andEconomic Freedom Reconsidered
Clifford F. Thies*Shenandoah University
In chapter 1 of Capital and Freedom (1962), Milton and RoseFriedman made the argument that, instead of being antithetical topolitical freedom, economic freedom is compatible with politicalfreedom. Their argument was reasonable, engaging and accessible to awide audience. It came at a time when many intellectuals were inclinedto believe that economic freedom ran contrary to political freedom. Atthe time, differences of opinion on the relationship between politicaland economic freedom were due in part to a lack of measurement ofthese phenomena. Today, with the accumulation of vast data sets ofmeasures of political and economic freedom, it should be possible,empirically, to resolve the argument as to what is the relationship.'
While it may appear obvious and well-established empirically,
* The author thanks Bruce Gouldy, Mike Holmes, Gary Pecquet and Bill Westmillerfor their comments on an earlier version of this paper.
lAs F.A. Hayek (1960, pp. 11-21) has stated, there are several definitions offreedom. One may be described as the negative definition. This definition sees theprimary role of the state to be the defense of persons from the coercion of others.The other definition may be described as the positive definition. According to thisdefinition, the people are free—through the state—to do what they would not beable to do on their own. These two definitions conflict when what some peoplewant to do through the state impinges on others, as when collective actioninvolves the forcible taking of property or the curtailment of the liberty of others.
Clifford F. Thies 95

Journal ofPrivate Enterprise, Special Issue, Volume XXII, Number 2, Spring 2007
that economic freedom furthers economic growth,' there remainconcerns about the casual relationship between the two. De Hann et al(2006, 176) argue that the possibility that economic freedom isco-determined along with economic growth "casts considerable doubt"on many of the studies of the effect of economic freedom on economicgrowth. The accumulation of additional years of data has enabled theapplication of so-called Granger (1969) or Granger-Sims (1980)casuality tests to investigate this matter. Farr (1998) and Dawson (2003)have done just this, Dawson using data through 2000, finding thateconomic freedom is indeed a cause of economic growth.'
The effects of political freedom on economic growth, and ofpolitical and economic freedom on each other are less well developedthan the effect of economic freedom on economic growth. De Vanssay,et al (2004) find some evidence that governments that are moreaccountable to the people are more likely to adopt economic freedom.Wu and Davis (2004), while arguing that economic freedom leads toeconomic development, and that economic development leads topolitical freedom, indicate that studies of a direct relationship betweeneconomic freedom and political freedom have not been conclusive.Furthermore, they say (p. 170), "Empirical analyses on the possiblereverse relationship between political freedom and economic freedom
2Hanke and Walters (1997) and Leschke (2000) examine the effect of economicfreedom on the level of GDP per capita; and Gwartney, Lawson and Holcombe(1999), among others, examine the effect of economic freedom and/or its changeson the change of GDP per capita.
3Dawson (2003) investigates a variety of specifications of the economicfreedom-growth relationship, with and without "conditioning variables" such asthe ratio of investment to GDP. In his specification of "the long-run," includingthe conditioning variables, he does not find that the level of economic freedomcauses the rate of economic growth (pp. 487-88). This finding can be reconciledwith his other results by his finding that economic freedom causes growth, in thelong-run, via investment, which he separately finds (pp. 489-90).
Clifford F. Thies 96

Journal of Prinate Enterprise, Special Issue, Volume XXII, Number 2, Spring 2007
are largely lacking."As will be shown below, measures of political and economic
freedom through 2005 indicate that political and economic freedom arepositively correlated; and, that there is strong evidence that politicalfreedom causes economic freedom, but only weak evidence thateconomic freedom causes political freedom. In addition, there is strongevidence that both political and economic freedom further economicgrowth. These results confirm and reinforce prior findings with regardto the relationship between economic freedom and economic growth,and add to our understanding of the relationships between economicand political freedom, and these and economic growth.
The rest of this paper is organized as follows: The next sectiondescribes the measurement of political and economic freedom. Then,the paper looks at the correlation of the two across countries, and theirtrends over the past thirty years. Then, some econometric analyses isconducted in which political and economic freedom and real GDP percapita are regressed against lagged values of these three variables andcertain other variables, in order to explore the possible cause and effectrelationships that bring about the observed correlation.
The Measurement of FreedomIn 1972, Freedom House, an independent think-tank based in
New York, began an annual assessment of political freedom and civilliberty in the world. For the first several years, the report was essentiallythe work of Raymond Gastil. Subsequently, Freedom House developeda team of analysts, including both in-house and outside experts. At first,the annual report of Freedom House's project was published in theorganization's magazine. Later, the report was also published in bookform (e.g., Freedom House, 2005). Recently, the report has beenpublished electronically.
For each country and territory included in the survey, the teamof analysts assembled by Freedom House reviews a variety of sourcesincluding government, non-government and academic reports, foreign
Clifford F. Thies 97

Journal of Private Enterprise, Special Issue, Volume XXII, Number 2, Spring 2007
and domestic news, personal contacts, and site visits. The team thenrates jurisdictions on a scale from 1 to 4 on each of ten to twelve areasof political freedom, and on each of fifteen areas of civil liberties. Theseareas are described in Tables 1 and 2. The scores in the subcomponentsare combined into overall ratings for each of political freedom and civilliberties, on a scale from 1 to 7 in which 1 means "Free," and 7 "NotFree." The methodology thus involves a systematic and consistentassessment of a set of political and civil conditions within countries, inwhich judgment is used to convert a variety of information into a scale.In this paper, the two Freedom House measures have been combinedinto one, and re-scaled from zero to 100, where zero is "Not Free" and100 is "Free."
In 1997, following a series of conferences organized by MichaelWalker of the Fraser Institute of Vancouver, British Columbia, andMilton Friedman, a measure of economic freedom was developed(Gwartney, Lawson and Block, 1996).4 The Economic FreedomNetwork's measure of economic freedom is similar to Freedom House'smeasure of political freedom, in that both are based on an average ofseveral underlying scales (except that the measure of economic freedomruns from 1 to 10, where 1 is "Not Free" and 10 is "Free"). Theunderlying scales of the Economic Freedom index, however, are moreprecisely defined, about half of them being numerical data. Table 3describes the areas, twenty-three in all, covered by the EconomicFreedom Network's measure.
Before proceeding, a comment on the overlap between the twomeasures of freedom is warranted. Both measures incorporate aspects
4A rival partnership of the Heritage Foundation and the Wall Street Journalpublishes an Index of Economic Freedom (Miles, Holmes and O'Grady, 2006).
Clifford F. Thies 98

Table 1Freedom House's measure of Political Freedom. Each of the ten to twelveareas is rated on a (judgment-based) scale of 1 to 4, and these ratings are
totaled and converted to a scale of 1 to 7, in which 1 is "Free"and 7 is "Not Free."
Is the head of state and/or head of government or other chief authority electedthrough free and fair elections?
Is the legislature elected through free and fair elections?
Are there fair election laws, equal campaigning opportunities, fair polling, andhonest tabulation of ballots?
Do the people have the right to organize into different political parties?
Is there significant opposition vote, de facto opposition power, and a realisticpossibility for the opposition to gain power through elections.
Are the people's political choices free from domination by the military, foreignpowers, totalitarian parties, religious hierarchies, economic oligarchies, and otheroverly powerful groups?
Do cultural, ethnic, religious, and other minority groups have reasonableself-government, autonomy or participation in the decision-making process.
Do freely-elected person determine the policies of the government?
Is the government free from pervasive corruption?
Is the government accountable to the electorate in-between elections, and does itoperate with openness and transparency?
(Supplemental) For traditional monarchies, is there a system allowingconsultation with the people, encourage discussion of policy, and the right ofpetition?
(Supplemental) Is the government or occupying power changing the ethniccomposition of the jurisdiction so as to destroy a culture or tip the politicalbalance of power in favor of another group?
Clifford F. Thies 99

Table 2Freedom House's measure of Civil Liberty. Each of the fifteen areas is rated on a(judgment-based) scale of 1 to 4, and these ratings are totaled and converted to a
scale of 1 to 7, where 1 is "Free" and 7 is "Not Free."
Are there free and independent media and other forms of expression (or, doesstate-controlled media offer pluralistic points of view)?
Is there free private and public religious expression, and are there free religiousinstitutions?
Is there academic freedom, and is the education system free of extensive politicalindoctrination?
Is there open and free private discussion?,
Is there freedom of assembly, demonstration and open public discussion?
Are people free to join into political, quasi-political, civic and ad hoc issue organizations?
Are people free to join into trade unions, peasant organizations, professional associationsand such? And, is there effective collective bargaining?
Is there an independent judiciary?
Does the rule of law prevail in civil and criminal matters? And, are the police under directcivilian control?
Are there protections from police terror, unjustified imprisonment, exile or torture? Arepeople reasonably secure from violence due to war and insurrection? .
Are people treated equally under the law?
Is there personal autonomy in matters such as travel, choice of residence and choice ofemployment? Are people excessively dependent on the state?
i.
Do citizens have the right to own property and establish private businesses? Are privatebusinesses overly regulated by government officials, security forces, or organized crime?
Do citizens have personal freedom in matters such as marriage partners and children, andis there gender equality?
Is there equal opportunity and the absence of economic exploitation?
Clifford F. Thies 100

Table 3The Economic Freedom Network's measure of Economic Freedom. For the 11
categories not involving numerical data, ratings are based on a (judgment-based) scalefrom 1 to 10; and for the 12 categories involving numerical data, ratings involve the
conversion of the nunierical data into a scale from 1 to 10. The (over-all) measure for acountry is then set equal to a weighted average of the scores of these 23 categories, and is
itself a scale from 1 to 10, where 1 is "Not Free" and 10 is "Free."
Size of Government — 11.0%
Government Consumption Expenditure as a percent of TotalConsumption
Transfers and Subsidies as a percent of GDP
Structure of the Economy — 14.2%
Government Enterprises and Investment as a share of the economy
Extent of Price Controls
Marginal Tax Rates
Use of Military Conscription
Price Stability — 9.2%
Money Growth Rate in excess of real GDP Growth Rate
Inflation Rate
Standard Deviation of Inflation Rate
Currency Controls — 14.6%
Legality of ownership and use of foreign currencies
Black market in foreign currencies
Property Rights — 16.6%
Security of Property Ownership
Security of Contracts
Clifford F. Thies 101

Security of Contracts
Legal Institutions securing the Rule of Law in Property andContract
International Trade – 17.1%
Tariffs
Non-tariffs Barriers to Trade
Financial Markets – 17.2%
Private Ownership of Banks
Credit Controls
Interest Rate Controls
Capital Controls
of the rule of law and freedom of association in the marketplace. Thethrust of Freedom House's measure—as it should be—is theprotection of a person's civil liberty; while the thrust of the EconomicFreedom Network's measure—also as it should be—is the protectionof a person's wealth. Therefore, even in the places where the twomeasures overlap, they are not identical.
The Trend of Freedom in the WorldIn their 1980 book Free to Choose (pp. 283-310), Milton and
Rose Friedman expressed tremendous optimism that the tide wasturning for freedom in the world. The subsequent unfolding ofhistory, shown in Figure 1, has validated their view.First, political freedom, in thirty years, has
Clifford F. Thies 102

Journal ofPlivate Entelpise, Special Issue, Volume XXII, Number 2, Spring 2007
13r-o
CD
5c
E :o >-o .—co 73W TD
co cIr. _Zci. li1, .cc °aso
Eocoo
Lir
toN.
P.:a to O. to o 0 0
0 c0 0 It) 4 4
I
si
Fr)c
.
to00cv
_
000cm
.
too)o)..-
.
..-
_
(c)co0)—
,
0coCD—
InN.a,...
IF_ .R,4,- 1,3
LI ..E'co c.,= ;E:,-1.2, §
g l'II 12e IL
U._ 12
P, §a",.." ga. LIJ
41 f
0 to o tn to aN. co co o v v.
Clifford F. Thies 103

Journal of Private Enterprise, Special Issue, Volume XXII, Number 2, Spring 2007
expanded from 50 to 65. 5 Second, while the world is shown to havecontinued its former drift toward socialism into the period of this study,by 1985, economic freedom was also on the rise.
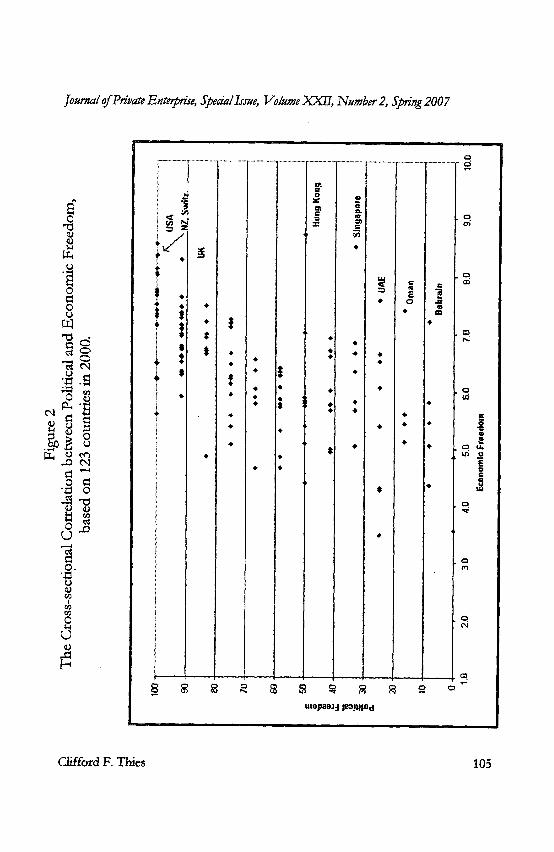
For some, seeing this trend of freedom in the world has beenconvincing, but Milton and Rose Friedman believed before they saw.Figure 2 presents a scatterplot of the cross-country relationshipbetween political and economic freedom for the year 2000. Almost allcountries are positioned in a swath that runs from the south-west tothe north-east portions , of the graph, indicative of a positivecorrelation. At the top of the heap, in terms of the combination ofpolitical and economic freedom, is the United States. Nearby are NewZealand, Switzerland and the United Kingdom. Just a bit furtherremoved (but not identified in the graph) are Australia, Canada,Ireland, and the Netherlands.
Four countries and one semi-autonomous region clearly standout from the others, these being Hong Kong, Singapore, the UnitedArab Emirates, Oman and Bahrain. These outliers can be easilyexplained. The first two are a relatively small Chinese jurisdictionand a majority ethnic-Chinese country that have for some timeembraced economic freedom. The latter three are relatively smallArab countries that have recently embraced economic freedom.
Scatterplots for 1975, 1980, and so forth until 1995 (not shown)are roughly similar to Figure 2, except that various countries showthemselves to be outliers from time to time. Consider the case ofTurkey which—through the period—had a trend of rising economicfreedom and a volatile record regarding political freedom involvingmilitary coups and radical governments. In 1980, Turkey had an
5While the five-year data show uninterrupted progress, an annual seriesconstructed with the Freedom House numbers indicates that, following the fall ofthe Berlin Wall, there was, first, a burst of political freedom and, then, a partialretrogression.
Clifford F. Thies 104
C:1
88
0 "I••••
usopatu pitomind
3
v:, I,... CO
: a NI; = Zi
*
•f $* $
*$t
• $
I •,
,z,,;
,,1
,
i
,
,
•,,
,:,,,
I
tl:=
•*
••*•••••
••
•••
•
••
.•
•
M==xa,aa=
•
••.
••••
It.
I•
an.r==
7t7;I
4
•
••
•
•
.
•
c
E0•
•••
,,
...=*
•ca
••
•1
•
.
.. n.)
C3
Journal of Private Enterprise, Special Issue, Volume XXII, Number 2, Spring 2007
Clifford F. Thies 105
Journal of Private Enterprise, Special Issue, Volume XXII, Number 2, Spring 2007
unusual combination of relatively high political freedom but onlymoderate economic freedom; and, in 1995, with the rule of apopularly-elected, radical Islamic government, it had an unusualcombination of relatively low political freedom and relatively higheconomic freedom.
Regression AnalysisTo be sure, it is impossible to infer causality from the mere
observation of a positive correlation between political and economicfreedom. However, the few comments made above, concerning thenon-democratic decision in five small jurisdictions to embraceeconomic freedom, and the volatility of political freedom relative toeconomic freedom in Turkey, suggest that economic freedom may bepredetermined relative to political freedom. Roberti Barro (1999) hasdescribed democracy as a "luxury good," so that high-income countrieswould demand more of it than low-income countries. This suggests achain of cause and effect involving economic freedom leading toeconomic development leading, in turn, to political freedom.Tentatively, this framework will be utilized.
In column 1 of Table 4 presents the simple regression ofpolitical freedom against economic freedom, using all the countriesevery five years, from 1975 to 2005, 6 for which there is the requisitedata. Consistent with the scatterplot discussed above, there is a positivecorrelation. Political freedom (measured on a scale from zero to 100)goes up by about 12 points, for every one point increase in economicfreedom (measured on a scale from 1 to 10). This would be only slightlyaskew from a one-to-one relationship emanating from the
6For 2005, index of economic freedom is the 2003 figure of the Economic
Freedom Network and the change from the 2003 to the 2005 figure of theHeritage Foundation/ Wall Street Journal index.
Clifford F. Thies 106

Table 4Regression analysis of Political Freedom (a scale of 0 to 100); using the data of anevolving sample of 53 to 123 countries, observed every five years from 1975 to2005, a total of 745 observations. Absolute values of t-statistics in parentheses)
1 2
Constant -12.20 ** 32.38 ***(2.67) (5.82)
Economic Freedom a scale from 1 to 10) 12.73 *** 9.54 ***(16.45) (12.24)
1980 observations -3.34(0.84)
.
1985 observations -4.82(1.27)
1990 observations -5.21(1.37)
1995 observations -6.29 0(1.66)
2000 observations -7.29 0(1.89)
2005 observations -3.97(1.03)
Asian countries -34.34 ***(14.68)
Africa countries -38.23 ***(15.06)
American countries -11.50 ***(4.73)
R2 26.7% 50.5%*significant at the two-tailed 10% level,** at the two-tailed 5°/0 level,*** at the two-tailed 1% level
Clifford F. Thies 107
Journal of Private Entel,rise, Special Issue, Volume XXII, Number 2, Spring 2007
origin, if we were to measure both political and economic freedom onthe same scale (either zero to 100, or 1 to 10). As indicated by R 2, withthe one variable of economic freedom, about one-quarter of thevariation in political freedom is "explained."
Most economic theories are posited on the basis that "otherthings" are equal; i.e., political freedom is higher if economic freedomis higher, other things being equal. But, what are the "other things" thatshould be held equal in the case of the relationship between economicfreedom and political freedom? These would be conditionspre-determined to, or co-determined with economic freedom that alsoeffect political freedom. In the context of a pooled,cross-section/time-series sample, an effective way to control for "otherthings" is a "fixed-effects" model. In a fixed-effects model, dummyvariables are constructed for every time period other than one, and forevery cross-sectional unit other than one (Kmenta, 1971:516-17). Thesetwo sets of dummy variables usually do a good job of capturing theeffects that are unique to each cross-sectional unit, and that over timeare changing in common for the cross-sectional units (apart from theeffects of the independent variables of interest). A fixed-effects modelis a naive model. It side-steps the development of a causal model.
Column 2 of Table 4 reports the results of a modifiedfixed-effects model, with dummy variables for observations in the years1980, 1985, and so forth until 2000 (1975 being the excluded timeperiod), and dummy variables for the countries of Asia, Africa and theAmericas (the countries of Europe being the excluded cross-sectionalunits). This is a modified fixed-effects model because it does not havecross-sectional dummy variables for each cross-sectional unit except forone, but have only identified the countries of the several continents withcross-sectional dummy variables.
In the modified fixed-effects model (column 2), the effect ofeconomic freedom on political freedom is slightly less than what isobtained in the simple model (column 1). The time series dummyvariables are (individually) insignificant, which might mean that the
Clifford F. Thies 108

Journal of Private EnteVise, Special Issue, Volume XXII, Number 2, Spring 2007
obtained in the simple model (column 1). The time series dummyvariables are (individually) insignificant, which might mean that thepositive trend observed in political freedom is sufficiently captured bythe positive trend in economic freedom.
What is interesting in the modified fixed-effects model are theeffects of the dummy variables distinguishing the Asian, African andAmerican countries from the European countries. Compared to theEuropean countries, American countries have about 11 points lesspolitical freedom (given their levels of economic freedom), and Asianand African countries about 34 and 40 points less political freedom(again, given their levels of economic freedom). These results do notmean that Asian, African and American countries are inherently lesshospitable to political freedom than European countries. They onlyindicate that non-European countries were less hospitable to politicalfreedom during the period of this study. (The same caveat applies tocertain other effects to be discussed below.)
Casuality TestsTable 5 reports some regressions exploring the cause and effect
relationship that might be resulting in the observed correlation betweenPolitical and Economic Freedom. The presumption of these regressionsis that if the past value of e.g., Economic Freedom adds explanatorypower to a regression of Political Freedom on its own past value, thenit can be suspected that Economic Freedom is a cause of PoliticalFreedom.
In these regressions, changes in Political Freedom, EconomicFreedom and the natural logarithm of real GDP per capita areregressed on (1) the level of each of these variables of five years prior,(2) the modified fixed-effects variables described above, and (3) a setof variables reflecting the underlying religious beliefs of the people ofthe countries in the sample (see Barro and McCleary, 2003). Changesin the variables to be explained, and not levels, are used because of thesusceptibility of time series analysis to spurious correlation and
Clifford F. Thies 109

Table 5Regression anallysis of 5-year Changes in Political Freedom, EconomicFreedom and the natural logarithm of GDP per capita; using the date
of an evolving sample of 53 to 123 countries, observed every fiveyears from 1980 to 2005, a total of 623 observations.
(Absolute values of t-statistics in parentheses)
1 2 3
Dependent Political Economic Log(GDP perVariable-5 year Freedom Freedom capita)Change in ...
Constant 13.44 ** 0.71 ** 0.73 ***
(1.96) (2.75) (9.19)
Political Freedom (A -0.31 *** 0.005 *** 0.001 ***scale from 0 to (11.27) (4.94) (3.05)100)—five yearsprior
Economic Freedom 0.95 -0.27 *** 0.03 ***
(a scale from 1 to (1.40) (10.74) (4.16)10)–five years priior
Log(GDP per 1.53 0.08 ** -0.05 ***capita)–five yearsprior
(1.67) (2.33) (4.95)
1985 observations -3.83 -0.14 -0.18 ***
(1.50) (1.45) (6.11)
1990 observations -2.69 0.13 -0.23 ***
(1.05) (1.34) (7.92)
1995 observations -1.93 0.42 *** -0.28 ***
(0.75) (4.33) (9.25)
2000 observations -1.97 0.42 *** -0.28 ***
(0.77) (4.37) (9.43)
Clifford Thies 110

2005 observations -1.17(0.45)
0.11(1.09)
-0.39(13.00)
***
Asian countries -10.11(3.96)
*** -0.02(0.25)
-0.09(3.20)
***
African countries -9.95 *** -0.09 -0.15 ***
(3.65) (0.99) (.5.33)
American countries -5.01 ** -0.11 -0.10 ***
(2.71) (1.52) (4.61)
Muslims -7.76 *** -0.0001 0.0002(3.13) (0.12) (0.75)
Asian Religions -2.13 0.0008 0.0014 ***(0.66) (0.71) (3.76)
R2 19.0% 26.8% 37.4%
*significant at the two-tailed 10°/0 level; **at the two-tailed 5% level;***at the two-tailed 1% level
misleadingly high les when using highly-trended date.In case of the repression concerning economic growth, this
form should be recognized as Barro's (1991). In this regression, thecoefficient on the lagged level of the dependent is expected to benegative, because other things equal, highly advanced economies ae notexpected to grow as fast as developing economies. In the other tworegressions, a negative coefficient on the lagged level of the dependentvariable may be forced by the truncated measurement of the dependentvariable. Table 6 has the definitions and sources of these variables.
The three regressions have R's that vary from 19 to 38 percent,very significant lags of the dependent variable, and multiple other
Clifford Thies 111

Table 6Definition and Sources of the Variables included in
Tables 4 and 5
Political Freedom Average of Freedom House's measures ofPolitical Freedom and Civil Liberty, re-scaledfrom zero to 100, where zero is "Not Free"and 100 is "Free" .
Economic Freedom The Economic Freedom Network's measureof Economic Freedom, from 1 to 10, where 1is "Not Free" and 10 is "Free" [a]
1980 observations, 1985observations, etc.
Dummy variables denoting the 1980observations, the 1985 observations, etc., the1975 observations being the excluded group
Asian Countries, AfricanCountries and AmericanCountries
Dummy variables denoting the observationsfrom Asian countries, African countries, andAmerican countries, the European countriesbeing the excluded group [b]
Muslims, Asian Religions The proportions of people adhering (a) to theMuslim religion, (b) to the Hindu, Buddhist,Confucian or another Asian religion orphilosophy, (c) to Judaism or Christianity or(d) an Animist or Tribal religion (these aremostly Africans), assigning atheists and thoseexpressing no religious belief to the dominantlegacy religion of their country. From theCIA's World Factbook [c] .
Real GDP per capita i.e., in 1996US$ - Almost all from the PennWorld Table (Heston, Summers and Aten,2002) [d]
Clifford F. Thies 112

journal of Private Enterprise, Special Issue, Volume XXII, Number 2, Spring 2007
[a]For 2005,1 used the Freedom Network number for 2003 minus half thechange in the Heritage Foundation/ Wall Street Journal number from 2003 to2005.
[b]Treating Iceland and Russia as European countries, Egypt as an African•country, and Australia, New Zealand, Turkey, and the countries of Polynesia
as Asian countries.
[c]In preliminary analysis, in which Christians and Jews were the excludedgroup, Animists did not enter the regressions significantly. The Animistvariable was subsequently dropped from the regressions, making the excludedgroup Christians, Jews and Animists.
[d]For sixteen countries for which this number was not available for the year2000, I used real GDP per capita from the U.N.'s 2001 Human DevelopmentReport (adjusted by the ratio of the U.S. figure in the Penn World Table to theU.S. figure in the U.N. source). For nine countries for which this number wasnot available for one or more previous years, I used the annual growth rate ofreal GDP per capita from the U.N.'s 2001 Human Development &port to backEtlifrom the earliest year I had. For Taiwan for 2000,1 used real GDP per capitafrom the CIA's World Factbook (adjusted by the ratio of the U.S. figure in thePenn World Table to the U.S. figure in the
significant variables. With regard to Political Freedom, the regressionfor which is reported in column (I), Economic Freedom enters themodel with only marginal significance, as does GDP. These resultsprovide only weak evidence that Economic Freedom is a cause ofPolitical Freedom, either directly or through economic development.
With regard to Economic Freedom, column (2), PoliticalFreedom enters the model significantly. This result provides strongevidence that Political Freedom is a cause of Economic Freedom. Withregard to GDP, column (3), both Political and Economic Freedom
Clifford F. Thies 113

Journal of Private Enterprise, Special Issue, Volume XXII, Number 2, Spring 2007
enter the model significantly, providing strong evidence that both arecauses of economic development.
Turning to the dummy variables tracking the time dimension ofthe pooled sample, it can be seen, as in column (2) of Table 4, that allare insignificant in the Political Freedom regression. In the EconomicFreedom regression, it can be seen that in 1995 and 2000, EconomicFreedom was a bit higher than would have been predicted based on themodel without these variables. Perhaps, Economic Freedom had,temporarily, gotten a bit ahead of the world's trajectory of the nexus ofPolitical and Economic Freedom and of economic development. In theGDP regression, it can be seen that the dummy variables denoting theyears of the sample from 1985 to 2005 indicate an increasing gapbetween the level of economic development in the world and itspredicted level given the increasing levels of Political and EconomicFreedom in the world, perhaps pointing toward continued strongeconomic growth in those countries that have liberalized.
Turning to the dummy variables indicating the continents of theworld, it can be seen, as in column (2) of Table 4, that the countries ofthe Americas are a bit behind those of Europe, and those of Africa andAsia a bit further behind, in terms of Political Freedom. In terms ofEconomic Freedom, all three of these dummy variables areinsignificant. In terms of GDP, these three variables indicate that thecountries of the Americas, of Africa and of Asia are 10 to 15 percentless than where they would be given their current levels of Political andEconomic Freedom.
Turning to the variables reflecting the (very broadly defined)religious or philosophical belief systems of the world, it can be seen thatcountries with substantial numbers of Muslims have significantly lessPolitical Freedom than other countries, other things equal. It can alsobe seen that countries with substantial numbers of adherents to Asianreligions or philosophical belief systems have slightly higher GDPs.These findings might be rationalized as due to the inclination of manyMuslims toward theocracy, and the impressive work ethnic associated
Clifford F. Thies 114
Journal of Private Enterprise, Special Issue, Volume )0(11, Number 2, Spring 2007
with many Asian people. Perhaps most informative is the lack ofsignificance of either of these variables in the Economic Freedomregression. It appears that each of the religious or philosophical beliefsystems of the world is equally comfortable with Economic Freedom.
Summary and ConclusionUsing the data of an evolving set of countries, growing from 53
to 123 in number, observed every five years from 1975 to 2005, it isfound that political freedom is positively associated with economicfreedom. Furthermore, there is strong evidence that political freedomis a cause of economic freedom and only weak evidence that economicfreedom is a cause of political freedom, and there is strong evidencethat both economic freedom and political freedom are causes ofeconomic growth. These results confirm and reinforce prior findingswith regard to the effect of economic freedom on economic growth,and add to out understanding of the relationship between economic andpolitical freedom. Mote than this, political freedom and economicfreedom are growing rapidly in the world and the optimism expressedby Milton and Rose Friedman in 1980 has been fully justified.
In Capitalism and Freedom (p. 11), Milton and Rose Friedmanwrote, concerning the relationship between political freedom andeconomic freedom, "Historical evidence by itself can never beconvincing." The ability we have today, with serious attempts toquantify economic and political freedom, to correlate one against theother, and to conduct Granger-type causality tests does not reallychange things. As any good Bayesian knows, for the data to beconvincing, there has to be an element of belief.
Clifford F. Thies 115

Journal of Private Enterprise, Special Issue, Volume "OCII, Number 2, Sprint 2007
References
Barro, Robert J., 1991. "Economic Growth in a cross section ofcountries." Quarterly Journal of Economic 106: 407-43.Barro, Robert J.,1999. "Determinants of D emocracy." Journal ofPolitical Economy 107(6):158-83.
Barro, Robert J., and Rachel M. McCleary, 2003. "Religion andEconomic Growth." NBER working paper 9682.
Dawson, John W., 2003. "Casuality in the freedom-growthrelationship." European Journal of Political Economy 19: 479-95.
De Hann, Jakob, Susanna Lundstrom and Jan-Egbert Sturm, 2006."Market-oriented Institutions and Policies and Economic Growth: ACritical Survey." Journal of Economic Surveys 20(2): 157-91.
De Vanssay, Xavier, Vincent Hildebran and Zane A. Spindler, 2004."Institutional Foundations of Economic Freedom: A time-seriescross-section analysis." Independent Institute working paper 51.
Farr, W. Ken., Richard A. Lord and J. Larry Wolfenbarger, 1998."Economic Freedom, Political Freedom and Economic Well-Being: ACasuality Analysis." Cato Journal 18: 247-62.
Freedom House, 2005. Freedom in the IForld. New York: Rowan &Littlefield.
Friedman, Milton, and Rose D. Friedman, 1962. Capitalism and Freedom.Chicago: University of Chicago Press.
Friedman, Milton, and Rose D. Friedman, 1980. Free to Choose. NewYork: Harcourt Brace Jovanovich.
Clifford F. Thies 116

Journal of Private Enteorise, Special Issue, Volume XXII, Number 2, Spring 2007
Granger, Clive W.J., 1969. "Investigating Causal Relations byEconometric Models and Cross-Spectral Methods." Econometrica 37:424-38.
Gwartney, James, Robert Lawson and Walter Block, 1996. EconomicFreedom in the World, 1975-1995. Vancouver, British Columbia: FraserInstitute.
Gwartney, James, and Robert Lawson, 2004. Economic Freedom in theWorld. Vancouver, British Columbia: Fraser Institute.
Gwartney, James, Robert Lawson and Randall G. Holcombe, 1999."Economic Freedom and the Environment for Economic Growth."Journal of Institutional and Theoretical Economics 155(4): 1-21.
Hanke, Steve H., and Stephen J.K. Walters, 1997. "Economic Freedom,Prosperity, and Equality: A Survey." Cato Journal 17 : 117-46.
Hayek, F.A., 1960. The Constitution of Liber0. Chicago: University ofChicago Press.
Heston, Alan, Robert Summers and Bettina Aten, 2002. Penn WorldTable Version 6.1 , Center for International Comparisons at the Universityof Pennsylvania (CICUP), (October).
Kmenta, Jan, 1971. Elements of Econometrics. New York: Macmillan.
Leschlde, Martin, 2000. "Constitutional Choice and Prosperity: A FactorAnalysis." Constitutional Political Economy 11: 265-79.
Miles, Marc A., Kim R. Holmes and Mary Anastasia O'Grady, 2006.Index of Economic Freedom. Washington, DC: The Heritage Foundation.Sims, Christopher, 1980. "Macroeconomics and Reality." Economettica
Clifford F. Thies 117

Journal of Private Entoprise, Special Issue, Volume .,co, Number 2, Spring 2007
48: 1-48.
U.S. Central Intelligence Agency, 2006. World Factbook.http://www.cia.govicia/publications/factbook/index.html
United Nations, 2001. Human Development Report. New York: OxfordUniversity Press.
Wu, Wenbo, and Otto A. Davis, 1999. "The two freedoms, economicgrowth and development: an empirical study." Public Choice 100: 39-64.
Wu, Wenbo, and Otto A. Davis, 2004. "Economic Freedom andPolitical Freedom." Pp. 163-72. In Charles K. Rowley and FriedrichSchneider, ed., The Engclopedia ofPublic Choice, Boston: Kluwer.
Clifford F. Thies 118