political regimes and economic performance sergei guriev, new economic school, moscow esnie, may 22,...
Post on 18-Dec-2015
214 views
TRANSCRIPT
Political regimes and economic performance
Sergei Guriev, New Economic School, Moscow
ESNIE, May 22, 2008

ESNIE May 22, 2008 Sergei Guriev 2
Economic case for democracy?
We all like democracy per se …… but can we also make an economic case for democracy?
How about “Democracy is good for economy”? There are no rich non-democratic countries …
(except for Singapore and Gulf countries)… but which way is causality? May be “democracy is only sustainable in a rich country”?
What about “Democracy causes faster economic growth”? This result does not emerge clearly from the standard growth regressions But cross-country growth regressions are themselves methodologically
vulnerable
New methods? Panel, difference-in-difference, matching Heterogeneity: go beyond democracy/dictatorship dichotomy

ESNIE May 22, 2008 Sergei Guriev 3
Outline
Arguments for and against democracy Basic facts on democracy and development Cross-country regressions New methodological approaches:
Fixed effects: Rodrik and Wacziarg Difference-in-difference, matching (Persson and Tabellini 2007) Microeconomic difference-in-difference-in-difference (Durnev and
Guriev) Go beyond democracy-autocracy dichotomy:
Heterogeneity within democracies: effect of political institutions within democracies on growth
Heterogeneity within autocracies: effect of political institutions within autocracies (Besley and Kudamatsu), role of leaders in autocracies

ESNIE May 22, 2008 Sergei Guriev 4
Democracy and growth
The main dilemma (North, North-Weingast, New Comparative Economics):
which regime can best protect the property rights? Democracy rent-seeking by private agents (e.g. interest
groups) Democracy redistribution by the poor (Alesina-Rodrik,
Acemoglu-Robinson) Non-democracy expropriation by the ruler

ESNIE May 22, 2008 Sergei Guriev 5
Data
Economic variables – same as in the growth regressions (Penn World Tables, World Development Indicators etc.)
Data start from 1960, higher quality from 1975
Democracy: Polity IV (Democ, Autoc, Polity=Democ-
Autoc)Freedom House: voting rights, civil liberties

ESNIE May 22, 2008 Sergei Guriev 6
Correlation between FH’s political rights and Polity IV’s democ (averaged over 1975-2005)
R2=0.74
SYRVNM
BHR
RWA
GAB
IRQ
KWT
BTN
LBYCHN
SWZ
CUBMRTAFGPRK
UZB
GNQ
MAR
SAU
QAT
ERI
MMR
OMN
TKM
SOMZAR
ARE
LAO
EGY
GIN
CIV
AZE
TUN
BDITCDTGOCMRAGO
DZA
UGA
DJI
BFA
KAZ
SDN
LBRTZA
TJK
SLEJOR
YEM
IRNCOG
KGZ
KENGNBIDN
CAF
HTI
SGP
ZWE
BLR
KHM
ZMB
MWICOMMOZNGAGHA
NER
YUG
LSO
NPLBGD
MLI
SEN
BEN
ALB
ETH
MEX
PAK
GUY
PRYMDG
ROM
HRV
GTMNICBGR
KOR
GMB
MNG
CHLMYS
POLPAN
PHL
ARM
HNDHUNPER
GEO
THAARGSLV
RUS
BRA
TMPNAM
DOM
LKA
UKR
URY
FJI
BOL
MKD
EST
MDA
ECU
SLB
TUR
COL
ZAF
BWA
LVA
LBN
VEN
SVK
IND
FRA
TTOISRGRC
JAMMUSPRTESP
LTUCANFINNLDAUSCRIJPNCYP
AUT
DEU
NORIRLITASWENZLBELCHE
SVNCZE
GBR
PNG
USADNK
-4-2
02
4e
( p
r_m
ean
| X
)
-4 -2 0 2 4 6e( democ_mean | X )
coef = .47393413, se = .02218531, t = 21.36

ESNIE May 22, 2008 Sergei Guriev 7
Basic fact: there are no rich non-democratic countries (2005)
AGO
ALB
ARE
ARG
ARM
AUSAUT
AZE
BDI
BEL
BENBFA BGD
BGR
BHR
BLR
BOL
BRA
BWA
CAF
CAN
CHE
CHL
CHN
CMRCOG
COL
COM
CRI
CZE
DEU
DJI
DNK
DOMDZA
ECUEGY
ERI
ESP
EST
ETH
FIN
FJI
FRA
GAB
GBR
GEOGHAGINGMB
GNB
GRC
GTMGUYHND
HRV
HUN
IDN IND
IRL
IRN
ISR
ITA
JAMJOR
JPN
KAZ
KENKGZKHM
KOR
KWT
LAO
LBNLKA
LSO
LTULVA
MAR
MDAMDG
MEX
MKD
MLIMNGMOZ
MRT
MUS
MWI
MYS
NAM
NERNGA
NIC
NLD
NOR
NPL
NZL
PAK
PANPER
PHL
PNG
POL
PRT
PRY
ROMRUS
RWA
SAU
SDN SEN
SGP
SLBSLE
SLV
SVK
SVN
SWE
SWZSYR
TCDTGO
THA
TJK
TTO
TUN TUR
TZAUGA
UKR
URY
USA
UZB
VEN
VNMYEM
ZAF
ZMBZWE
01
0000
200
003
0000
400
00G
DP
pe
r ca
pita
, pu
rch
asin
g p
ower
pa
rity,
200
0 in
tern
atio
nal
US
D
0 2 4 6 8 10Democracy, Polity IV

ESNIE May 22, 2008 Sergei Guriev 8
The slope is large: 1 point increase in democracy 15% in GDP pc level
KWT
SWZ
MRT
ARE
RWA
SAU
SDN
BLR
BHR
IRNGAB
ERI
KAZ
SYR
GMB
AZE
LAO
CHN
VNM
UZB
COG
PAK
MAR EGY
UGANPLTCDTGOTJK
TUN
CAF
YEM
ZWEGINCMR AGO
SGP
JOR
BFA
KGZ
ETH
KHM
DZA
DJI
TZA
MYS
NGAZMB
ARM
SLE
COM
MLI
NAM
ECU
VEN
BGD
GNB
LKA
MWI
BEN
UKR
GUY
MOZ
RUS
NER
COL
GEO
BDI
SLV
HND
FJI
MDG
EST
MEX
SEN
GHA
KEN
NIC
MDA
LSO
BRATURDOM
LVA
PHL
IDNGTMPRY
SLB
BOL
ARG
LBN
KOR
BWA
PER
CHL
ROM
ALB
SVK
PAN
ZAFBGR
MKD
IND
JAM
HRV
FRA
THA
PNG
AUTCHE
LTU
DEU
URY
DNK
ESP
PRT
POL
SWEITA
MUS
IRLUSA
CAN
SVN
NLD
CRI
JPN
NOR
ISR
MNG
GRC
AUSGBR
CZE
FINBEL
NZL
HUNTTO
-2-1
01
2e
( lo
ggd
ppcp
pp
| X )
-6 -4 -2 0 2 4e( democ | X )
coef = .15230767, se = .02270864, t = 6.71

ESNIE May 22, 2008 Sergei Guriev 9
Which way is causality?
Lipset 1959 “Some Social Requisites for Democracy”(plus Lipset 1994)
Democracy is not limited to Judeo-Christianic countries – there are social prerequisites GDP per capita and education Political legitimacy
Lipset credis Aristotle for the argument: Poor cannot responsibly participate in politics, populism
prevails The argument is modeled in Acemoglu-Robinson 2006

ESNIE May 22, 2008 Sergei Guriev 10
Is it important?
Understanding democracy-growth relationship: crucial policy implications “Democracy growth”:
start with democratization delaying democratization would eventually slow down growth
If all the correlation is explained by “High income democracy”:
delay democratization, do other things first:establish rule of law, fight corruption, invest in education etc.
resulting growth will bring democracy anyway
Let’s check the democracy-growth correlations …
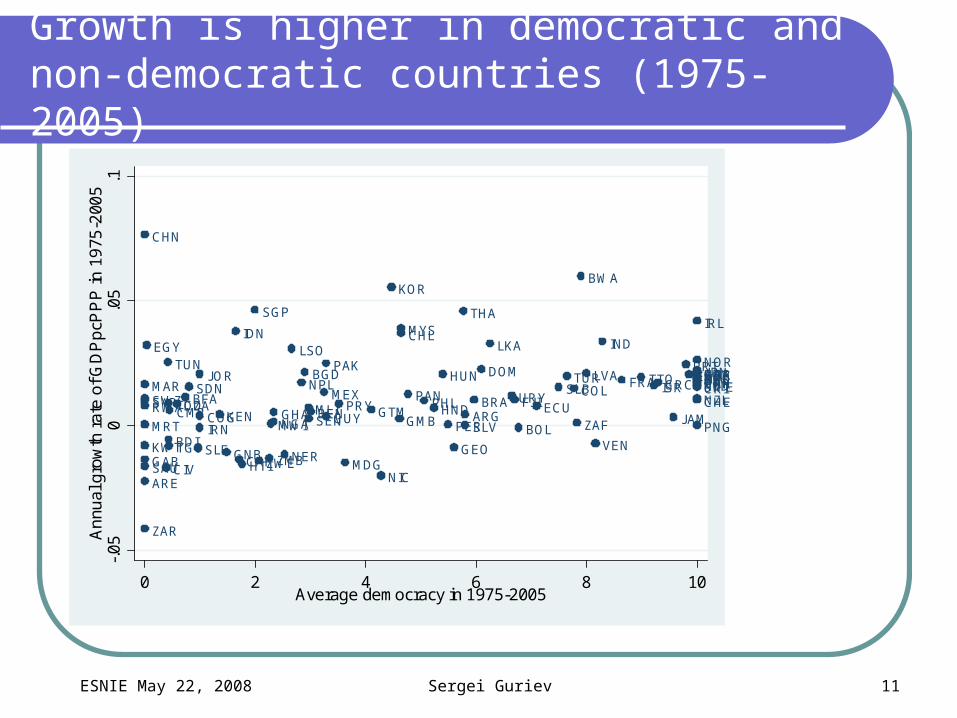
ESNIE May 22, 2008 Sergei Guriev 11
Growth is higher in democratic and non-democratic countries (1975-2005)
ARE
ARG
AUSAUT
BDI
BEL
BENBFA
BGD
BOL
BRA
BWA
CAF
CAN
CHE
CHL
CHN
CIV
CMRCOG
COL CRIDEUDNK
DOM
DZA ECU
EGY
ESPFIN
FJI
FRA
GAB
GBR
GEO
GHA GMB
GNB
GRC
GTMGUYHND
HTI
HUN
IDNIND
IRL
IRN
ISRITA
JAM
JOR JPN
KEN
KOR
KWT
LKALSO
LVAMAR
MDG
MEXMLI
MRT MWI
MYS
NER
NGA
NIC
NLD
NOR
NPLNZL
PAK
PAN
PER
PHL
PNG
PRT
PRYRWA
SAU
SDN
SEN
SGP
SLB
SLE
SLV
SWESWZSYRTCD
TGO
THA
TTOTUN
TUR
URY
USA
VEN
ZAF
ZAR
ZMBZWE
-.05
0.0
5.1
An
nual
gro
wth
ra
te o
f GD
Pp
cPP
P in
19
75-2
005
0 2 4 6 8 10Average democracy in 1975-2005

ESNIE May 22, 2008 Sergei Guriev 12
The correlation between democracy and growth: is statistically and economically significant
SYR
CHN
MRT
MAR
ARE
ZAR
SWZ
GAB
RWA
SAU
KWT
EGY
CIV
TUN
BDI
TCD
TGO
CMRDZABFASDN
SLE
IRN
JOR
COGKEN
GNB
IDN
CAFHTI
SGP
ZWEZMB
MWINGAGHA
NER
LSO
NPLBGD
MLISENBEN
MEX
PAK
GUYPRY
MDG
GTM
NIC
KOR
GMB
MYSCHL
PANPHLHND
HUN
PER
GEO
THA
ARGSLV
BRA
DOM
LKA
URYFJI
BOL
ECUSLB
TURCOL
ZAF
BWA
LVA
VEN
IND
FRATTOISRGRC
JAM
PRTESPITA
IRL
USANOR
CHE
JPNSWEDNKDEUCRIFINAUSGBR
PNG
BELAUT
NZLNLDCAN
-.05
0.0
5.1
e(
gro
wth
7505
| X
)
-5 0 5e( democ_mean | X )
coef = .00158786, (robust) se = .00045341, t = 3.5

ESNIE May 22, 2008 Sergei Guriev 13
… virtually linear …-.
050
.05
.1A
nnu
al g
row
th r
ate
of G
DP
pcP
PP
in 1
975
-200
5
0 2 4 6 8 10Average democracy in 1975-2005
bandwidth = .8
Lowess smoother

ESNIE May 22, 2008 Sergei Guriev 14
Similar correlation with Freedom House’s index of political rights
CHN
SAU
ZAR
BDI
SYR
MRT
TCDRWACMR
TGO
SDN
HTI
DZACOG
CIV
SWZ
TUN
IRN
NER
ARE
CAFGAB
EGY
KENBFA
ZWEGNBSLE
PAK
MWI
IDN
JOR
NGA
KWT
MLIGHABEN
SGP
ZMB
MAR
LSO
PRY
NIC
BGD
MDG
MYSCHL
GTMGMB
PANNPL
SENFJIGUYZAFPER
HUNMEXPHL
TUR
HND
THA
LKA
KOR
SLV
COLECUBRAARGURY
BOL
IND
DOM
PNGJAM
GEOVEN
BWA
SLBISRTTOESPFIN
PRTGRCJPNITA
SWENLDBELAUSCRI
IRL
DNKAUTNORUSA
CHE
FRANZLCANGBRLVADEU
-.05
0.0
5.1
e(
gro
wth
7505
| X
)
-4 -2 0 2 4e( pr_mean | X )
coef = .00337142, (robust) se = .00095875, t = 3.52

ESNIE May 22, 2008 Sergei Guriev 15
… and Freedom House’s civil liberties
SYR
SAU
CHN
SDN
ZAR
BDIIRNMRT
RWACMRTCD
HTI
DZA
TGOGNB
MWI
CAF
COG
NER
ARE
ZWE
SWZKEN
EGY
SLE
IDN
GABCIV
JORTUNPAK
SGP
KWT
MAR
MDGZMB
MLIBEN
MYS
BFA
NGA
LSO
GTMGHA
BGDTURNPL
ZAF
NIC
PRY
LKA
SENSLV
PHL
THA
GMBPER
KOR
MEXCOLPAN
HUN
GUYBRA
INDCHL
BOLHNDARG
ECU
VEN
FJIURY
PNGJAM
DOM
BWA
ISRGRC
GEO
SLBESPTTOFRAITA
PRTJPNFINGBRCRI
BEL
IRL
LVAAUTDNKAUS
CHENLD
NOR
NZL
USASWECANDEU
-.05
0.0
5.1
e(
gro
wth
7505
| X
)
-4 -2 0 2 4e( cl_mean | X )
coef = .00356985, (robust) se = .00108613, t = 3.29

ESNIE May 22, 2008 Sergei Guriev 16
Beyond pairwise correlations: cross-country regressions
Need to control for initial GDP per capita … The result remains the same
… and all other standard determinants of growth in growth regressions
Since early 1990s economists have included democracy scores in cross-country growth regressions.
The results have been inconclusive: Different results for different samples and time periods There is no significant difference in economic performance between
democratic and non-democratic regimes In some specifications, democracy has a non-linear effect on growth
One robust finding: democracy lower volatility of growth Both across and within countries All greatest successes and greatest disasters have been observed in
non-democracies

ESNIE May 22, 2008 Sergei Guriev 17
Many dictatorships that start well then end up growth failures
Many dictatorships are overrated:Castro (despite huge achievements in
healthcare): zero growth in 50 yearsMao: economic disaster “Uzbek growth puzzle”: no puzzlePinochet: bad performance overallGulf countries: almost no growth of GDP per
capita in 30 years

ESNIE May 22, 2008 Sergei Guriev 18
Democracy and volatility of growth (% p.a.) in 1975-2005
IRQ
SOM
MARMMR
CUB
TKM
LAO
ERI
SYR
GNQ
BHR
QAT
OMN
LBY
MRTSWZBTN
GAB
SAU
ARE
UZB
VNMCHN
ZAR
RWA
KWT
EGY
GIN
CIV
AZE
TUN
BDI
TCD
TGOCMR
AGO
DZAUGADJIBFA
KAZ
SDN
LBR
TZA
TJK
SLECOGIRN
YEM
JOR
KGZ
KEN
GNB
IDNCAFHTISGP
ZWE
BLR
KHMZMB
MWI
COM
MOZ
NGAGHA
NER
YUG
LSO
NPLBGD
MLI
SEN
ALB
BEN
ETH
MEX
PAK
GUYPRYMDGROM
HRV
GTM
NIC
BGR
KORGMB
CHL
MYS
MNG
POLPAN
PHL
ARM
HNDHUN
PER
GEO
THA
ARG
SLV
RUS
BRANAM
TMP
DOMLKA
UKR
URYFJI
BOL
MKD
EST
MDA
ECU
SLB
TUR
COLZAFBWA
LBN
LVA
VENSVK
IND
FRA
TTO
ISRGRCJAM
MUS
PRT
ESPBELAUS
CYP
USA
SVN
AUTNORCANCHEIRLCZE
NLD
CRI
PNG
GBRDEUITASWEDNKNZLFINJPN
LTU
-50
510
1520
e( g
dppc
gr_v
ar |
X )
-4 -2 0 2 4 6e( democ_mean | X )
coef = -.31788085, (robust) se = .06735342, t = -4.72

ESNIE May 22, 2008 Sergei Guriev 19
Democracy and volatility of economic growth
Besley-Kudamatsu (2007): distribution of growth rates for democratic and autocratic regimes

ESNIE May 22, 2008 Sergei Guriev 20
An early survey of growth regressions: Przeworski and Limongi 1993

ESNIE May 22, 2008 Sergei Guriev 21
Przeworski and Limongi 1993 Table 1 continued

ESNIE May 22, 2008 Sergei Guriev 22
Barro “Democracy and Growth” 1996
Sample: 81-96 countries 1960-1990 Runs regressions for growth in 65-75, 75-85,
85-90 (using pre-65 as an instrument) Democracy data: Freedom House Democracy is not significant
or has a non-linear effect in the worst dictatorships, increase in democracy
improves growth “too much” democracy results in redistribution to
the majority

ESNIE May 22, 2008 Sergei Guriev 23
Growth democracy
Same authors ran regressions of democracy on GDP per capita
Barro “Determinants of Democracy”, JPE 1999 Sample: 100 countries, 1960-1995 Democracy data: electoral rights and civil liberties, Freedom House Democracy increases with per capita GDP
Book by Przeworski et al. 2000 “Democracy and development” Use binary variable democracy/dictatorship Study all transitions between democracies and dictatorships No significant relationships except
No rich country (richer than Argentina in 1976, about $13K in current dollars) has ever exited democracy

ESNIE May 22, 2008 Sergei Guriev 24
New work: panel data
Rodrik Wacziarg 2005 Control for fixed effects Consider major democratization episodes in 154 countries 1950-
2000 Democratization: Polity IV regime change (3 point increase in
Democ-Autoc) Estimate coefficient on dummies:
NewDemocracy: within 5 years after a democratization (unless there is another regime change)
EstablishedDemocracy: after 5 years DemocraticTransition= NewDemocracy+ EstablishedDemocracy
No evidence on democratization causing short-term slowdown If anything, positive short-term effect

ESNIE May 22, 2008 Sergei Guriev 25
Results

ESNIE May 22, 2008 Sergei Guriev 26
Subsample of 24 countries with one-way democratic transition

ESNIE May 22, 2008 Sergei Guriev 27
Heterogeneity in democracies
Great survey: Besley-Persson in PalgraveProportional vs majoritarian
Higher welfare spending (by 2% GDP!)Via more fragmented party system
Lower accountability, higher corruptionPresidential vs parliamentary
Smaller government (5% GDP!)Effect in established democracies
Term limits

ESNIE May 22, 2008 Sergei Guriev 28
Heterogeneity in non-democracies
Much less is known for non-democracies: data availability constrain empirical work
Besley Kudamatsu: Detailed case studies Successful autocracies have institutionalized selectorate (e.g.
parties), less personalistic, hence more accountable Egorov-Sonin theoretical work
Choice of incompetent viziers Multiple equilibria in the succession game
Egorov-Guriev-Sonin A theory of partial media freedom in non-democratic
economies Evidence: natural resources lower media freedom

ESNIE May 22, 2008 Sergei Guriev 29
Leadership change in autocracies vs. democracies
Effect of leadership change on the economy is hard to study because of reverse causality
Only recently, innovative empirical work Following corporate finance literature
Effect of an unexpected death of CEO on the stock price Fisman et al.:
Suharto’s health problemsmarket downgrades stock of Suharto-connected firms
No such effect for Cheney Jones, Olken:
Unexpected death of leader in dictatorial regimes causes positive growth (1.5%!)
But no such effect in the democracies Besley-Kudamatsu:
Leadership turnover is higher in successful autocracies Unexpected death exposes the degree of institutionalization of
selectorate

ESNIE May 22, 2008 Sergei Guriev 30
Persson-Tabellini 2007
Basic idea: correct counterfactual! Apply diff-in-diff+matching (widely used in
applied microeconomics) Estimate the regime change propensity score
(probability of leaving democracy as a function of observable variables)
Compare growth experiences of countries with similar propensity scores
Data: 1960-2000, democracy from Polity IV Why has it not been done before?
Unlike labor economics, small dataset, hence loss of efficiency is important!

ESNIE May 22, 2008 Sergei Guriev 31
Results
[first stage: consistent with Przeworski, autocratic transitions less likely in rich countries]
Democratic transitions raise growth by 1 percentage point per year
Autocratic transitions decrease growth by 2 percentage points per year
Taking into account the length of transition period, democracy should be richer than autocracy by 45%!

ESNIE May 22, 2008 Sergei Guriev 32
Democratic transitions would increase growth

ESNIE May 22, 2008 Sergei Guriev 33
Autocratic transitions would slow down growth

ESNIE May 22, 2008 Sergei Guriev 34
Durnev-Guriev
Institutions affect aggregate growth Weak property rights low investment, low growth
This paper: microeconomics of the effect of weak property rights on growth
The channel: weak property rights lower corporate transparency low growth
Methodology: difference-in-difference Consider industries that are more vulnerable to expropriation In countries with weaker property rights …
… and in periods when expropriation is more likely … firms in these industries (controlling for industry, country, year fixed effects) are less transparent …
… and these industries have lower growth

ESNIE May 22, 2008 Sergei Guriev 35
Empirical design
Profits in oil and gas industries depend on oil prices (which is exogenous)
When oil price is high, profit is a rent that is easier to expropriate Corporations face a trade-off: high transparency is good for
business but may result in expropriation Result: when oil price is high, corporations in oil and gas industry
– in countries with weaker property rights – are less transparent (controlling for fixed effects for industry, country, year) This results in lower investment and growth
Same for industries “similar to oil industries” Same results when measure “weak property rights” by Polity IV’s
Autocracy

ESNIE May 22, 2008 Sergei Guriev 36
Differential opacity of oil and gas extraction industries relative to other industries plotted against country predation index
UK
New Zealand
Sweden
Singapore
Australia
Canada
Hong Kong
Norway
US
Japan
Germany
Chile
France
Belgium
Taiwan
Korea
Spain
Israel
Greece
ThailandMalaysia
Italy
Argentina
Turkey
South Africa
PhilippinesIndia
China
Pakistan
Indonesia
Russia
-.05
0.0
5.1
diff
ere
ntia
l opa
city
of o
il a
nd g
as e
xtra
ctio
n in
dus
trie
s
0 2 4 6 8country predation index

ESNIE May 22, 2008 Sergei Guriev 37
Conclusions
The “democracy-growth” debate is far from over In particular, no clear results emerge from
cross-country regressionsRecent research is using new methods
Results are more consistent with “democracy is good for growth”