esnie european school on new institutional economics institut d’etudes scientifiques de cargèse...
Post on 21-Dec-2015
214 views
TRANSCRIPT

ESNIE European School on New Institutional Economics
Institut d’Etudes Scientifiques de Cargèse
21 May 2008Hans-Bernd Schäfer
Rule of Law and Economic Growth

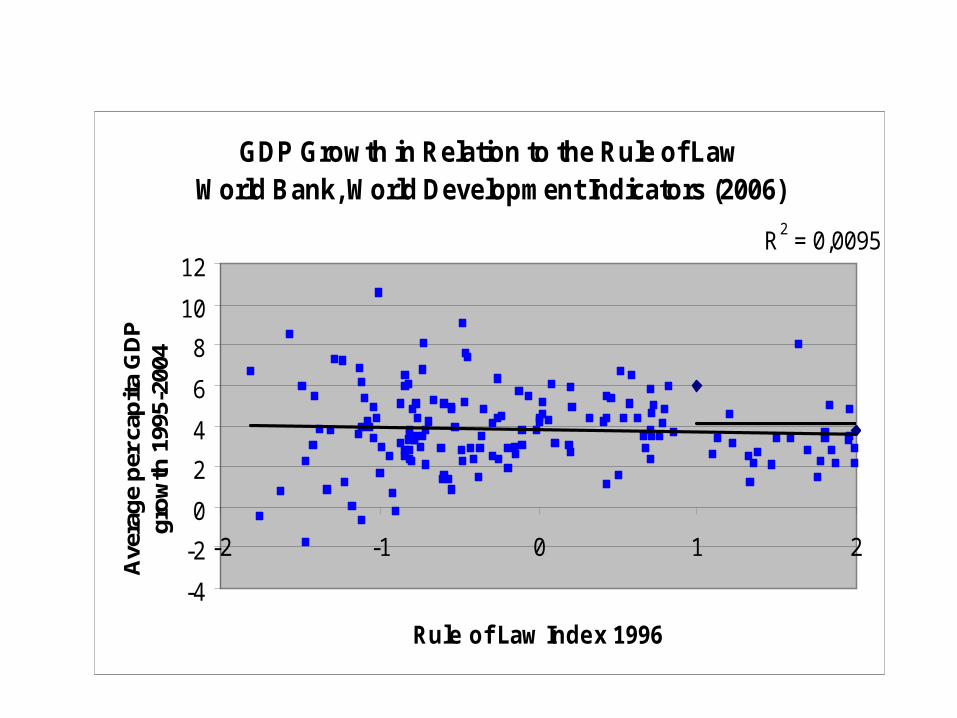
GDP Growth in Relation to the Rule of Law World Bank, World Development Indicators (2006)
R2 = 0,0095
-4
-2
0
2
4
6
8
10
12
-2 -1 0 1 2
Rule of Law Index 1996
Ave
rag
e p
er c
apit
a G
DP
g
row
th 1
995-
2004

Law and the Poverty of Nations
Capital accumulation explains 30-35% of per capita growth Barro (1997), Hall/Jones 1999), Easterly (2001), Acemoglu/Johnson et. al (2003)
Factor mobilisation explains growth in few countries Investment in human capital explains little of growthGood institutions which protect property rights and
contracts are crucial for growth (Rodrick/Subramanian/Trebbi 2004) Glaeser/Laporta/Silanes 2004)

“Countries with corrupt government officials, severe impediments to trade, poor contract enforcement, and government interference in production will be unable to achieve levels of output per worker anywhere near the norms of western Europe, Northern America, and Eastern Asia”.
Hall/Jones 1999 „QJE

0
5
10
15
20
25
30
Middle income Low income High income OECD
Fig. Gross national savings (% of GNI) 1970-2003 World Development Indicators 2005

Capital Stock per Capita vs.Capital Output Ratio 1980ies (Data from King/Levine 1994)
129 Countries
0
1
1
2
2
3
3
4
4
5
0 10000 20000 30000 40000 50000 60000
Capital Stock per Capita
Cap
ital
Ou
tpu
t R
atio
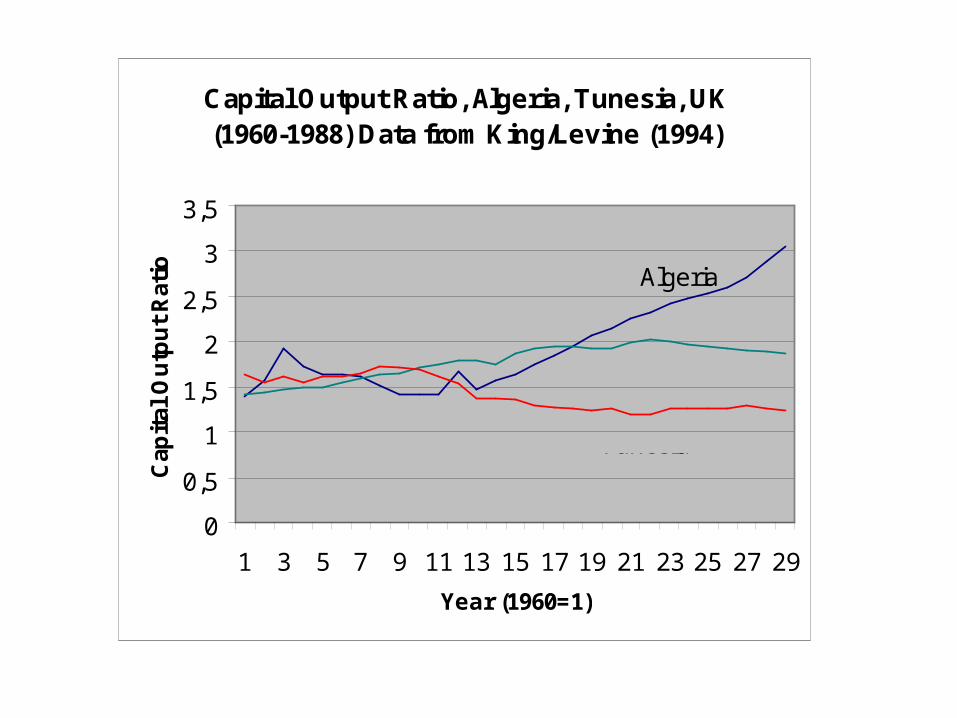
Capital Output Ratio, Algeria, Tunesia, UK (1960-1988) Data from King/Levine (1994)
0
0,5
1
1,5
2
2,5
3
3,5
1 3 5 7 9 11 13 15 17 19 21 23 25 27 29
Year (1960=1)
Cap
ital
Ou
tpu
t R
atio Algeria
UK
Tunesia
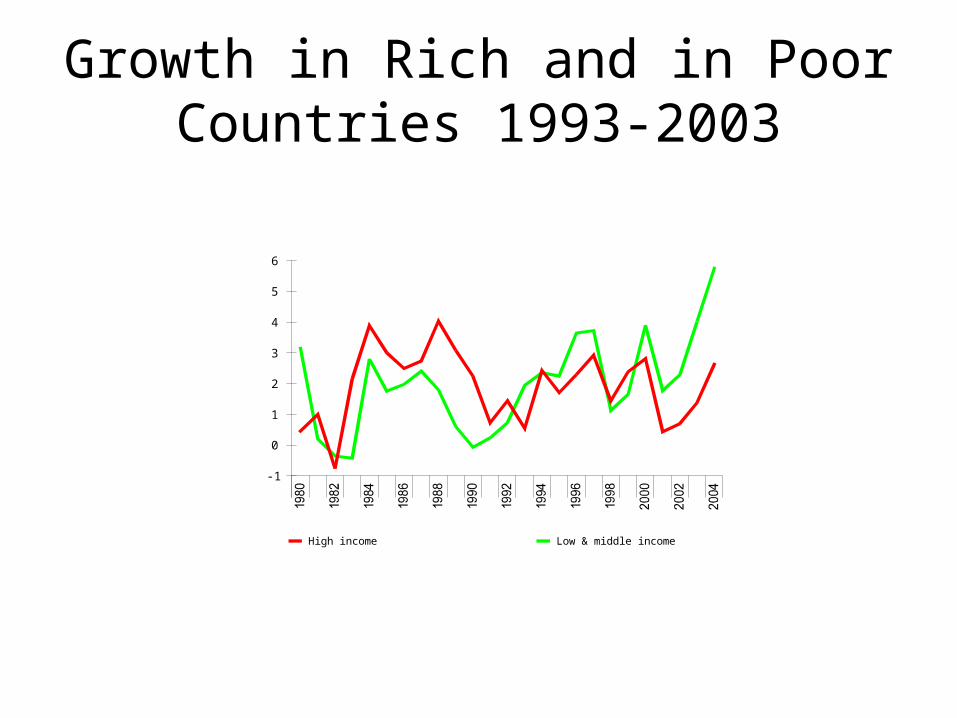
Growth in Rich and in Poor Countries 1993-2003
-1
0
1
2
3
4
5
6
High income Low & middle income
GDP per capita growth (annual %)

State Led Growth
Nationalization of key industries including banks and insurance companies
Price distortions
Import Substitution
Planning, Industrial Policy

“The most important change in state policies in underdeveloped countries is the common
understanding that they should each and all have a national economic development policy…Indeed it is also universally urged that each of them should
have an overall, integrated national plan. All underdeveloped countries are now attempting to
provide themselves with such a plan, except a few that have not yet been reached by the Great
Awakening.
Gunnar Myrdal 1957

Washington Consensus (around 1980)
• Liberalization
• Privatization
• Free international trade, free international capital movements
• Macroeconomic stabilization (low inflation)
• (J. Williamson 1993)

Low Growth High Growth
Argentina -3,5 Albania 122,3
Brazil 6,5 Botswana 38,1
Congo, Rep.of -32,5 Chile 38,9
Cote DÕIvoir -3,2 China 133,2
Ecuador -2,6 Cyprus 45,2
Gabon 3,6 Finland 41,6
Honduras -1,3 Hungary 36,4
Nicaragua 4,6 India 55,4
Niger -4,2 Ireland 97,8
Papua New Guinea 0,5 Korea, Rep. of 54,4
Paraguay -9,9 Malaysia 46,6
Sierra Leone -21,6 Poland 50,3
Uganda -11,8 Slovenia 45,1
Ukraine -11,8 Taiwan 46,9
Zimbabwe -20,7
Source: Calculated from Penn World Ta bles 6.2 , 2000
Accumulated Growth of Per Capita GDP in Per Cent in Selected Countries from 1993 to 2003

GDP per Capita in Eastern Europe (population
weighted averages)
0
1000
2000
3000
4000
5000
6000
1990
1992
1994
1996
1998
2000
2002
2004
GD
P p
er c
apit
a (U
S$)
8 new EU
members in 2004
12 non-EU post-
Soviet countries

Source: Word Development Indicators 2006
1.000
1.500
2.000
2.500
3.000
1989
1991
1993
1995
1997
1999
2001
2003
Year
GD
P p
er c
apita
(con
stan
t 20
00 U
S$) Russian
Federation
Shock Therapy in Russia

GDP in Central European Countries 1990-2004 (World Development Indicators 2006)
2.000
3.000
4.000
5.000
6.000
7.000
1990
1992
1994
1996
1998
2000
2002
2004
US
Do
lla
rs (
20
00
)
Czech Republic
Hungary
Poland

Source: Word Development Indicators 2006
2.000
2.500
3.000
3.500
4.000
1965
1969
1973
1977
1981
1985
1989
1993
1997
2001
Year
GD
P p
er c
apit
a (c
on
stan
t 20
00 U
S$)
Latin America& Caribbean
Stagnation in Latin America
A shift from import substitution policy to free international trade implies a decline of import
substituting industries and intends rapid growth of export-oriented industries. If however capital
markets are imperfect and intellectual property rights are not protected, expanding becomes
difficult. In many Latin American countries “numerous small and middle enterprises have
been forced to close down, in many cases not as a result of their long-term inefficiency, but as a
consequence of imperfect factor markets which precluded their access to long-term finance, engineering and managerial know-how[1]”.
[1] J. Katz (2000),

0
2.000
4.000
6.000
8.000
10.000
12.000
14.000
Year
Rea
l GD
P p
er c
apit
a
Argentina
Brazil
Chile
Mexico

GNP in Arab Countries (from World Development Indicators 2007)
60
80
100
120
140
160
180
GN
P pe
r cap
ita (1
986=
100) Arab countries (oil)
Arab countries (Non-oil)
Low income countries

Source: Word Development Indicators 2006
0
100
200
300
400
500
600
1965
1968
1971
1974
1977
1980
1983
1986
1989
1992
1995
1998
2001
2004
Year
GDP
per
cap
ita (c
onst
ant
2000
US$
)
India
Source: Word Development Indicators 2006
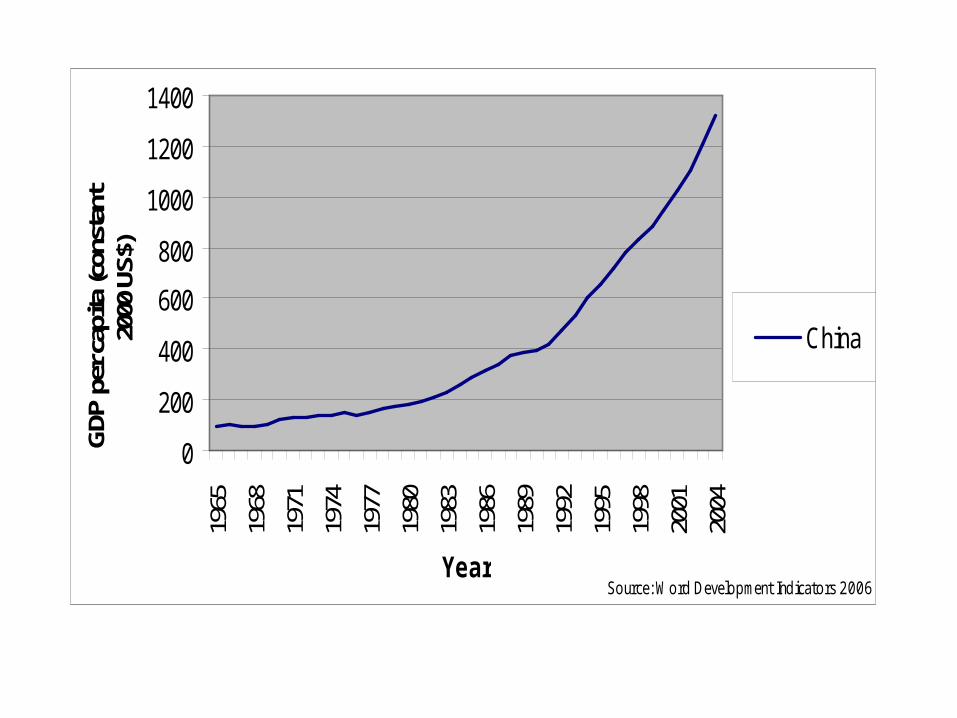
0
200
400
600
800
1000
1200
1400
1965
1968
1971
1974
1977
1980
1983
1986
1989
1992
1995
1998
2001
2004
Year
GDP
per
cap
ita (c
onst
ant
2000
US$
)
China

Source: Word Development Indicators 2006
400
450
500
550
600
1965
1969
1973
1977
1981
1985
1989
1993
1997
2001
Year
GD
P p
er c
apita
(con
stan
t 20
00 U
S$)
Sub-SaharanAfrica

“The cross-national literature has been unable to establish a strong causal link between any particular design feature of institutions and
economic growth. We know that growth happens when investors feel secure, but we have no idea
what specific institutional blueprints will make them feel more secure in a given context. The literature
gives us no hint as to what the right levers are. Institutional function does not uniquely determine
institutional form.”[1]
[1] D. Rodrick (2006)
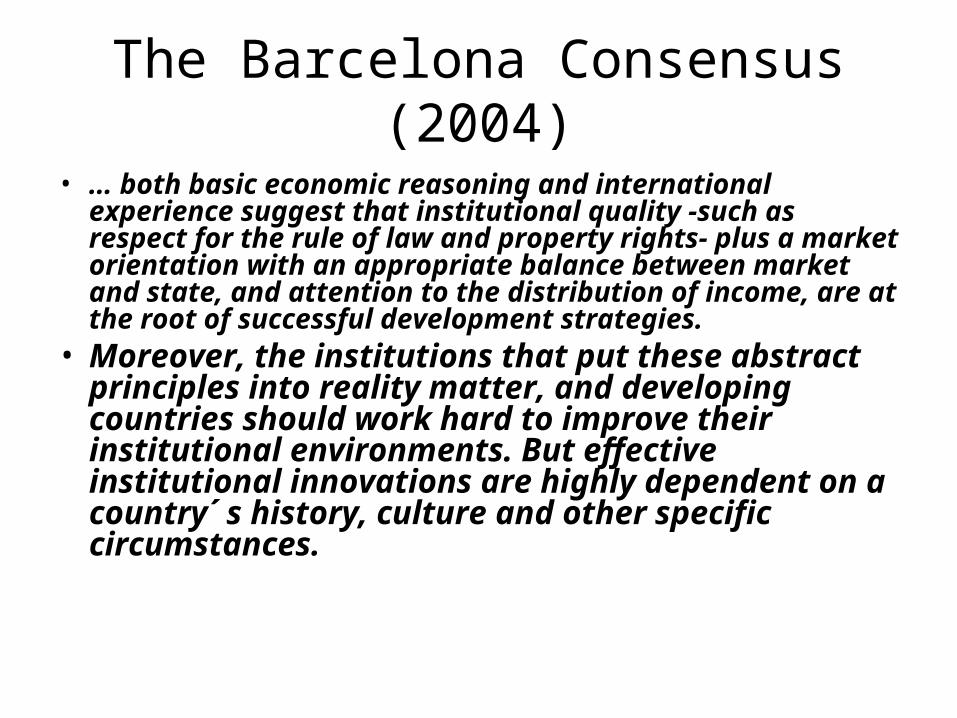
The Barcelona Consensus (2004)
• … both basic economic reasoning and international experience suggest that institutional quality -such as respect for the rule of law and property rights- plus a market orientation with an appropriate balance between market and state, and attention to the distribution of income, are at the root of successful development strategies.
• Moreover, the institutions that put these abstract principles into reality matter, and developing countries should work hard to improve their institutional environments. But effective institutional innovations are highly dependent on a country´ s history, culture and other specific circumstances.

What Makes Law Reform so difficult?
• Why do people with power accept limits to their power? An even more pointed formulation is: why do people with guns obey people without guns? An economic twist is: why would the rich even voluntarily part with a portion of their wealth? In legal theory, the parallel question runs: why do politicians sometimes hand over power to judges? Why do politicians allow judges, who control neither purse nor sword, to overturn and obstruct their decisions and sometimes even send office holders to jail?...Societies may approximate the rule of law if they consist of a large number of power wielding groups, compromising a majority of the population, and if none of them becomes so strong as to be able thoroughly to dominate the others. We may be able to loosen the grip of a few organized interests on power by forcing them to share political leverage with a variety of other groups. This is polyarchie; it is also rough justice, the only kind human beings will ever experience. Formulated differently, the balancing of many partialities is the closest we can come to impartiality. This may not sound particularly ideal, but it is nevertheless historically quite rare and very difficult to achieve.[1]
•[1] S. Holmes, Lineages of the Rule of Law” (2003)

Neglect of finance and corporate governance in development economics
What matters most
1. Property
2. Finance and corporate governance
3. Contract
4. Torts

0
20
40
60
80
100
120
140
160
180
Middle income Low income High income OECD
Fig. Domestic credit to private sector (% of GDP) 1970-2003From World Development Indicators 2005

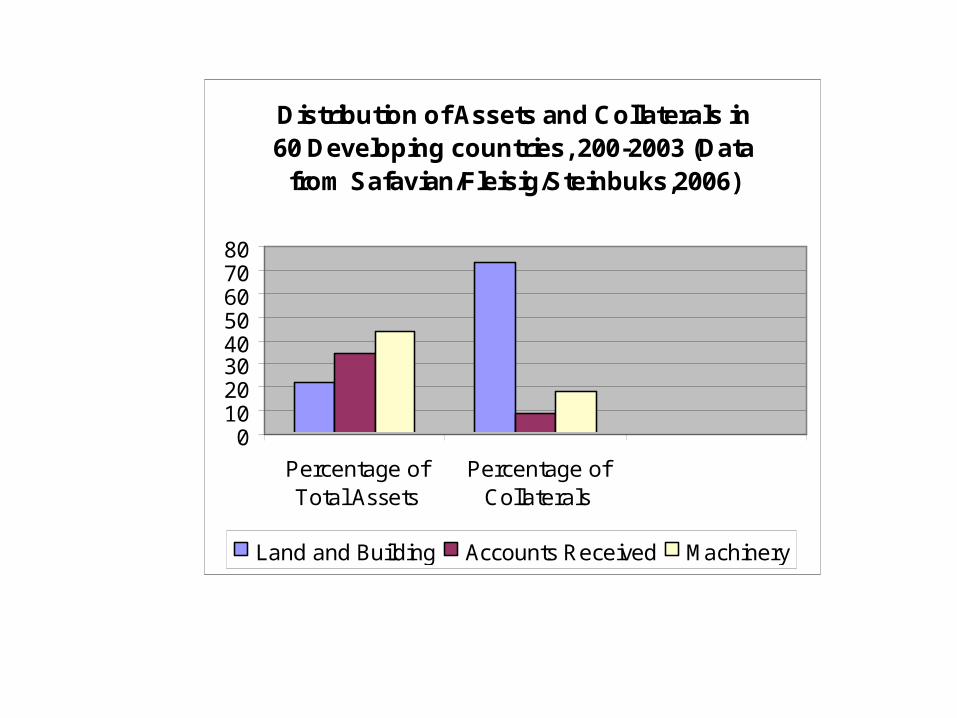
Distribution of Assets and Collaterals in 60 Developing countries, 200-2003 (Data
from Safavian/Fleisig/Steinbuks,2006)
01020304050607080
Percentage ofTotal Assets
Percentage ofCollaterals
Land and Building Accounts Received Machinery

0
5000
10000
15000
20000
25000
30000
35000
High income Low & middle income
Market capitalization of listed companies (current US$) (bill) Data from World Dev. Indicators, 2005

0
100
200
300
400
500
600
700
China India Russian Federation
Market capitalization of listed companies (current US$) (bill)Data from World Dev. Indicators 2005
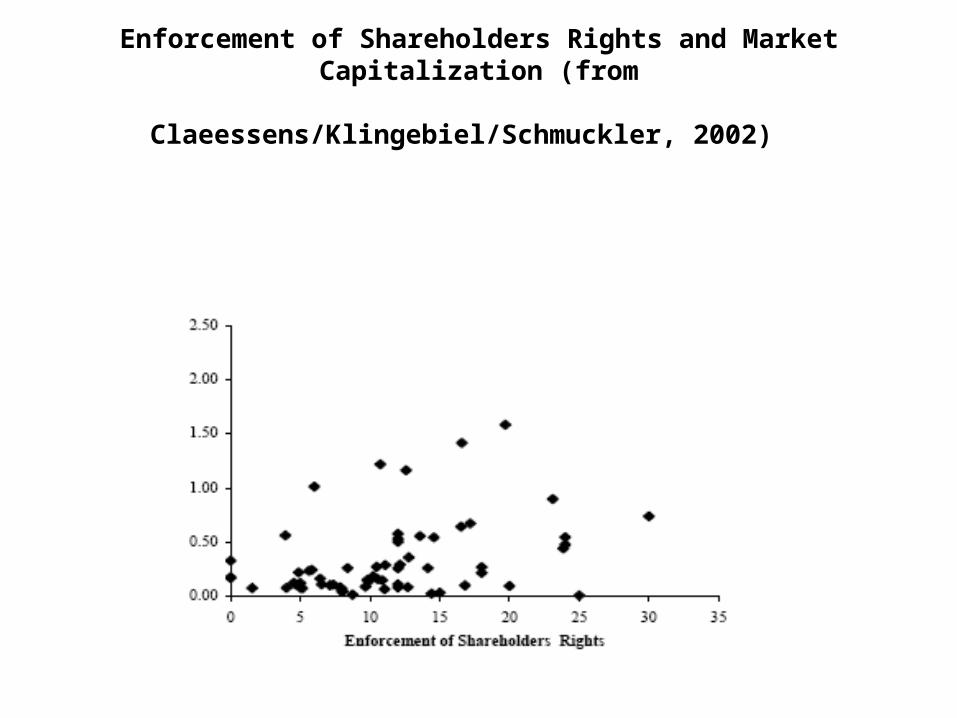
Enforcement of Shareholders Rights and Market Capitalization
(from Claeessens/Klingebiel/Schmuckler, 2002)

Value of control-block votes in relation to rule of law
ItalyKorea (Rep.)
Czech Republic
South Africa
Mexico
Brazil Australia
France
Chile
Hong Kong
UK
0
10
20
30
40
50
60
70
-1 -0,5 0 0,5 1 1,5 2 2,5
Rule of Law Index, 1998
Val
ue
of c
on
tro
l-blo
ck v
ote
s/F
irm
V
alu
e in
%

Widely held Family State
Argentina 0 65 15
Hong Kong 10 70 5
Mexico 0 100 0
Singapore 15 30 45
South Korea 55 20 15
France 60 20 15
Germany 50 10 25
Italy 20 15 40
UK 100 0 0
USA 80 20 0

The ex-post and ex-ante approach to corporate governance
Regulation vs. Civil liability
Rules versus Standards
Qualification and loyalty of judges
(Black, R. Kraakman, and J. Hay, 1996)

Crosslisting
The institutional element of cross listing „rent a regulator“
The increasing number of cross listed companies in developing countries
Cross listing and share prices (Karyoli 1998
Reese/Weisbach, Didenko 2005)

Large barriers to entry and to exit in developing countries
-Licensing laws-overregulation -labor relations -dismissal,-bancruptcy procedure, -establishing a firm-tax law
Consequence: development of a large informal sector which evades law altogether
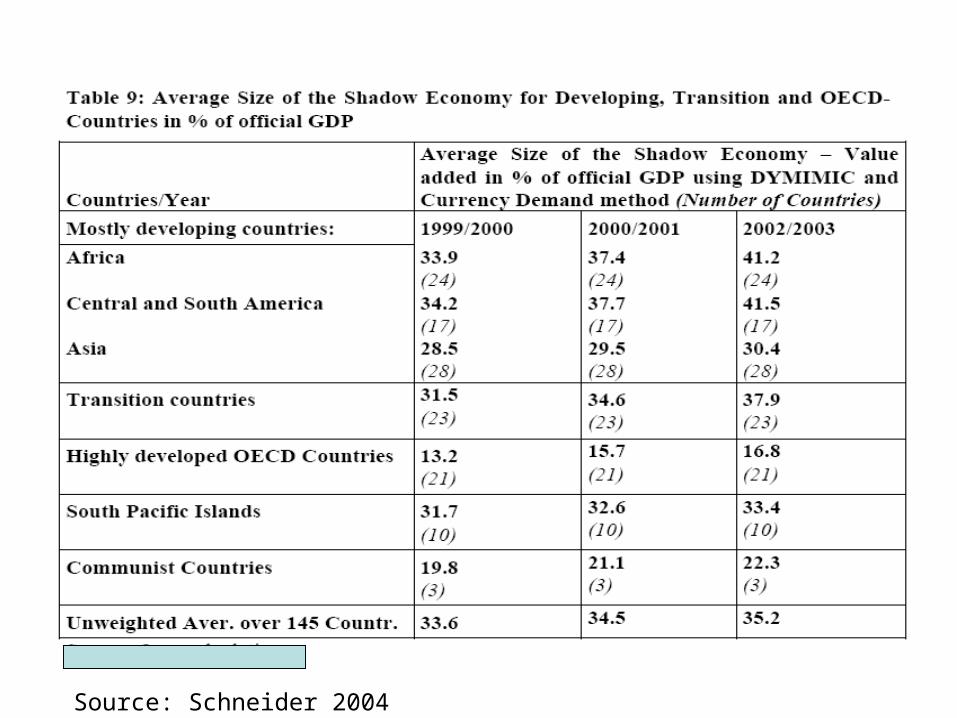
Source: Schneider 2004