polony sequencing: a dna sequencing technology and
TRANSCRIPT
Polony Sequencing: a DNA Sequencing Technologyand
A Computational Analysis Reveals Chromosomal Domains ofGene Expression
Robi David Mitra
B.S., M.S., Electrical EngineeringMassachusetts Institute of Technology, 1993
Submitted to the Department of Electrical Engineering and Computer ScienceIn Partial Fulfillment of the Requirements for the Degree of
Doctor of Philosophy in Electrical Engineering
at the
Massachusetts Institute of TechnologyAugust 2000
© 2000 by Robi David MitraAll rights reserved
7e aft heeby 0, nts to MTPennrtlon to reaprixtueu and to
a PAlcy paper cxd6kectronCWO Woe of t the*i
WWIa - AWhx or in Pat
Signature of A uthor ......................... .. .................... ..............Department of Electrical Engineering and Computer Science
August 30, 2000
Certified by
Certified by
George M. ChurchLI - Department of Genetics, Harvard University
Thesis Supervisor
............................... .- %.. . .... ..Tomas Lozan -Perez
Department of Ele trical F nineerin and-Computer cience7 -, Thesis~nnervisor
Accepted by ......
MASSACHUSETTS INSTITUTEOF TECHNOLOGY
OCT 2 3 2000
LIBRARIES
Department of
BARKER
Arth'r C. SmithChairman, Committee on Graduate Students
Electrical Engineering and Computer Science
I
-ii
Polony Sequencing: a DNA Sequencing Technologyand
A Computational Analysis Reveals Chromosomal Domains ofGene Expression
Robi David Mitra
Submitted to the Department of Electrical Engineering and Computer ScienceIn Partial Fulfillment of the Requirements for the Degree of
Doctor of Philosophy in Electrical Engineering
Abstract
The first part of this thesis describes the development of polony sequencing, a sequencingtechnology in which DNA is cloned, amplified and sequenced in a polymer matrix. Acomplex library of one to ten million linear DNA molecules is amplified by performingpolymerase chain reaction (PCR) in a thin polyacrylamide film poured on a glassmicroscope slide. The polyacrylamide matrix retards the diffusion of the DNA moleculesso that each amplification product remains localized near its parent molecule. At the endof the reaction, a number of polymerase colonies, or "polonies", have formed, each onegrown from a single template molecule. As many as 5 million clones can be amplified inparallel on a single slide. By including an acrydite modification at the 5' end of one ofthe PCR primers, the amplified DNA will be covalently attached to the polyacrylamidematrix, allowing further enzymatic manipulations to be performed on all clonessimultaneously. Also described in this thesis is my progress in development of a protocolto sequence the polonies by repeated cycles of extension with fluorescentdeoxynucleotide. Because polony sequencing is inherently parallel, and sub-picolitervolumes are used for each reaction, the technology should be substantially faster andcheaper than existing methods. Applications for polony sequencing such as geneexpression analysis, SNP discovery, and SNP screening will also be discussed.
The second part of this thesis describes a computational analysis that tests the hypothesisthat chromosomal position affects gene expression. It is shown that, throughout thegenome, genes lying close together on the same chromosome often show significantcoexpression. This coexpression is independent of the orientation of genes to each other,but is dependent on the distance between genes. In several cases where adjacent genesshow highly correlated expression, the promoter of only one of the genes contains anupstream activating sequence (UAS) known to be associated with the expression pattern.These results suggest that in certain regions of the genome a single transcription factorbinding site may regulate several genes. It is also shown that evolution may takeadvantage of this phenomenon by keeping genes with similar functions in adjacentpositions along the chromosomes. The techniques that are presented provide acomputational method to delineate the locations of chromosomal domains and identifythe boundary elements that flank them.
2

Acknowledgements
My experiences as a graduate student have been, at various times, exciting,
frustrating, confusing, humbling, and rewarding. I have lived in 2 states, performed
research at five institutions, and become indebted to a large number of people who have
helped me along the way.
I was introduced to the wonders of biology rather late in life when, as a second
year graduate student in electrical engineering, I took an introductory biology course
taught by Eric Lander and Nancy Hopkins. I was captivated, believing the field was (and
is) undergoing a revolution, and I wanted to contribute whatever I could to the cause.
Soon after, I joined the lab of Doug Youvan, a biochemist at MIT, who then moved his
lab to California. It was Simon Delagrave, a graduate student under Doug, who taught
me the basics of molecular biology. Anthony Davies and Rachael Hawtin continued my
education in biology. I'd also like to thank them for their advice, support, and friendship
during my time in California. I would like to thank Bob Balint and Jim Larrick for
allowing me to work in their lab when Doug left academia.
The decision to leave California and return to Boston was a difficult one to make,
as it meant starting another thesis project. In retrospect, this was the right decision, and it
was Tomas Lozano-Perez and Martha Gray who first recommended this course of action.
Both Tomas and Martha are also on my thesis advisory committee and have provided me
with invaluable advice and support. I'd also like to thank Nancy Hopkins, who served on
my committee until last year, and Paul Matsudaira who replaced her on short notice.
Upon returning to Boston, I joined the laboratory of George Church. George has
been an incredible mentor and advisor. Not only did he have the idea for polonies, which
3

is the basis for much of my thesis, but my interactions with him have greatly shaped the
way I approach science. In addition to being a visionary scientist, he is one of those rare
people who are just genuinely nice, and I consider myself lucky to have crossed paths
with him. George has also assembled a wonderful group of people to work in his lab. I
would like to thank Dereth Phillips, whom I shared a bay with when I first arrived in the
Church lab. She made me feel welcome and was always available to share a joke, give
advice or grab a cup of coffee. Barak Cohen and I collaborated on a research project that
is described in chapter 4 of my thesis. It was a pleasure working with him, as he is an
excellent biologist and scientist. Jason Hughes was also a collaborator on the research
described in chapter 4, providing the idea for the chromosome correlation maps and
adding statistical rigor to our work. I thank Nikos Reppas and Avi Kogan who made
DNA libraries for the polony sequencing project.
John Aach has been very helpful throughout my stay in the Church lab. He
created one of the early model of polony growth that was very informative. In addition
he has been the first person I went to for advice on mathematical and statistical problems
that arose. Martin Steffen has been a source of enthusiasm, motivation, and ideas. I
really enjoyed working with him when we were trying to create acrylamide islands using
a piezoelectric spotter. It's been great working with Saeed Tavazoie these past three
years, and he has given me good advice. Other lab members such as Martha Bulyk,
Jeremy Edwards, Paula Ragan, Pam Ralston, Allegra Petti, Abby Mcguire, Chris
Harbison, Priya Sudarsanam, Jason Johnson, Fritz Roth, Vasu Badarinarayana, Tzachi
Pipel, Felix Lam, Xiaohua Huang, Pete Estep, Adnan Derti, and Doug Selinger have
provided useful advice on my projects, read my manuscripts, and become my friends.
4

Wayne Rindone has provide valuable bioinformatics support. I am also grateful to
Aimee Dudley, who taught me about transcription, and helped make two of the figures in
this thesis. Phil Juels has been fantastic at keeping my computer running and the network
up.
I'd like to thank Britta Singer who shared with me her protocols and three of the
SELEX libraries that she made with me. I'd also like to thank David Duffy, who I
collaborated with to make acrylamide islands using discontinuous dewetting, a procedure
that he and Rebecca Jackman pioneered. Phil Busby, a chemist at NEN, deserves thanks
for synthesizing a fluorescently labeled nucleotide with a disulfide linker that is described
in chapter 4 of my thesis. Bo Gu at Resonetics coordinated my experiments with laser
micromachining. I thank Nevin Summers for creating the cost analysis figure presented
in Appendix B. I'd like to thank Bill Coleman for being such a good buddy for all these
years.
Finally, I'd like to thank my family. My wife Tali, has been incredibly patient,
understanding and loving throughout this whole graduate school process. There were
times when working on my thesis meant I couldn't spend time with her, but I hope she
knows that she is much more important to me than any of the work presented here. My
sister Debi and my brothers Roni and Rajat have provide me with support, advice and
comic relief during my graduate school career. I would like to thank my mother Lynn
and my father Sumanta, without whom none of this would be possible. Anytime I have
found myself struggling, my mother has always been there, giving her support and love.
I cannot thank her enough for all she has done for me. My father has been an inspiration
5

to me. I have tried to follow his example of hard work and persistence as best I could. I
love both my parents very much.
6

Chapter 1
Introduction
7
This thesis is divided into two parts describing two independent research projects.
The first part describes the development of polony sequencing, a new DNA sequencing
technology that has the potential to be faster and cheaper than current methods.
Background information and an overview of this technology are presented in the first half
of this introduction, and the research itself is described in chapters two and three. The
second part of this thesis describes a computational analysis of whole-genome expression
data that was focused on identifying chromosome domains that influence transcription.
Background information for this project can be found in the second half of this
introduction, and the results of this work are presented in chapter four of this thesis.
Polony sequencing
Polony sequencing is a new sequencing technology in which DNA is cloned,
amplified, and sequenced in a thin polyacrylamide film attached to a glass microscope
slide. We estimate that five million individual reactions will be performed in parallel on
a single slide, so that sequencing can be performed rapidly and inexpensively. This
section provides background information on polony sequencing, gives a general overview
of how the technology works, and summarizes my progress in its development.
Rationale and Motivation
The complete sequence of the human genome will be determined by the year
2000; however, this accomplishment will not cause a decrease in the demand for DNA
sequencing. In fact, the use of DNA sequencing techniques is expected to grow
dramatically over the next decades, particularly if the cost for sequence data can be
8
significantly reduced. A fast, inexpensive DNA sequencing technology such as polony
sequencing could find applications in at least five important areas:
1. De novo sequencing. The number of completely sequenced genomes now
exceeds 100, but it will be important to continue to sequence the genomes of other
organisms, both to further our biological knowledge of the organism in question and to
enable sequence comparison between multiple genomes. This type of comparative
genomic approach has already been successfully used to annotate exons (1-3), discover
sequences that regulate gene expression(4), and assign function to genes(5-9). This
approach will become considerably more powerful as more genomes are sequenced.
2. Resequencing genomes. Resequencing human genomes will allow
researchers to discover common single nucleotide polymorphisms (SNPs) as well as
other types of genetic variations, such as deletions or rearrangements, which can then be
correlated with disease phenotypes(10). Also, resequencing the genomes of microbial
pathogens to assess genetic variation will lead to a better understanding of the
mechanisms of antibiotic resistance and pathogenesis.
3. Single Nucleotide Polymorphism (SNP) screening. Once a large number of
SNPs have been discovered, either by resequencing genomes using polony sequencing or
by other methods, polony sequencing could be used to rapidly and inexpensively screen
for these SNPs. Rather than resequence a patient's entire genome, it will be more cost
effective to first reduce the complexity of the sample by enriching for only the DNA near
the identified SNPs. This could be done by hybridizing genomic DNA to immobilized
oligonucleotides, and then sequencing this enriched population of DNA.
9
4. Whole-genome mRNA abundance measurements. Velculescu reported the
sequencing of short cDNA tags to determine the expression level of different genes
present in a cell(1 1-13). This serial analysis of gene expression (SAGE) technique has
several advantages over the "DNA chip" approach(14,15)for quantifying mRNA
expression: the technique is free from cross-hybridization artifacts, the dynamic range is
limited only by the rate at which one can sequence DNA, one determines the exact
number of mRNA molecules present per cell (rather than a ratio of mRNA levels in two
conditions), and one can discover previously unsequenced genes with this approach.
5. Readout for genetic selections or screens. Significant improvements in DNA
sequencing technology could change the way researchers design genetic screens. For
example, the two-hybrid system(16) commonly looks for protein-protein interactions by
screening a bait protein against a cDNA library to find all proteins in the library that
interact with the bait. However, if the cost of sequencing was to be reduced, one could
envision rapidly screening a cDNA library versus another library to find all possible
protein-protein interactions. (This is actually being done for yeast (17), but it is quite a
large, labor intensive project). Other common genetic screens such as mutagenesis and
suppressor screens would also benefit from faster sequencing technology.
Technology Overview
Polony sequencing consists of amplifying large numbers of individual DNA
molecules which are covalently attached to a polyacrylamide gel, and then sequencing
this amplified DNA directly in the polyacrylamide by serial extension with a single
deoxynucleotide. A detailed description of polony sequencing is provided below.
10
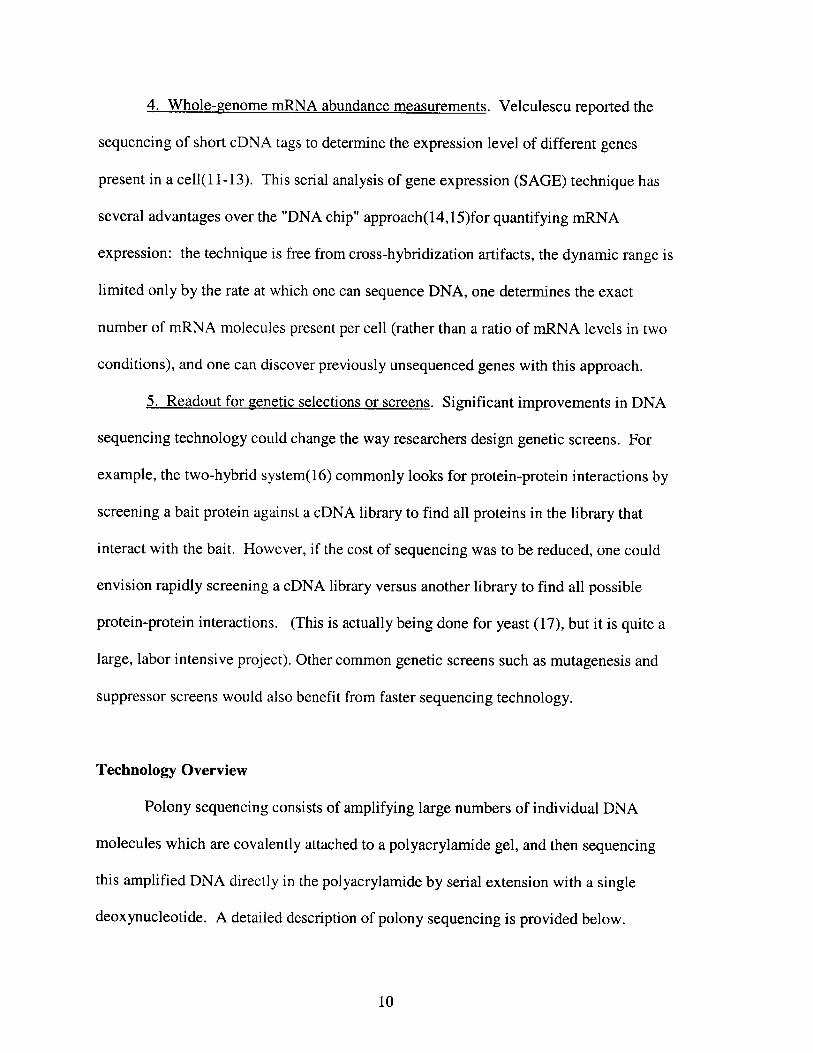
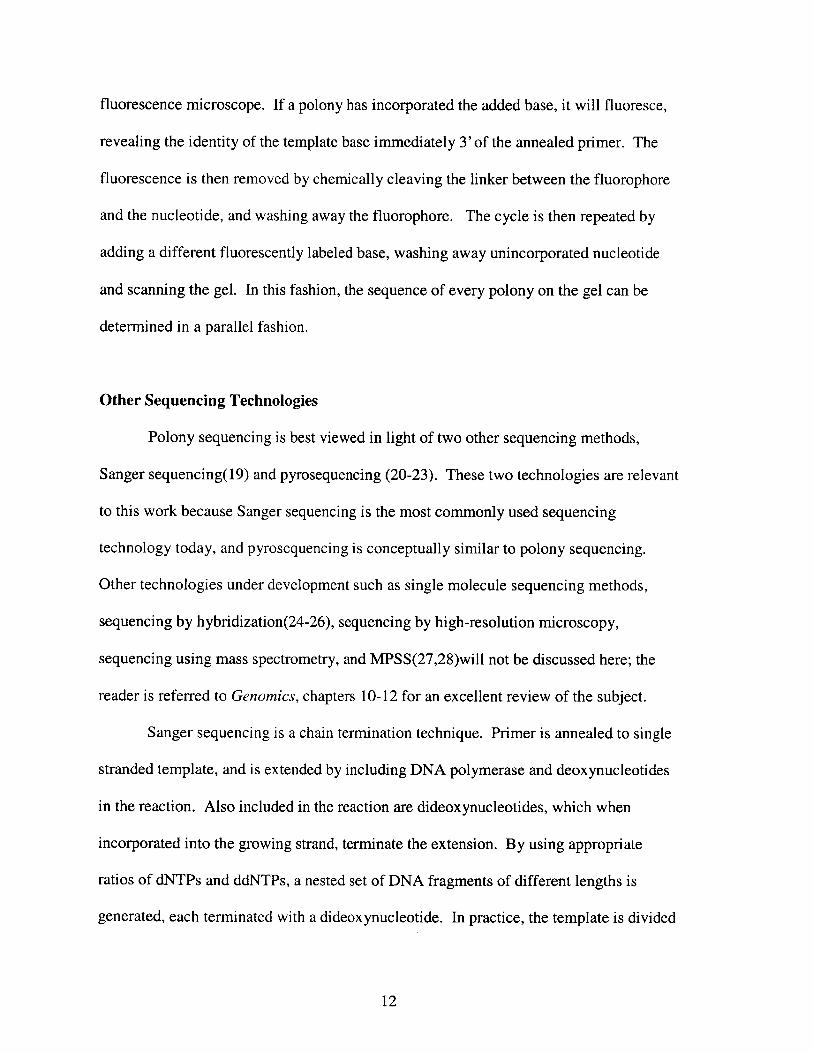
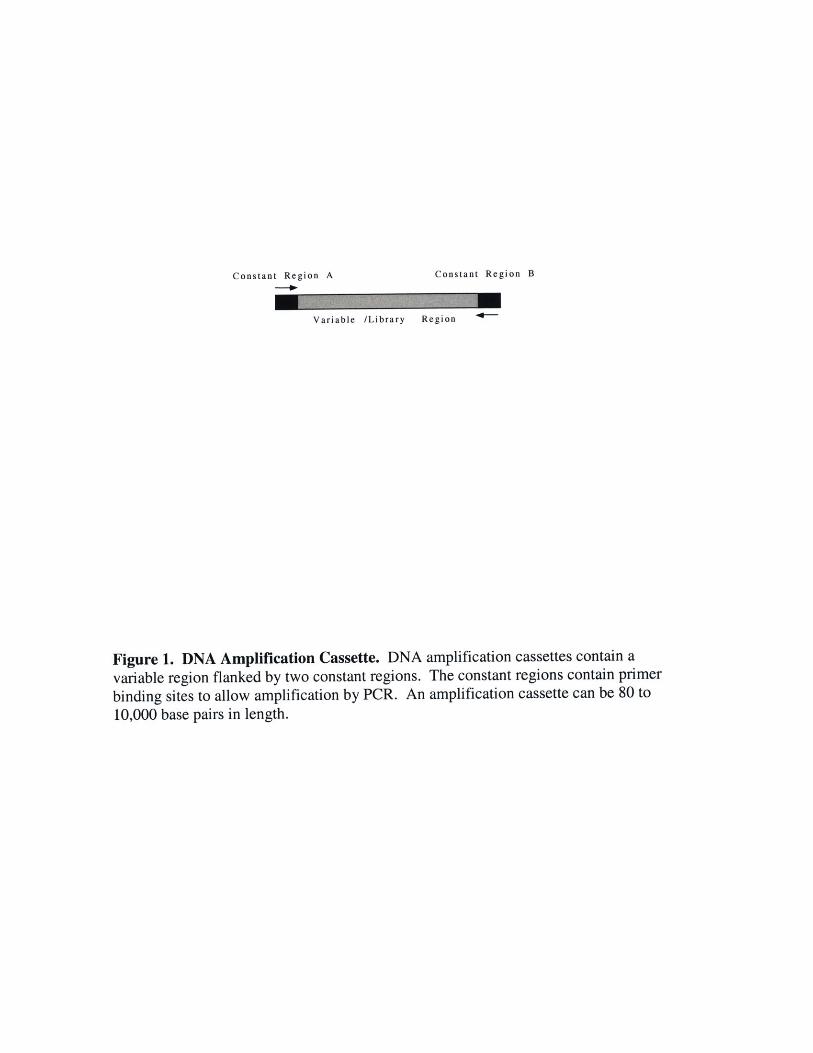
Step 1: Make library of linear DNA molecules with universal priming sites (Fig.
1. Each molecule in the library will contain a variable region flanked by two constant
regions. Each molecule in the library will contain different sequences in the variable
region. The constant regions contain primer binding sites to allow amplification by PCR.
This type of library was first created to perform SELEX experiments(18).
Step 2: Amplify polymerase colonies (polonies) in an acrylamide gel (Fig 1). A
thin polyacrylamide gel is poured on a glass microscope slide and allowed to polymerize.
Included in this gel mix are oligonucleotide primers, DNA polymerase, nucleotide
triphosphates, and very dilute amounts (100 to 5 million molecules) of the linear DNA
library described above. The DNA is amplified by performing the polymerase chain
reaction (PCR) using a thermal-cycler designed for microscope slides. The
polyacrylamide matrix retards the diffusion of the linear DNA molecules during the
reaction so that the amplification products remain localized near their respective
templates. At the end of the reaction, each template gives rise to a colony or 'polony'(for
polymerase colony). As many as 5 million polonies can be amplified on a single slide.
An acrydite modification(19) is included at the 5'end of one of the primers, so that the
amplified DNA is covalently attached to the polyacrylamide matrix, allowing further
enzymatic manipulations to be performed.
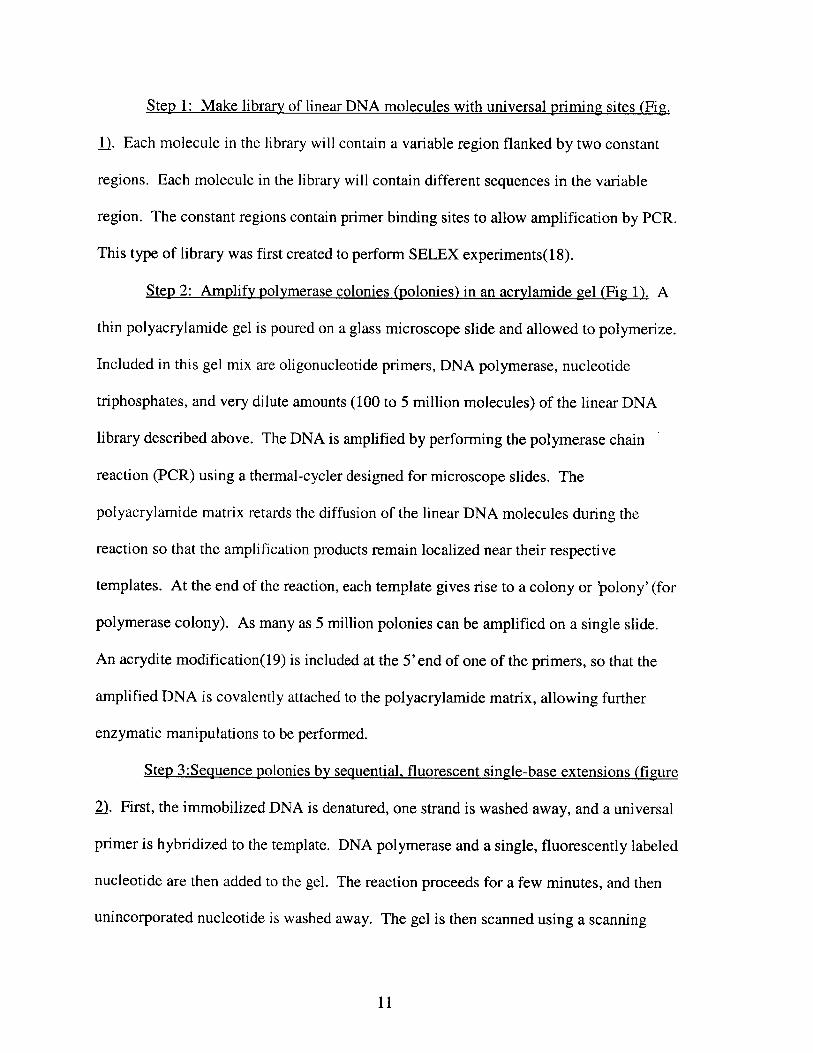
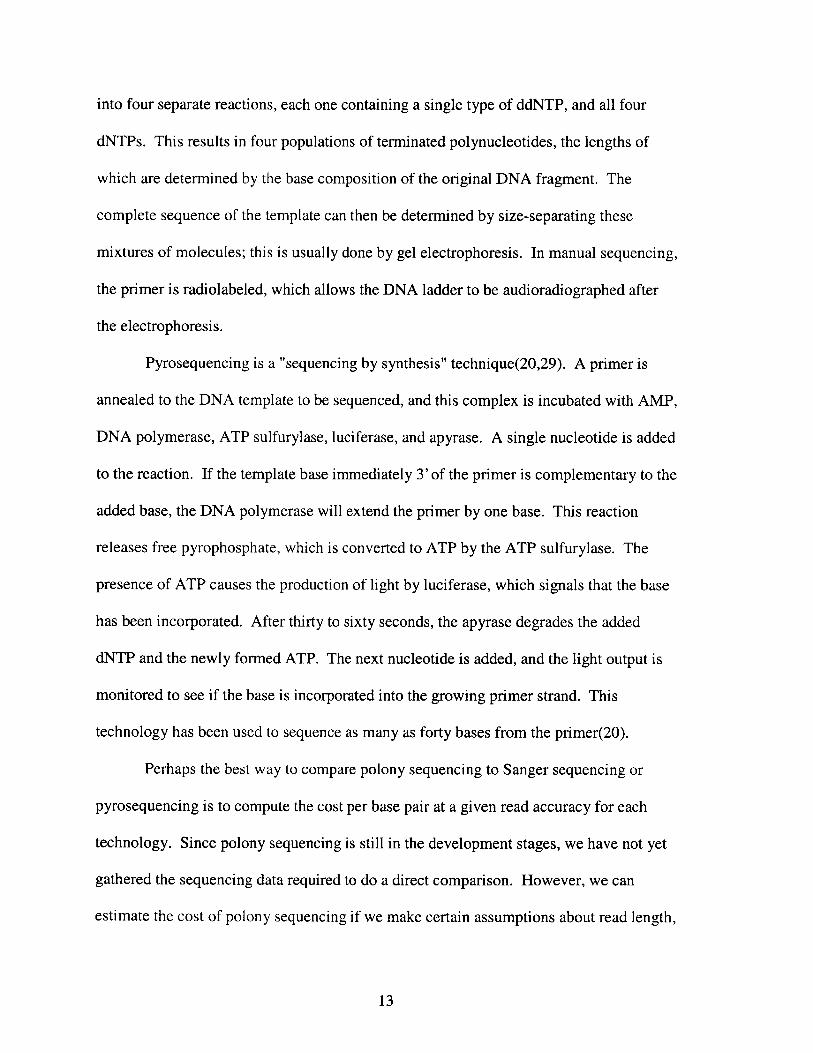
Step 3:Sequence polonies by sequential, fluorescent single-base extensions (figure
2). First, the immobilized DNA is denatured, one strand is washed away, and a universal
primer is hybridized to the template. DNA polymerase and a single, fluorescently labeled
nucleotide are then added to the gel. The reaction proceeds for a few minutes, and then
unincorporated nucleotide is washed away. The gel is then scanned using a scanning
11
Polony amplification
-I
enla
--I /_ 4- molecules of
linear DNA
rged view
primer A DNA to be sequenced primer B
JIpour acrylamide gelwith DNA and PCRreagents
singleDNAmolecule
a
polony= - 0PCR colony
* 0
afteramplification
beforeamplification
n-gel PCRmplification
image ofpolonies
Figure 1. Polony amplification. A library of linear DNA molecules with universalpriming sites is PCR amplified in a polyacrylamide gel. A single template moleculegives rise to a polymerase colony or polony.
Step 1
Step2
FISSEQ(fluorescent in situ sequencing)
1. Denature DNA
2. Anneal universalsequencing primer
B B'i B B4TG' G
CG G
BI B. - 1 B 8'
* e
C GCG G
3. Add DNA polymeraseand fluorescently labeleddATP
4. Wash
5.
6.
Scan gel
Remove fluorescent labelfrom incorporated base
7. Add fluorescently labeleddCTP
8. Wash
9. Scan gel
Figure 2. Fluorescent in situ sequencing. Polonies are denatured, and a sequencingprimer is annealed. Polonies are sequenced by serial additions of a single fluorescentnucleotide.
CG
.00
GG
Step 3
fluorescence microscope. If a polony has incorporated the added base, it will fluoresce,
revealing the identity of the template base immediately 3' of the annealed primer. The
fluorescence is then removed by chemically cleaving the linker between the fluorophore
and the nucleotide, and washing away the fluorophore. The cycle is then repeated by
adding a different fluorescently labeled base, washing away unincorporated nucleotide
and scanning the gel. In this fashion, the sequence of every polony on the gel can be
determined in a parallel fashion.
Other Sequencing Technologies
Polony sequencing is best viewed in light of two other sequencing methods,
Sanger sequencing(19) and pyrosequencing (20-23). These two technologies are relevant
to this work because Sanger sequencing is the most commonly used sequencing
technology today, and pyrosequencing is conceptually similar to polony sequencing.
Other technologies under development such as single molecule sequencing methods,
sequencing by hybridization(24-26), sequencing by high-resolution microscopy,
sequencing using mass spectrometry, and MPSS(27,28)will not be discussed here; the
reader is referred to Genomics, chapters 10-12 for an excellent review of the subject.
Sanger sequencing is a chain termination technique. Primer is annealed to single
stranded template, and is extended by including DNA polymerase and deoxynucleotides
in the reaction. Also included in the reaction are dideoxynucleotides, which when
incorporated into the growing strand, terminate the extension. By using appropriate
ratios of dNTPs and ddNTPs, a nested set of DNA fragments of different lengths is
generated, each terminated with a dideoxynucleotide. In practice, the template is divided
12
into four separate reactions, each one containing a single type of ddNTP, and all four
dNTPs. This results in four populations of terminated polynucleotides, the lengths of
which are determined by the base composition of the original DNA fragment. The
complete sequence of the template can then be determined by size-separating these
mixtures of molecules; this is usually done by gel electrophoresis. In manual sequencing,
the primer is radiolabeled, which allows the DNA ladder to be audioradiographed after
the electrophoresis.
Pyrosequencing is a "sequencing by synthesis" technique(20,29). A primer is
annealed to the DNA template to be sequenced, and this complex is incubated with AMP,
DNA polymerase, ATP sulfurylase, luciferase, and apyrase. A single nucleotide is added
to the reaction. If the template base immediately 3' of the primer is complementary to the
added base, the DNA polymerase will extend the primer by one base. This reaction
releases free pyrophosphate, which is converted to ATP by the ATP sulfurylase. The
presence of ATP causes the production of light by luciferase, which signals that the base
has been incorporated. After thirty to sixty seconds, the apyrase degrades the added
dNTP and the newly formed ATP. The next nucleotide is added, and the light output is
monitored to see if the base is incorporated into the growing primer strand. This
technology has been used to sequence as many as forty bases from the primer(20).
Perhaps the best way to compare polony sequencing to Sanger sequencing or
pyrosequencing is to compute the cost per base pair at a given read accuracy for each
technology. Since polony sequencing is still in the development stages, we have not yet
gathered the sequencing data required to do a direct comparison. However, we can
estimate the cost of polony sequencing if we make certain assumptions about read length,
13
accuracy, and number of polonies per slide. This analysis is presented in appendix C,
where we estimate the cost of polony sequencing to be 1.25 x 10⁻⁴ cents per base. The
cost of Sanger sequencing is approximately 10 to 50 cents per base and the cost of
pyrosequencing is estimated to be 10 cents per base. We expect such significant savings
for three reasons: sample preparation is greatly simplified, the amount of reagent required
for each reaction is extremely small, and all of the templates to be sequenced are
processed in parallel.
Sample preparation is a significant fraction of total cost in large scale sequencing
projects. One reason for this is the read length, or number of bases that can be sequenced
in a single reaction, of existing sequencing technologies is small when compared to the
size of a genome. For example, Sanger sequencing has a read length of 500 to 700 bases,
and pyrosequencing has a typical read length of 40 to 50 base pairs, but even a microbial
genome typically contains four to eight million base pairs. Therefore, researchers must
divide the template into a number of smaller pieces, sequence them and assemble the
smaller fragments. There are a number of strategies for doing this; most require that the
genomic DNA be sheared and cloned into E.coli. The cloned library then is plated so that
individual colonies form. Before a sequencing reaction can be performed, these colonies
must be individually picked, PCR amplified, and the DNA must be purified away from
the PCR reagents. This process is labor intensive, and the reagent cost is significant,
often as high as one to two dollars per clone in reagent costs alone. In polony
sequencing, the DNA fragments are cloned and immobilized in vitro, thus avoiding much
of the labor and cost associated with cloning into E.coli. In the polony format, all sample
preparation and sequencing steps are performed in parallel, without the need to
14
manipulate the individual samples, and since only femtoliter volumes are used for each
clone, the cost of reagent per sample is on the order of 0.001 cents. This reduction of
cost and labor means it would be possible for a single researcher using polony sequencing
to sequence a microbial genome in just a few hours.
Summary of Results Presented
The cloning and amplification of DNA templates using polony technology is
presented in chapter 2, which was published as a paper in Nucleic Acids Research(30).
Polony amplification is demonstrated, and the relationship between the length of the
DNA template, the acrylamide concentration, and polony size is investigated. It was
found that increasing template length or increasing acrylamide concentration significantly
decreased polony size. Using 1 kilobase templates and 15% acrylamide, as many as 5
million distinct polonies can be amplified on a single 25mm x 75mm glass microscope
slide. In addition, a technique to make replicas of a polony slide is presented.
Progress in developing FISSEQ, the protocol for in situ sequencing of polonies is
demonstrated in chapter 3. Increasing the efficiency of the single base extension reaction
was identified as an important goal, and this was achieved by developing a new
"polymerase trapping" technique. It was shown that a sequencing primer annealed to
amplified polonies could be correctly extended out to 34 bases without dephasing of the
polony molecules. A procedure for cleaving the fluorophore from the incorporated
nucleotide is also described. Finally, the concept of amplifying the polonies in acrylamide
islands is introduced.
15
A computational analysis of whole-genome expression data reveals
chromosomal domains of gene expression.
This portion of the introduction is devoted to a computational project in which
whole-genome expression data was analyzed to examine the relationship between a
gene's position on a chromosome and its expression. I will briefly describe some of the
literature on position effects on transcription, review the experimental and computational
tools used in our analysis, and then talk about future plans to expand and continue this
line of research.
The term position effect is used to describe phenomena in which a gene's behavior
is affected by its location on the chromosome. One example of such a phenomenon is
position effect variagation (PEV). PEV was shown to occur in yeast when the ADE2
gene was deleted from its normal locus on chromosome XV and placed immediately
adjacent to the telomeric repeats on chromosome VII(31). The resulting cells produced
predominantly red colonies, which is a phenotype characteristic of ade2- cells,
demonstrating that ADE2 transcription was repressed simply by changing its location on
the chromosome. Furthermore, it was noticed that some red colonies contained white
sectors (a phenotype characteristic of ADE2+ cells), indicating that this repression could
be variagated, or spontaneously reversed, presumably due to changes in chromosome
structure near the ADE2 gene.
Transvection is another class of position effects. In transvection, a gene's
expression is altered depending on whether or not it is paired with its homologue(32).
For example, in Drosophila, transvection has been observed at the yellow locus(33). The
16
y2 and y59b alleles of yellow cause abnormal yellow pigmentation. The y2 allele has a
transposable element inserted in between its promoter and two enhancers which silences
the effect of the enhancers. The y59b allele lacks part of the transposable element and
has no promoter. The y59b allele has been shown to complement the y2 allele; however,
if the two alleles are not allowed to pair, this complementation is negated. The
interpretation of these observations is that the enhancer from the y59b allele can act in
trans to activate the y2 promoter, if the genes are sufficiently close to one another in the
nucleus.
The mechanisms of PEV and transvection are not well understood, but
chromomatin structure is thought to play a role in these phenomena. Studies of position
effects such as PEV and transvection have led to the discovery of sequences, called
insulators, that mark the boundaries between inactive and active chromatin. A reporter
gene flanked by two insulator sequences is protected against position effects, and
insulators have also been shown to act as directional barriers to enhancers(34). The first
insulator elements were found in Drosophila(35), and have since been found in mouse,
chicken, human, Xenopus, and most recently in yeast (36,37).
Although position effects may be detected by looking for changes in
recombination frequency or replication timing(3 1), most often they are detected by
looking for changes in transcription of one or more genes. This is fortunate, as DNA
microarray technology has recently revolutionarized the way we collect expression data,
enabling us to look at position effects in ways that were previously impossible. DNA
microarrays provide the ability to rapidly quantify mRNA abundance levels for tens of
thousands of genes in a single experiment(14,15). This breakthrough has presented
17
biologists with the challenge of analyzing such large quantities of expression data. Most
analyses to date have focused on assigning function to unknown or poorly characterized
genes. This is commonly done by grouping together genes that display similar
expression patterns in different conditions, a technique called clustering (38-42). It has
been shown that genes which cluster together are more likely to have similar function.
Other groups have taken this approach one step further by demonstrating that genes with
similar expression patterns are often controlled by the same regulatory sequences and
developing computational tools to identify these sequences from expression data (43-45).
The goal of the research presented in this portion of my thesis was to combine these types
of whole-genome analyses with positional information to develop a set of tools to study
position effects.
The results of this research are presented in chapter 4 of my thesis. A new tool,
the chromosome correlation map, which displays the correlation among the expression
patterns of genes on the same chromosome, is described. These maps are used to analyze
whole-genome expression data gathered for the yeast S. cerevisiae. This analysis
demonstrated that adjacent pairs of genes, as well as nearby non-adjacent pairs of genes,
show significantly correlated expression in a manner that is dependent on the distance
between the genes, but independent of their orientation. Also presented are specific
examples of adjacent pairs of genes with highly correlated expression patters, in which
the promotor of only one of the two genes contains an upstream activating sequence
(UAS) known to be associated with that expression pattern. Finally, genes with similar
functions are shown to be more likely to reside in adjacent positions along the
chromosomes. Taken together, these results suggest that in certain chromosomal
18

expression domains, a UAS can affect the transcription of genes that are not immediately
downstream from it, and that evolution may take advantage of this phenomenon by
keeping genes with similar functions in adjacent chromosomal positions.
19
1. Robison, K., Gilbert, W. and Church, G. M. (1996) Science, 271 (5253), 1302-3;
discussion 1303-4.
2. Rubin, G. M., Yandell, M. D., Wortman, J. R., Gabor Miklos, G. L., Nelson, C.
R., Hariharan, I. K., Fortini, M. E., Li, P. W., Apweiler, R., Fleischmann, W., Cherry, J.
M., Henikoff, S., Skupski, M. P., Misra, S., Ashburner, M., Birney, E., Boguski, M. S.,
Brody, T., Brokstein, P., Celniker, S. E., Chervitz, S. A., Coates, D., Cravchik, A.,
Gabrielian, A., Galle, R. F., Gelbart, W. M., George, R. A., Goldstein, L. S., Gong, F.,
Guan, P., Harris, N. L., Hay, B. A., Hoskins, R. A., Li, J., Li, Z., Hynes, R. 0., Jones, S.
J., Kuehl, P. M., Lemaitre, B., Littleton, J. T., Morrison, D. K., Mungall, C., O'Farrell, P.
H., Pickeral, 0. K., Shue, C., Vosshall, L. B., Zhang, J., Zhao, Q., Zheng, X. H., Zhong,
F., Zhong, W., Gibbs, R., Venter, J. C., Adams, M. D. and Lewis, S. (2000) Science , 287
(5461), 2204-15.
3. Koonin, E. V., Tatusov, R. L. and Galperin, M. Y. (1998) Curr Opin Struct Biol,
8 (3), 355-63.
4. Loots, G. G., Locksley, R. M., Blankespoor, C. M., Wang, Z. E., Miller, W.,
Rubin, E. M. and Frazer, K. A. (2000) Science , 288 (5463), 136-40.
5. McGuire, A. M., Hughes, J.D., and Church, G.M. (2000) Genome Research , In
Press .
6. Galperin, M. Y. and Koonin, E. V. (2000) Nat Biotechnol , 18 (6), 609-613.
7. Overbeek, R., Fonstein, M., D'Souza, M., Pusch, G. D. and Maltsev, N. (1999)
Proc Natl Acad Sci U S A , 96 (6), 2896-901.
8. Enright, A. J., Iliopoulos, I., Kyrpides, N. C. and Ouzounis, C. A. (1999) Nature,
402 (6757), 86-90.
9. Marcotte, E. M., Pellegrini, M., Ng, H. L., Rice, D. W., Yeates, T. 0. and
Eisenberg, D. (1999) Science , 285 (5428), 751-3.
10. McCarthy, J. J. and Hilfiker, R. (2000) Nat Biotechnol , 18 (5), 505-8.
11. Velculescu, V. E., Zhang, L., Zhou, W., Vogelstein, J., Basrai, M. A., Bassett, D.
E., Jr., Hieter, P., Vogelstein, B. and Kinzler, K. W. (1997) Cell, 88 (2), 243-51.
12. Velculescu, V. E., Zhang, L., Vogelstein, B. and Kinzler, K. W. (1995) Science,
270 (5235), 484-7.
20

13. Zhang, L., Zhou, W., Velculescu, V. E., Kern, S. E., Hruban, R. H., Hamilton, S.
R., Vogelstein, B. and Kinzler, K. W. (1997) Science , 276 (5316), 1268-72.
14. Schena, M., Shalon, D., Davis, R. W. and Brown, P. 0. (1995) Science , 270
(5235), 467-70.
15. Lockhart, D. J., Dong, H., Byrne, M. C., Follettie, M. T., Gallo, M. V., Chee, M.
S., Mittmann, M., Wang, C., Kobayashi, M., Horton, H. and Brown, E. L. (1996) Nat
Biotechnol, 14 (13), 1675-80.
16. Chien, C. T., Bartel, P. L., Sternglanz, R. and Fields, S. (1991) Proc Natl Acad
Sci USA , 88 (21), 9578-82.
17. Uetz, P., Giot, L., Cagney, G., Mansfield, T. A., Judson, R. S., Knight, J. R.,
Lockshon, D., Narayan, V., Srinivasan, M., Pochart, P., Qureshi-Emili, A., Li, Y.,
Godwin, B., Conover, D., Kalbfleisch, T., Vijayadamodar, G., Yang, M., Johnston, M.,
Fields, S. and Rothberg, J. M. (2000) Nature , 403 (6770), 623-7.
18. Singer, B. S., Shtatland, T., Brown, D. and Gold, L. (1997) Nucleic Acids Res , 25
(4), 781-6.
19. Rehman, F. N., Audeh, M., Abrams, E. S., Hammond, P. W., Kenney, M. and
Boles, T. C. (1999) Nucleic Acids Res , 27 (2), 649-55.
20. Ronaghi, M., Uhlen, M. and Nyren, P. (1998) Science , 281 (5375), 363, 365.
21. Ronaghi, M., Karamohamed, S., Pettersson, B., Uhlen, M. and Nyren, P. (1996)
Anal Biochem , 242 (1), 84-9.
22. Ahmadian, A., Lundeberg, J., Nyren, P., Uhlen, M. and Ronaghi, M. (2000)
Biotechniques , 28 (1), 140-4, 146-7.
23. Ronaghi, M., Nygren, M., Lundeberg, J. and Nyren, P. (1999) Anal Biochem , 267
(1), 65-71.
24. Chee, M., Yang, R., Hubbell, E., Berno, A., Huang, X. C., Stern, D., Winkler, J.,
Lockhart, D. J., Morris, M. S. and Fodor, S. P. (1996) Science , 274 (5287), 610-4.
25. Drmanac, S., Kita, D., Labat, I., Hauser, B., Schmidt, C., Burczak, J. D. and
Drmanac, R. (1998) Nat Biotechnol , 16 (1), 54-8.
26. Parinov, S., Barsky, V., Yershov, G., Kirillov, E., Timofeev, E., Belgovskiy, A.
and Mirzabekov, A. (1996) Nucleic Acids Res , 24 (15), 2998-3004.
21

27. Brenner, S., Johnson, M., Bridgham, J., Golda, G., Lloyd, D. H., Johnson, D.,
Luo, S., McCurdy, S., Foy, M., Ewan, M., Roth, R., George, D., Eletr, S., Albrecht, G.,
Vermaas, E., Williams, S. R., Moon, K., Burcham, T., Pallas, M., DuBridge, R. B.,
Kirchner, J., Fearon, K., Mao, J. and Corcoran, K. (2000) Nat Biotechnol , 18 (6), 630-
634.
28. Brenner, S., Williams, S. R., Vermaas, E. H., Storck, T., Moon, K., McCollum,
C., Mao, J. I., Luo, S., Kirchner, J. J., Eletr, S., DuBridge, R. B., Burcham, T. and
Albrecht, G. (2000) Proc Natl Acad Sci U S A , 97 (4), 1665-70.
29. Ronaghi, M. (1998) , Department of Biotechnology. Royal Institute of
Technology, Stockholm.
30. Mitra, R. D. and Church, G. M. (1999) Nucleic Acids Res , 27 (24), e34.
31. Gottschling, D. E., Aparicio, 0. M., Billington, B. L. and Zakian, V. A. (1990)
Cell , 63 (4), 751-62.
32. Wu, C. T. (1993) J Cell Biol, 120 (3), 587-90.
33. Geyer, P. K., Green, M. M. and Corces, V. G. (1990) Embo J, 9 (7), 2247-56.
34. Bell, A. and Felsenfeld, G. (1999) Current opinion in Genetics and Development,
9, 191-198.
35. Udvardy, A., Maine, E. and Schedl, P. (1985) J Mol Biol , 185 (2), 341-58.
36. Bi, X., Braunstein, M., Shei, G. J. and Broach, J. R. (1999) Proc Natl Acad Sci U
SA , 96 (21), 11934-9.
37. Bi, X. and Broach, J. R. (1999) Genes Dev, 13 (9), 1089-101.
38. Tamayo, P., Slonim, D., Mesirov, J., Zhu, Q., Kitareewan, S., Dmitrovsky, E.,
Lander, E. S. and Golub, T. R. (1999) Proc Natl Acad Sci U S A , 96 (6), 2907-12.
39. Eisen, M. B., Spellman, P. T., Brown, P. 0. and Botstein, D. (1998) Proc Natl
Acad Sci U S A , 95 (25), 14863-8.
40. Perou, C. M., Jeffrey, S. S., van de Rijn, M., Rees, C. A., Eisen, M. B., Ross, D.
T., Pergamenschikov, A., Williams, C. F., Zhu, S. X., Lee, J. C., Lashkari, D., Shalon, D.,
Brown, P. 0. and Botstein, D. (1999) Proc Natl Acad Sci U S A , 96 (16), 9212-7.
41. Heyer, L. J., Kruglyak, S. and Yooseph, S. (1999) Genome Res , 9 (11), 1106-15.
42. Alon, U., Barkai, N., Notterman, D. A., Gish, K., Ybarra, S., Mack, D. and
Levine, A. J. (1999) Proc Natl Acad Sci U S A , 96 (12), 6745-50.
22

43. Tavazoie, S., Hughes, J. D., Campbell, M. J., Cho, R. J. and Church, G. M. (1999)
Nat Genet , 22 (3), 281-5.
44. Roth, F. P., Hughes, J. D., Estep, P. W. and Church, G. M. (1998) Nat Biotechnol
,16 (10), 939-45.
45. Hughes, J. D., Estep, P. W., Tavazoie, S. and Church, G. M. (2000) J Mol Biol ,
296 (5), 1205-14.
23
Chapter 2
In Situ Localized Amplification and Contact
Replication of Many Individual DNA Molecules
24
Introduction
We are faced with a ever increasing demand for DNA sequence information.
Currently, most DNA sequencing is done using the Sanger method (1), which relies on
electrophoresis, a technique that is difficult to perform in a highly parallel (greater than
1000 samples at a time per instrument) fashion. Therefore, other technologies are being
investigated, such as sequencing by hybridization (2-4), and pyrosequencing (5), that
avoid the electrophoresis step of the Sanger method, allowing more samples to be
sequenced in parallel. This parallelization will increase the throughput of the sequencing
stage; however, the samples must first be cloned, amplified and purified, and the
throughputs of these obligate stages are not increased by these technologies and remain
the major bottlenecks. To address this important issue, we propose a strategy in which a
number of samples can be cloned, amplified, and sequenced on a single glass microscope
slide in a highly parallel fashion.
We have developed a method to deposit DNA directly onto a solid surface and
amplify it in situ. To do so, acrylamide is polymerized in a solution containing standard
PCR reagents and a very low concentration of linear DNA template. The gel is poured
on a glass microscope slide which is then thermal cycled. As the amplification reaction
proceeds, the products remain localized near their respective templates, so that at the end
of the reaction, a single template molecule gives rise to a PCR colony, or "polony"
consisting of as many as 108 identical DNA molecules. By including an Acrydite
modification (6) on the 5' end of one of the PCR primers, the amplified DNA in each
polony can be covalently attached by one of its ends to the polyacrylamide matrix.
25
We have also developed a manufacturing strategy analogous to replica plating to
faithfully copy the polony slide. The polonies of one slide can be sequenced in a highly
parallel fashion (see discussion), and would thus be known for all copies. Duplicate
polony slides could then be used for mRNA expression analysis or other applications.
A technique for creating RNA colonies by in vitro amplification has been
previously described (7). RNA molecules were "cloned" by performing a Q$ replicase
reaction in an agarose gel. However, in this technique, the amplified RNA is not
immobilized to the gel matrix, the colonies are grown at a low density, and no method
was described for fabricating copies of the amplified colonies.
Materials and Methods
Primers
The primers used in this experiment are listed below. All primers were obtained
from Operon (CA). Sequences common to multiple primers are indicated in bold, italic,
underscored or bold and italic.
Primers used for solid phase amplification:
Primer OutF 5' -cca cta cgc ctc cgc ttt cct ctc -3'
Primer OutR 5'-ctg ccc cgg gtt cct cat tct ct-3'
Primer AcrOutF 5'-Qcca eta cgc ctc cgc ttt cct ctc-3'
Primer InF 5'-ggg cgg aag ctt gaa gga ggt att-3'
Primer InR 5'-gcc cgg tct cga gcg tct gtt ta-3'
Primer AcrInF 5'-Qggg cgg aag ctt gaa gga ggt att-3'
26
Primer PucF 5' - ggg cgg aag ctt gaa gga ggt att taa gga gaa aat acc gca tca gg-3'
Primer PucRI 5'- gcc cgg tct cga gcg tct gtt tac acc gat cgc cct tcc caa ca-3'
Primer PucR2 5'-gcc cgg tct cga gcg tct gtt taa att cac tgg ccg tcg ttt tac aa-3'
Primer PucR3 5'- gcc cgg tct cga gcg tct gtt tac caa tac gca aac cgc ctc tcc - 3'
Primer PucNestF 5'- cca cta cgc ctc cgc ttt cct ctc ggg cgg aag ctt gaa gga ggt att-3'
Primer PucNestR 5'-ctg ccc cgg gtt cct cat tct ctg ccc ggt ctc gag cgt ctg ttt a-3'
The primers AcrOutF and AcrInF have an Acrydite modification (Mosaic
Technologies) at their 5' ends (designated by the character Q in the sequences listed
above. Acrydite is a phosphoramidite that contains an ethylene group capable of free-
radical copolymerization with acrylamide; these primers will polymerize directly into the
acrylamide gel as it solidifies (6).
Design of Amplification Cassettes
The cassette CP-234 was created as follows: the plasmid pUC19 was amplified in
a PCR reaction. 50 p1 of PCR Mixture (10 mM Tris-HCl pH 8.3, 50 mM KCl, 0.01%
gelatin, 1.5 mM MgCl 2 , 200 pM dNTPs, 0.5 pM primer PucF, 0.5 pM primer PucR2, 2
ng pUC19 plasmid, 2 units Taq (Sigma)) was cycled in an MJ Research PTC-100
thermocycler as follows: denaturation (1 min at 940 C), 5 cycles (10 sec at 940 C, 10
sec at 55 C, 1min at 720 C), 20 cycles (10 sec at 940 C, 1 min at 680 C), and
extension (3 min at 720 C). The PCR product was purified using Qiaquick PCR
purification columns (Qiagen), and resuspended in dH20.
27
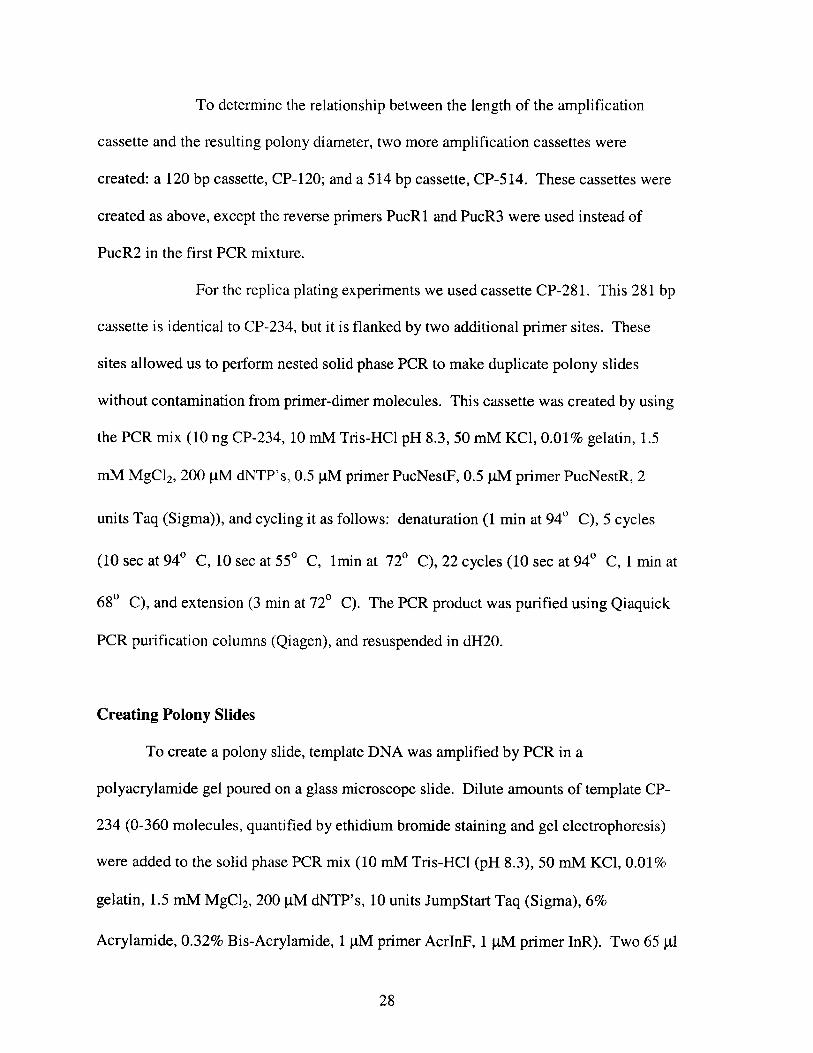
To determine the relationship between the length of the amplification
cassette and the resulting polony diameter, two more amplification cassettes were
created: a 120 bp cassette, CP-120; and a 514 bp cassette, CP-514. These cassettes were
created as above, except the reverse primers PucRI and PucR3 were used instead of
PucR2 in the first PCR mixture.
For the replica plating experiments we used cassette CP-281. This 281 bp
cassette is identical to CP-234, but it is flanked by two additional primer sites. These
sites allowed us to perform nested solid phase PCR to make duplicate polony slides
without contamination from primer-dimer molecules. This cassette was created by using
the PCR mix (10 ng CP-234, 10 mM Tris-HCl pH 8.3, 50 mM KCl, 0.01% gelatin, 1.5
mM MgC12, 200 pM dNTP's, 0.5 pM primer PucNestF, 0.5 pM primer PucNestR, 2
units Taq (Sigma)), and cycling it as follows: denaturation (1 min at 940 C), 5 cycles
(10 sec at 940 C, 10 sec at 550 C, 1min at 720 C), 22 cycles (10 sec at 940 C, 1 min at
68 C), and extension (3 min at 72 C). The PCR product was purified using Qiaquick
PCR purification columns (Qiagen), and resuspended in dH20.
Creating Polony Slides
To create a polony slide, template DNA was amplified by PCR in a
polyacrylamide gel poured on a glass microscope slide. Dilute amounts of template CP-
234 (0-360 molecules, quantified by ethidium bromide staining and gel electrophoresis)
were added to the solid phase PCR mix (10 mM Tris-HCl (pH 8.3), 50 mM KCl, 0.0 1%
gelatin, 1.5 mM MgCl 2, 200 pM dNTP's, 10 units JumpStart Taq (Sigma), 6%
Acrylamide, 0.32% Bis-Acrylamide, 1 pM primer AcrInF, 1 gM primer InR). Two 65 pl
28
frame-seal chambers (MJ research) were attached to a glass microscope slide that had
been treated with bind-silane (Pharmacia). 2.5 gl of 5% ammonium persulfate, and 2.5
gl of 5% temed was added to 150 gl of the solid phase PCR mixture. 65 gi of this
solution was added to each chamber. The chambers were then immediately covered with
No. 2 18 mm x18 mm coverslips (Fisher), and the gel was allowed to polymerize for 10-
15 minutes.
The slide was then cycled using a PTC-200 thermal cycler (MJ Research) adapted
for glass slides (16/16 twin tower block). The following program was used: denaturation
(2 min at 940 C), 40 cycles (30 sec at 930 C, 45 sec at 620 C, 45 sec at 720 C),
extension (2 min at 720 C). The coverslips were removed and the gels were stained in
SYBR green I (diluted 5000 fold in TE, pH 8.0), and imaged on a Storm phosphorimager
(Molecular Dynamics) or a confocal microscope (Leica).
Determining the Relationship Between Polony Diameter, Template Length, and
Acrylamide Concentration
Slides were poured in the manner described above. The ratio of bis-acrylamide to
acrylamide was 1:19 for all slides poured. After the slides were cycled, the coverslips
were removed and the gels were stained as above. The gels were imaged using the Storm
phosphorimager. Any gels with polonies less than 300 gm in diameter were imaged on
the confocal microscope. Care was taken to image only the polonies that could be
completely resolved from other polonies. These images were captured, and the intensity
values saved as a text file. The data was smoothed using a 17 point averaging algorithm,
and the full width at half maximum of each polony was recorded as its diameter.
29
Duplicating Polony Slides
To replica plate polony slides, the "original" slide is prepared in a slightly
different fashion than as described above. The original is a sandwich of two layers of
acrylamide, the transfer layer and the readout layer. To create the transfer layer, template
DNA is added to a solid phase PCR mix (10 mM Tris-HCl (pH 8.3), 50 mM KCl, 0.01%
gelatin, 1.5 mM MgC 2 , 200 jM dNTP's, 10 units JumpStart Taq (Sigma), 6%
Acrylamide, 0.32% Bis-Acrylamide, 1 FM primer AcrOutF, 1 pM primer OutR). Ten
microliters of this solution is then pipetted onto a clean coverslip (18mm x 18mm), and
the coverslip is picked up by a bind-silane treated slide. The slide is placed in an argon
atmosphere to promote polymerization of the acrylamide. The coverslip is then removed,
leaving a gel that is approximately 32 grm thick. To pour the readout layer, a fresh solid
phase PCR mix is made; however, no template is added to this mixture. A frame seal
chamber is then placed over the transfer layer, and, using a bind-silane treated glass
coverslip, the readout layer (250 gm) is poured over the 32 pm transfer layer. The slide
is then thermal cycled as described above.
When the coverslip is carefully removed from the top of the frame seal
chamber, the readout layer will stick to the coverslip, while the transfer layer will be left
on the slide. The readout layer can then be stained with SYBR Green I and imaged. The
transfer layer is then used to make duplicates. To do so, the slide is washed 2x in 10 mM
Tris-HCl, 2x in 500 mM KCl, 2x in 10 mM Tris-HCl, 100 mM KCl, and 2x in dH20.
The duplicate gel is then made by placing a frame seal chamber (15 mm x 15mm) over
the transfer layer, and pipetting 65 jl of the duplicate solid-phase PCR mix (10 mM Tris-
30
HCl pH 8.3, 50 mM KCl, 0.01% gelatin, 1.5 mM MgCl 2 , 200 gM dNTP's, 0.5 pM
primer AcrInF, 0.5 pM primer InR, 10 units JumpStart Taq (Sigma), 6% Acrylamide,
0.32% Bis-Acrylamide), onto the transfer layer. The duplicate slide is then cycled as
follows: denaturation (2 min at 940 C), 25 cycles (30 sec at 930 C, 45 sec at 620 C, 45
sec at 720 C), extension (2 min at 720 C). Because the coverslip used to pour the
duplicate gel was not treated with Bind-Silane, the gel stuck to the transfer layer when the
coverslip was removed; therefore when the duplicate was stained and imaged, the polony
pattern was rotated 180 degrees from that of the readout layer.
Results
Creating Polony Slides
Our goal was to amplify polonies on a glass microscope slide by performing
solid phase PCR (8) in an acrylamide gel. The general design of the template DNA
cassettes used to create the polony slide is shown in figure 1. For most applications, the
variable region of each cassette molecule will contain a different DNA fragment. This
complex library will contain sequences derived from the genome or cDNA of the
organism of interest flanked by constant regions that allow PCR amplification (9).
However, to demonstrate and optimize the in vitro cloning of DNA, only one species of
DNA was used in the solid phase PCR: the cassette CP-234, a 234 base pair template
derived from the plasmid pUC19. We included very dilute amounts of the template DNA
CP-234 into a PCR mix that contained 6% acrylamide and 0.3% bis-acrylamide. This
mix was then used to pour a thin (250 gm) acrylamide gel on top of a glass microscope
slide. One of the primers included in the mix contains an Acrydite group at its 5' end (6),
31
Constant Region A Constant Region B
Variable /Library Region
Figure 1. DNA Amplification Cassette. DNA amplification cassettes contain a
variable region flanked by two constant regions. The constant regions contain primer
binding sites to allow amplification by PCR. An amplification cassette can be 80 to
10,000 base pairs in length.
so that it was immobilized in the acrylamide matrix when the gel polymerized. Solid
phase PCR (so named because one of the primers is immobilized to a solid support) was
performed by thermal cycling of the slide. The gels went through 40 cycles of
denaturation, annealing and extension, and were stained using SYBR Green I.
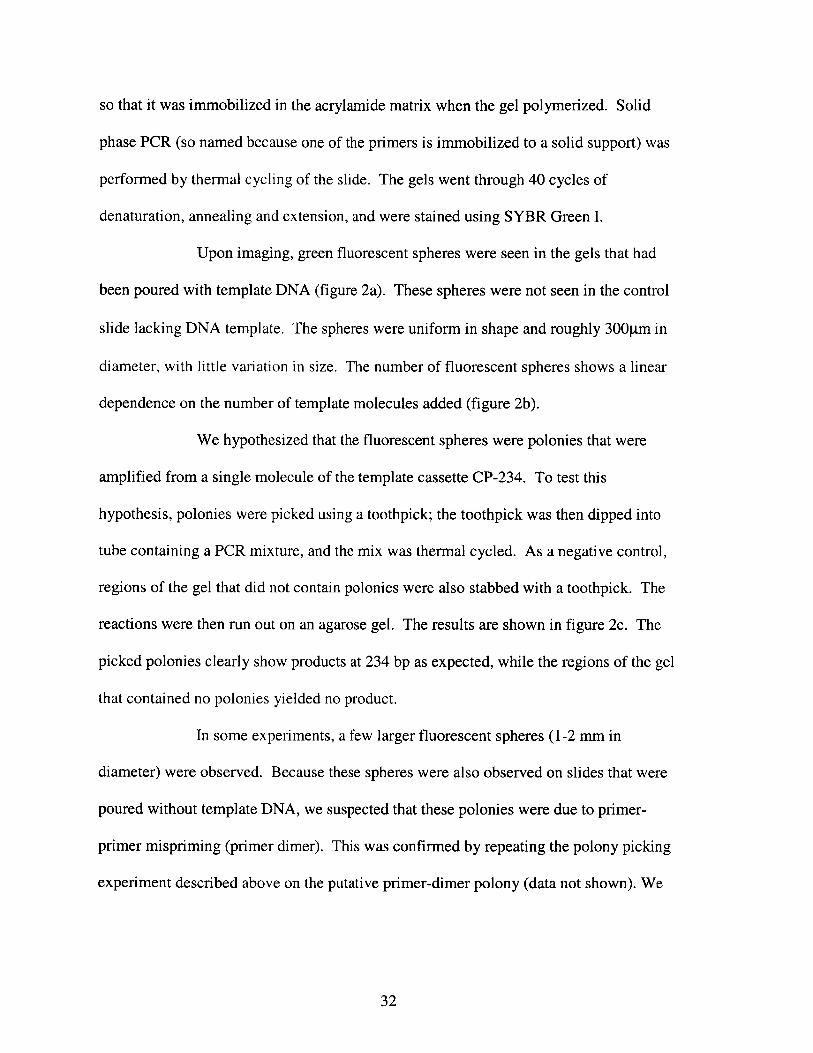
Upon imaging, green fluorescent spheres were seen in the gels that had
been poured with template DNA (figure 2a). These spheres were not seen in the control
slide lacking DNA template. The spheres were uniform in shape and roughly 300gm in
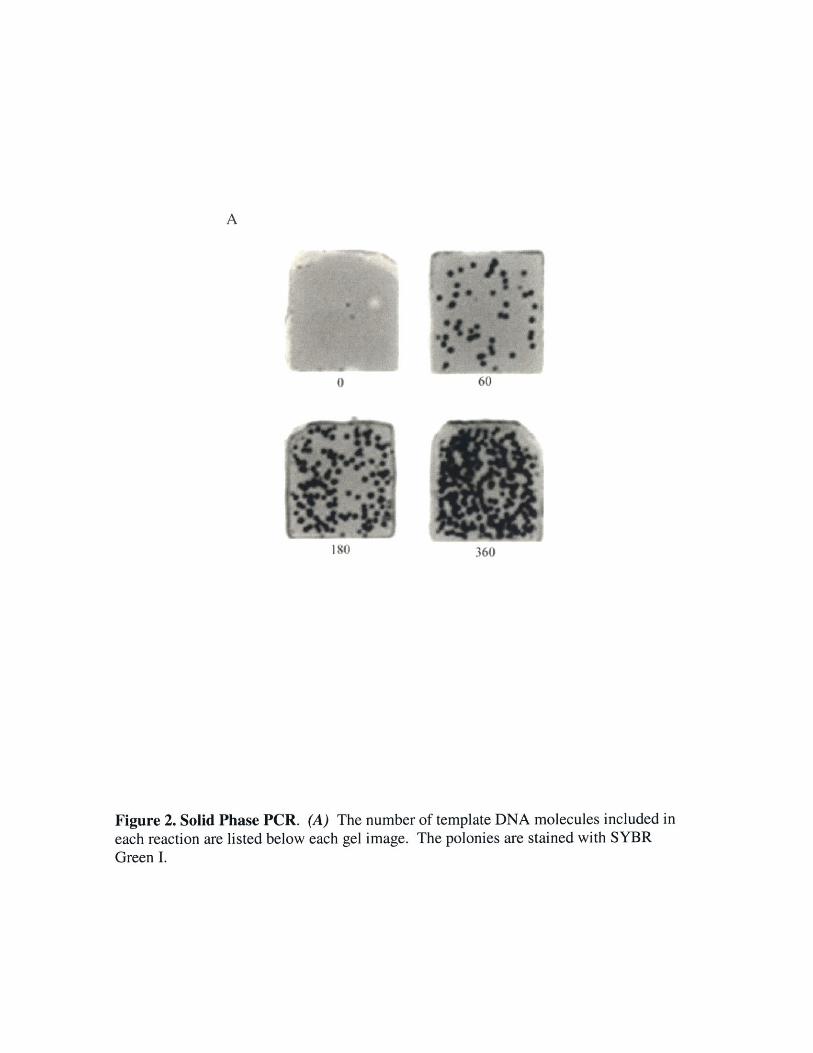
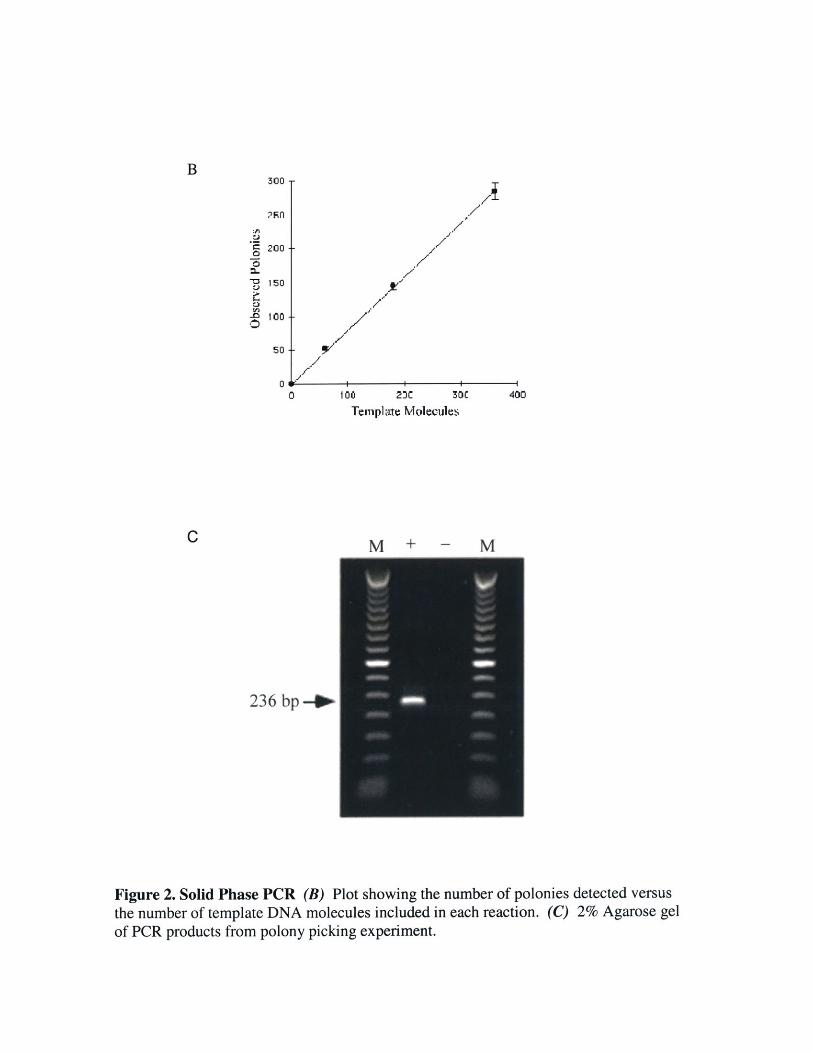
diameter, with little variation in size. The number of fluorescent spheres shows a linear
dependence on the number of template molecules added (figure 2b).
We hypothesized that the fluorescent spheres were polonies that were
amplified from a single molecule of the template cassette CP-234. To test this
hypothesis, polonies were picked using a toothpick; the toothpick was then dipped into
tube containing a PCR mixture, and the mix was thermal cycled. As a negative control,
regions of the gel that did not contain polonies were also stabbed with a toothpick. The
reactions were then run out on an agarose gel. The results are shown in figure 2c. The
picked polonies clearly show products at 234 bp as expected, while the regions of the gel
that contained no polonies yielded no product.
In some experiments, a few larger fluorescent spheres (1-2 mm in
diameter) were observed. Because these spheres were also observed on slides that were
poured without template DNA, we suspected that these polonies were due to primer-
primer mispriming (primer dimer). This was confirmed by repeating the polony picking
experiment described above on the putative primer-dimer polony (data not shown). We
32
A
0
IISO 360
Figure 2. Solid Phase PCR. (A) The number of template DNA molecules included ineach reaction are listed below each gel image. The polonies are stained with SYBRGreen I.
I
7~j.1
.7-j
/7.1'
7
,1<1'~*
*1
V
100 2C 30C
Template Molecl1es
M + - M
400
236 bplo
Figure 2. Solid Phase PCR (B) Plot showing the number of polonies detected versusthe number of template DNA molecules included in each reaction. (C) 2% Agarose gelof PCR products from polony picking experiment.
B300
?pfl
200 +
150
:A
0
50 -
0
C
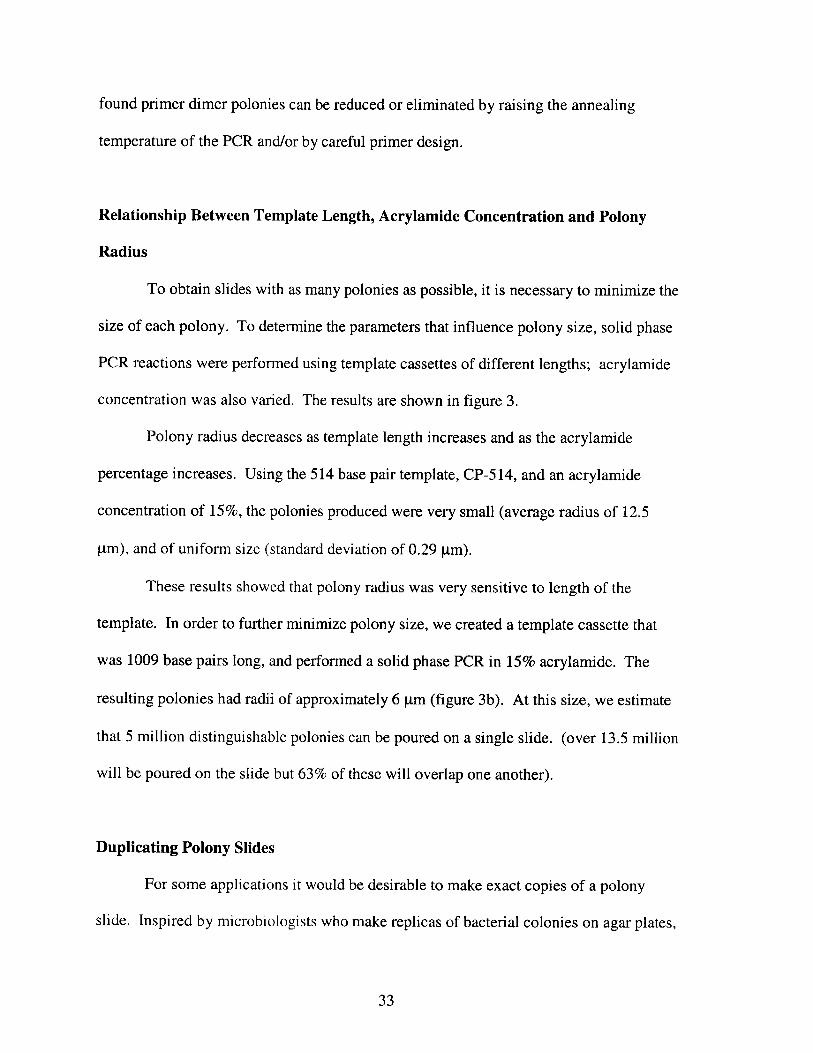
found primer dimer polonies can be reduced or eliminated by raising the annealing
temperature of the PCR and/or by careful primer design.
Relationship Between Template Length, Acrylamide Concentration and Polony
Radius
To obtain slides with as many polonies as possible, it is necessary to minimize the
size of each polony. To determine the parameters that influence polony size, solid phase
PCR reactions were performed using template cassettes of different lengths; acrylamide
concentration was also varied. The results are shown in figure 3.
Polony radius decreases as template length increases and as the acrylamide
percentage increases. Using the 514 base pair template, CP-514, and an acrylamide
concentration of 15%, the polonies produced were very small (average radius of 12.5
jim), and of uniform size (standard deviation of 0.29 gm).
These results showed that polony radius was very sensitive to length of the
template. In order to further minimize polony size, we created a template cassette that
was 1009 base pairs long, and performed a solid phase PCR in 15% acrylamide. The
resulting polonies had radii of approximately 6 pm (figure 3b). At this size, we estimate
that 5 million distinguishable polonies can be poured on a single slide. (over 13.5 million
will be poured on the slide but 63% of these will overlap one another).
Duplicating Polony Slides
For some applications it would be desirable to make exact copies of a polony
slide. Inspired by microbiologists who make replicas of bacterial colonies on agar plates,
33

A
3
2.5 +
2
1.5
1
ac
41
-E22
*
4' @ 6% Acrylamide* 10% AcrylamideA 15% Acrylamide
2.5
Log Template Length (br
3
B
Figure 3. Relationship Between Polony Radius and Length of Template. (A) Log-log plot showing the relationship between polony radius and template length. (B)Confocal image of polonies with an average radius of 6gM.
imp,-
we developed a replica plating protocol to fabricate copies of our polonies. In this
protocol, a polony slide, the "original," was created by pouring a thin, 3.1 pLm gel
containing template DNA (the template layer) on a bind silane treated glass microscope
slide, and then pouring a thicker gel (250 gm) over it. When the original is thermal
cycled, the DNA in the thin layer produces polonies that span the interface between the
two gels.
When the coverslip was carefully removed from the microscope slide, the thick
gel remained intact and attached to the coverslip. This gel was stained with SYBR Green
I, and saved for comparison with the duplicate. Because the surface of the slide was
treated with bind silane before the original was poured, the 3.1 gm layer of acrylamide
(the template layer) remained bound to the surface of the slide. The slide was washed,
and a new gel, the "duplicate," was poured on this glass slide. The duplicate was then
thermal cycled and stained.
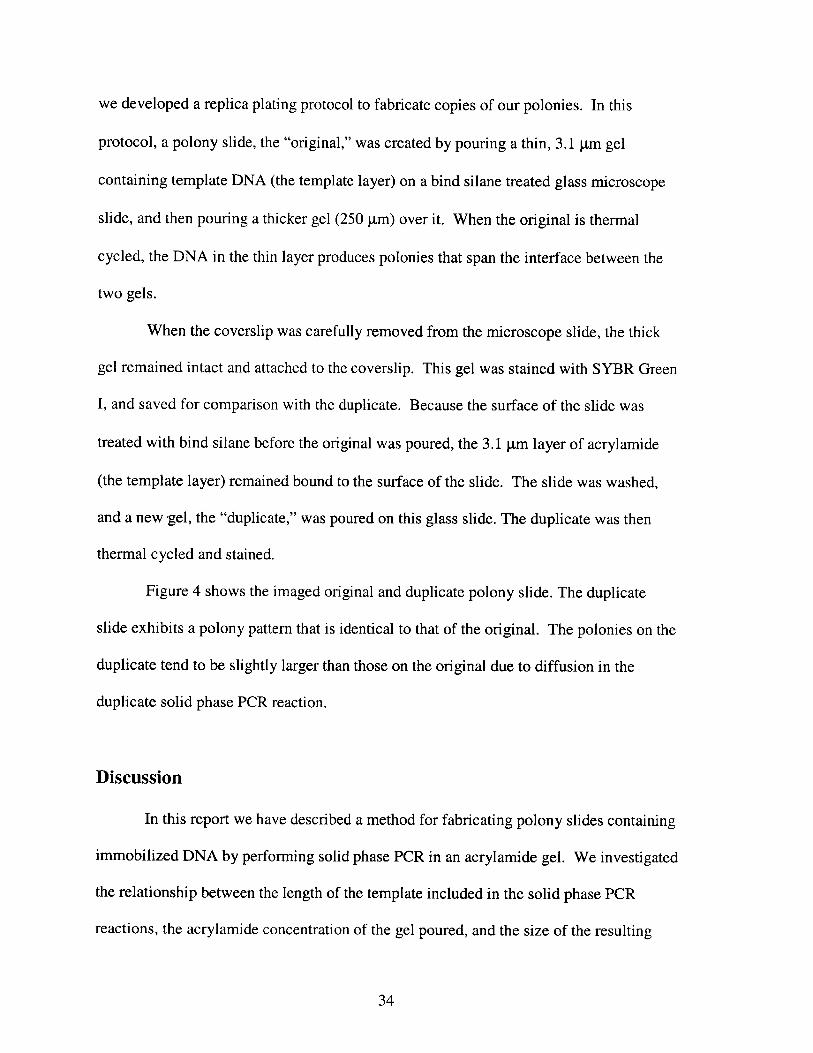
Figure 4 shows the imaged original and duplicate polony slide. The duplicate
slide exhibits a polony pattern that is identical to that of the original. The polonies on the
duplicate tend to be slightly larger than those on the original due to diffusion in the
duplicate solid phase PCR reaction.
Discussion
In this report we have described a method for fabricating polony slides containing
immobilized DNA by performing solid phase PCR in an acrylamide gel. We investigated
the relationship between the length of the template included in the solid phase PCR
reactions, the acrylamide concentration of the gel poured, and the size of the resulting
34
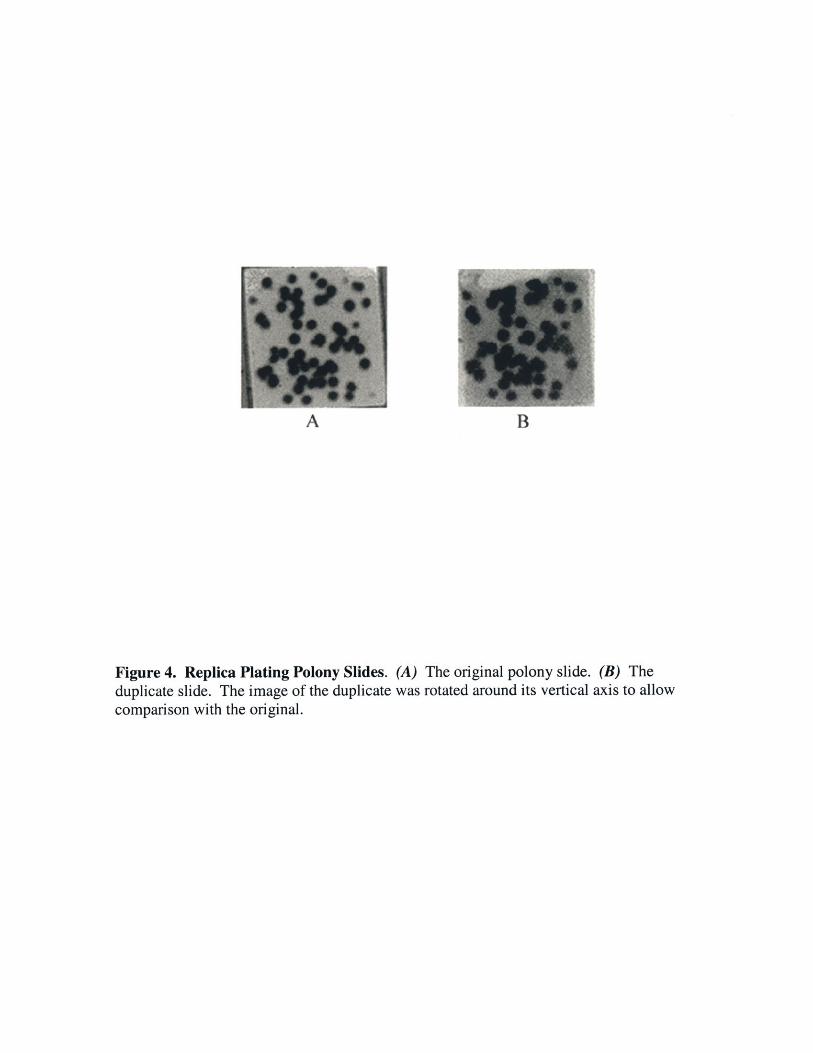
A B
Figure 4. Replica Plating Polony Slides. (A) The original polony slide. (B) Theduplicate slide. The image of the duplicate was rotated around its vertical axis to allowcomparison with the original.
PCR colonies, or polonies. In addition, we have described a technique for copying a
polony slide once it is created.
Our results provide three pieces of evidence that the stained polonies seen in
figure 2a are due to the amplification of single template molecules. First, the number of
polonies obtained in each reaction is linearly dependent on the amount of template
included. As seen in figure 2b, eighty percent of the template molecules added to each
reaction yielded polonies. There are a number of possible explanations as to why one
hundred percent efficiency was not obtained: template molecules may have been
damaged by the free radicals generated during the acrylamide polymerization, template
may have been lost due to abstraction by tube or pipette tip walls, or the amount of
template may have been underestimated when quantified by ethidium bromide staining.
The second piece of evidence was obtained by a polony-picking experiment. Polonies
that were picked and amplified by PCR produced products of the expected length. The
third piece of evidence is the strong dependence of polony size on length of the template
(figure 3), adding further weight to the argument that each polony has grown from a
single template molecule.
Reducing polony size is crucial to achieving a high number of clones on each
slide, because the number of polonies per slide goes up with the inverse square of the
polony size. We systematically varied the length of the template DNA and acrylamide
concentration in our solid phase PCR reactions to reduce polony radius. By using 1009
base pair template molecules and 15% acrylamide we obtained polonies that were 6 pm
in radius. We believe polony radius could be further reduced by increasing the length of
the template DNA, by using fewer cycles of PCR, or by immobilizing both primers.
35
The experiments that investigated the relationship between polony radius,
acrylamide concentration, and template length revealed an interesting phenomenon:
small polonies displayed less variation in size than large polonies (figure 3a).
To address this question, we developed a simulation for polony growth. This
model assumes that at each cycle in the PCR reaction, every DNA molecule will move in
a stochastic fashion (due to thermal energy) and then give rise to a complementary strand.
The probability that a given molecule will give rise to a complementary strand is
dependent on the number of unextended primers and the number of complementary
strands in the immediate vicinity of the DNA. We ran this model using a number of
different probability distribution functions for DNA motion (all runs assumed that the
DNA does not travel too far in relation to the average distance between immobilized
primers); in all cases the results were qualitatively similar. This model predicts that
template amplification in each polony is exponential during the early amplification
cycles. As the polony grows, it will reach a certain radius, the critical radius, after which
the amplification proceeds at a polynomial rate. The critical radius is dependent on the
diffusion coefficient of the template molecule, and the probability that a given DNA
molecule is replicated after one cycle of the solid phase PCR. This phenomenon has a
simple physical explanation: one of the primers in the reaction is immobilized; therefore,
for a polony to achieve exponential amplification, one strand of each full length DNA
product in the polony must diffuse and anneal to an immobilized primer at each round of
amplification. During the early rounds, most of the immobilized primers in the vicinity
of a template have not yet been extended so, the total number of DNA molecules in a
polony increases exponentially with the cycle number. However, at later rounds, the
36
DNA at the center of the polony cannot diffuse far enough to find immobilized primer
that has not yet been extended. So, only the DNA near the circumference of the polony
can continue to amplify. Therefore, the number of new DNA molecules generated with
each cycle increases as the square of the cycle number, so that the total number of DNA
molecules in the polony increases with the cube of the cycle number.
The predictions of the polony growth model help to explain why the longer
template molecules show less variance in size. When the long DNA template, CP-514,
was amplified to form polonies, the polonies reached their critical radii and then grew
very slowly for the rest of the reaction. Therefore, all of the polonies tended to be the
same size. When the short DNA template, CP-120, was used, the polonies never reached
their critical radii, so that some polonies were bigger or smaller than others due to the
stochastic nature of PCR.
The replica plating protocol we used enabled us to replicate the polonies on a
slide. The PCR mix used to pour the duplicate gel contained primers whose annealing
sites were nested inside the annealing sites of the primers used to create the original gel.
The nested primers have a higher annealing temperature than the outer primers used to
create the original; therefore, when the duplicate layer is poured and the slide is
amplified, there will be no extension of the immobilized outer primer in the transfer
layer. This means that the polonies in the transfer layer will not increase in radius during
the duplicate amplification, so that the transfer layer can be reused to produce a second
(or third etc.) duplicate that has no significant difference in average polony radius from
the first duplicate. Polonies on duplicate gels tend to be about 15% larger than the
polonies on the original due to diffusion of the amplified DNA during amplification.
37
Applications of polony slides will capitalize on one or more of their four main
properties: cloning, immobilization, gel imbedding, and in situ amplification. Many
recombinant DNA cloning procedures typically done at low density on petri plates can
now be done on chips. As many as 5 million clones per slide could be sequenced in
parallel using a sequencing-by-synthesis method such as pyrosequencing, which is
known to accurately sequence 40 bp of a PCR product (10). This is usually adequate for
gene identification or minisequencing (11). A new sequencing-by-synthesis method,
solid-phase fluorescent in situ sequencing extension quantitation (FISSEQ), would appear
particularly suitable (Mitra R.D and Church G.M. in preparation). In this technique, the
DNA is extended by adding a single type of fluorescently labeled nucleotide triphosphate
to the reaction, washing away unincorporated nucleotide, detecting incorporation of the
nucleotide by measuring fluorescence, and repeating the cycle until synchrony is lost. At
each cycle, the fluorescence from previous cycles is bleached or digitally subtracted,
allowing one to deduce the sequence of each polony iteratively. Because the signal
registering successful dNTP incorporation is an immobilized fluorophore, rather than a
rapidly diffusing pyrophosphate, one can uncouple base addition from scanning and can
use off-the-shelf microarray scanners.
The ability to sequence polonies in situ would enable the rapid resequencing or
possibly de novo sequencing of small genomes. Polony technology could also be used to
measure whole genome RNA or DNA expression. For example, a cDNA library derived
from the isolated RNA of interest could be used as template in a polony reaction.
FISSEQ could be performed to determine enough sequence information to assign a
unique expression tag to each polony. Then one could simply count the relative number
38
of polonies of each tag sequence, and thereby determine the gene's relative expression
level. Alternately, one could make duplicates of the sequenced polony slide, hybridize
fluorescently labeled mRNA or cRNA preparations, and quantify the amount of
fluorescence at each polony. Hybridization in this type of gel-based format provides a
1000-fold increase in DNA layer thickness when compared to DNA attached to a surface,
increasing signal per unit area (12). The high efficiency of polony amplification may
allow one to measure whole genome mRNA expression from a single cell. Another
advantage of this type of gel format is that it is compatible with miniature gel
electrophoretic methods (6,13).
Acknowledgements
We thank John Aach for help with the polony growth computer simulations, and Tali
Mitra for help with figures. We thank the members of the Church lab for helpful
discussions and critical reading of the manuscript. This work was supported by the US
Department of Energy (grant no. DE-FG02-87-ER60565).
39

1. Sanger F, N. S., Coulson AR. (1977) Proc Natl Acad Sci USA, 74(12), 5463-7.
2. Chee, M., Yang, R., Hubbell, E., Berno, A., Huang, X. C., Stem, D., Winkler, J.,
Lockhart, D. J., Morris, M. S. and Fodor, S. P. A. (1996) Science, 274(5287), 610-614.
3. Drmanac, S., Kita, D., Labat, I., Hauser, B., Schmidt, C., Burczak, J. D. and
Drmanac, R. (1998) Nature Biotechnology, 16, 54-58.
4. Parinov, S., Barsky, V., Yershov, G., Kirillov, E., Timofeev, E., Belgovskiy, A.,
and Mirzabekov, A. (1996) Nucleic Acids Res, 24, 2998-3004.
5. Ronaghi, M., Uhlen, M. and Nyren, P. (1998) Science, 281, 363-365.
6. Kenney, M., Ray, S. and Boles, T. (1998) Biotechniques, 25(3), 516-521.
7. Chetverina, H. V. and Chetverin, A. B. (1993) Nucleic Acids Research, 21(10),
2349-2353.
8. Lockley, A., Jones, C., Bruce, J., Franklin, S. and Bardsley, R. (1997) Nucleic
Acids Res, 25(6), 1313-1314.
9. Singer, B. S., Shtatland, T., Brown, D. and Gold, L. (1997) Nucleic Acids
Research, 25(4), 781-786.
10. Ronaghi, M., Karamohamed, S., Pettersson, B., Uhlen, M. and Nyren, P. (1996)
Analytical Biochemistry, 242, 84-89.
11. Syvanen, A. (1999) Human Mutation, 13(1), 1-10.
12. Fotin, A., Drobyshev, A., Proudnikov, D., Perov, A. and Mirzabekov, A. (1998)
Nucleic Acids Research, 26(6), 1515-1521.
13. Stein, A., Hill, S., Cheng, Z. and Bina, M. (1998) Nucleic Acids Research, 26(2),
452-455.
40

Chapter 3
Fluorescent In Situ Sequencing of Polonies
41
Introduction
In chapter 2, it was shown that as many as 5 million individual, linear DNA
fragments can be cloned and amplified by growing polonies in a polyacrylamide film
attached to a glass microscope slide. Each polony contains 10A8 identical molecules of
DNA amplified from a single template molecule. One strand of the amplified DNA can
be covalently attached to the polyacrylamide matrix, allowing washing and further
enzymatic manipulation. This chapter describes progress in developing a technology to
sequence these polonies by a new sequencing by synthesis method, fluorescent in situ
sequencing extension quantitation (FISSEQ).
Sequencing polony DNA by FISSEQ involves several steps. First, the polonies
are made single stranded by heat denaturation, and a sequencing primer is annealed.
Next, DNA polymerase and a single type of deoxynucleotide triphosphate (e.g. dATP)
are added to the polyacrylamide matrix. If the added nucleotide is complementary to the
template base immediately 3' of the primer for any given polony, the polymerase will
incorporate the base into that polony. A fraction of the dATP is labeled with a fluorescent
dye, so that polonies that have incorporated the added base will fluoresce when the slide
is scanned with a confocal scanning microscope. After scanning, the fluorescence is
removed by cleaving the linker between the dye and the nucleotide, and another
extension reaction is performed with a different deoxynucleotide triphosphate (One can
also perform another extension reaction without chemically removing the fluorescence
from the previous cycle. Instead, the fluorescence from previous cycles can be subtracted
digitally). In this fashion, many cycles of extension are repeated and the sequence of all
the polonies on the slide can be read by monitoring the fluorescence incorporation at each
42
step. Sequencing by this method is fast and cost effective, due to the inherent parallelism
of the technique, and due to the low reagent volume (lfemtoliter) per polony sequenced.
There are other sequencing technologies that may be appropriate for sequencing
polonies, such as sequencing by hybridization(1-3), MPSS(4,5), and pyrosequencing(6-
9). Pyrosequencing is a similar technology to FISSEQ in that DNA templates are
sequenced by single base extensions. However, unlabeled deoxynucleotides are used;
incorporation is detected by measuring the pyrophosphate released via a light emitting
enzymatic reaction. Accurate reads of up to 50 bases from the primer have been
demonstrated in 96 well plates. This technology may be suitable for polony sequencing
if the diffusion of the free pyrophosphate is slow enough such that individual polonies
can be distinguished during the chemiluminescent detection. MPSS and sequencing by
hybridization are, in principle, compatible with polony technology. However, read
lengths beyond 16 bases have not been demonstrated with MPSS, and sequencing by
hybridization would require a very large number of hybridizations and scans to sequence
a polony slide.
Results
To investigate whether FISSEQ technology would be useful for sequencing
polonies, we first determined whether DNA polymerase could correctly extend a primer
annealed to a gel-immobilized template upon the addition of a single deoxynucleotide
triphosphate. As a model system, we synthesized four oligonucleotides with 5' acrydite
groups(1O) and co-polymerized them with acrylamide monomer and crosslinker on a
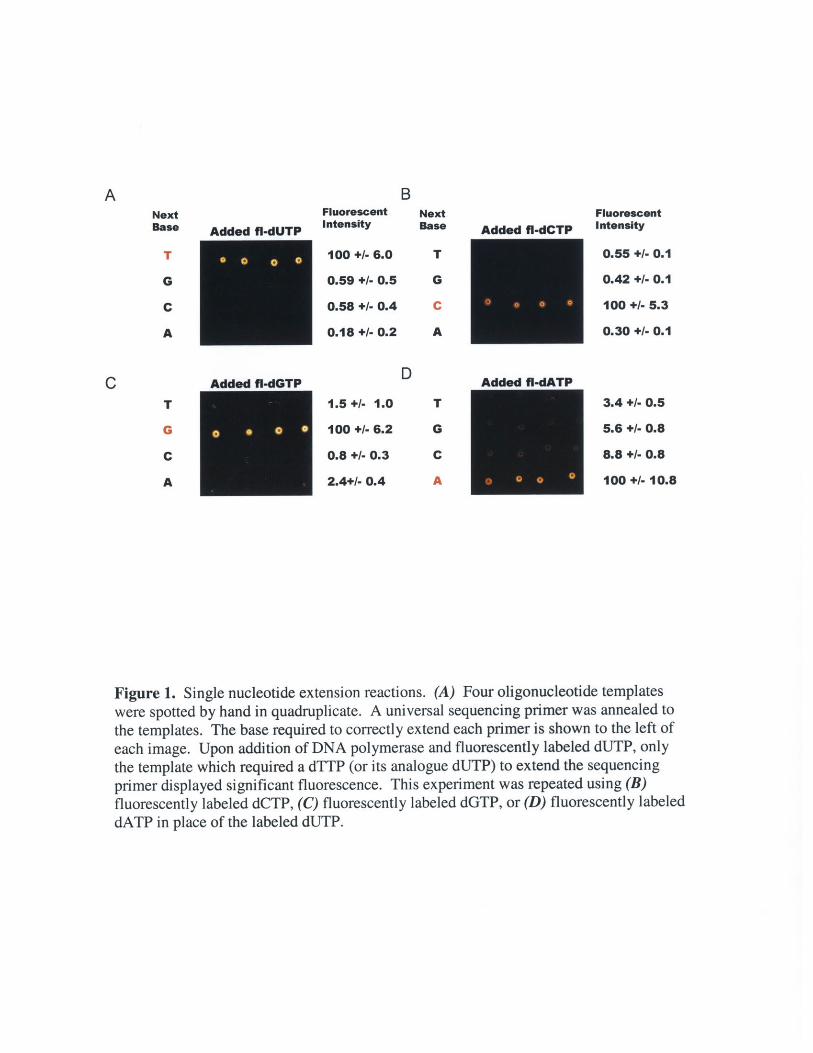
glass microscope slide (Figure 1). Each sample was spotted on the slide in quadruplicate,
43
Added fi-dUTP
BFluorescent NextIntensity Base
100 +/- 6.0
0.59 +/- 0.5
0.58 +/- 0.4
0.18 +/- 0.2
Added fi-dCTP
T
G
C
A
FluorescentIntensity
0.55 +/- 0.1
0.42 +/- 0.1
100 +/- 5.3
0.30 +/- 0.1
DAdded fl-dGMTP Added fl-dATP
T
G
C
A
1.5+/- 1.0
100 +/- 6.2
0.8 +/- 0.3
2.4+/- 0.4
T
G
C
A
3.4 +/- 0.5
5.6 +/- 0.8
8.8 +/- 0.8
100 +/- 10.8
Figure 1. Single nucleotide extension reactions. (A) Four oligonucleotide templateswere spotted by hand in quadruplicate. A universal sequencing primer was annealed tothe templates. The base required to correctly extend each primer is shown to the left ofeach image. Upon addition of DNA polymerase and fluorescently labeled dUTP, onlythe template which required a dTTP (or its analogue dUTP) to extend the sequencingprimer displayed significant fluorescence. This experiment was repeated using (B)fluorescently labeled dCTP, (C) fluorescently labeled dGTP, or (D) fluorescently labeleddATP in place of the labeled dUTP.
A NtNextBase
T
G
C
A
C
so that each row of four spots on the microscope slide represented a different template
molecule. A sequencing primer was annealed, and a solution containing DNA
polymerase and a single type of fluorescently labeled deoxynucleotidetriphosphate
(dNTP) was added to the surface of the slide. As expected, only the oligonucleotide that
contained a base immediately 3' of the sequencing primer that was complementary to the
added nucleotide displayed significant incorporation (figure 1). From this we concluded
that DNA polymerase can extend templates immobilized in a polyacrylamide matrix and
that this reaction occurs only if the added nucleotide is complementary to the next base.
Because FISSEQ requires a number of sequential base extensions, the
incorporation of the correct base must be a highly efficient reaction. For example, if only
85% of the primer:template molecules are extended each time a correct base is added,
then after 6 extensions, only (0.85)A6 = 38% of the primer:template molecules will have
correctly incorporated the added nucleotides. The remaining 62% of the molecules will
be "out of phase" because they did not incorporate the correct base at an earlier cycle. To
estimate the efficiency of nucleotide incorporation by DNA polymerase, immobilized
oligonucleotide templates were spotted on three glass slides as described above, and a
sequencing primer was annealed. One template required dTTP addition for correct
incorporation (or its analogue dUTP). The other, a negative control, required the addition
of dCTP for correct incorporation. Two of the three glass slides were incubated with
unlabeled dTTP and Klenow DNA polymerase, one for 90 seconds the other for 360
seconds and then washed to remove unincorporated nucleotide. Cy5 labeled dUTP and
polymerase were then added to all three slides, and the amount of fluorescent signal on
each slide was compared to estimate how efficiently the unlabeled dTTP was
44
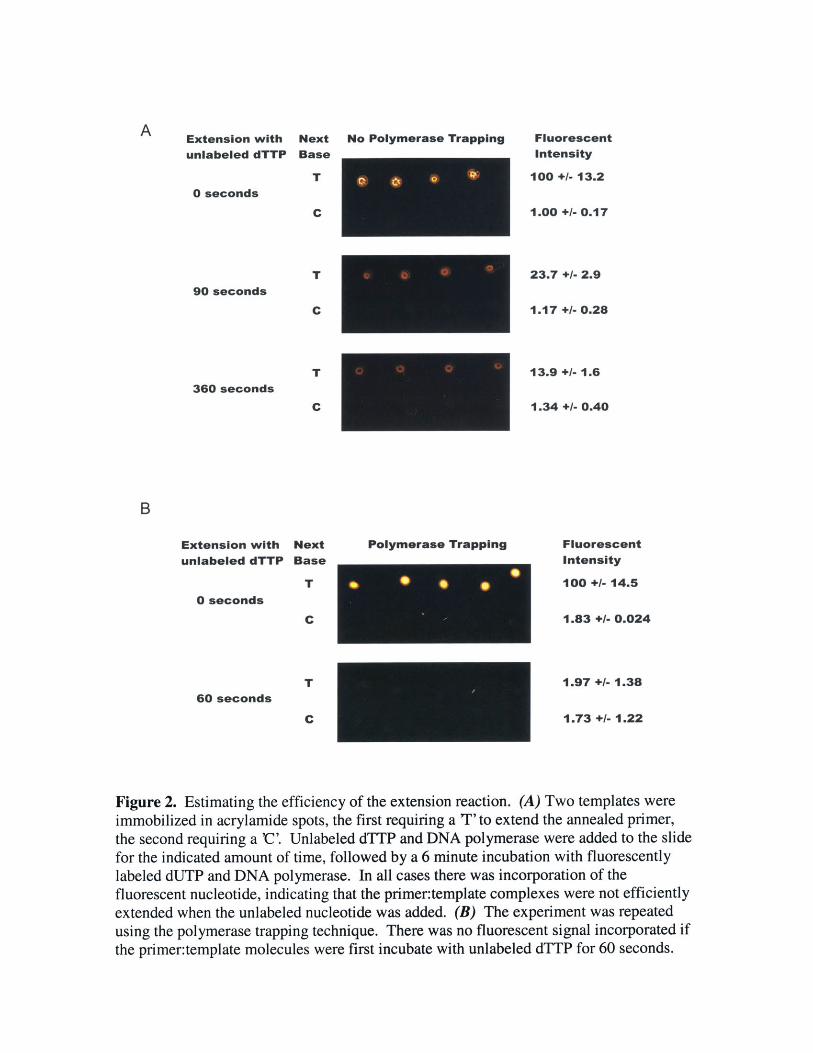
incorporated (figure 2a). If the extension reactions went to completion, we would expect
to see no fluorescent signal on the slides that were incubated with unlabeled dTTP before
the fluorescent extension. While increased incubation times with unlabeled dTTP did
decrease the amount of fluorescent dUTP incorporated, even after 6 minutes there was
still significant incorporation, indicating that the incorporation of dTTP did not go to
completion. By quantifying the fluorescence, we estimated the efficiency of the 6 minute
dTTP extension to be approximately 85%, which, as discussed above, is too low a value
to sequence more than just a few bases. Allowing the reaction to proceed for longer
times did not significantly improve the extension efficiency. To address this issue, we
developed a technique called "polymerase trapping", in which DNA polymerase is
allowed to bind to the primer:template molecule, acrylamide monomer is added to the
reaction, and polymerization is initiated, trapping the polymerase in a complex with the
primer:template molecule. The polyacrylamide matrix prevents the polymerase from
diffusing away from the primer:template, so that every primer that is extended during the
first cycle of extension will continue to be extended at later cycles. We repeated the
experiment described above using polymerase trapping and estimated that 99.8% of the
molecules that have a polymerase molecule trapped on them are correctly extended
(Figure 2b). Trapping the polymerase within a polyacrylamide matrix also has the
advantage that the enzyme does not need to be replenished every time a nucleotide
addition is performed. In fact, we have shown that polymerase trapped in acrylamide can
be washed in buffer for 4.5 hours without a detectable loss in activity.
To establish that templates could be subjected to multiple rounds of nucleotide
extensions, we spotted two oligonucleotide templates in quadruplicate on glass
45
Extension with
unlabeled dTTPNextBase
T
No Polymerase Trapping
0 seconds
C
FluorescentIntensity
100 +/- 13.2
1.00 +/- 0.17
90 seconds
360 seconds
T
C
T
C
23.7 +/- 2.9
1.17 +/- 0.28
13.9 +/- 1.6
1.34 +/- 0.40
Extension withunlabeled dTTP
NextBase
T
Polymerase Trapping
0 seconds
C
FluorescentIntensity
100 +/- 14.5
1.83 +/- 0.024
60 secondsT
C
1.97 +1- 1.38
1.73 +/- 1.22
Figure 2. Estimating the efficiency of the extension reaction. (A) Two templates wereimmobilized in acrylamide spots, the first requiring a T'to extend the annealed primer,the second requiring a 'C'. Unlabeled dTTP and DNA polymerase were added to the slidefor the indicated amount of time, followed by a 6 minute incubation with fluorescentlylabeled dUTP and DNA polymerase. In all cases there was incorporation of thefluorescent nucleotide, indicating that the primer:template complexes were not efficientlyextended when the unlabeled nucleotide was added. (B) The experiment was repeatedusing the polymerase trapping technique. There was no fluorescent signal incorporated ifthe primer:template molecules were first incubate with unlabeled dTTP for 60 seconds.
A
B
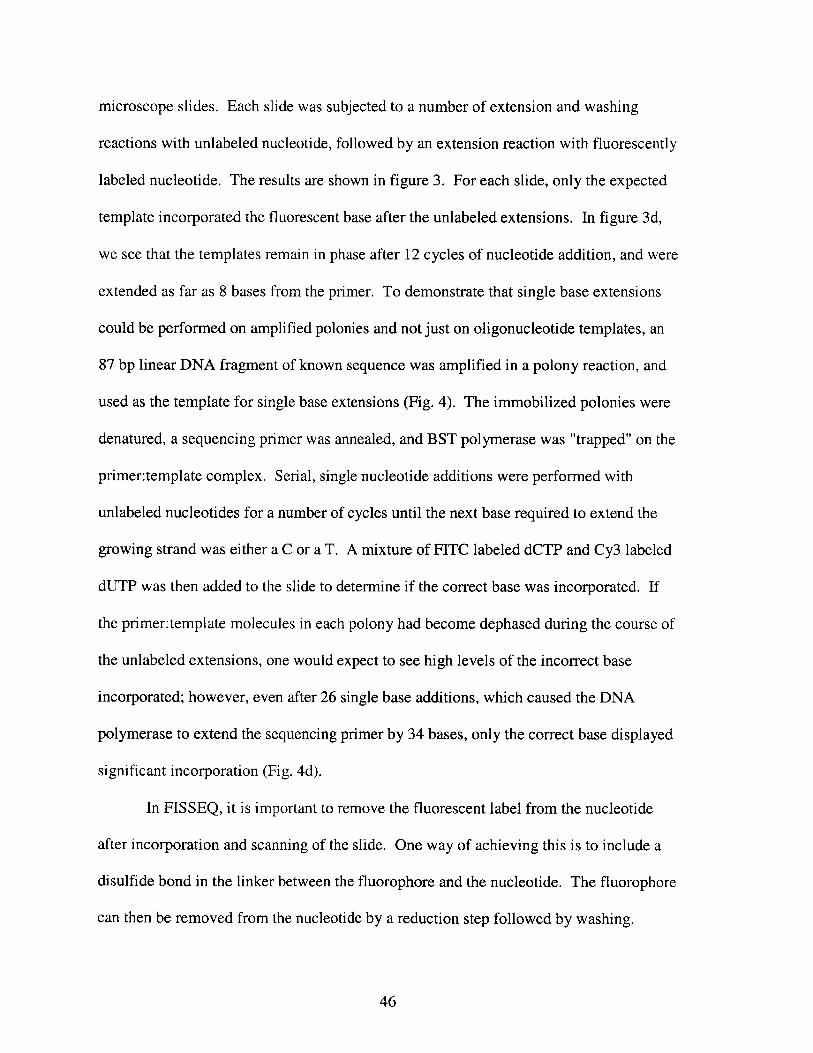
microscope slides. Each slide was subjected to a number of extension and washing
reactions with unlabeled nucleotide, followed by an extension reaction with fluorescently
labeled nucleotide. The results are shown in figure 3. For each slide, only the expected
template incorporated the fluorescent base after the unlabeled extensions. In figure 3d,
we see that the templates remain in phase after 12 cycles of nucleotide addition, and were
extended as far as 8 bases from the primer. To demonstrate that single base extensions
could be performed on amplified polonies and not just on oligonucleotide templates, an
87 bp linear DNA fragment of known sequence was amplified in a polony reaction, and
used as the template for single base extensions (Fig. 4). The immobilized polonies were
denatured, a sequencing primer was annealed, and BST polymerase was "trapped" on the
primer:template complex. Serial, single nucleotide additions were performed with
unlabeled nucleotides for a number of cycles until the next base required to extend the
growing strand was either a C or a T. A mixture of FITC labeled dCTP and Cy3 labeled
dUTP was then added to the slide to determine if the correct base was incorporated. If
the primer:template molecules in each polony had become dephased during the course of
the unlabeled extensions, one would expect to see high levels of the incorrect base
incorporated; however, even after 26 single base additions, which caused the DNA
polymerase to extend the sequencing primer by 34 bases, only the correct base displayed
significant incorporation (Fig. 4d).
In FISSEQ, it is important to remove the fluorescent label from the nucleotide
after incorporation and scanning of the slide. One way of achieving this is to include a
disulfide bond in the linker between the fluorophore and the nucleotide. The fluorophore
can then be removed from the nucleotide by a reduction step followed by washing.
46
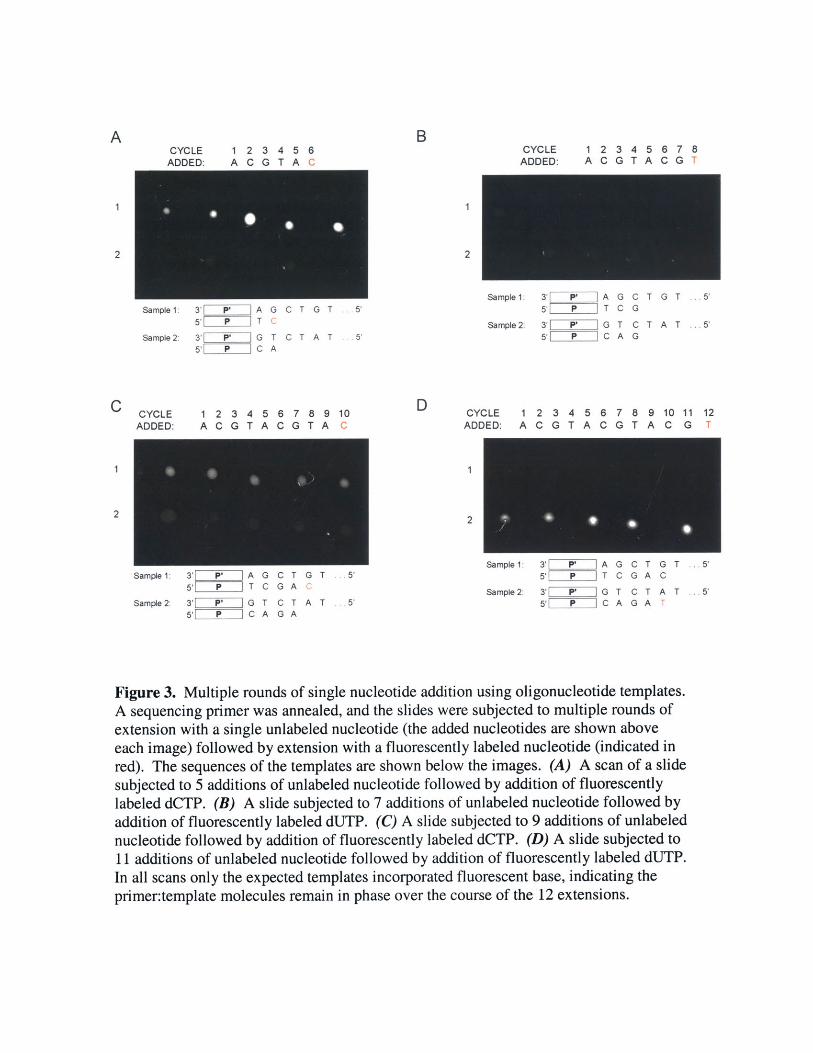
ACYCLE 1 2 3 4 5 6
ADDED: A C G T A C
BCYCLE 1 2 3 4 5 6 7 8
ADDED: A C G T A C G T
2
Sample 1: 3' A5' T
Sample 2: 3' P' G5'ZIP | C
G C T G T ... 5'C
T C T A T .. . 5'A
DCYCLE 1 2 3 4 5 6 7 8 9 10
ADDED: A C G T A C G T A C
Sample 1: 3'L P' |Z A G C T G T ... 5'5'sE P I T C G
Sample 2: 3'Z P' G T C T A T ... 5'5'L P | C A G
CYCLE 1 2 3 4 5 6 7 8 9 10 11 12ADDED: ACGTACGTA C G T
1
2
Sample 1: 3'L P' | A G C T G T ... 5'5'ZIPIZ T C G A C
Sample 2: 3'LIP' | G T C T A T . .. 5'5'LIPIZ C A G A
Sample 1: 3'L P' |i A G C T G T ... 5'5'ZZEZ T C G A C
Sample 2: 3'Z P' G T C T A T ... 5'5'ZZPZ C A G A T
Figure 3. Multiple rounds of single nucleotide addition using oligonucleotide templates.A sequencing primer was annealed, and the slides were subjected to multiple rounds ofextension with a single unlabeled nucleotide (the added nucleotides are shown aboveeach image) followed by extension with a fluorescently labeled nucleotide (indicated inred). The sequences of the templates are shown below the images. (A) A scan of a slidesubjected to 5 additions of unlabeled nucleotide followed by addition of fluorescentlylabeled dCTP. (B) A slide subjected to 7 additions of unlabeled nucleotide followed byaddition of fluorescently labeled dUTP. (C) A slide subjected to 9 additions of unlabelednucleotide followed by addition of fluorescently labeled dCTP. (D) A slide subjected to11 additions of unlabeled nucleotide followed by addition of fluorescently labeled dUTP.In all scans only the expected templates incorporated fluorescent base, indicating theprimer:template molecules remain in phase over the course of the 12 extensions.
2
C
2
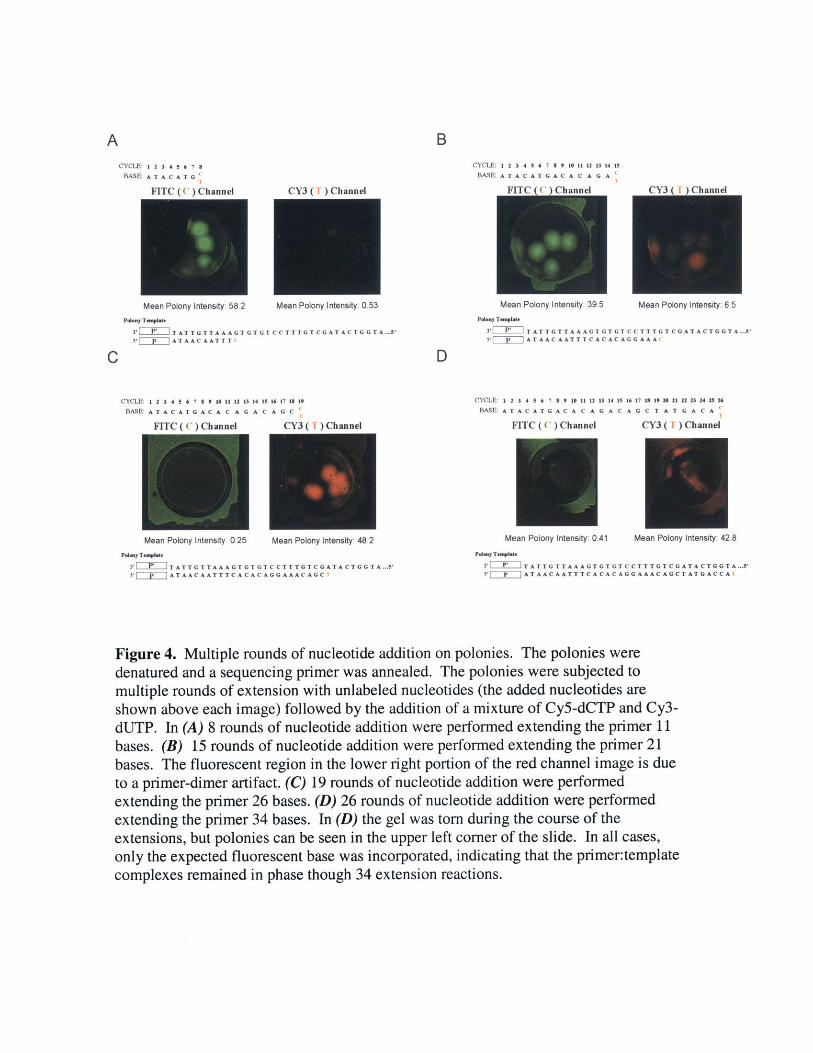
ACYCLE: 1 2 3 4 5 6 7
BASE: A T A C A T G
FITC ( C) Channel
B
CYCLE: 1 2 3 4 5 6 7 8 9 10 11 12 13 14 15BASE: A T A C A T G A C A C A G A
WTed f t dh e. .. . ICY3 (T ) Channel
Mean Polony Intensity: 58.2 Mean Polony Intensity: 0.53
Pdony Template
3' I |IATATTGTTAAAGTGTGT CCTTTGTCGATACTGGTA ... 5'5' PZZ A TA A C A AT T T
C
CYCLE: 1 2 3 4 5 6 7 8 9 10 11 12 13 14 15 16 17 18 19
BASE: A T A C A T G A C A C A G A C A G C
FTTC ( C 'iChannel CY3 ( T l Channel
Mean Polony Intensity: 39.5 Mean Polony Intensity: 6.5Pony Template
3'LP'i TAT TGT TAAAGT GT GT CC TTTGT CGATA CTGGTA .5'
5' L 1 A TA A CA AT T T CA CA C AG GA A A
D
CYCLE: 1 2 3 4 5 6 7 8 9 10 11 12 13 14 15 16 17 13 19 20 21 22 23 24 25 26BASE: A T A C A T G A C A C A G A C A G C T A T G A C A
FITC ( C ) Channel CY3 ( T ) Channel
Mean Polony Intensity: 0.25 Mean Polony Intensity: 48.2Palmy Template
3'LIiZ|T ATTGT TAAAGTGT GTCCTT TGTCGATACTGGTA ..5'5' ATAACAATT TCA CACAGGAAACAGCI
Mean Polony Intensity: 0.41 Mean Polony Intensity: 42.8
Pdy Template
3'L PU'IT ATTGTTAAAGTGT GT C CTT TGTCGATA CTGGTA...5'5' P ATA A CA AT T T C A C A C G G C G C TAT GA C C Al
Figure 4. Multiple rounds of nucleotide addition on polonies. The polonies weredenatured and a sequencing primer was annealed. The polonies were subjected tomultiple rounds of extension with unlabeled nucleotides (the added nucleotides areshown above each image) followed by the addition of a mixture of Cy5-dCTP and Cy3-dUTP. In (A) 8 rounds of nucleotide addition were performed extending the primer 11bases. (B) 15 rounds of nucleotide addition were performed extending the primer 21bases. The fluorescent region in the lower right portion of the red channel image is dueto a primer-dimer artifact. (C) 19 rounds of nucleotide addition were performedextending the primer 26 bases. (D) 26 rounds of nucleotide addition were performedextending the primer 34 bases. In (D) the gel was torn during the course of theextensions, but polonies can be seen in the upper left corner of the slide. In all cases,only the expected fluorescent base was incorporated, indicating that the primer:templatecomplexes remained in phase though 34 extension reactions.
A
f'V*A 1 '1 1 Ph-...
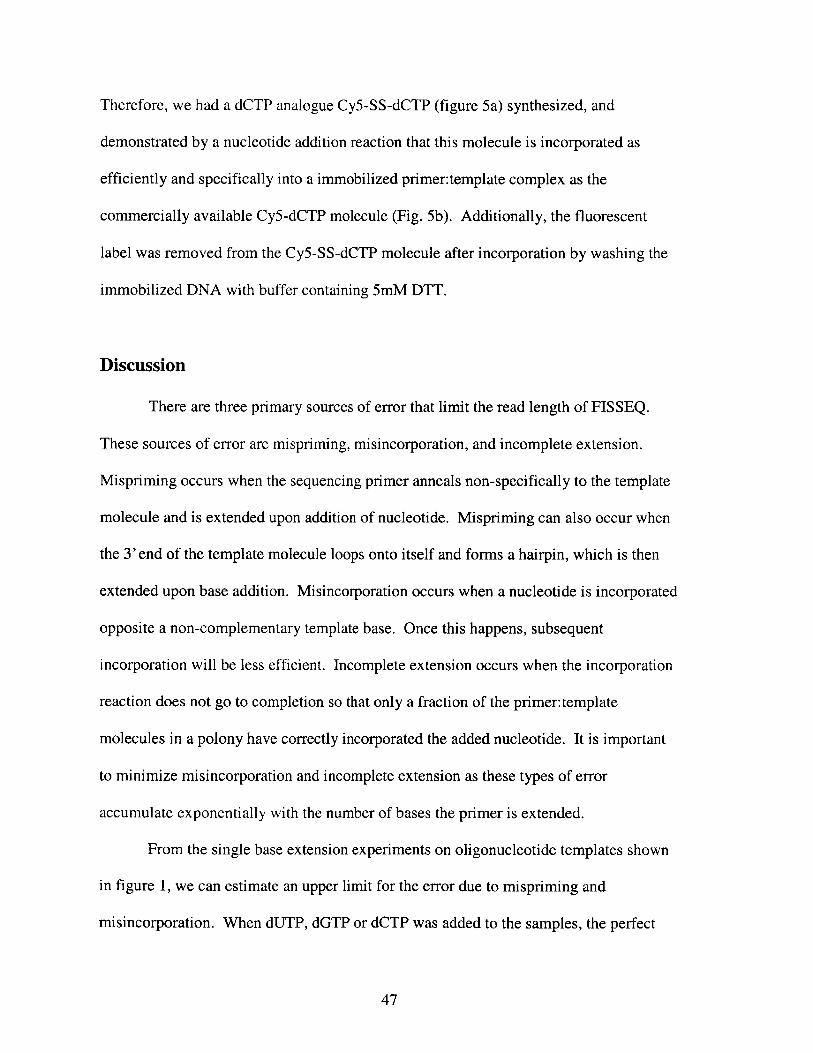
Therefore, we had a dCTP analogue Cy5-SS-dCTP (figure 5a) synthesized, and
demonstrated by a nucleotide addition reaction that this molecule is incorporated as
efficiently and specifically into a immobilized primer:template complex as the
commercially available Cy5-dCTP molecule (Fig. 5b). Additionally, the fluorescent
label was removed from the Cy5-SS-dCTP molecule after incorporation by washing the
immobilized DNA with buffer containing 5mM DTT.
Discussion
There are three primary sources of error that limit the read length of FISSEQ.
These sources of error are mispriming, misincorporation, and incomplete extension.
Mispriming occurs when the sequencing primer anneals non-specifically to the template
molecule and is extended upon addition of nucleotide. Mispriming can also occur when
the 3'end of the template molecule loops onto itself and forms a hairpin, which is then
extended upon base addition. Misincorporation occurs when a nucleotide is incorporated
opposite a non-complementary template base. Once this happens, subsequent
incorporation will be less efficient. Incomplete extension occurs when the incorporation
reaction does not go to completion so that only a fraction of the primer:template
molecules in a polony have correctly incorporated the added nucleotide. It is important
to minimize misincorporation and incomplete extension as these types of error
accumulate exponentially with the number of bases the primer is extended.
From the single base extension experiments on oligonucleotide templates shown
in figure 1, we can estimate an upper limit for the error due to mispriming and
misincorporation. When dUTP, dGTP or dCTP was added to the samples, the perfect
47
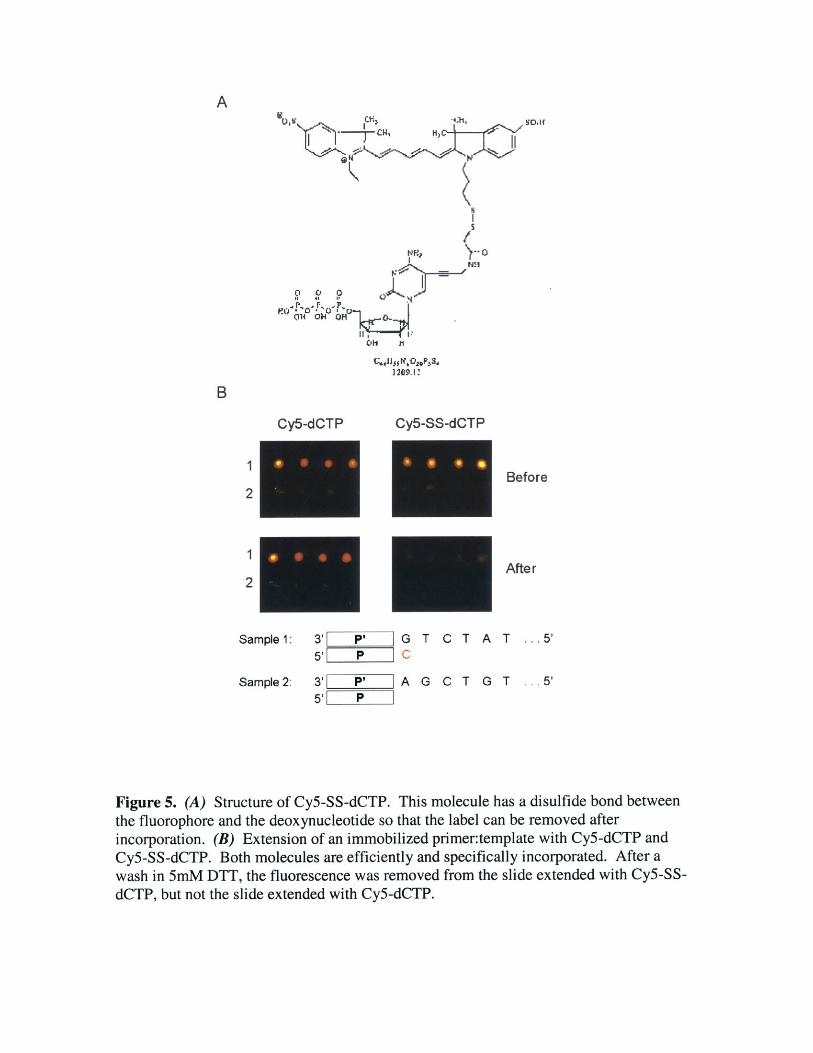
A
clii-CHI H)
I
0o C' 0 J;
VH
r r, - '.D,.P3S
ollob4OM!
B
Cy5-SS-dCTP
Before
After
Sample 1: 3' PI G5'1 P C
Sample 2: 3' P'= A5'1 P I
T C T A T
G C T G T
Figure 5. (A) Structure of Cy5-SS-dCTP. This molecule has a disulfide bond betweenthe fluorophore and the deoxynucleotide so that the label can be removed afterincorporation. (B) Extension of an immobilized primer:template with Cy5-dCTP andCy5-SS-dCTP. Both molecules are efficiently and specifically incorporated. After awash in 5mM DTT, the fluorescence was removed from the slide extended with Cy5-SS-dCTP, but not the slide extended with Cy5-dCTP.
Cy5-dCTP
1
2
1
2
*..5'
.. 5'
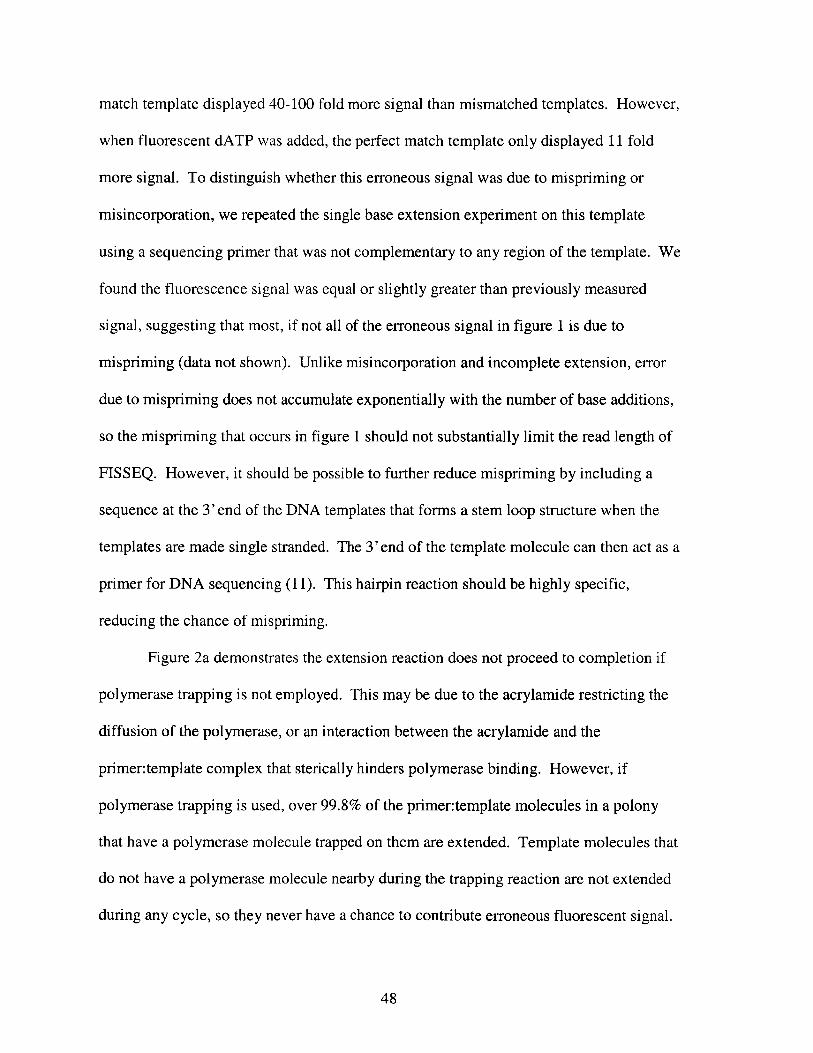
match template displayed 40-100 fold more signal than mismatched templates. However,
when fluorescent dATP was added, the perfect match template only displayed 11 fold
more signal. To distinguish whether this erroneous signal was due to mispriming or
misincorporation, we repeated the single base extension experiment on this template
using a sequencing primer that was not complementary to any region of the template. We
found the fluorescence signal was equal or slightly greater than previously measured
signal, suggesting that most, if not all of the erroneous signal in figure 1 is due to
mispriming (data not shown). Unlike misincorporation and incomplete extension, error
due to mispriming does not accumulate exponentially with the number of base additions,
so the mispriming that occurs in figure 1 should not substantially limit the read length of
FISSEQ. However, it should be possible to further reduce mispriming by including a
sequence at the 3'end of the DNA templates that forms a stem loop structure when the
templates are made single stranded. The 3'end of the template molecule can then act as a
primer for DNA sequencing (11). This hairpin reaction should be highly specific,
reducing the chance of mispriming.
Figure 2a demonstrates the extension reaction does not proceed to completion if
polymerase trapping is not employed. This may be due to the acrylamide restricting the
diffusion of the polymerase, or an interaction between the acrylamide and the
primer:template complex that sterically hinders polymerase binding. However, if
polymerase trapping is used, over 99.8% of the primer:template molecules in a polony
that have a polymerase molecule trapped on them are extended. Template molecules that
do not have a polymerase molecule nearby during the trapping reaction are not extended
during any cycle, so they never have a chance to contribute erroneous fluorescent signal.
48

Figure 4 demonstrates that as many as 34 extensions can be carried out without
significant dephasing of the templates. Further extensions were not performed due to
time considerations, but the best estimate is that the primer can be extended 100 bases
before significant dephasing occurs.
Figure 5b demonstrates that by using a nucleotide analogue with a disulfide bond
in the linker between the fluorescent tag and the base, the fluorophore can be efficiently
removed after incorporation and scanning. This will allow multiple rounds of
incorporation and quantitation to be performed on the same slide.
The development of software that takes the scanned images of polonies acquired
during the FISSEQ protocol and outputs a sequence file is an important future direction
of this work. If the polonies are restricted to a known grid, it would simplify pattern
recognition and alignment of images from cycle to cycle. Forming polonies on a grid of
isolated acrylamide islands not only simplifies image processing, but it also allows a high
density of polonies to be achieved with short DNA templates and/or a more porous
acrylamide matrix, since the maximum dimension of a polony is limited by the size of the
island. This approach would have two other potential benefits. One is that low
molecular weight, highly diffusable primer-dimer artifacts are restricted to a small area.
The other is that contact replicas can be made without spreading of polony size.
We are now pursuing four methods to create ordered polony islands: a.)
photogelation of acrylamide initiated by riboflavin and light through a chromium
mask(12). b.) laser etching of 10 to 100 micron thick polyacrylamide slab, c.)
discontinuous dewetting of acrylamide into cylindrical holes formed in elastomers such
as polydimethylsiloxane (PDMS)(13). d.) forming arrays of hydrophilic islands on a
49
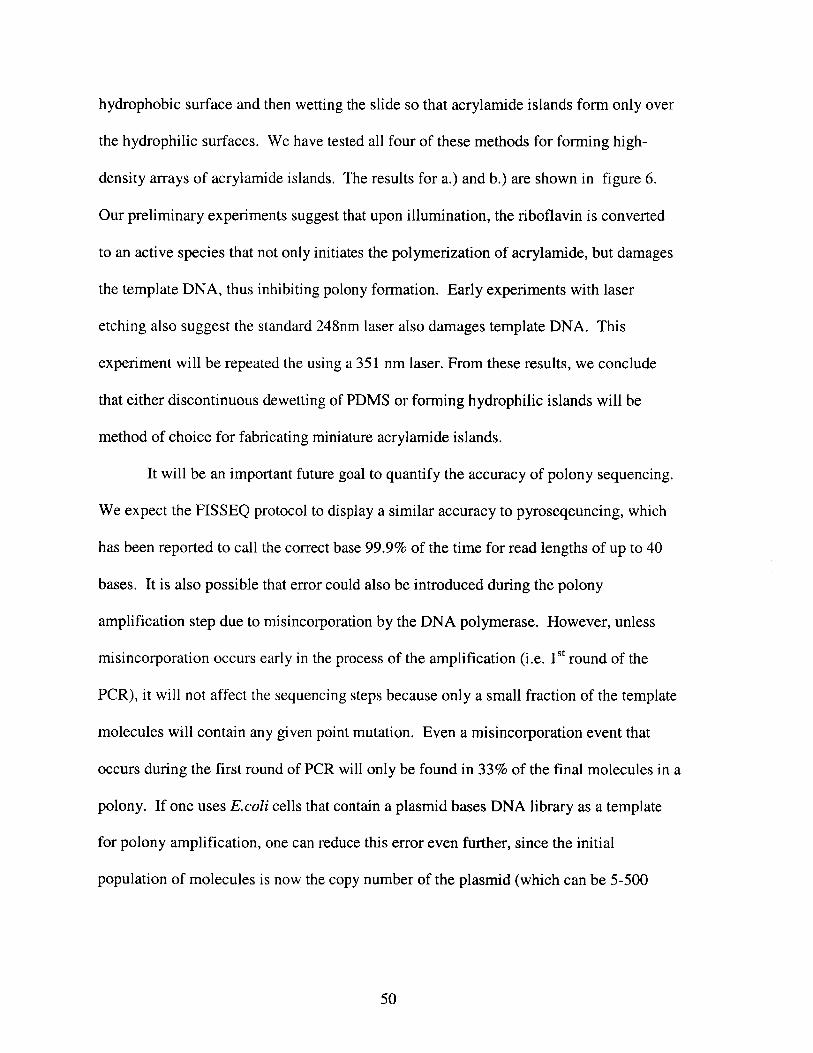
hydrophobic surface and then wetting the slide so that acrylamide islands form only over
the hydrophilic surfaces. We have tested all four of these methods for forming high-
density arrays of acrylamide islands. The results for a.) and b.) are shown in figure 6.
Our preliminary experiments suggest that upon illumination, the riboflavin is converted
to an active species that not only initiates the polymerization of acrylamide, but damages
the template DNA, thus inhibiting polony formation. Early experiments with laser
etching also suggest the standard 248nm laser also damages template DNA. This
experiment will be repeated the using a 351 nm laser. From these results, we conclude
that either discontinuous dewetting of PDMS or forming hydrophilic islands will be
method of choice for fabricating miniature acrylamide islands.
It will be an important future goal to quantify the accuracy of polony sequencing.
We expect the FISSEQ protocol to display a similar accuracy to pyroseqeuncing, which
has been reported to call the correct base 99.9% of the time for read lengths of up to 40
bases. It is also possible that error could also be introduced during the polony
amplification step due to misincorporation by the DNA polymerase. However, unless
misincorporation occurs early in the process of the amplification (i.e. 1st round of the
PCR), it will not affect the sequencing steps because only a small fraction of the template
molecules will contain any given point mutation. Even a misincorporation event that
occurs during the first round of PCR will only be found in 33% of the final molecules in a
polony. If one uses E.coli cells that contain a plasmid bases DNA library as a template
for polony amplification, one can reduce this error even further, since the initial
population of molecules is now the copy number of the plasmid (which can be 5-500
50
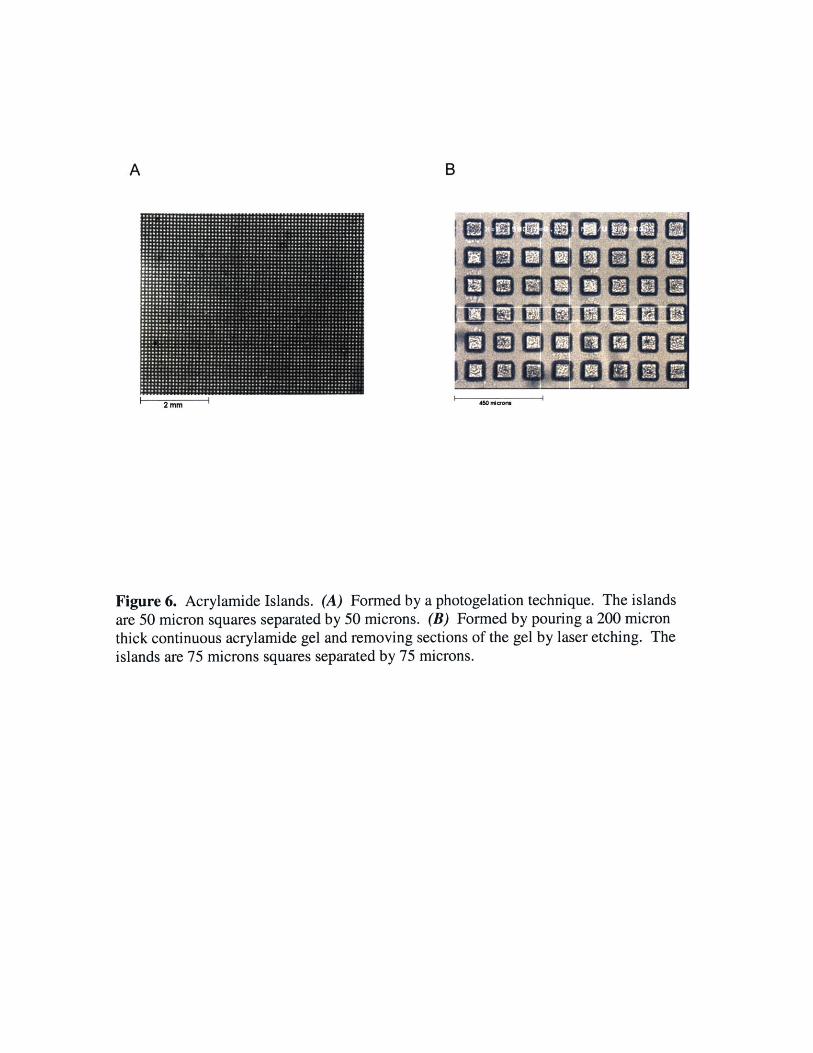
A B
2 MM 450 rncorm
Figure 6. Acrylamide Islands. (A) Formed by a photogelation technique. The islandsare 50 micron squares separated by 50 microns. (B) Formed by pouring a 200 micronthick continuous acrylamide gel and removing sections of the gel by laser etching. Theislands are 75 microns squares separated by 75 microns.
copies) so that even a misincorporation during the first round of PCR will not contribute
significant sequence error.
Immediate goals are to have the remaining Cy5-SS-dNTP's synthesized and test
the FISSEQ protocol using all 4 fluorescent nucleotides. We will attempt to determine
the base calling accuracy as a function of the number of bases read from the end of the
sequencing primer. In addition, we plan to design and construct an integrated fluidics
and optical system that will automate the FISSEQ protocol.
Materials and Methods
Primers and Oligonucleotide templates
All oligonucleotides were obtained from Operon (CA). The oligonucleotide
templates used in this work are listed below. The region of each template complementary
to the sequencing primer is listed in bold. Template OT1, 5'-Qtc aag ctg cgc aac tgt tgg
gaa ggg cga tcg gct taa aca gac gct cga gac cgg gc-3'. Template OT2, 5'-Qtg gcg taa tca
tgg tca tag ctg ttt cct gtg tga act aaa cag acg ctc gag acc ggg c -3'. Template OT3, 5'-
Qtc ggc caa cgc gcg ggg aga ggc ggt ttg cgt atc agt aaa cag acg ctc gag acc ggg c - 3'.
Template OT4, 5'-Qcc cag tca cga cgt tgt aaa acg acg gcc agt gtc gat aaa cag acg ctc gag
acc ggg c -3'.
The following primers were used in this work: primer Seql, 5'-gcc cgg tct cga gcg
tct gtt ta-3'. Primer PRi-Fac 5'Qcca cta cgc ctc cgc ttt cct ctc. Primer PR1-R 5'ctg ccc
cgg gtt cct cat tct ct. Primer mLC1-F 5'cca cta cgc ctc cgc ttt cct ctc tgc aag ctt ggc gta
atc atg gtc a-3'. Primer mLC1-R 5'ctg ccc cgg gtt cct cat tct cta taa caa ttt cac aca gga a -
3'
51
All oligonucleotide templates and the primer PRI-Fac have Acrydite
modifications (Mosaic Technologies) at their 5'ends (designated by the character Q in
the sequences listed above.
Single nucleotide extensions using oligonucleotide templates
1 pl of 10gM Oligonucleotide template OT4 was added to 4 g1 of dH20 and 5 g1
of 2x acyrlamide mix (25% glycerol, 1.6% TEMED, 6ng/ml riboflavin, and 7.96%
acrylamide, 0.4% bis-acrylamide). 0.2 R1 of this mixture was hand-spotted in
quadruplicate onto 4 glass microscope slides (Acrylate treated glass slide, CEL
associates). This procedure was repeated for the oligonucleotide templates OT3, OT2,
and OT1 so that each slide contained a 4 by 4 array of acrylamide spots, the first row
containing template OT4, the second OT3 and so on. The slides were then
photopolymerized under a 35 W fluorescent light bulb at a distance of 3 cm for 45
minutes.
Annealing mixture [Ix Sequenase buffer (USB), 0.25gM primer Seqi, 0.01%
triton X-100] was added to each slide. The slides were placed in a PTC-200 thermal
cycler (MJ Research) adapted for glass slides (16/16 twin tower block), and incubated for
1 minute at 95'C, then cooled at a rate 0.1 degrees/seconds to 55*C. The slides were
held at this temperature for 2 minutes and then washed in lx sequenase buffer that was
heated to 50'C.
Each slide was extended with a different fluorescently labeled nucleotide by
covering the acrylamide spots with 65 pl of extension mix and incubating the slides 2
minutes at room temperature. Labeled nucleotide (tetramethylrhodamine-dATP (NEN),
52
Cy3-dCTP (Amersham), tetramethylrhodamine-dGTP(NEN), or Cy5-dUTP
(Amersham)) was added to the slide in the following mixture: lx Sequenase buffer, 4mM
DTT, 100tg/ml BSA, 380ng/gl E.coli single stranded binding protein (United States
Biochemical), 0.01% triton X-100, 0.169 units/gl Sequenase V 2.0 (USB) and 0.5gM
labeled nucleotide. The slides were washed in 40mM Tris pH 7.5, 50mM NaCl, and
0.01% triton X-100 for 10 minutes, scanned using a Scanarray 4000 (GSI Luminomics),
and the fluorescence was quantified using the software package ImageQuant.
Estimating the efficiency of the extension reaction
For the experiments performed without using polymerase trapping,
oligonucleotide templates OT4 and OT2 were spotted on glass microscope slides as
described above. Unlabeled dTTP mix [Ix Sequenase buffer, 4mM DTT, 100pg/ml
BSA, 380ng/gl E.coli single stranded binding protein (United States Biochemical),
0.01% triton X-100, and 0.5gM dTTP] was added to the slide for 0, 90, or 360 seconds.
Each slide was then washed in 40mM Tris pH 7.5, 50mM NaCl, and 0.01% triton X-100
for 10 minutes. Cy5 labeled dUTP was then added to the slide [lx Sequenase buffer,
4mM DTT, 100gg/ml BSA, 380ng/gl E.coli single stranded binding protein (United
States Biochemical), 0.01% triton X-100, 0.5gM dTTP, and 0.169units/gl Sequenase
v2.0]. The slides were washed in 40mM Tris pH 7.5, 50mM NaCl, and 0.01% triton X-
100 for 10 minutes, and scanned as above.
For the experiments employing polymerase trapping, the primer Seqi was
annealed in separate reactions to the oligonucleotide templates OT4 and OT2. Equal
amounts of template and primer were annealed at a final concentration of 5gM in 1x
53
EcoPol buffer [10mM Tris-HCl pH 7.5, 5mM MgCl 2] by heating to 95 degrees for 1
minute, slowly cooling to 50 degrees at a rate of 0.1 degrees per second and holding the
reaction at 50 degrees for 5 minutes. The primer:template complex was then diluted by
adding 30ul Ix Ecopol buffer (NEB) and 2gl 500mM EDTA. 1 gl of each annealed
oligonucleotide was added to 17g1 of Acrylamide gel mixture (40mM Tris pH 7.3, 25%
glycerol, 1mM DTT, 6% Acrylamide (5% C), 17.4 units Sequenase version 2.0 (USB),
15 g/ml E.coli single stranded binding protein (USB), 0. 1mg/ml BSA). Then, 1 gl of
1.66% TEMED and g1p of 1.66% APS were added and 0.2g1 of each mixture was
pipetted onto two Acrylate treated microscope slides (CEL associates).
One slide was incubated with unlabeled dTTP mix (1x Sequenase buffer, 4mM
DTT, 100pg/ml BSA, 380ng/gl E.coli single stranded binding protein , 0.01% triton X-
100, and 0.5 M dTTP) for 60 seconds. Both slides were then incubated with Cy5-dUTP
mix (Ix Sequenase buffer, 4mM DTT, 100gg/ml BSA, 380ng/pl E.coli single stranded
binding protein , 0.01% triton X-100, and 0.5gM Cy5-dUTP) for 4 minutes. The slides
were then washed in 40mM Tris pH 7.5, 100mM NaCl, and 0.05% triton X-100 for 2 x 5
minutes and scanned.
Multiple round of single nucleotide addition on oligonucleotide templates
Templates OT4 (sample 1) and OT2 (sample 2) were immobilized in acrylamide
spots using the polymerase trapping technique described above. 4 slides were subjected
to multiple rounds of nucleotide addition by first adding unlabeled dATP mix (1x
sequenase buffer, 100pg/ml BSA, 0.01% triton X-100, 4mM DTT, and 0.5gM dATP)
and letting the extension reaction proceed for 2 minutes at room temperature. The slides
54
were then washed in 40mM Tris, pH7.5, 50mM NaCl, 1mM EDTA, 0.05% triton X-100
for 3 minutes followed by three 1 minute washes in Tris pH 7.5, 0.05% triton X-100.
Unlabeled dCTP, dGTP, and dTTP were added in an identical manner. After the
appropriate number of cycles, the samples were extended with Cy5-dCTP or Cy5-dUTP
by adding the labeled nucleotide mixture [Ix sequenase buffer, 100g/ml BSA, 0.01%
triton X-100, 4mM DTT, 0.2gM dCTP or dTTP, and 0.4gM Cy5-dCTP or Cy5-dUTP] to
the slide. The slides were scanned and quantified as above.
Multiple rounds of single nucleotide addition on polonies
The linear DNA cassette LC-1 was created as follows. The plasmid pUC 19 was
amplified in a PCR reaction. Fifty microliters of PCR mixture [10mM Tris-HCL pH 8.3,
50mM KCl, 0.01% gelatin, 1.5mM MgCl 2, 200 gM dNTPs, 0.5 pM primer mLC1-F, 0.5
pM primer mLC1-R, 2ng pUC19 plasmid, 2U Taq (Sigma)] was cycled in an MJ
research PTC-100 thermocycler as follows: denaturation (1min at 94'C), 5 cycles (10s at
94'C, 10 s at 55 0 C, 1 min at 72'C), 20 cycles (10s at 94*C, 1min at 68*C), and extension
(3 min at 72*C). The PCR product was purified using Qiaquick PCR purification
columns (Qiagen) and resuspended in dH20.
Between 10 and 50 molecules of template LC-1 were added to the polony
amplification mixture [10mM Tris-HCl pH 8.3, 50mM KCl, 0.0 1% gelatin, 1.5mM
MgCl 2, 200gM dNTPs, 1OU JumpStart Taq (Sigma), 5.91% acrylamide, 0.09% bis-
acrylamide, 0.5gM primer PRI-Fac, 0.5gM primer PR1-R, 0.1% tween 20,0.2% BSA].
Ammonium persulfate and temed were each added to the mixture, each at a final
concentration of 0.083%. A 15gm thick gel was poured on a glass microscope slide that
55
was partially covered with a teflon coating (Erie scientific). The teflon coating served as
a spacer between the glass surface of the slide and a 18mmxl8mm No. 2 glass coverslip
(VWR). The coverslip was overlaid with mineral oil and the slide cycled using the
following program: denaturation (2 minutes at 94C) 46 cycles (30s at 94'C, 30s at
56'C, 1min at 72'C), and extension (2 min at 72'C). The mineral oil was removed by
rinsing the slides in hexane and the coverslips were removed. The immobilized DNA
was denatured by incubating in 70'C denaturing buffer [70% formamide, 1x SSC] and
electrophoresing in 0.5x TBE with 42% urea for 1 hour at 5-10 v/cm. The slides were
washed 2x4minutes in 6x SSPE. The acrylamide gel was covered with a frame seal
chamber (MJ Research) and annealing mix [0.25gM PR1-R, 6x SSPE, 0.01% triton-
x100] was added over the gel. The slides were heated at 94*C for 2 minutes, then at
60'C for 15 minutes. Unannealed primer was removed by washing the slides 2 x 4
minutes in 2x SSPE. 15 gl of polymerase trapping mix [BST DNA polymerase
6000U/I, E.coli SSB (45ng/pl), 14.25% acrylamide, 0.75% bis-acrylamide, 25%
glycerol, 0.01% triton x-100, 1mM DTT, 0.lmg/ml acetylated BSA, 0.083% temed,
0.083% APS] was pipetted over the gel, covered with a No. 2 18x18mm coverslip and
allowed to polymerize. Unlabeled nucleotides additions were performed by submerging
the slides in 55*C unlabeled extension mix [20mM Tris-HCl pH 8.8, 10mM MgCl 2 ,
50mM KCI, 0.5mg/ml BSA, 0.01% triton x-100, 2pM appropriate deoxynucleotide
triphosphate] for 3 minutes. After each nucleotide addition, slides were washed in wash
buffer 1 [10mM Tris-HCl pH 7.5, 50mM KCl, 2mM EDTA, 0.01% triton x-100] for two
5 minute washes then in wash buffer 2 [10mM Tris-HCl, pH 7.5, 50mM KCl, 0.01%
triton x-100] for 1 minute. Labeled nucleotide additions were performed by attaching a
56
frame seal chamber to the slide, pipetting 6 5pl labeled extension mix [20mM Tris-HC
pH 8.8, 10mM MgCl 2 , 50mM KCl, 0.5mg/ml BSA, 0.0 1% triton x-100, 2gM FITC-
dCTP, 2gM Cy3-dUTP], and washing 2 x 5minutes in wash buffer 1 and 1 x 1 minute in
wash buffer 2. The slides were then scanned on a scanning confocal microscope
designed for microarrays (Scanarray 5000, GSI luminomics), and the fluorescence of
each polony was quantified using ImageQuantNT (Molecular Dynamics).
Removing Cy5 label after incorporation from Cy5-SS-dCTP
The primer Seqi was annealed to the oligonucleotide OT4 (sample 1) or
OT2(sample 2) by mixing equal amounts of template and primer at a final concentration
of 5gM in Ix EcoPol buffer (10mM Tris pH 7.5, 5mM MgCl 2), and then heating the
mixture to 95 degrees for 1 minute, slowly cooling to 50 degrees at a rate of 0.1 degrees
per second, and holding the reaction at 50 degrees for 5 minutes. The primer:template
complex was then diluted by adding 30ul Ix Ecopol buffer and 2g1 500mM EDTA.
One microliter of each annealed oligonucleotide was added to 17g1 of Acrylamide
gel mixture (40mM Tris pH 7.3, 25% glycerol, 1mM DTT, 6% Acrylamide (5% C), 17.4
units Sequenase version 2.0 (USB), 15gg/ml E.coli single stranded binding protein
(USB), 0.lmg/ml BSA). Then, plg of 1.66% TEMED and 1lg of 1.66% APS were added
and 0.2g1 of each mixture was pipetted onto bind-silane treated glass microscope slides,
and allowed to polymerize under argon. The slides were immediately put under an argon
bed for 30 minutes to allow polymerization of the acrylamide.
The slides were then washed in 40mM Tris pH 7.5, 0.01% Triton X-100 for 30".
Next, the acrylamide spots were incubated in 30 g1 of Cy-5 dCTP extension mix (10mM
57
Tris pH 7.5 50mM NaCl, 5mM MgC 2, 0.1mg/ml BSA, 0.01% Triton X-100, 0.1 gM
unlabeled dCTP, 0.2 pM Cy5-dCTP) or in Cy-5-SS-dCTP extension mix (10mM Tris pH
7.5 50mM NaCl, 5mM MgCl 2, 0.1mg/ml BSA, 0.01% Triton X-100, 0.1pM unlabeled
dCTP, 0.2 pM Cy5-dCTP) for 4 minutes at room temperature. The slides were washed 2
x 5 minutes in FISSEQ wash buffer (10mM Tris pH 7.5, 250mM NaCl, 2mM EDTA,
0.01% Triton X-100), spun briefly to dry and scanned on a Scanarray 4000 confocal
scanner (GSI Luminomics). The slides were then incubated overnight in FISSEQ wash
buffer + 5 mM DTT, washed 2 x 5 minutes in wash buffer, spun briefly to dry and
scanned as before.
Creating Acyrlamide Islands
Arrays of acrylamide islands were created by laser micromaching and by a
photogelation techique. For islands created by laser micromaching, dilute amounts of
template CP-234 (0-360 molecules) were added to 150 pl solid phase PCR mix (10 mM
Tris-HCl (pH 8.3), 50 mM KCl, 0.0 1% gelatin, 1.5 mM MgCl 2, 200 pM dNTP's, 10 units
JumpStart Taq (Sigma), 6% Acrylamide, 0.32% Bis-Acrylamide, 1 pM primer AcrInF, 1
pM primer InR). Two 65 pl frame-seal chambers (MJ research) were attached to a glass
microscope slide that had been treated with bind-silane (Pharmacia). 2.5 pl of 5%
ammonium persulfate, and 2.5 p1 of 5% temed was added to 150 pl of the solid phase
PCR mixture. 65 pl of this solution was added to each chamber. The chambers were
then immediately covered with No. 2 18 mm x18 mm coverslips (Fisher), and the gel was
allowed to polymerize for 10-15 minutes. The frame seal chambers were removed, and
the gel was laser etched with a 248nm eximer laser (resonetics).
58

For islands created by photogelation, a 15 gm thick chamber was created by using
an aluminum foil spacer to separate a glass microscope slide from a 3" by 3" glass wafer
with a chromium mask (Dupont Photomasks Inc.). Acrylamide photogellation mixture
[3.8% acrylamide monomer, 0.2% bis-acrylamide, 12.5% glycerol, 10 mM Tris-HCl (pH
8.3), 50 mM KCl, 0.0 1% gelatin, 1.5 mM MgCl 2, 9ng/gl riboflavin, 0.012% temed] was
pipetted into this chamber. The chamber was placed one inch away from two 13 watt
fluorescent light bulbs (Sylvania F13T5/CW) with the chromium mask facing down. The
mixture was allowed to gel for 30 minutes.
59

1. Chee, M., Yang, R., Hubbell, E., Berno, A., Huang, X. C., Stern, D., Winkler, J.,
Lockhart, D. J., Morris, M. S. and Fodor, S. P. (1996) Science , 274 (5287), 610-4.
2. Drmanac, S., Kita, D., Labat, I., Hauser, B., Schmidt, C., Burczak, J. D. and
Drmanac, R. (1998) Nat Biotechnol , 16 (1), 54-8.
3. Parinov, S., Barsky, V., Yershov, G., Kirillov, E., Timofeev, E., Belgovskiy, A.
and Mirzabekov, A. (1996) Nucleic Acids Res , 24 (15), 2998-3004.
4. Brenner, S., Johnson, M., Bridgham, J., Golda, G., Lloyd, D. H., Johnson, D.,
Luo, S., McCurdy, S., Foy, M., Ewan, M., Roth, R., George, D., Eletr, S., Albrecht, G.,
Vermaas, E., Williams, S. R., Moon, K., Burcham, T., Pallas, M., DuBridge, R. B.,
Kirchner, J., Fearon, K., Mao, J. and Corcoran, K. (2000) Nat Biotechnol , 18 (6), 630-
634.
5. Brenner, S., Williams, S. R., Vermaas, E. H., Storck, T., Moon, K., McCollum,
C., Mao, J. I., Luo, S., Kirchner, J. J., Eletr, S., DuBridge, R. B., Burcham, T. and
Albrecht, G. (2000) Proc Natl Acad Sci U S A , 97 (4), 1665-70.
6. Ronaghi, M., Uhlen, M. and Nyren, P. (1998) Science , 281 (5375), 363, 365.
7. Ronaghi, M., Karamohamed, S., Pettersson, B., Uhlen, M. and Nyren, P. (1996)
Anal Biochem , 242 (1), 84-9.
8. Ahmadian, A., Lundeberg, J., Nyren, P., Uhlen, M. and Ronaghi, M. (2000)
Biotechniques , 28 (1), 140-4, 146-7.
9. Ronaghi, M., Nygren, M., Lundeberg, J. and Nyren, P. (1999) Anal Biochem , 267
(1), 65-71.
10. Rehman, F. N., Audeh, M., Abrams, E. S., Hammond, P. W., Kenney, M. and
Boles, T. C. (1999) Nucleic Acids Res , 27 (2), 649-55.
60

11. Ronaghi, M., Pettersson, B., Uhlen, M. and Nyren, P. (1998) Biotechniques , 25
(5), 876-8, 880-2, 884.
12. Guschin, D., Yershov, G., Zaslavsky, A., Gemmell, A., Shick, V., Proudnikov,
D., Arenkov, P. and Mirzabekov, A. (1997) Anal Biochem , 250 (2), 203-11.
13. Jackman, R. J., Duffy, D.C., Oksana Cherniavskaya, and Whitesides, G.M. (1999)
Langmuir.
61
Chapter 4
A computational analysis of whole-genome expression
data reveals chromosomal domains of gene expression
62

Note to Reader
The work described in this chapter is the result of a collaboration between myself,
Barak Cohen, and Jason Hughes. The contributions that Barak and I made are difficult
to separate. We had detailed discussions to decide how to proceed at every step of this
project, we wrote most of the code together, and are co-first authors on the paper
describing this work. Jason Hughes provided the idea for making chromosome
correlation maps, was instrumental in choosing the correct statistical test for determining
if groups of three or more adjacent genes were correlated more often than could be
explained by the increased frequency of correlated pairs, and helped us address concerns
that overlapping transcripts could influence the results of the project.
63
Chromosome position can have dramatic effects on gene expression 1-3 . The
advent of DNA microarray technologies4 ,5 that allow mRNA expression to be measured
across entire genomes has made genome-wide study of the effects of chromosome
position on gene expression possible. We developed a new tool, a chromosome
correlation map, that displays the correlations between the expression patterns of genes
on the same chromosome. We demonstrate that adjacent pairs of genes, as well as nearby
non-adjacent pairs of genes, show significantly correlated expression in a manner that is
independent of their orientation. We also present specific examples of adjacent pairs with
highly correlated expression patterns, in which the promoter of only one of the two genes
contains an upstream activating sequence (UAS) known to be associated with that
expression pattern. Finally, we show that genes with similar functions tend to occur in
adjacent positions along the chromosomes. Taken together, our results suggest that in
certain chromosomal expression domains, a UAS can affect the transcription of genes
that are not immediately downstream from it, and that evolution may take advantage of
this phenomenon by keeping genes with similar functions in adjacent chromosomal
positions.
Chromosome correlation maps allow visualization of coexpressed genes along the
chromosomes of the yeast, Saccharomyces cerevisiae. As a source of expression data,
we used a data set in which the expression levels of all open reading frames (ORFs) in
the yeast genome were measured over the course of two mitotic cell cycles. This data set
was chosen because it had been previously noticed that ORFs that displayed periodic
expression profiles were often found adjacent to one another on the chromosome,
suggesting the presence of position effects 6 . In chromosome correlation maps, each
64
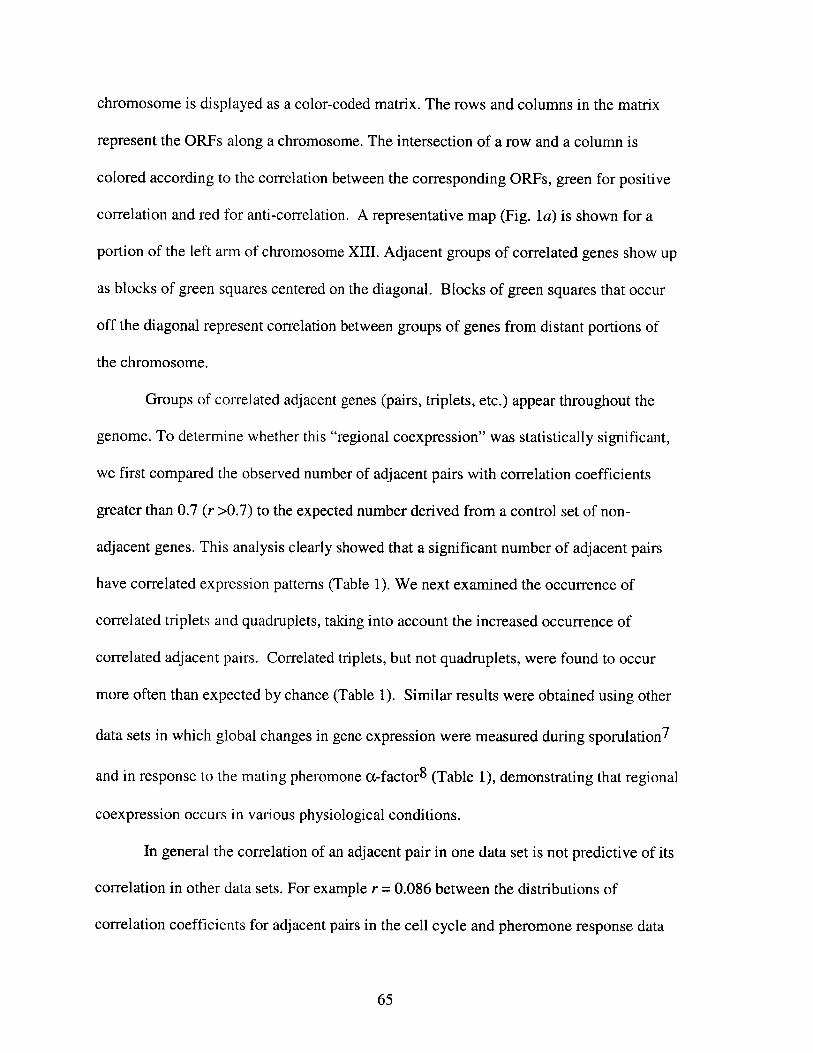
chromosome is displayed as a color-coded matrix. The rows and columns in the matrix
represent the ORFs along a chromosome. The intersection of a row and a column is
colored according to the correlation between the corresponding ORFs, green for positive
correlation and red for anti-correlation. A representative map (Fig. la) is shown for a
portion of the left arm of chromosome XIII. Adjacent groups of correlated genes show up
as blocks of green squares centered on the diagonal. Blocks of green squares that occur
off the diagonal represent correlation between groups of genes from distant portions of
the chromosome.
Groups of correlated adjacent genes (pairs, triplets, etc.) appear throughout the
genome. To determine whether this "regional coexpression" was statistically significant,
we first compared the observed number of adjacent pairs with correlation coefficients
greater than 0.7 (r >0.7) to the expected number derived from a control set of non-
adjacent genes. This analysis clearly showed that a significant number of adjacent pairs
have correlated expression patterns (Table 1). We next examined the occurrence of
correlated triplets and quadruplets, taking into account the increased occurrence of
correlated adjacent pairs. Correlated triplets, but not quadruplets, were found to occur
more often than expected by chance (Table 1). Similar results were obtained using other
data sets in which global changes in gene expression were measured during sporulation 7
and in response to the mating pheromone o-factor 8 (Table 1), demonstrating that regional
coexpression occurs in various physiological conditions.
In general the correlation of an adjacent pair in one data set is not predictive of its
correlation in other data sets. For example r = 0.086 between the distributions of
correlation coefficients for adjacent pairs in the cell cycle and pheromone response data
65
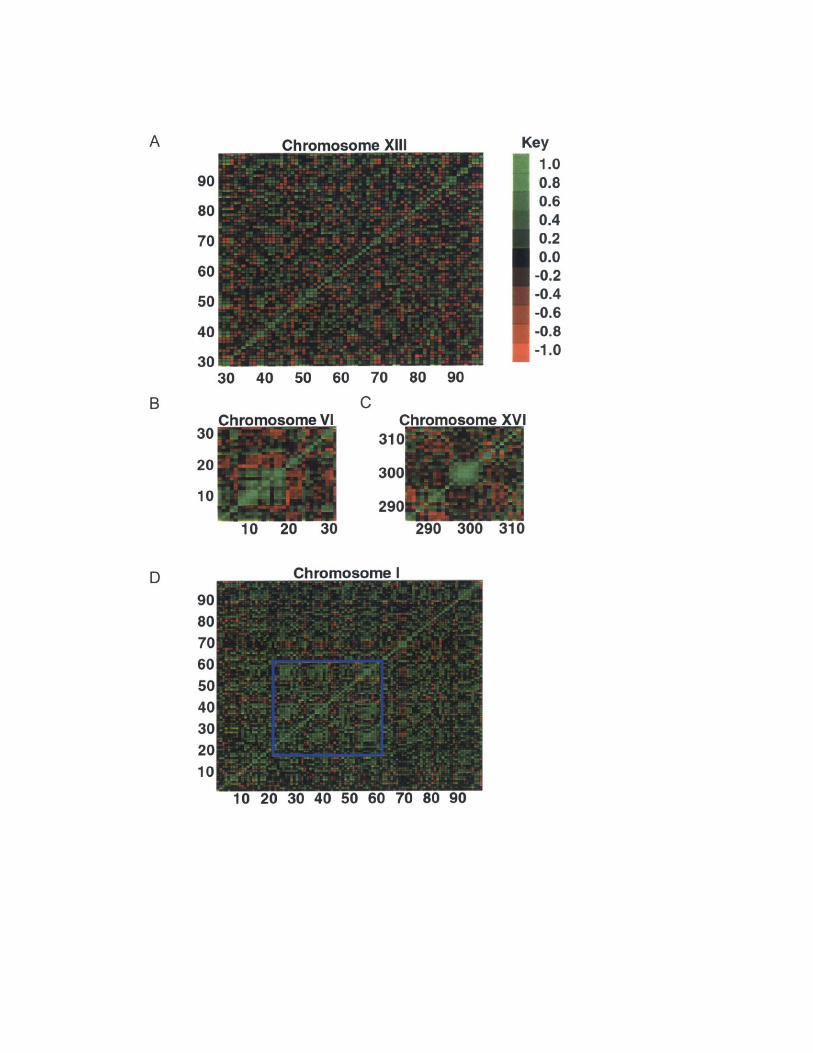
90
80
70
60
50
40
3030 40 50 60 70 80 90
C
30
20
10
D
A Key1.00.80.60.40.20.0
-0.2-0.4-0.6-0.8-1.0
B
Figure 1. Correlation maps for yeast chromosomes. In this analysis we included everyORF in the genome (excluding overlapping ORFs), not just those represented in thefiltered list (see methods). The numbers along the side of the matrix represent the ORFsalong the chromosome. The squares are colored green for positive correlation and red foranti-correlation. The intensity of the color at each position represents the degree ofcorrelation or anti-correlation. (A) Correlation map for ORFs on the left arm ofchromosome XIII between positions 58939 bp and 212515 bp. (B) Correlation map forORFs on the left arm of chromosome VI between positions 53 bp and 106957 bp. Thecoexpressed group of adjacent ORFs extends from YFL061W at position 9545 bp toYFL050C at position 35848 bp. (C) Correlation map for ORFs on the right arm ofchromosome XVI between positions 592327 bp and 657339 bp. The coexpressed groupof adjacent ORFs extends from YPRO27C at position 620420 bp to YPRO34W at position640953 bp. (D) Correlation map for all of chromosome I. The box shows a region ofthe chromosome in which regularly spaced blocks of correlated genes are found.
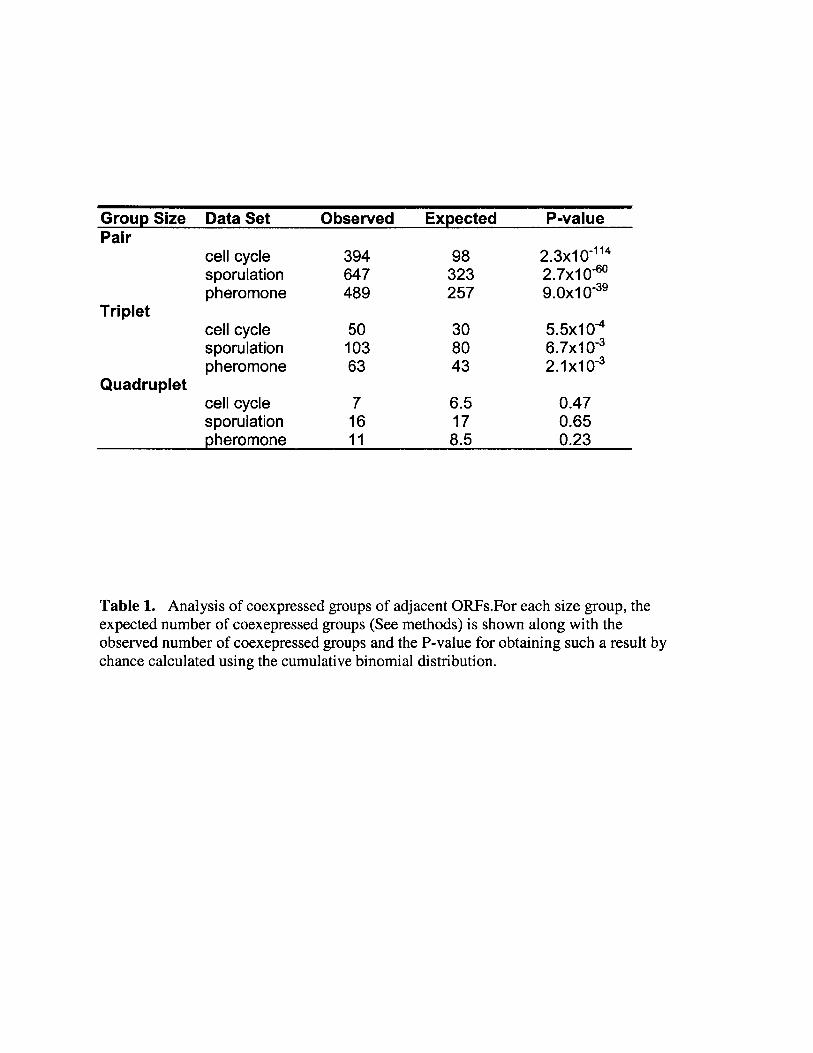
Group Size Data Set Observed Expected P-valuePair
cell cycle 394 98 2.3x10⁻¹ 1 4
sporulation 647 323 2.7x10-60
pheromone 489 257 9.0x10⁻³ 9
Tripletcell cycle 50 30 5.5x10⁻⁴sporulation 103 80 6.7x10⁻³pheromone 63 43 2.1x10⁻³
Quadrupletcell cycle 7 6.5 0.47sporulation 16 17 0.65pheromone 11 8.5 0.23
Table 1. Analysis of coexpressed groups of adjacent ORFs.For each size group, theexpected number of coexepressed groups (See methods) is shown along with theobserved number of coexepressed groups and the P-value for obtaining such a result bychance calculated using the cumulative binomial distribution.

sets. However, adjacent pairs that are highly correlated (r > 0.7) in one condition are
more likely to be highly correlated in other conditions. This point is illustrated by the
observation that there were two-fold more adjacent pairs that were highly correlated in
both the cell cycle and pheromone data sets than would be expected based on the
probabilities of being highly correlated in either data set (p=10). Similar results were
obtained when other data sets were compared implying that some adjacent pairs tend to
display regional coexpression in a variety of experimental conditions.
We also found two unusually large groups of correlated adjacent genes in the cell
cycle data. The first spans 26 kilobases on chromosome VI (Fig. 1b) and includes
YFL061W, SNO3, SNZ3, THI5, AAD6, YFL056C, AGP3, YFL054C, DAK2, YFL052W,
YFL051C, and ALR2. The second spans 20 kilobases on chromosome XVI (Fig. Ic) and
includes YPR027C, YIP2, APL4, CSR2, YPR03 1W, SRO7, HTS1, and ARP7. We
searched for common promoter elements in these large groups using AlignACE 9 , and by
looking for known UASs catalogued in the Saccharomyces Cerevisiae Protein
Database1 0 . We also looked for the presence of sequence motifs that had previously been
shown to be associated with the expression of these genes during the cell cycle 11. No
sites were present in a majority of the intergenic regions within these groups. This
suggests that the coexepression of these large groups was not due to the presence of
similar UASs in the intergenic regions between the ORFs in these groups.
Using correlation maps we have shown that adjacent groups of genes are often
coexepressed. In addition, correlation maps often reveal regularly spaced groups of
correlated genes along the chromosomes that may be indicative of higher order
chromosome structure (Fig. 1d).
66
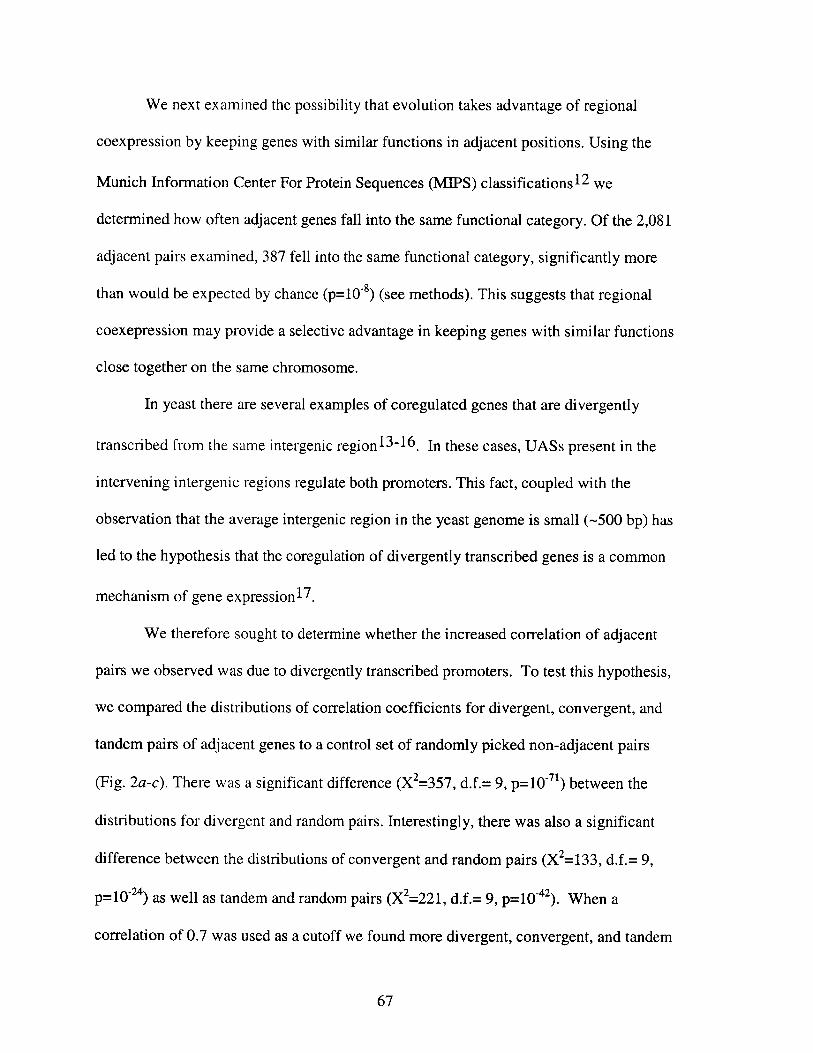
We next examined the possibility that evolution takes advantage of regional
coexpression by keeping genes with similar functions in adjacent positions. Using the
Munich Information Center For Protein Sequences (MIPS) classifications1 2 we
determined how often adjacent genes fall into the same functional category. Of the 2,081
adjacent pairs examined, 387 fell into the same functional category, significantly more
than would be expected by chance (p=10-8) (see methods). This suggests that regional
coexepression may provide a selective advantage in keeping genes with similar functions
close together on the same chromosome.
In yeast there are several examples of coregulated genes that are divergently
transcribed from the same intergenic region13-1 6 . In these cases, UASs present in the
intervening intergenic regions regulate both promoters. This fact, coupled with the
observation that the average intergenic region in the yeast genome is small (-500 bp) has
led to the hypothesis that the coregulation of divergently transcribed genes is a common
mechanism of gene expression 17 .
We therefore sought to determine whether the increased correlation of adjacent
pairs we observed was due to divergently transcribed promoters. To test this hypothesis,
we compared the distributions of correlation coefficients for divergent, convergent, and
tandem pairs of adjacent genes to a control set of randomly picked non-adjacent pairs
(Fig. 2a-c). There was a significant difference (X 2=357, d.f.= 9, p=10 7 1 ) between the
distributions for divergent and random pairs. Interestingly, there was also a significant
difference between the distributions of convergent and random pairs (X2= 133, d.f.= 9,
p=104 ) as well as tandem and random pairs (X2 =221, d.f.= 9, p=10-42). When a
correlation of 0.7 was used as a cutoff we found more divergent, convergent, and tandem
67
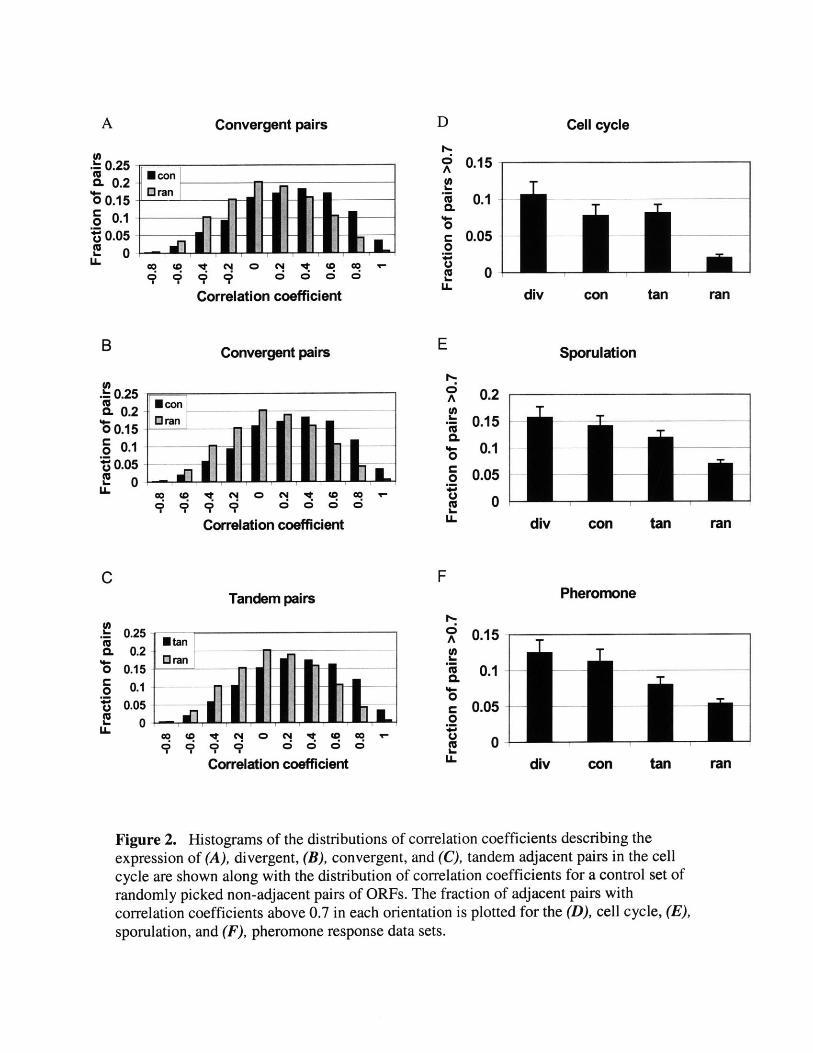
Convergent pairs
A
.
0a0
LL
0.2.L 0.25
0 .15o 0.1
0.050
U.
B
. 0.2
00..
U-
C
0.
0 0.C0
.
LL
0.15
0.1
0.05
div
mon
Correlation coefficient
Convergent pairs
52 mcon
C4"CO CO99 9 0 0
Correlation coefficient
Tandem pairs
25-
15-.1
0
999 0000 66
Correlation coefficient
A
4-0
0
0
LL
con
Sporulation
0.2
0.15
0.1
0.05
0div
F
A0.h00.4-0
0
0t-U-
con
Pheromone
0.15
0.1 -
0.05 -
div con
Figure 2. Histograms of the distributions of correlation coefficients describing theexpression of (A), divergent, (B), convergent, and (C), tandem adjacent pairs in the cellcycle are shown along with the distribution of correlation coefficients for a control set ofrandomly picked non-adjacent pairs of ORFs. The fraction of adjacent pairs withcorrelation coefficients above 0.7 in each orientation is plotted for the (D), cell cycle, (E),sporulation, and (F), pheromone response data sets.
1- T
tan
E
ran
tan ran
tan ran
,.
ii LIr
DA Cell cycle
I I I
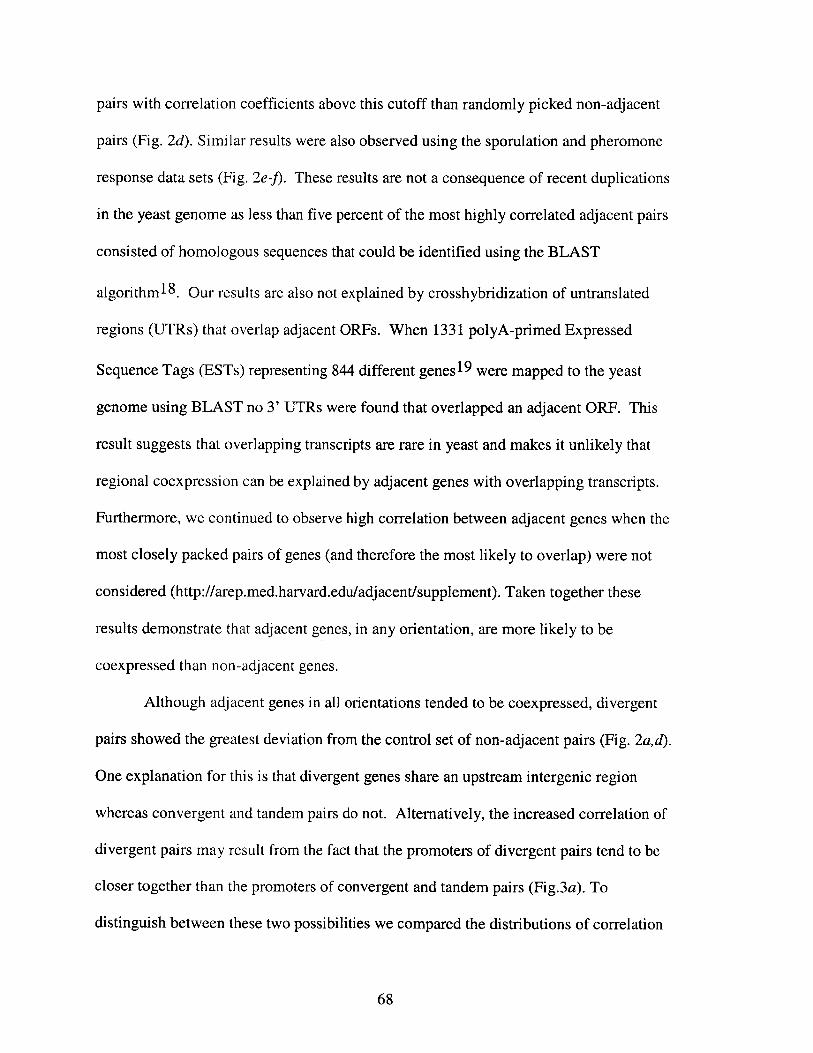
pairs with correlation coefficients above this cutoff than randomly picked non-adjacent
pairs (Fig. 2d). Similar results were also observed using the sporulation and pheromone
response data sets (Fig. 2e-f). These results are not a consequence of recent duplications
in the yeast genome as less than five percent of the most highly correlated adjacent pairs
consisted of homologous sequences that could be identified using the BLAST
algorithm 1 8 . Our results are also not explained by crosshybridization of untranslated
regions (UTRs) that overlap adjacent ORFs. When 1331 polyA-primed Expressed
Sequence Tags (ESTs) representing 844 different genes 19 were mapped to the yeast
genome using BLAST no 3' UTRs were found that overlapped an adjacent ORE. This
result suggests that overlapping transcripts are rare in yeast and makes it unlikely that
regional coexpression can be explained by adjacent genes with overlapping transcripts.
Furthermore, we continued to observe high correlation between adjacent genes when the
most closely packed pairs of genes (and therefore the most likely to overlap) were not
considered (http://arep.med.harvard.edu/adjacent/supplement). Taken together these
results demonstrate that adjacent genes, in any orientation, are more likely to be
coexpressed than non-adjacent genes.
Although adjacent genes in all orientations tended to be coexpressed, divergent
pairs showed the greatest deviation from the control set of non-adjacent pairs (Fig. 2a,d).
One explanation for this is that divergent genes share an upstream intergenic region
whereas convergent and tandem pairs do not. Alternatively, the increased correlation of
divergent pairs may result from the fact that the promoters of divergent pairs tend to be
closer together than the promoters of convergent and tandem pairs (Fig.3a). To
distinguish between these two possibilities we compared the distributions of correlation
68
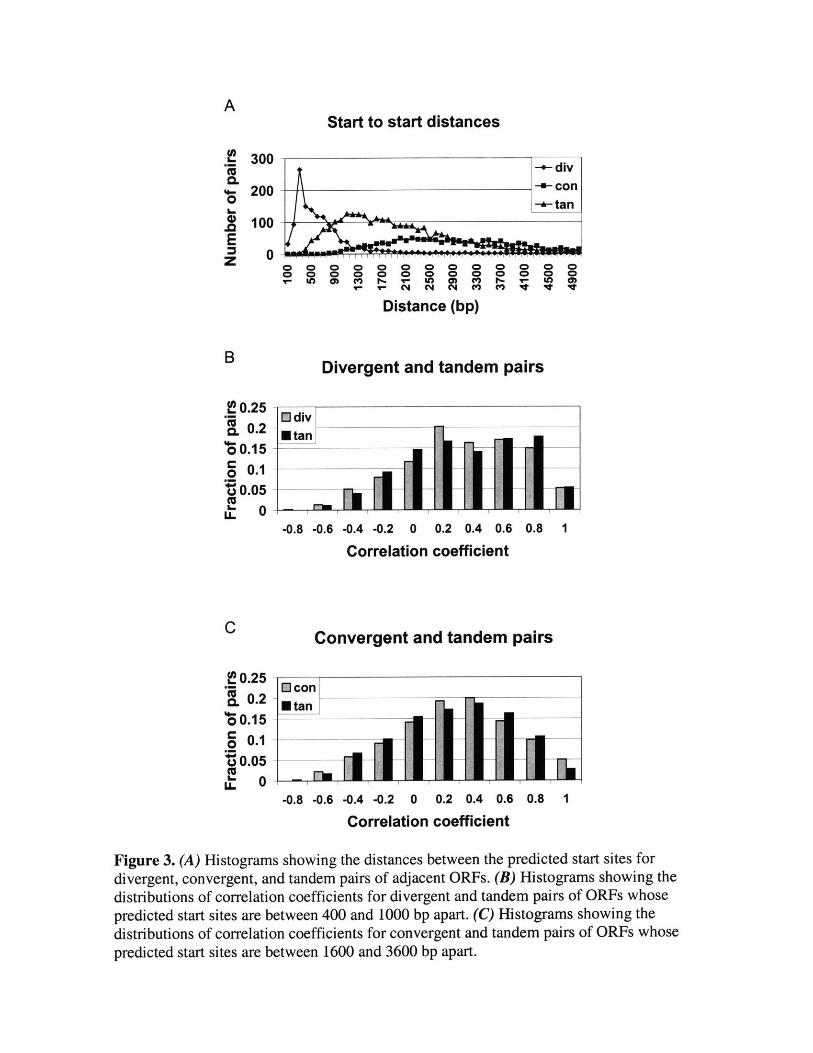
AStart to start distances
300 +
%- 200 -0 + tan
41 100Ez 0
0 0 0 0- 0 00O 0 0 0- 0
Distance (bp)
B Divergent and tandem pairs
E0.25--V M div0. 0.2 - tan00.15
8 0.10.05
-0.8 -0.6 -0.4 -0.2 0 0.2 0.4 0.6 0.8 1
Correlation coefficient
C Convergent and tandem pairs
120.25 --- M conCL 0.2 - a100.150 0.1
0.05U
-0.8 -0.6 -0.4 -0.2 0 0.2 0.4 0.6 0.8 1
Correlation coefficient
Figure 3. (A) Histograms showing the distances between the predicted start sites fordivergent, convergent, and tandem pairs of adjacent ORFs. (B) Histograms showing thedistributions of correlation coefficients for divergent and tandem pairs of ORFs whosepredicted start sites are between 400 and 1000 bp apart. (C) Histograms showing thedistributions of correlation coefficients for convergent and tandem pairs of ORFs whosepredicted start sites are between 1600 and 3600 bp apart.
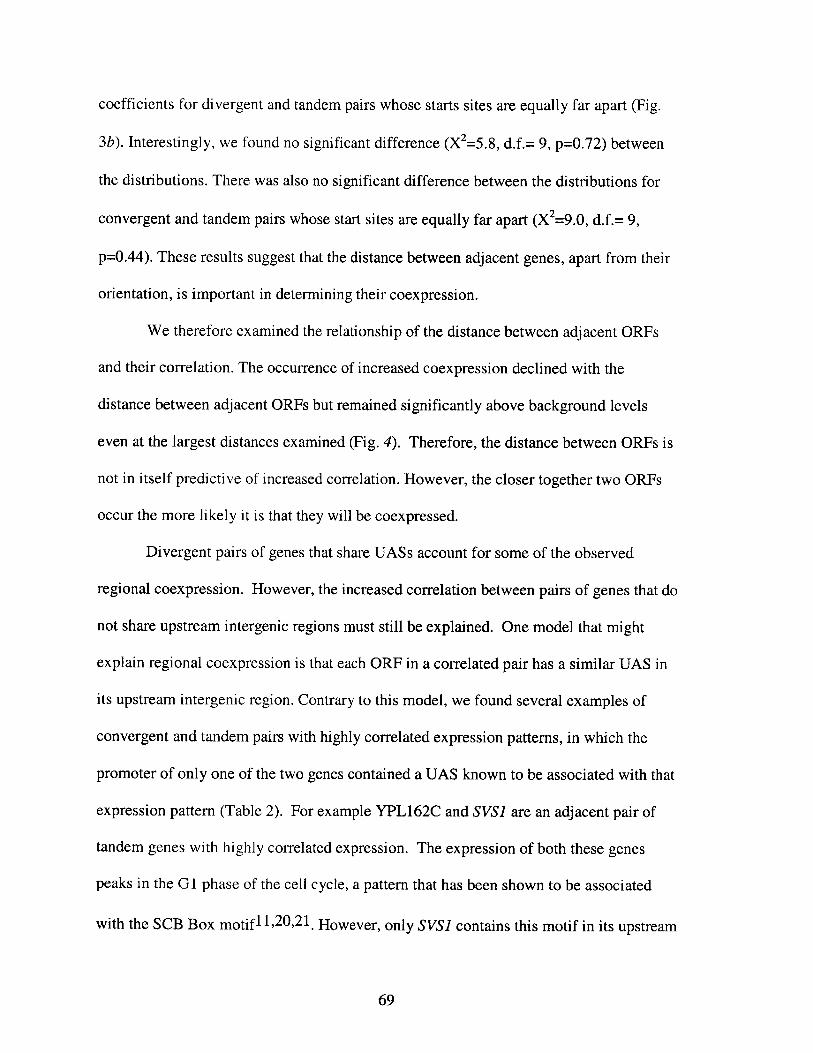
coefficients for divergent and tandem pairs whose starts sites are equally far apart (Fig.
3b). Interestingly, we found no significant difference (X 2=5.8, d.f.= 9, p=0.72) between
the distributions. There was also no significant difference between the distributions for
convergent and tandem pairs whose start sites are equally far apart (X2=9.0, d.f.= 9,
p=0.44). These results suggest that the distance between adjacent genes, apart from their
orientation, is important in determining their coexpression.
We therefore examined the relationship of the distance between adjacent ORFs
and their correlation. The occurrence of increased coexpression declined with the
distance between adjacent ORFs but remained significantly above background levels
even at the largest distances examined (Fig. 4). Therefore, the distance between ORFs is
not in itself predictive of increased correlation. However, the closer together two ORFs
occur the more likely it is that they will be coexpressed.
Divergent pairs of genes that share UASs account for some of the observed
regional coexpression. However, the increased correlation between pairs of genes that do
not share upstream intergenic regions must still be explained. One model that might
explain regional coexpression is that each ORF in a correlated pair has a similar UAS in
its upstream intergenic region. Contrary to this model, we found several examples of
convergent and tandem pairs with highly correlated expression patterns, in which the
promoter of only one of the two genes contained a UAS known to be associated with that
expression pattern (Table 2). For example YPL162C and SVS1 are an adjacent pair of
tandem genes with highly correlated expression. The expression of both these genes
peaks in the GI phase of the cell cycle, a pattern that has been shown to be associated
with the SCB Box motif 1 1,20,21. However, only SVS1 contains this motif in its upstream
69
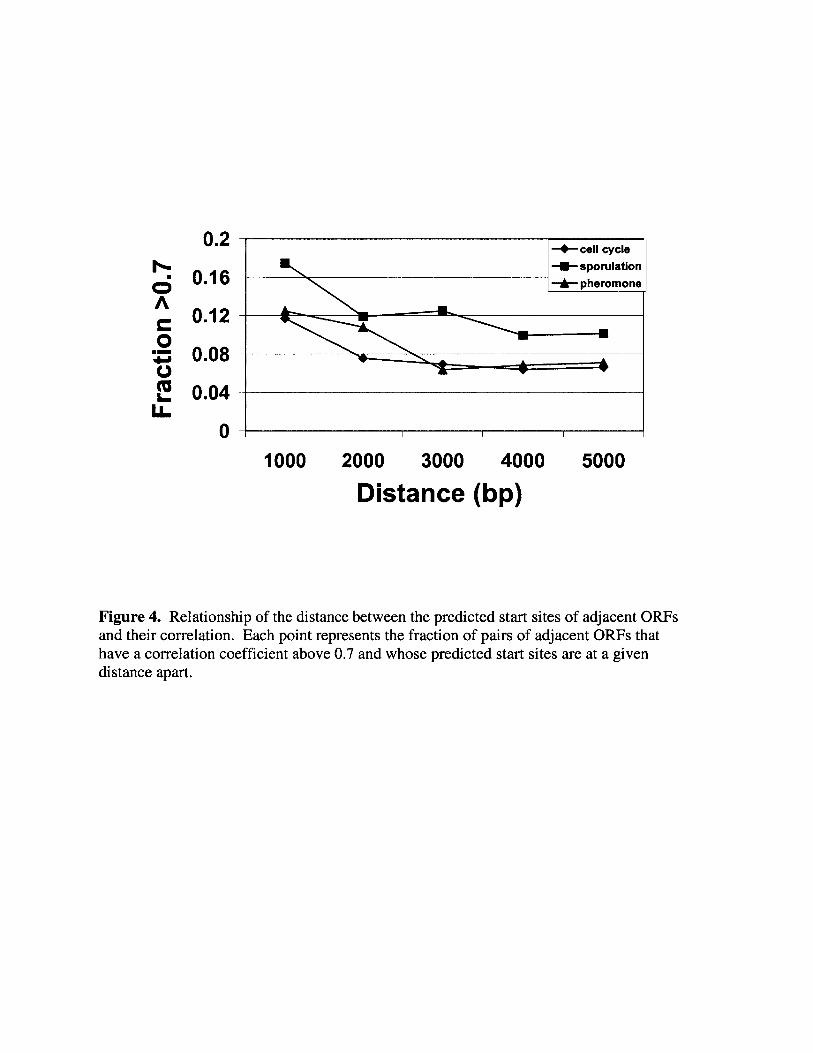
0.2 -4-cell cycle
--- sporulation0.16 -As- pheromone
A0.12
0- 0.08
LT 0.04LL
0
1000 2000 3000 4000 5000
Distance (bp)
Figure 4. Relationship of the distance between the predicted start sites of adjacent ORFsand their correlation. Each point represents the fraction of pairs of adjacent ORFs thathave a correlation coefficient above 0.7 and whose predicted start sites are at a givendistance apart.
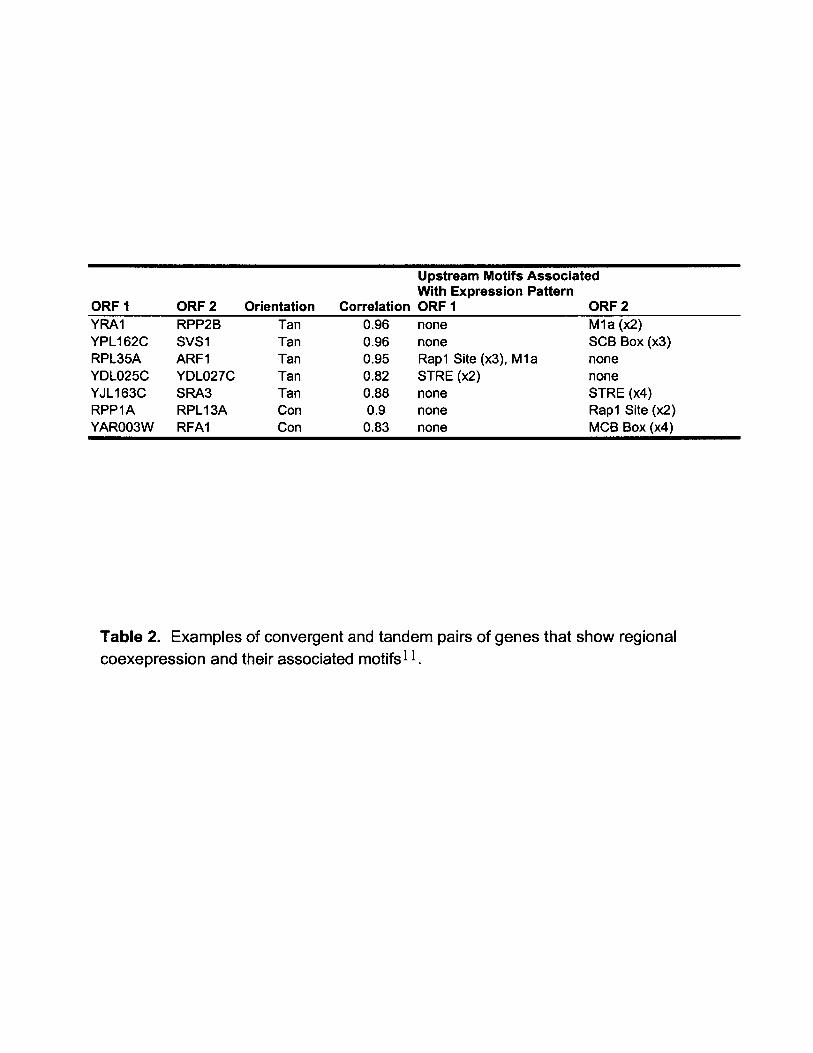
Upstream Motifs AssociatedWith Expression Pattern
ORF I ORF 2 Orientation Correlation ORF I ORF 2YRA1 RPP2B Tan 0.96 none Mia (x2)YPL1 62C SVS1 Tan 0.96 none SCB Box (x3)RPL35A ARF1 Tan 0.95 Rap1 Site (x3), Mia noneYDLO25C YDLO27C Tan 0.82 STRE (x2) noneYJL163C SRA3 Tan 0.88 none STRE (x4)RPP1A RPL13A Con 0.9 none Rap1 Site (x2)YAR003W RFA1 Con 0.83 none MCB Box (x4)
Table 2. Examples of convergent and tandem pairs of genes that show regionalcoexepression and their associated motifs11.
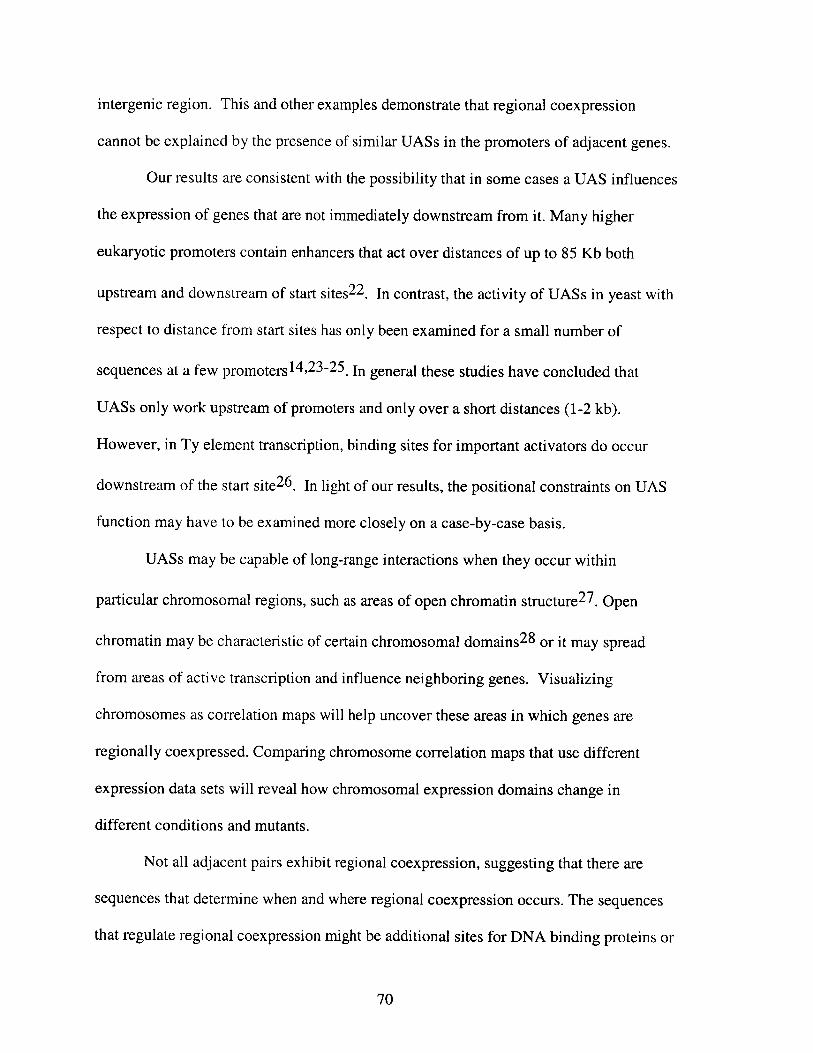
intergenic region. This and other examples demonstrate that regional coexpression
cannot be explained by the presence of similar UASs in the promoters of adjacent genes.
Our results are consistent with the possibility that in some cases a UAS influences
the expression of genes that are not immediately downstream from it. Many higher
eukaryotic promoters contain enhancers that act over distances of up to 85 Kb both
upstream and downstream of start sites22 . In contrast, the activity of UASs in yeast with
respect to distance from start sites has only been examined for a small number of
sequences at a few promoters 14,23-25. In general these studies have concluded that
UASs only work upstream of promoters and only over a short distances (1-2 kb).
However, in Ty element transcription, binding sites for important activators do occur
downstream of the start site 2 6 . In light of our results, the positional constraints on UAS
function may have to be examined more closely on a case-by-case basis.
UASs may be capable of long-range interactions when they occur within
particular chromosomal regions, such as areas of open chromatin structure 2 7 . Open
chromatin may be characteristic of certain chromosomal domains2 8 or it may spread
from areas of active transcription and influence neighboring genes. Visualizing
chromosomes as correlation maps will help uncover these areas in which genes are
regionally coexpressed. Comparing chromosome correlation maps that use different
expression data sets will reveal how chromosomal expression domains change in
different conditions and mutants.
Not all adjacent pairs exhibit regional coexpression, suggesting that there are
sequences that determine when and where regional coexpression occurs. The sequences
that regulate regional coexpression might be additional sites for DNA binding proteins or
70

other sequence landmarks such as polyA tracts. These sequences may be functionally
analogous to insulator sequences 2 9 -31 and might protect the highly compact yeast
genome from unwanted regional coexpression. The identification of sequences that
regulate regional coexpression will be an important extension of the methods used here.
The techniques presented here provide a valuable parallel approach to clustering
algorithms' 1,32-36 for examining the vast amounts of expression data now being
deposited in public databases 3 7 ,3 8 . This approach will be useful for studying position
effect variegation, telomere silencing 3 9 , chromosomal rearrangements, and other position
dependent effects on gene expression.
71
Methods
Data Processing
Our analysis was performed using whole-genome mRNA expression data
generated for the mitotic cell cycle (http://genomics.stanford.edu/yeast/cellcycle.html).
Briefly, transcript levels were quantified during the cell cycle of S. cerevisiae by
synchronizing cdc28-13 cells and harvesting mRNA from cells at 10-minute intervals
over the course of two cell cycles. The abundance of each mRNA species in the yeast
genome was quantified by hybridization to Affymetrix oligonucleotide microarrays. We
also analyzed expression data generated on spotted cDNA microarrays including a study
of the changes in gene expression during sporulation
(http://cmgm.stanford.edu/pbrown/sporulation) and in response to mating pheromone
(http://www.rii.com).
Before proceeding with our analysis, we excluded several data points. We deleted
the 90 and 100-minute time points from the cell cycle data set, as the mRNA from these
time points was not efficiently labeledl 1 . We also ignored ORFs that displayed a mean
intensity of less than 20 units in the cell cycle data set because experimental noise
obscured meaningful quantitation of transcript abundance below this cutoff.
As we began to analyze the data, we discovered that there are a number of
annotated ORFs whose sequences physically overlap in the genome. Overlapping ORFs
are problematic because cDNA from both ORFs may hybridize to the probes
corresponding to a single ORF, resulting in an artificially high correlation between
72
overlapping ORFs. To eliminate this artifact, we identified all pairs of overlapping ORFs
in the genome and removed the smaller of the two ORFs from the data set.
The filtered data sets therefore consisted of the lists non-overlapping ORFs (with
average intensities above 20 units in the cell cycle data set). The final lists contained
5531 ORFs for the cell cycle, 5622 ORFs for the sporulation data and 5797 ORFs for the
pheromone response data. All experiments use these filtered lists unless otherwise stated.
For experiments analyzing adjacent ORFs, two ORFs were considered to be
adjacent if they occurred on the same chromosome, and if there were no other ORFs, Ty
elements, LTRs, centromeres, tRNAs, rRNAs, or snRNAs in between them. Triplets and
quadruplets were defined as series of adjacent pairs.
Coexpression of Groups of Adjacent Genes
Adjacent pairs were considered to be coexpressed if they had a correlation
coefficient greater than 0.7. Triplets and quadruplets were considered to be coexpressed if
their component adjacent pairs all had correlation coefficients greater than 0.7.
To determine if the observed number of correlated adjacent pairs was significant,
we used the cumulative binomial distribution, given by the formula,
NP(n~nn) = P p ( _)N - n N!
n=no n!(N -n)
Where N is the total number of adjacent pairs sampled, no is the observed number
of correlated adjacent pairs, and p is the observed probability of two randomly picked
non-adjacent genes having a correlation above the cutoff.
73
To determine the significance of correlated triplets we used the same formula
except where N is the total number of triplets sampled, no is the observed number of
triplets with a correlation above the cutoff, and p = (ppair) 2 where Ppair is the observed
probability of adjacent pairs having a correlation above the cutoff.
To determine the significance of correlated quadruplets we used the same formula
except where N is the total number of quadruplets sampled, no is the observed number of
quadruplets with a correlation above the cutoff, and p = Ppair (ppair-I)2 where Ppair-i is the
observed probability of an adjacent pair having a correlation above the cutoff given that
the previous adjacent pair has a correlation above the cutoff.
Comparing the correlation of divergent, convergent, and tandem ORF pairs with
randomly selected non-adjacent pairs of genes
Adjacent pairs of ORFs present in the filtered data sets were grouped according to
their orientations. Control pairs were derived by randomly picking two non-adjacent
ORFs and grouping them together as a pair. The correlation coefficients for all pairs were
computed, and a histogram showing the fraction of pairs in each correlation bin was
plotted for each group. The significance of the differences between the control group and
the different classes of adjacent pairs was determined using the chi-square test4 0 . For the
cell cycle analysis 1161 divergent, 1239 convergent, 2284 tandem, and 4542 random
pairs were included in the analysis. The corresponding numbers were 1225, 1257, 2358
and 4840 for the sporulation data 1318, 1292, 2479 and 4963 for the pheromone response
data.
74
Overrepresentation of adjacent pairs in MIPS functional categories
Adjacent pairs of ORFs were scored as having similar function if they were in the
same MIPS functional group. If a MIPS category had more than 537 genes, and
contained subgroups, we used only its subgroups. The "unclassified" MIPS category was
excluded. This left a total of 105 MIPS categories for the analysis. Of 2081 adjacent
pairs 387 were found in the same functional category. Of 27923 randomly picked pairs
3900 were found in the same functional category. Using the cumulative binomial
distribution, we computed the probability of the adjacent pairs showing this level of
functional similarity by chance to be 4.9x10⁸-.
Acknowledgments
We thank J. Aach, W. Rindone, S. Tavazoie, J. Graber, K. Struhl, and F. Winston
for helpful advice and suggestions, and for providing data files. We also thank P.
Sudarsanam, A. Dudley, T. Pilpel, A. Derti, P. Estep, M. Steffen, V. Badarinarayana, T.
Wu, and M. Bulyk, for discussions and critical readings of the manuscript. B. A. C. was
supported by a postdoctoral fellowship from the American Cancer Society (PF-98-159-
01-MBC). This work was supported by the US Department of Energy (DE-FG02-87-
ER60565), the Office of Naval Research and DARPA (N00014-97-1-0865), the Lipper
Foundation and Hoechst Marion Roussel.
75
1. Gottschling, D. E., Aparicio, 0. M., Billington, B. L. & Zakian, V. A. Position
effect at S. cerevisiae telomeres: reversible repression of Pol i
transcription. Cell 63, 751-62 (1990).
2. Henikoff, S. A reconsideration of the mechanism of position effect.
Genetics 138, 1-5 (1994).
3. Wu, C. T. Transvection, nuclear structure, and chromatin proteins. J. Cell
Biol.120, 587-90 (1993).
4. DeRisi, J. L., lyer, V. R. & Brown, P. 0. Exploring the metabolic and
genetic control of gene expression on a genomic scale. Science 278, 680-
6(1997).
5. Wodicka, L., Dong, H., Mittmann, M., Ho, M. H. & Lockhart, D. J. Genome-
wide expression monitoring in Saccharomyces cerevisiae. Nat. Biotechnol.
15, 1359-67 (1997).
6. Cho, R. J. et al. A genome-wide transcriptional analysis of the mitotic cell
cycle. Mol. Cell2, 65-73 (1998).
7. Chu, S. et al. The transcriptional program of sporulation in budding yeast.
Science 282, 699-705 (1998).
8. Roberts, C. J. et al. Signaling and circuitry of multiple MAPK pathways
revealed by a matrix of global gene expression profiles. Science 287, 873-
80 (2000).
9. Hughes, J. D., Estep, P. W., Tavazoie, S. & Church, G. M. Computational
identification of cis-regulatory elements associated with groups of
76
functionally related genes in Saccharomyces cerevisiae. J. Mol. Biol. 296,
1205-14 (2000).
10. Zhu, J. & Zhang, M. Q. SCPD: a promoter database of the yeast
Saccharomyces cerevisiae. Bicinformatics 15, 607-11 (1999).
11. Tavazoie, S., Hughes, J. D., Campbell, M. J., Cho, R. J. & Church, G. M.
Systematic determination of genetic network architecture. Nat. Genet. 22,
281-5 (1999).
12. Mewes, H. W. et al. MIPS: a database for genomes and protein
sequences. Nucleic Acids Res. 28, 37-40 (2000).
13. Kraakman, L. S., Mager, W. H., Maurer, K. T., Nieuwint, R. T. & Planta, R.
J. The divergently transcribed genes encoding yeast ribosomal proteins
L46 and S24 are activated by shared RPG-boxes. Nucleic Acids Res. 17,
9693-706 (1989).
14. Nakao, J., Miyanohara, A., Toh-e, A. & Matsubsara, K. Saccharomyces
cerevisiae PHO5 promoter region: location and function of the upstream
activation site. Mol. Cell Biol. 6, 2613-23 (1986).
15. Osley, M. A., Gould, J., Kim, S., Kane, M. Y. & Hereford, L. Identification
of sequences in a yeast histone promoter involved in periodic
transcription. Cell 45, 537-44 (1986).
16. West, R. W., Jr., Yocum, R. R. & Ptashne, M. Saccharomyces cerevisiae
GAL -GAL10 divergent promoter region: location and function of the
upstream activating sequence UASG. Mol. Cell Bio/. 4, 2467-78 (1984).
77
17. Zhang, X. & Smith, T. F. Yeast "operons". Micro. and Comp. Genom. 3,
133-39 (1998).
18. Altschul, S. F. et al. Gapped BLAST and PSI-BLAST: a new generation of
protein database search programs. Nucleic Acids Res. 25, 3389-402
(1997).
19. Graber, J. H., Cantor, C. R., Mohr, S. C. & Smith, T. F. In silico detection
of control signals: mRNA 3'-end-processing sequences in diverse species.
Proc. Natl. Acad. Sci. U S A 96, 14055-60 (1999).
20. Nasmyth, K. A repetitive DNA sequence that confers cell-cycle START
(CDC28)-dependent transcription of the HO gene in yeast. Cell 42, 225-35
(1985).
21. Koch, C., Schleiffer, A., Ammerer, G. & Nasmyth, K. Switching
transcription on and off during the yeast cell cycle: CIn/Cdc28 kinases
activate bound transcription factor SBF (Swi4/Swi6) at start, whereas
Clb/Cdc28 kinases displace it from the promoter in G2. Genes Dev. 10,
129-41 (1996).
22. Blackwood, E. M. & Kadonaga, J. T. Going the distance: a current view of
enhancer action. Science 281, 61-3 (1998).
23. Guarente, L. & Hoar, E. Upstream activation sites of the CYC1 gene of
Saccharomyces cerevisiae are active when inverted but not when placed
downstream of the "TATA box". Proc. Nat/. Acad. Sci. U S A 81, 7860-4
(1984).
78
24. Struhl, K. Genetic properties and chromatin structure of the yeast gal
regulatory element: an enhancer-like sequence. Proc. Natl. Acad. Sci. U S
A 81, 7865-9 (1984).
25. Woudt, L. P. et al. Analysis of upstream activation sites of yeast ribosomal
protein genes. Nucleic Acids Res. 15, 6037-48 (1987).
26. Boeke, J. D. & Sandmeyer, S. B. in The Molecular and Cellular Biology of
the Yeast Saccharomyves: Genome Dynamics, Protein Synthesis, and
Energetics (eds. Pringle, J. R., Broach, J. R. & Jones, E. W.) 207-225
(Cold Spring Harbor Laboratory Press, Cold Spring Harbor, 1991).
27. Felsenfeld, G. Chromatin unfolds. Cell 86, 13-9 (1996).
28. Lamond, A. 1. & Earnshaw, W. C. Structure and function in the nucleus.
Science 280, 547-53 (1998).
29. Bi, X. & Broach, J. R. UASrpg can function as a heterochromatin boundary
element in yeast. Genes Dev. 13, 1089-101 (1999).
30. Fourel, G., Revardel, E., Koering, C. E. & Gilson, E. Cohabitation of
insulators and silencing elements in yeast subtelomeric regions. Embo J.
18, 2522-37 (1999).
31. Kellum, R. & Schedl, P. A position-effect assay for boundaries of higher
order chromosomal domains. Cell64, 941-50 (1991).
32. Alon, U. et al. Broad patterns of gene expression revealed by clustering
analysis of tumor and normal colon tissues probed by oligonucleotide
arrays. Proc. Natl. Acad. Sci. U S A 96, 6745-50 (1999).
79
33. Brown, M. P. S. et al. Knowledge-based analysis of microarray gene
expression data by using support vector machines. Proc. Nat. Acad. Sci.
U S A 97, 262=67 (2000).
34. Eisen, M. B., Spellman, P. T., Brown, P. 0. & Botstein, D. Cluster analysis
and display of genome-wide expression patterns. Proc. Nat/. Acad. Sci. U
S A 95, 14863-8 (1998).
35. Heyer, L. J., Kruglyak, S. & Yooseph, S. Exploring expression data:
Identification and analysis of coexpressed genes. Genome Res. 9, 1106-
15(1999).
36. Tamayo, P. et al. Interpreting patterns of gene expression with self-
organizing maps: methods and application to hematopoietic differentiation.
Proc. Nat. Acad. Sci. U S A 96, 2907-12 (1999).
37. Aach, J., Rindone, W. & Church, G. M. Systematic management and
analysis of yeast gene expression data. Genome Res. 10, 431-45 (2000).
38. Ermolaeva, 0. et al. Data management and analysis for gene expression
arrays. Nat. Gene.t 20, 19-23 (1998).
39. Wyrick, J. J. et al. Chromosomal landscape of nucleosome-dependent
gene expression and silencing in yeast. Science 402, 418-21 (1999).
40. Moore, D. S. & McCabe, G. P. Introduction to the practice of statistics (W.H. Freeman and Company, New York, 1998).
80

Chapter 5
Conclusions and Future Directions
81
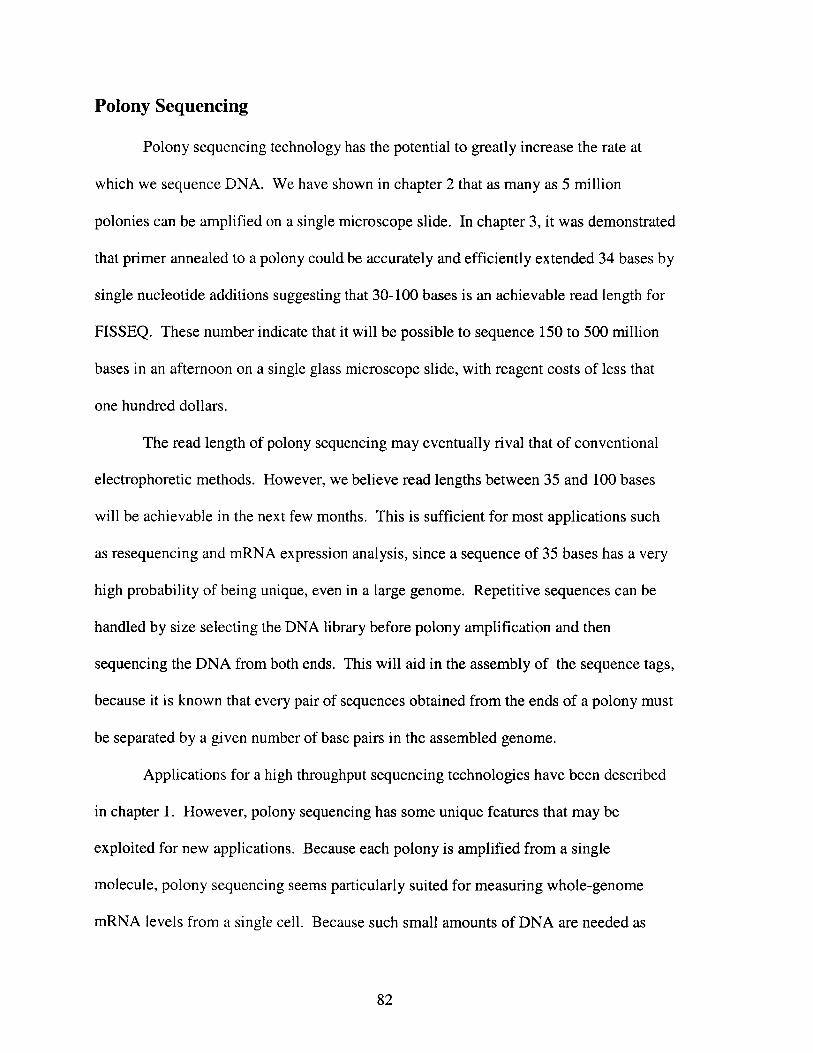
Polony Sequencing
Polony sequencing technology has the potential to greatly increase the rate at
which we sequence DNA. We have shown in chapter 2 that as many as 5 million
polonies can be amplified on a single microscope slide. In chapter 3, it was demonstrated
that primer annealed to a polony could be accurately and efficiently extended 34 bases by
single nucleotide additions suggesting that 30-100 bases is an achievable read length for
FISSEQ. These number indicate that it will be possible to sequence 150 to 500 million
bases in an afternoon on a single glass microscope slide, with reagent costs of less that
one hundred dollars.
The read length of polony sequencing may eventually rival that of conventional
electrophoretic methods. However, we believe read lengths between 35 and 100 bases
will be achievable in the next few months. This is sufficient for most applications such
as resequencing and mRNA expression analysis, since a sequence of 35 bases has a very
high probability of being unique, even in a large genome. Repetitive sequences can be
handled by size selecting the DNA library before polony amplification and then
sequencing the DNA from both ends. This will aid in the assembly of the sequence tags,
because it is known that every pair of sequences obtained from the ends of a polony must
be separated by a given number of base pairs in the assembled genome.
Applications for a high throughput sequencing technologies have been described
in chapter 1. However, polony sequencing has some unique features that may be
exploited for new applications. Because each polony is amplified from a single
molecule, polony sequencing seems particularly suited for measuring whole-genome
mRNA levels from a single cell. Because such small amounts of DNA are needed as
82
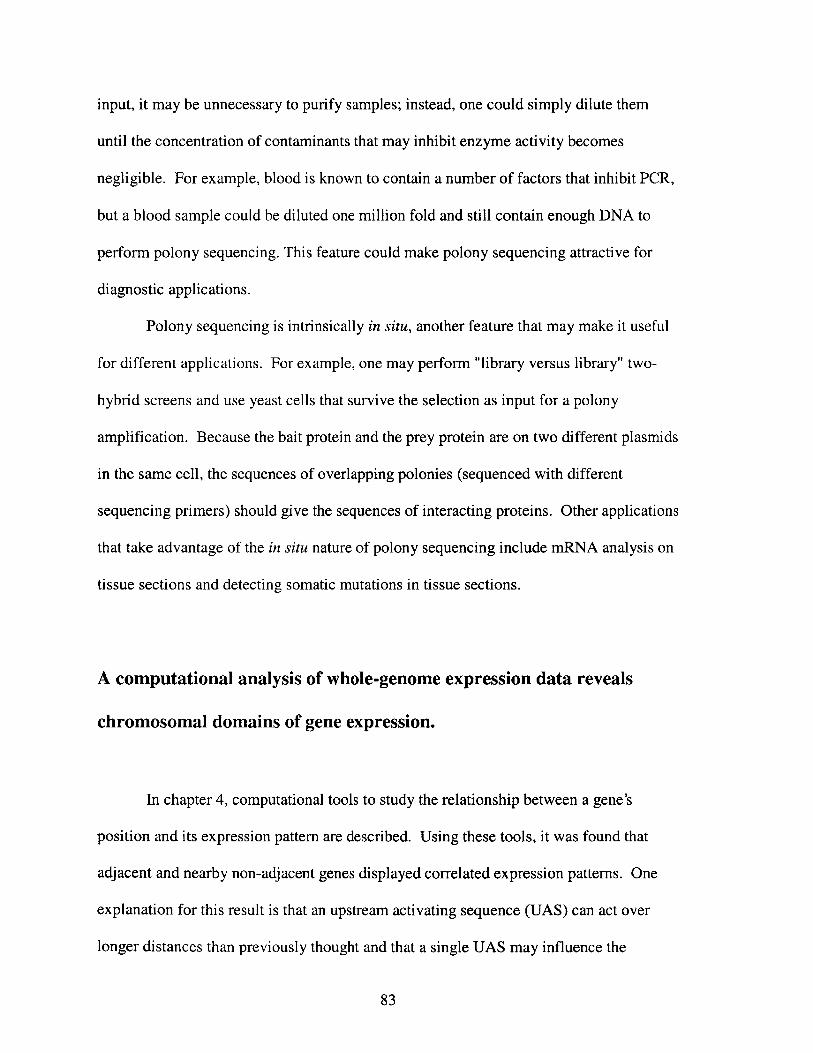
input, it may be unnecessary to purify samples; instead, one could simply dilute them
until the concentration of contaminants that may inhibit enzyme activity becomes
negligible. For example, blood is known to contain a number of factors that inhibit PCR,
but a blood sample could be diluted one million fold and still contain enough DNA to
perform polony sequencing. This feature could make polony sequencing attractive for
diagnostic applications.
Polony sequencing is intrinsically in situ, another feature that may make it useful
for different applications. For example, one may perform "library versus library" two-
hybrid screens and use yeast cells that survive the selection as input for a polony
amplification. Because the bait protein and the prey protein are on two different plasmids
in the same cell, the sequences of overlapping polonies (sequenced with different
sequencing primers) should give the sequences of interacting proteins. Other applications
that take advantage of the in situ nature of polony sequencing include mRNA analysis on
tissue sections and detecting somatic mutations in tissue sections.
A computational analysis of whole-genome expression data reveals
chromosomal domains of gene expression.
In chapter 4, computational tools to study the relationship between a gene's
position and its expression pattern are described. Using these tools, it was found that
adjacent and nearby non-adjacent genes displayed correlated expression patterns. One
explanation for this result is that an upstream activating sequence (UAS) can act over
longer distances than previously thought and that a single UAS may influence the
83

expression of more than one gene. We next plan to test this hypothesis experimentally by
mutating UASs that have been identified as candidates to control 2 or more adjacent
genes over a large distance. We also plan on introducing mutations in the TATA
elements of the two genes that are putatively under the control of the candidate UAS.
This panel of mutants will allow us to determine whether the candidate UAS binds a
factor that can initiate transcription on two nearby genes, or if the UAS binds a factor that
initiates transcription on only one nearby gene but the process of transcribing that gene
somehow increases that probability that the neighboring gene is transcribed.
Another interesting result described in chapter 4 is that only 10-15% of all gene
pairs display regional coexpression. Even at a given intergenic distance, some gene pairs
are highly correlated while others are not. One possibility is that there are sequences that
determine where and when regional coexpression occurs. We will attempt to find these
sequences by comparing gene pairs that co-express to pairs that do not co-express and
attempting to identify over-represented sequences in either group.
It will also be interesting to create "inter-chromosome" correlation maps. These
maps would be analogous to the chromosome correlation map described in chapter 4, but
now the correlations between two chromosomes are visualized. If regions of different
chromosomes are co-regulated, this type of tool should identify them. Finally it will be
interesting to perform this type of position analysis in other organisms to see if regional
coexpression is a phenomenon common to all eukaryotes.
84

85

Appendix A
Fluorescence Resonance Energy Transfer Between
Blue-Emitting and Red-Shifted Excitation Derivatives
of the Green Fluorescent Protein
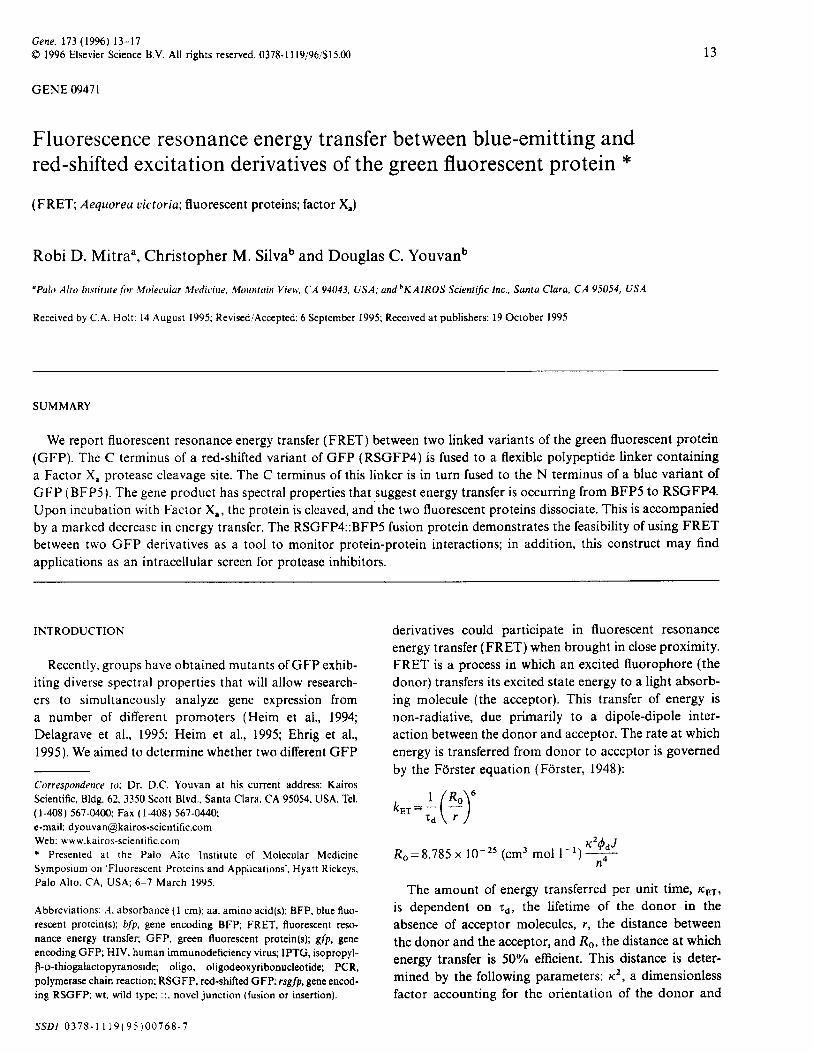
Gene, 173 (1996) 13-17C 1996 Elsevier Science B.V. All rights reserved. 0378-1l19/96/S15.00
GENE 09471
Fluorescence resonance energy transfer between blue-emitting andred-shifted excitation derivatives of the green fluorescent protein *
(FRET; Aequorea victoria; fluorescent proteins; factor Xa)
Robi D. Mitraa, Christopher M. Silva' and Douglas C. Youvanb
'Palo Alto Institute for Molecular Medicine. Mountain View, CA 94043, USA; and 'KAIROS Scientific Inc., Santa Clara, CA 95054, USA
Received by C.A. Holt: 14 August 1995: Revised/Accepted: 6 September 1995; Received at publishers: 19 October 1995
13
SUMMARY
We report fluorescent resonance energy transfer (FRET) between two linked variants of the green fluorescent protein
(GFP). The C terminus of a red-shifted variant of GFP (RSGFP4) is fused to a flexible polypeptide linker containing
a Factor Xa protease cleavage site. The C terminus of this linker is in turn fused to the N terminus of a blue variant of
GFP (BFP5). The gene product has spectral properties that suggest energy transfer is occurring from BFP5 to RSGFP4.Upon incubation with Factor Xa, the protein is cleaved, and the two fluorescent proteins dissociate. This is accompaniedby a marked decrease in energy transfer. The RSGFP4::BFP5 fusion protein demonstrates the feasibility of using FRETbetween two GFP derivatives as a tool to monitor protein-protein interactions; in addition, this construct may findapplications as an intracellular screen for protease inhibitors.
INTRODUCTION
Recently, groups have obtained mutants of GFP exhib-iting diverse spectral properties that will allow research-ers to simultaneously analyze gene expression froma number of different promoters (Heim et al., 1994;Delagrave et al., 1995; Heim et al., 1995; Ehrig et al.,1995). We aimed to determine whether two different GFP
Correspondence to; Dr. D.C. Youvan at his current address: KairosScientific, Bldg. 62, 3350 Scott Blvd., Santa Clara, CA 95054, USA. Tel.(1-408) 567-0400; Fax (1-408) 567-0440;e-mail: [email protected]: www.kairos-scientific.com* Presented at the Palo Alto Institute of Molecular MedicineSymposium on 'Fluorescent Proteins and Applications', Hyatt Rickeys.Palo Alto, CA, USA; 6-7 March 1995.
Abbreviations: A, absorbance (1 cm); aa. amino acid(s): BFP, blue fluo-rescent protein(s); bfp, gene encoding BFP; FRET, fluorescent reso-nance energy transfer; GFP, green fluorescent protein(s); gfp, geneencoding GFP; HIV. human immunodeficiency virus; IPTG, isopropyl-P-o-thiogalactopyranoside; oligo, oligodeoxyribonucleotide; PCR,polymerase chain reaction; RSGFP, red-shifted GFP; rsgfp, gene encod-ing RSGFP; wt, wild type; ::. novel junction (fusion or insertion).
derivatives could participate in fluorescent resonanceenergy transfer (FRET) when brought in close proximity.FRET is a process in which an excited fluorophore (the
donor) transfers its excited state energy to a light absorb-
ing molecule (the acceptor). This transfer of energy isnon-radiative, due primarily to a dipole-dipole inter-action between the donor and acceptor. The rate at which
energy is transferred from donor to acceptor is governed
by the F5rster equation (Forster, 1948):
1 (Ro\ 6
kET ~ -d\
Td \r
Ro=8.785 x 1025 (cm3 mol 1 ) n4
The amount of energy transferred per unit time, KIET,
is dependent on rd, the lifetime of the donor in theabsence of acceptor molecules, r, the distance between
the donor and the acceptor, and R0 , the distance at which
energy transfer is 50% efficient. This distance is deter-
mined by the following parameters: K2, a dimensionlessfactor accounting for the orientation of the donor and
SSDI 0378-1119(95)00768-7
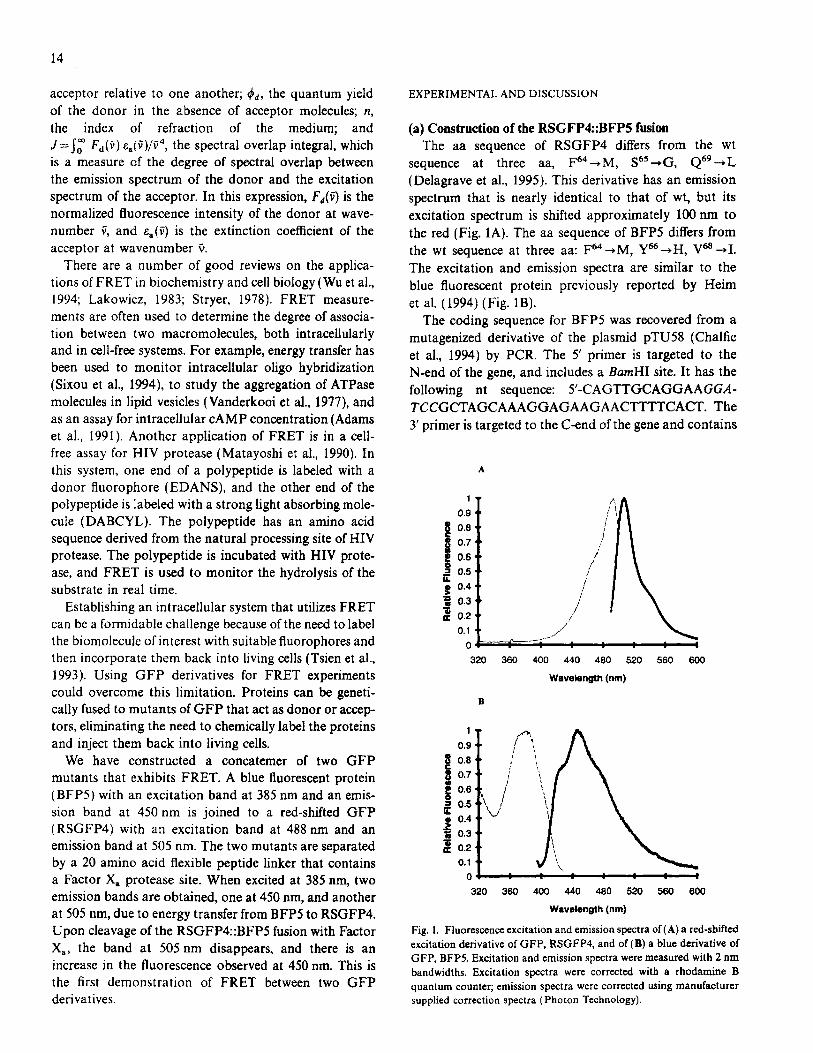
14
acceptor relative to one another; 4d, the quantum yield
of the donor in the absence of acceptor molecules; n,the index of refraction of the medium; andJ=IJ FA) a(i)/i 4, the spectral overlap integral, whichis a measure of the degree of spectral overlap betweenthe emission spectrum of the donor and the excitationspectrum of the acceptor. In this expression, Fd(v) is thenormalized fluorescence intensity of the donor at wave-number iV, and ea(i) is the extinction coefficient of theacceptor at wavenumber i.
There are a number of good reviews on the applica-tions of FRET in biochemistry and cell biology (Wu et al.,1994; Lakowicz, 1983; Stryer, 1978). FRET measure-ments are often used to determine the degree of associa-tion between two macromolecules, both intracellularlyand in cell-free systems. For example, energy transfer hasbeen used to monitor intracellular oligo hybridization(Sixou et al., 1994), to study the aggregation of ATPasemolecules in lipid vesicles (Vanderkooi et al., 1977), andas an assay for intracellular cAMP concentration (Adamset al., 1991). Another application of FRET is in a cell-free assay for HIV protease (Matayoshi et al., 1990). Inthis system, one end of a polypeptide is labeled with adonor fluorophore (EDANS), and the other end of thepolypeptide is labeled with a strong light absorbing mole-cule (DABCYL). The polypeptide has an amino acidsequence derived from the natural processing site of HIVprotease. The polypeptide is incubated with HIV prote-ase, and FRET is used to monitor the hydrolysis of thesubstrate in real time.
Establishing an intracellular system that utilizes FRETcan be a formidable challenge because of the need to labelthe biomolecule of interest with suitable fluorophores andthen incorporate them back into living cells (Tsien et al.,1993). Using GFP derivatives for FRET experimentscould overcome this limitation. Proteins can be geneti-cally fused to mutants of GFP that act as donor or accep-tors, eliminating the need to chemically label the proteinsand inject them back into living cells.
We have constructed a concatemer of two GFPmutants that exhibits FRET. A blue fluorescent protein(BFP5) with an excitation band at 385 nm and an emis-sion band at 450 nm is joined to a red-shifted GFP(RSGFP4) with an excitation band at 488 nm and anemission band at 505 nm. The two mutants are separatedby a 20 amino acid flexible peptide linker that containsa Factor Xa protease site. When excited at 385 nm, twoemission bands are obtained, one at 450 nm, and anotherat 505 nm, due to energy transfer from BFP5 to RSGFP4.Upon cleavage of the RSGFP4::BFP5 fusion with FactorXa., the band at 505 nm disappears, and there is anincrease in the fluorescence observed at 450 nm. This isthe first demonstration of FRET between two GFPderivatives.
EXPERIMENTAL AND DISCUSSION
(a) Construction of the RSGFP4::BFP5 fusionThe aa sequence of RSGFP4 differs from the wt
sequence at three aa, F64 -M, S65 -- G, Q69 -L(Delagrave et al., 1995). This derivative has an emissionspectrum that is nearly identical to that of wt, but its
excitation spectrum is shifted approximately 100 nm tothe red (Fig. 1A). The aa sequence of BFP5 differs fromthe wt sequence at three aa: F64 -M, Y66 -4H, V68 -*I
The excitation and emission spectra are similar to theblue fluorescent protein previously reported by Heimet al. (1994) (Fig. IB).
The coding sequence for BFP5 was recovered from amutagenized derivative of the plasmid pTU58 (Chalfieet al., 1994) by PCR. The 5' primer is targeted to theN-end of the gene, and includes a BamHI site. It has thefollowing nt sequence: 5'-CAGTTGCAGGAAGGA-TCCGCTAGCAAAGGAGAAGAACTTTTCACT. The3' primer is targeted to the C-end of the gene and contains
A
IS
U*1
1'0.90.8,0.7-0.60.5-0.40.3,0.2,0.11
01320 360 400
'I \
/7
/
/
pp.,.
440 480 520
Vavelength (nm)
560 600
B
aC
.
Ix
1
0.90.84.
0.70.8
0.4.0.30.20.1
0320 360 400 440 480
Wavelength (nm)
520 560 600
Fig. 1. Fluorescence excitation and emission spectra of (A) a red-shiftedexcitation derivative of GFP, RSGFP4, and of (B) a blue derivative ofGFP, BFP5. Excitation and emission spectra were measured with 2 nmbandwidths. Excitation spectra were corrected with a rhodamine Bquantum counter; emission spectra were corrected using manufacturersupplied correction spectra (Photon Technology).

15
a Xhol site: 5'-CCTGGCCTAAACTCGAGTTTGTATA-GTTCATCCATGCCATG. The PCR product was thencloned between the BamHI and XhoI sites of pET30a(Novagen). This construct is called pB530a.
The rsgfp4 gene was also recovered from a mutagen-ized derivative of pTU58 (Delagrave et al., 1995) by PCR.The 5' primer contains a BamHI site and has thefollowing sequence: 5'-CCACATGAATGGGGATCC-GAATTCGAGCTCATGGCTAGCAAAGGAGAAGA-ACTTT. The 3' primer is targeted to the C-end of rsgfp4,and contains the nucleotide sequence for the peptidelinker separating the two mutants in the RSGFP4::BFP5construct, as well as a BamHI site. The 3' primer has thefollowing sequence: 5'-TATTAGACTGGGATCCACT-TGAACTGCTACGACCCTCGATACCGCTTGAGCT-ACTTCCACTACTTGATGATTTGTATAGTTCATCC-ATGCCATGTGT. The PCR product was then clonedbetween the BgI II and BamHI sites in pB530a. This con-struct is called pR4B530a (Fig. 2). The N terminus of thegene product is labeled with His6 and an 11 aa S-Tag.The linker separating the two mutants has the aasequence: SSSSGSSSSGIEGRSSSSGS. Factor Xa cleavespreferentially after the sequence IEGR.
(b) Spectroscopic analysis of the RSGFP4-BFP5 fusionprotein
Plasmid pR4B530a was transformed into Escherichiacoli strain BL21(DE3). A 300 ml culture was grown at25'C and induced at A 600 =0.9 with 100 pM IPTG. Theculture was left at room temperature overnight, and thecells were harvested by centrifugation. Growth and
EooRIT7 BamHI Sad
Promoter RSGFP4Linker
HI
S-Tag BFP5
lac I Xhot
pR413530a MOii(6894bp) fi Origin
ra lIII
Kan
Sma I
Fig. 2. Plasmid pR4B530a, a pET30a derivative containing thersgfp4::bfp5 gene. Kan, kanamycin-resistance marker; arrows mark ori-entation of transcription.
induction at room temperature was found to significantlyincrease the amount of expressed protein. This was alsotrue for wt GFP. The pellet was resuspended in lysisbuffer (20 mM Tris-HC pH 8.0/100 mM NaCl/1 mMPMSF/1 [ig pepstatin A 1 pg leupeptin per ml), and thesuspension was French pressed. RSGFP4::BFP5 fusionprotein was purified using a His-bind resin (Novagen).
The emission spectrum of RSGFP4::BFP5 (Fig. 3,spectrum 1) was taken on a Photon Technology Inc. flu-orometer. Two bands are clearly visible in the emissionspectra, one at 450 nm, and a larger band at 505 nm. Toevaluate the utility of the RSGFP4::BFP5 concatemer asa tool to monitor protease activity, the emission spectrumof RSGFP4::BFP5 was taken at regular time intervalsafter the addition of the protease Factor Xa. The resultsare shown in Fig. 3 (spectra 2-8) and Fig. 4. Fig. 3 showsthe gradual increase of the 450 nm band with time, withthe concomitant decrease of the 505 nm band. There isan isosbestic point at 490 nm. The ratio of the fluores-cence at 450 nm to the fluorescence at 505 nm is plottedversus time in Fig. 4. This ratio of donor fluorescence toacceptor fluorescence varies by almost two-fold. This is
300000 -r
250000 t
i
.26.
200000
150000
100000
50000
I IK f 2
~Aj/MI
11 i -1116 1
400 450 500
Wavelength (nm)550 600
Fig. 3. Fluorescence emission spectra of the RSGFP4::BFP5 fusionprotein at various time points during cleavage with Factor X.. Theprotease was added at time zero. Spectrum 1= 0 min, spectrum 2 = 6min, spectrum 3=12 min, spectrum 4=18 min, spectrum 5=24 min,spectrum 6=36 min, spectrum 7=48 min, spectrum 8=60 min. Thereaction was performed in 100 pl Factor X, cleavage buffer (100 mMNaCl/2 mM CaCl2/20 mM Tris-HC1 pH 8.0). Approximately 50 pg ofprotein was incubated with 1 pg of Factor X..
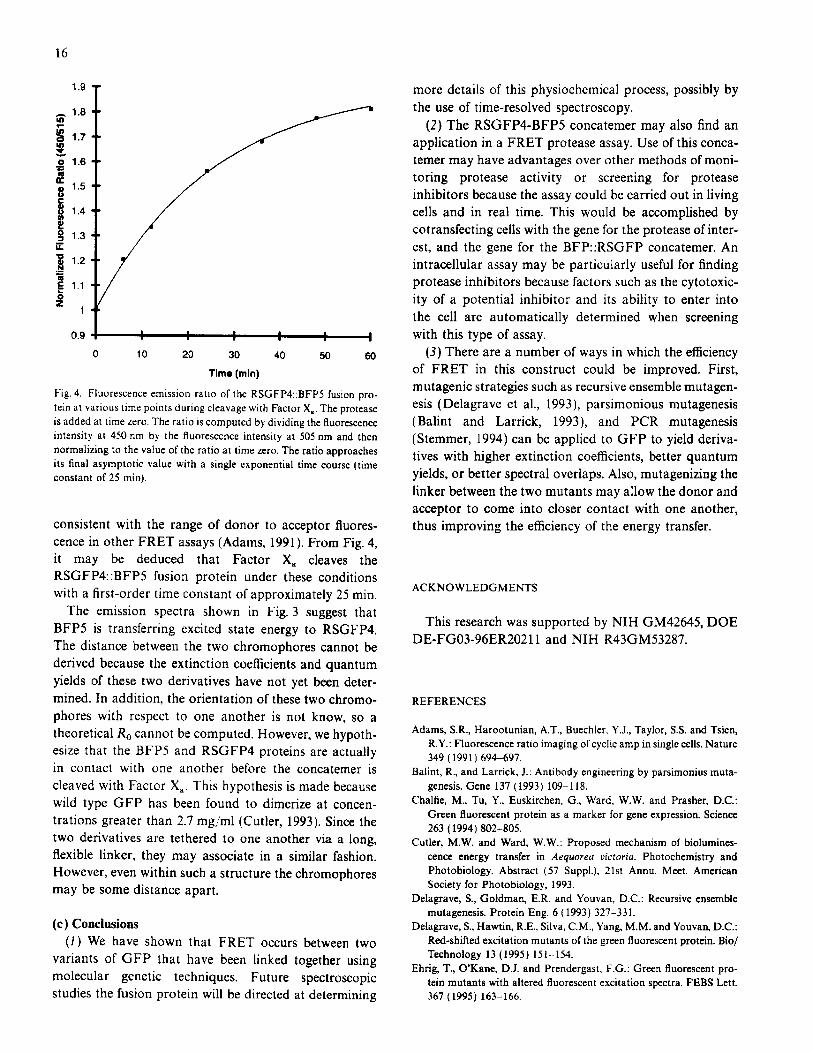
1.9
cence in other FRET assays (Adams, 1991). From Fig. 4,it may be deduced that Factor Xa cleaves theRSGFP4::BFP5 fusion protein under these conditionswith a first-order time constant of approximately 25 min.
The emission spectra shown in Fig. 3 suggest thatBFP5 is transferring excited state energy to RSGFP4.The distance between the two chromophores cannot bederived because the extinction coefficients and quantumyields of these two derivatives have not yet been deter-mined. In addition, the orientation of these two chromo-phores with respect to one another is not know, so atheoretical Ro cannot be computed. However, we hypoth-esize that the BFP5 and RSGFP4 proteins are actuallyin contact with one another before the concatemer iscleaved with Factor Xa. This hypothesis is made becausewild type GFP has been found to dimerize at concen-trations greater than 2.7 mg/ml (Cutler, 1993). Since thetwo derivatives are tethered to one another via a long,flexible linker, they may associate in a similar fashion.However, even within such a structure the chromophoresmay be some distance apart.
(c) Conclusions(1) We have shown that FRET occurs between two
variants of GFP that have been linked together usingmolecular genetic techniques. Future spectroscopicstudies the fusion protein will be directed at determining
ACKNOWLEDGMENTS
This research was supported by NIH GM42645, DOEDE-FG03-96ER20211 and NIH R43GM53287.
REFERENCES
Adams, S.R., Harootunian, A.T., Buechler, Y.J., Taylor, S.S. and Tsien,R.Y.: Fluorescence ratio imaging of cyclic amp in single cells. Nature349 (1991) 694-697.
Balint, R., and Larrick, J.: Antibody engineering by parsimonius muta-genesis. Gene 137 (1993) 109-118.
Chalfie, M., Tu, Y., Euskirchen, G., Ward, W.W. and Prasher, D.C.:Green fluorescent protein as a marker for gene expression. Science263 (1994) 802-805.
Cutler, M.W. and Ward, W.W.: Proposed mechanism of biolumines-cence energy transfer in Aequorea victoria. Photochemistry andPhotobiology. Abstract (57 Suppl.), 21st Annu. Meet. AmericanSociety for Photobiology, 1993.
Delagrave, S., Goldman, E.R. and Youvan, D.C.: Recursive ensemblemutagenesis. Protein Eng. 6 (1993) 327-331.
Delagrave, S., Hawtin, R.E., Silva, C.M., Yang, M.M. and Youvan, D.C.:Red-shifted excitation mutants of the green fluorescent protein. Bio/Technology 13 (1995) 151-154.
Ehrig, T., O'Kane, D.J. and Prendergast, F.G.: Green fluorescent pro-tein mutants with altered fluorescent excitation spectra. FEBS Lett.367 (1995) 163-166.
16
1.8
1.7
c 1.6
1.5Co 1.4
.0 1.3
1.2
Z 1
more details of this physiochemical process, possibly bythe use of time-resolved spectroscopy.
(2) The RSGFP4-BFP5 concatemer may also find anapplication in a FRET protease assay. Use of this conca-temer may have advantages over other methods of moni-toring protease activity or screening for proteaseinhibitors because the assay could be carried out in livingcells and in real time. This would be accomplished bycotransfecting cells with the gene for the protease of inter-est, and the gene for the BFP::RSGFP concatemer. Anintracellular assay may be particularly useful for findingprotease inhibitors because factors such as the cytotoxic-ity of a potential inhibitor and its ability to enter intothe cell are automatically determined when screening
I with this type of assay.0 10 20 30 40 50 60 (3) There are a number of ways in which the efficiency
Time (mi) of FRET in this construct could be improved. First,
Fluorescence emission ratio of the RSGFP4::BFP5 fusion pro- mutagenic strategies such as recursive ensemble mutagen-arious time points during cleavage with Factor X.. The protease esis (Delagrave et al., 1993), parsimonious mutagenesisat time zero. The ratio is computed by dividing the fluorescence (Balint and Larrick, 1993), and PCR mutagenesisat 450 nm by the fluorescence intensity at 505 nm and then (Stemmer, 1994) can be applied to GFP to yield deriva-
zing to the value of the ratio at time zero. The ratio approaches tives with higher extinction coefficients, better quantumasymptotic value with a single exponential time course (time .
t of 25 min). yields, or better spectral overlaps. Also, mutagenizing thelinker between the two mutants may allow the donor andacceptor to come into closer contact with one another,
ent with the range of donor to acceptor fluores- thus improving the efficiency of the energy transfer.
0.9
Fig. 4.tein at vis addedintensitynormaliits finalconstan
consist
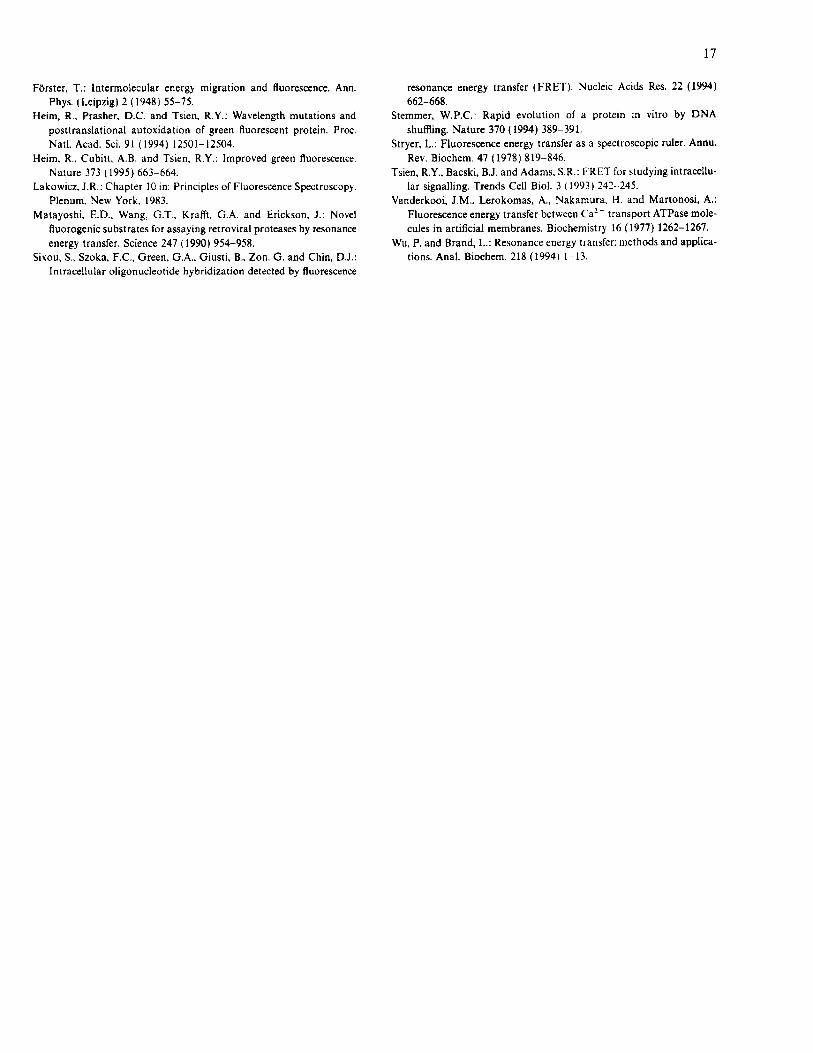
17
Forster, T.: Intermolecular energy migration and fluorescence. Ann.Phys. (Leipzig) 2 (1948) 55-75.
Heim, R., Prasher, D.C. and Tsien, R.Y.: Wavelength mutations andposttranslational autoxidation of green fluorescent protein. Proc.Nati. Acad. Sci. 91 (1994) 12501-12504.
Heim, R.. Cubitt, A.B. and Tsien, R.Y.: Improved green fluorescence.Nature 373 (1995) 663-664.
Lakowicz. J.R.: Chapter 10 in: Principles of Fluorescence Spectroscopy.Plenum, New York, 1983.
Matayoshi, E.D., Wang, G.T.. Krafft, G.A. and Erickson, J.: Novelfluorogenic substrates for assaying retroviral proteases by resonanceenergy transfer. Science 247 (1990) 954-958.
Sixou, S.. Szoka, F.C., Green, G.A.. Giusti, B., Zon. G. and Chin. D.J.:Intracellular oligonucleotide hybridization detected by fluorescence
resonance energy transfer (FRET). Nucleic Acids Res. 22 (1994)
662-668.Stemmer, W.P.C.: Rapid evolution of a protein in vitro by DNA
shuffling. Nature 370 (1994) 389-391.Stryer, L.: Fluorescence energy transfer as a spectroscopic ruler. Annu.
Rev. Biochem. 47 (1978) 819-846.Tsien, R.Y., Bacski, B.J. and Adams, S.R.: FRET for studying intracellu-
lar signalling. Trends Cell Biol. 3 (1993) 242-245.
Vanderkooi, J.M.. Lerokomas, A., Nakamura, H. and Martonosi, A.:Fluorescence energy transfer between Ca 2 - transport ATPase mole-
cules in artificial membranes. Biochemistry 16 (1977) 1262-1267.
Wu, P. and Brand, L.: Resonance energy transfer: methods and applica-
tions. Anal. Biochem. 218 (1994) 1-13.

Appendix B
Cost Estimates for Polony Sequencing
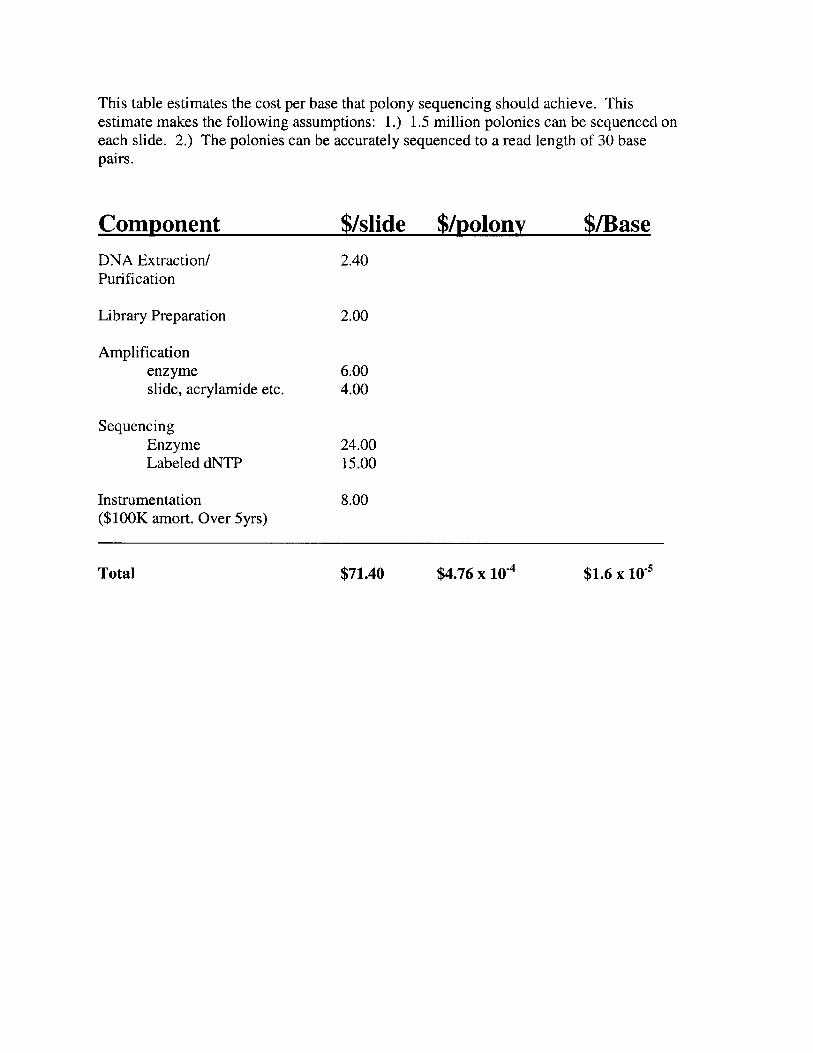
This table estimates the cost per base that polony sequencing should achieve. Thisestimate makes the following assumptions: 1.) 1.5 million polonies can be sequenced oneach slide. 2.) The polonies can be accurately sequenced to a read length of 30 basepairs.
Component $/slide $/polony $/BaseDNA Extraction/ 2.40Purification
Library Preparation 2.00
Amplificationenzyme 6.00slide, acrylamide etc. 4.00
SequencingEnzyme 24.00Labeled dNTP 15.00
Instrumentation 8.00($100K amort. Over 5yrs)
$71.40 $4.76 x 10 4 $1.6 x 10⁻⁵Total

Appendix A
Fluorescence Resonance Energy Transfer Between
Blue-Emitting and Red-Shifted Excitation Derivatives
of the Green Fluorescent Protein
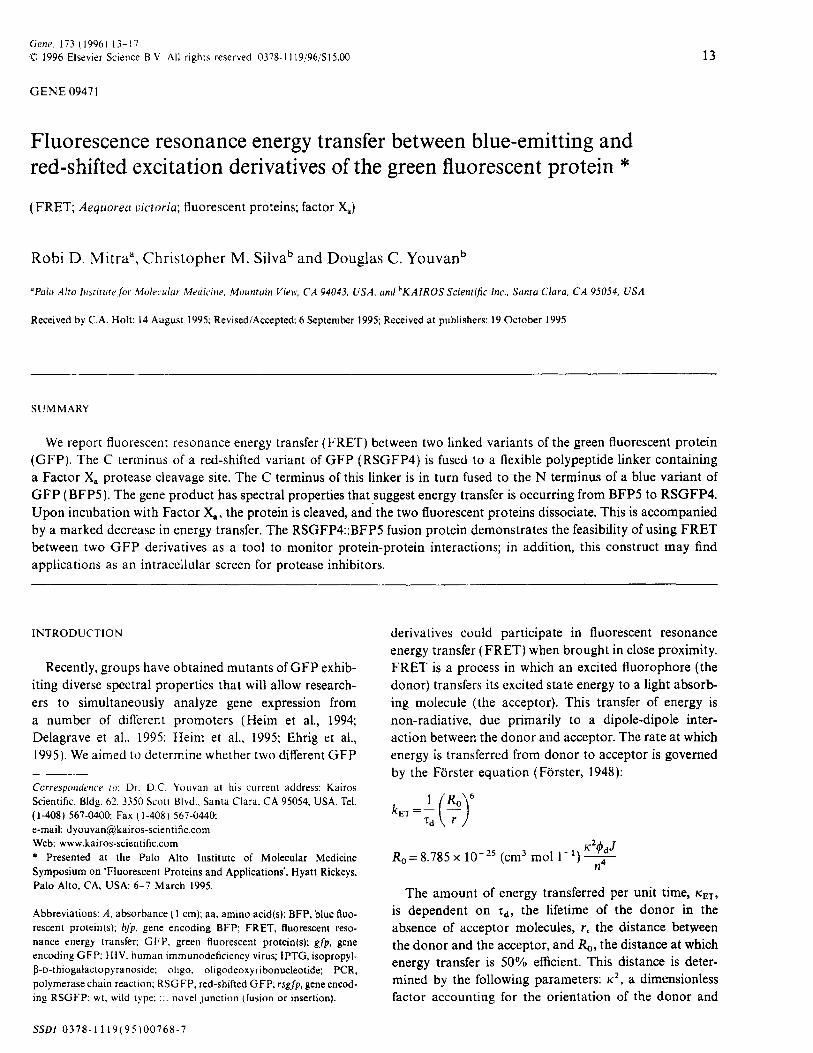
Gene, 173 (1996) 13-17( 1996 Elsevier Science B.V. All rights reserved. 0378-1l19,96/S15.00
GENE 09471
Fluorescence resonance energy transfer between blue-emitting andred-shifted excitation derivatives of the green fluorescent protein *
(FRET; Aequorea victoria; fluorescent proteins; factor Xa)
Robi D. Mitraa, Christopher M. Silva' and Douglas C. Youvan b
"Palo Alto Institute for Molecular Medicine. Mountain View, CA 94043, USA; and bKAIROS Scientific Inc., Santa Clara, CA 95054, USA
Received by C.A. Holt: 14 August 1995; Revised/Accepted: 6 September 1995; Received at publishers: 19 October 1995
13
SUMMARY
We report fluorescent resonance energy transfer (FRET) between two linked variants of the green fluorescent protein(GFP). The C terminus of a red-shifted variant of GFP (RSGFP4) is fused to a flexible polypeptide linker containinga Factor Xa protease cleavage site. The C terminus of this linker is in turn fused to the N terminus of a blue variant ofGFP (BFP5). The gene product has spectral properties that suggest energy transfer is occurring from BFP5 to RSGFP4.Upon incubation with Factor Xa, the protein is cleaved, and the two fluorescent proteins dissociate. This is accompaniedby a marked decrease in energy transfer. The RSGFP4::BFP5 fusion protein demonstrates the feasibility of using FRETbetween two GFP derivatives as a tool to monitor protein-protein interactions; in addition, this construct may findapplications as an intracellular screen for protease inhibitors.
INTRODUCTION
Recently, groups have obtained mutants of GFP exhib-iting diverse spectral properties that will allow research-ers to simultaneously analyze gene expression froma number of different promoters (Heim et al., 1994;Delagrave et al., 1995; Heim et al., 1995; Ehrig et al.,1995). We aimed to determine whether two different GFP
Correspondence to; Dr. D.C. Youvan at his current address: KairosScientific, Bldg. 62, 3350 Scott Blvd.. Santa Clara, CA 95054, USA. Tel.(1-408) 567-0400; Fax (1-408) 567-0440:e-mail: [email protected]: www.kairos-scientific.com* Presented at the Palo Alto Institute of Molecular MedicineSymposium on 'Fluorescent Proteins and Applications', Hyatt Rickeys.Palo Alto, CA, USA; 6-7 March 1995.
Abbreviations: A, absorbance (1 cm); aa. amino acid(s): BFP, blue fluo-rescent protein(s); bfp, gene encoding BFP: FRET, fluorescent reso-nance energy transfer; GFP, green fluorescent protein(s); gfp, geneencoding GFP; HIV. human immunodeficiency virus; IPTG, isopropyl-P-D-thiogalactopyranoside; oligo, oligodeoxyribonucleotide; PCR,polymerase chain reaction; RSGFP, red-shifted GFP; rsgfp, gene encod-ing RSGFP wt, wild type: ::. novel junction (fusion or insertion).
derivatives could participate in fluorescent resonanceenergy transfer (FRET) when brought in close proximity.FRET is a process in which an excited fluorophore (thedonor) transfers its excited state energy to a light absorb-ing molecule (the acceptor). This transfer of energy isnon-radiative, due primarily to a dipole-dipole inter-action between the donor and acceptor. The rate at whichenergy is transferred from donor to acceptor is governedby the Fbrster equation (F6rster, 1948):
kET= IRo 6
Td r /
Ro=8.785 x 10⁻² (cm3 mol I ) 4
The amount of energy transferred per unit time, KET,
is dependent on Td, the lifetime of the donor in theabsence of acceptor molecules, r, the distance betweenthe donor and the acceptor, and Ro, the distance at whichenergy transfer is 50% efficient. This distance is deter-mined by the following parameters: K
2, a dimensionless
factor accounting for the orientation of the donor and
SSDI 0378-1119(95)00768-7
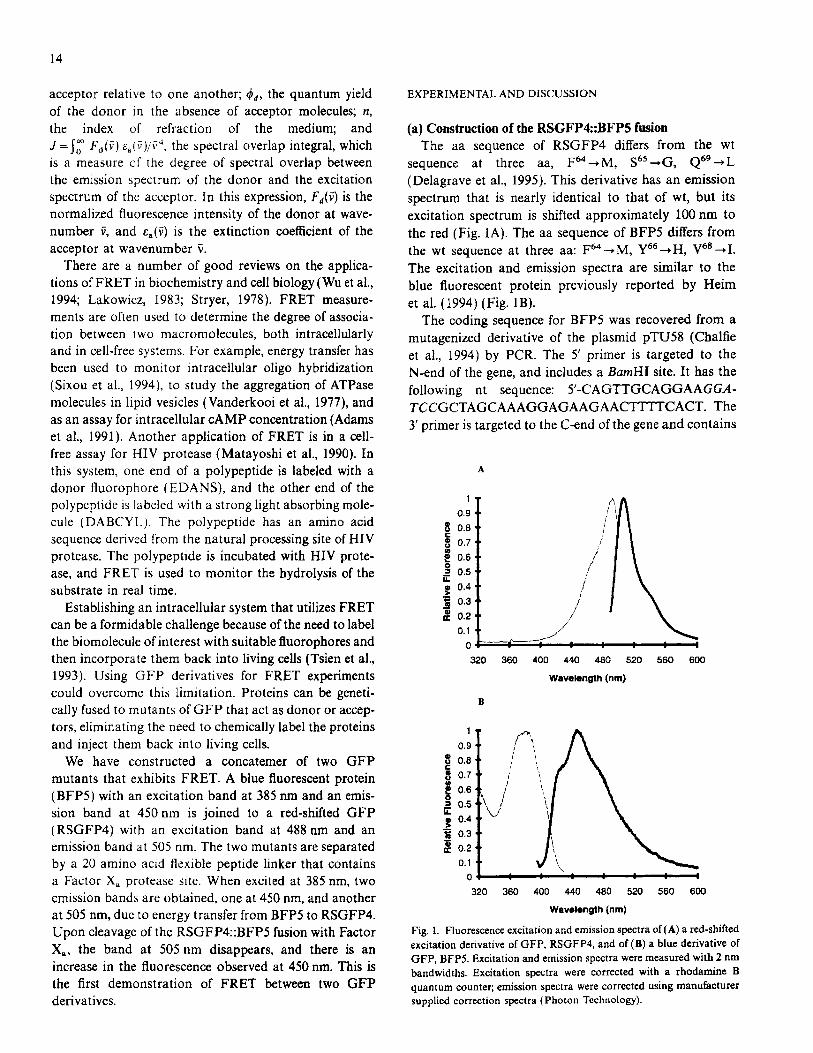
14
acceptor relative to one another; Od, the quantum yieldof the donor in the absence of acceptor molecules; n,the index of refraction of the medium; andJ==fc F(M Ea(i )/f4, the spectral overlap integral, whichis a measure of the degree of spectral overlap betweenthe emission spectrum of the donor and the excitationspectrum of the acceptor. In this expression, F(,V) is thenormalized fluorescence intensity of the donor at wave-number iV, and ea(V) is the extinction coefficient of theacceptor at wavenumber i'.
There are a number of good reviews on the applica-tions of FRET in biochemistry and cell biology (Wu et al.,1994; Lakowicz, 1983; Stryer, 1978). FRET measure-ments are often used to determine the degree of associa-tion between two macromolecules, both intracellularlyand in cell-free systems. For example, energy transfer hasbeen used to monitor intracellular oligo hybridization(Sixou et al., 1994), to study the aggregation of ATPasemolecules in lipid vesicles (Vanderkooi et al., 1977), andas an assay for intracellular cAMP concentration (Adamset al., 1991). Another application of FRET is in a cell-free assay for HIV protease (Matayoshi et al., 1990). Inthis system, one end of a polypeptide is labeled with adonor fluorophore (EDANS), and the other end of thepolypeptide is labeled with a strong light absorbing mole-cule (DABCYL). The polypeptide has an amino acidsequence derived from the natural processing site of HIVprotease. The polypeptide is incubated with HIV prote-ase, and FRET is used to monitor the hydrolysis of thesubstrate in real time.
Establishing an intracellular system that utilizes FRETcan be a formidable challenge because of the need to labelthe biomolecule of interest with suitable fluorophores andthen incorporate them back into living cells (Tsien et al.,1993). Using GFP derivatives for FRET experimentscould overcome this limitation. Proteins can be geneti-cally fused to mutants of GFP that act as donor or accep-tors, eliminating the need to chemically label the proteinsand inject them back into living cells.
We have constructed a concatemer of two GFPmutants that exhibits FRET. A blue fluorescent protein(BFP5) with an excitation band at 385 nm and an emis-sion band at 450 nm is joined to a red-shifted GFP(RSGFP4) with an excitation band at 488 nm and anemission band at 505 nm. The two mutants are separatedby a 20 amino acid flexible peptide linker that containsa Factor Xa protease site. When excited at 385 nm, twoemission bands are obtained, one at 450 nm, and anotherat 505 nm, due to energy transfer from BFP5 to RSGFP4.Upon cleavage of the RSGFP4::BFP5 fusion with FactorXa, the band at 505 nm disappears, and there is anincrease in the fluorescence observed at 450 nm. This isthe first demonstration of FRET between two GFPderivatives.
EXPERIMENTAL AND DISCUSSION
(a) Construction of the RSGFP4::BFP5 fusionThe aa sequence of RSGFP4 differs from the wt
sequence at three aa, F 64 -+M, S 65 --+G, Q 69 -+L
(Delagrave et al., 1995). This derivative has an emissionspectrum that is nearly identical to that of wt, but its
excitation spectrum is shifted approximately 100 nm to
the red (Fig. 1A). The aa sequence of BFP5 differs from
the wt sequence at three aa: F 64 -*M, Y66 -+H, V68 -I.
The excitation and emission spectra are similar to the
blue fluorescent protein previously reported by Heimet al. (1994) (Fig. 1B).
The coding sequence for BFP5 was recovered from a
mutagenized derivative of the plasmid pTU58 (Chalfieet al., 1994) by PCR. The 5' primer is targeted to theN-end of the gene, and includes a BamHI site. It has the
following nt sequence: 5'-CAGTTGCAGGAAGGA-TCCGCTAGCAAAGGAGAAGAACTTTTCACT. The3' primer is targeted to the C-end of the gene and contains
A
8CaUU,00
0
0
1'0.9'0.8,0.7-0.6,0.5.0.4-0.3,0.2'0.1
0
.1'/
/
/
320 360 400 440 480 520 560 600
Wavelength (nm)
B
8
C
LL
>0
1
0.90.80.70.60.50.4-0.30.20.1
01
/
.\ /
360 400 440 480
Wavelength (nm)
520 560 600
Fig. 1. Fluorescence excitation and emission spectra of (A) a red-shifted
excitation derivative of GFP, RSGFP4, and of (B) a blue derivative of
GFP, BFP5. Excitation and emission spectra were measured with 2 nm
bandwidths. Excitation spectra were corrected with a rhodamine B
quantum counter; emission spectra were corrected using manufacturer
supplied correction spectra (Photon Technology).
0
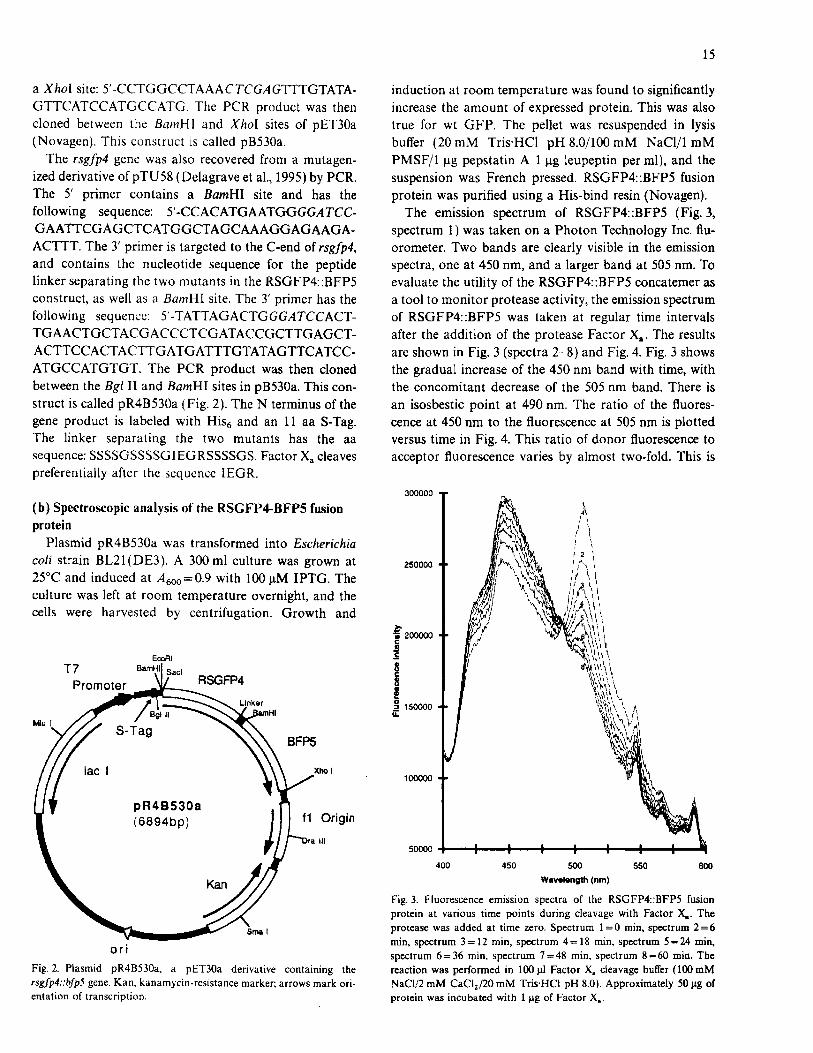
15
a Xhol site: 5'-CCTGGCCTAAACTCGAGTTTGTATA-GTTCATCCATGCCATG. The PCR product was thencloned between the BamHI and Xhol sites of pET30a(Novagen). This construct is called pB530a.
The rsgfp4 gene was also recovered from a mutagen-ized derivative of pTU58 (Delagrave et al., 1995) by PCR.The 5' primer contains a BamHI site and has thefollowing sequence: 5'-CCACATGAATGGGGATCC-GAATTCGAGCTCATGGCTAGCAAAGGAGAAGA-ACTTT. The 3' primer is targeted to the C-end of rsgfp4,and contains the nucleotide sequence for the peptidelinker separating the two mutants in the RSGFP4::BFP5construct, as well as a BamHI site. The 3' primer has thefollowing sequence: 5'-TATTAGACTGGGATCCACT-TGAACTGCTACGACCCTCGATACCGCTTGAGCT-ACTTCCACTACTTGATGATTTGTATAGTTCATCC-ATGCCATGTGT. The PCR product was then clonedbetween the BgI 1I and BamHI sites in pB530a. This con-struct is called pR4B530a (Fig. 2). The N terminus of thegene product is labeled with His6 and an 11 aa S-Tag.The linker separating the two mutants has the aasequence: SSSSGSSSSGIEGRSSSSGS. Factor Xa cleavespreferentially after the sequence IEGR.
(b) Spectroscopic analysis of the RSGFP4-BFP5 fusionprotein
Plasmid pR4B530a was transformed into Escherichiacoli strain BL21(DE3). A 300 ml culture was grown at25'C and induced at A 600 =0.9 with 100 pM IPTG. Theculture was left at room temperature overnight, and thecells were harvested by centrifugation. Growth and
Ecol
T7 BamHI Sad
Promoter RSGFP4
Linker
MUI/ Bgl 11 HI
S-Tag BFP5
lac I Xho I
pR4B530a f Origin(6894bp) 1 rgi
ra il
oKaSmna I
Fig. 2. Plasmid pR4B530a, a pET30a derivative containing thersgfp4::bfp5 gene. Kan, kanamycin-resistance marker; arrows mark ori-entation of transcription.
induction at room temperature was found to significantlyincrease the amount of expressed protein. This was alsotrue for wt GFP. The pellet was resuspended in lysisbuffer (20 mM Tris-HC pH 8.0/100 mM NaCl/1 mMPMSF/1 tg pepstatin A 1 gg leupeptin per ml), and thesuspension was French pressed. RSGFP4::BFP5 fusionprotein was purified using a His-bind resin (Novagen).
The emission spectrum of RSGFP4::BFP5 (Fig. 3,spectrum 1) was taken on a Photon Technology Inc. flu-orometer. Two bands are clearly visible in the emissionspectra, one at 450 nm, and a larger band at 505 nm. Toevaluate the utility of the RSGFP4::BFP5 concatemer asa tool to monitor protease activity, the emission spectrumof RSGFP4::BFP5 was taken at regular time intervalsafter the addition of the protease Factor Xa. The resultsare shown in Fig. 3 (spectra 2-8) and Fig. 4. Fig. 3 showsthe gradual increase of the 450 nm band with time, withthe concomitant decrease of the 505 nm band. There isan isosbestic point at 490 nm. The ratio of the fluores-cence at 450 nm to the fluorescence at 505 nm is plottedversus time in Fig. 4. This ratio of donor fluorescence toacceptor fluorescence varies by almost two-fold. This is
300000 -1
250000 4
f 200000C0SC
0
. 150000U.
I I~ !i .
r- / iv
AN I A )
4
100000*
50000 U'
400 450 500
Wavelength (nm)
5 6
550 600
Fig. 3. Fluorescence emission spectra of the RSGFP4::BFP5 fusionprotein at various time points during cleavage with Factor X.. Theprotease was added at time zero. Spectrum 1= 0 min, spectrum 2= 6min, spectrum 3 = 12 min, spectrum 4 =18 min, spectrum 5 = 24 min,spectrum 6 = 36 min, spectrum 7=48 min, spectrum 8 = 60 min. Thereaction was performed in 100 tl Factor X. cleavage buffer (100 mMNaCl/2 mM CaCI2 /20 mM Tris-HCl pH 8.0). Approximately 50 pg ofprotein was incubated with 1 pg of Factor X..
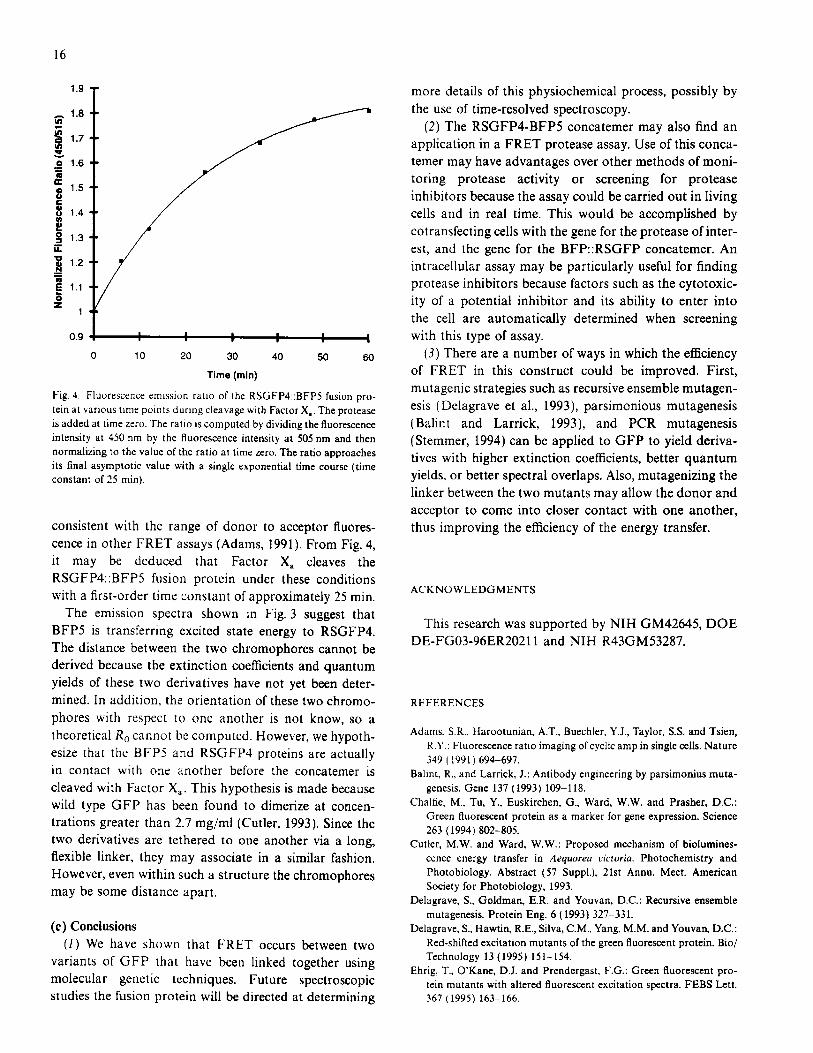
16
1.9 T
I0
U0
U.
00
1.8
1.7
1.6
1.5
1.4
1.3
1.2
1.1
0.9 I I
0 10 20 30
Time (mi)
Fig. 4. Fluorescence emission ratio of the RSGtein at various time points during cleavage withis added at time zero. The ratio is computed by dintensity at 450 nm by the fluorescence intensinormalizing to the value of the ratio at time zerits final asymptotic value with a single exponeconstant of 25 min).
consistent with the range of donor t
more details of this physiochemical process, possibly bythe use of time-resolved spectroscopy.
(2) The RSGFP4-BFP5 concatemer may also find anapplication in a FRET protease assay. Use of this conca-temer may have advantages over other methods of moni-toring protease activity or screening for proteaseinhibitors because the assay could be carried out in livingcells and in real time. This would be accomplished bycotransfecting cells with the gene for the protease of inter-est, and the gene for the BFP::RSGFP concatemer. Anintracellular assay may be particularly useful for findingprotease inhibitors because factors such as the cytotoxic-ity of a potential inhibitor and its ability to enter intothe cell are automatically determined when screening
with this type of assay.40 50 60 (3) There are a number of ways in which the efficiency
of FRET in this construct could be improved. First,
FP4::BFP5 fusion pro- mutagenic strategies such as recursive ensemble mutagen-Factor X.. The protease esis (Delagrave et al., 1993), parsimonious mutagenesisividing the fluorescence (Balint and Larrick, 1993), and PCR mutagenesisty at 505 nm and then (Stemmer, 1994) can be applied to GFP to yield deriva-o. The ratio approaches tives with higher extinction coefficients, better quantumntial time course (time yields, or better spectral overlaps. Also, mutagenizing the
linker between the two mutants may allow the donor andacceptor to come into closer contact with one another,
acceptor fluores- thus improving the efficiency of the energy transfer.cence in other FRET assays (Adams, 1991). From Fig. 4,it may be deduced that Factor Xa cleaves theRSGFP4::BFP5 fusion protein under these conditionswith a first-order time constant of approximately 25 min.
The emission spectra shown in Fig. 3 suggest thatBFP5 is transferring excited state energy to RSGFP4.The distance between the two chromophores cannot bederived because the extinction coefficients and quantumyields of these two derivatives have not yet been deter-mined. In addition, the orientation of these two chromo-phores with respect to one another is not know, so atheoretical Ro cannot be computed. However, we hypoth-esize that the BFP5 and RSGFP4 proteins are actuallyin contact with one another before the concatemer iscleaved with Factor Xa. This hypothesis is made becausewild type GFP has been found to dimerize at concen-trations greater than 2.7 mg/ml (Cutler, 1993). Since thetwo derivatives are tethered to one another via a long,flexible linker, they may associate in a similar fashion.However, even within such a structure the chromophoresmay be some distance apart.
(c) Conclusions(1) We have shown that FRET occurs between two
variants of GFP that have been linked together usingmolecular genetic techniques. Future spectroscopicstudies the fusion protein will be directed at determining
ACKNOWLEDGMENTS
This research was supported by NIH GM42645, DOEDE-FGO3-96ER20211 and NIH R43GM53287.
REFERENCES
Adams, S.R., Harootunian, A.T., Buechler, Y.J., Taylor, S.S. and Tsien,R.Y.: Fluorescence ratio imaging of cyclic amp in single cells. Nature349 (1991) 694-697.
Balint, R., and Larrick, J.: Antibody engineering by parsimonius muta-genesis. Gene 137 (1993) 109-118.
Chalfie, M., Tu, Y., Euskirchen, G., Ward, W.W. and Prasher, D.C.:Green fluorescent protein as a marker for gene expression. Science263 (1994) 802-805.
Cutler, M.W. and Ward, W.W.: Proposed mechanism of biolumines-cence energy transfer in Aequorea victoria. Photochemistry andPhotobiology. Abstract (57 Suppl.). 21st Annu. Meet. AmericanSociety for Photobiology, 1993.
Delagrave, S., Goldman, E.R. and Youvan, D.C.: Recursive ensemblemutagenesis. Protein Eng. 6 (1993) 327-331.
Delagrave, S., Hawtin, R.E., Silva, C.M., Yang, M.M. and Youvan, D.C.:Red-shifted excitation mutants of the green fluorescent protein. Bio/Technology 13 (1995) 151-154.
Ehrig, T., O'Kane, D.J. and Prendergast, F.G.: Green fluorescent pro-tein mutants with altered fluorescent excitation spectra. FEBS Lett.367 (1995) 163-166.
17
Forster, T.: Intermolecular energy migration and fluorescence. Ann.Phys. (Leipzig) 2 (1948) 55-75.
Heim, R., Prasher, D.C. and Tsien, R.Y.: Wavelength mutations and
posttranslational autoxidation of green fluorescent protein. Proc.Nati. Acad. Sci. 91 (1994) 12501-12504.
Heim, R., Cubitt, A.B. and Tsien, R.Y.: Improved green fluorescence.Nature 373 (1995) 663-664.
Lakowicz, J.R.: Chapter 10 in: Principles of Fluorescence Spectroscopy.Plenum, New York., 1983.
Matayoshi, E.D., Wang, G.T., Krafft, G.A. and Erickson, J.: Novelfluorogenic substrates for assaying retroviral proteases by resonanceenergy transfer. Science 247 (1990) 954-958.
Sixou, S.. Szoka, F.C., Green, G.A.. Giusti, B., Zon. G. and Chin. D.J.:Intracellular oligonucleotide hybridization detected by fluorescence
resonance energy transfer (FRET). Nucleic Acids Res. 22 (1994)
662-668.Stemmer, W.P.C.: Rapid evolution of a protein in vitro by DNA
shuffling. Nature 370 (1994) 389-391.Stryer, L.: Fluorescence energy transfer as a spectroscopic ruler. Annu.
Rev. Biochem. 47 (1978) 819-846.Tsien, R.Y., Bacski, B.J. and Adams, S.R.: FRET for studying intracellu-
lar signalling. Trends Cell Biol. 3 (1993) 242-245.Vanderkooi, J.M.. Lerokomas, A., Nakamura, H. and Martonosi, A.:
Fluorescence energy transfer between Ca2 - transport ATPase mole-
cules in artificial membranes. Biochemistry 16 (1977) 1262-1267.Wu, P. and Brand, L.: Resonance energy transfer: methods and applica-
tions. Anal. Biochem. 218 (1994) 1-13.
Appendix B
Cost Estimates for Polony Sequencing
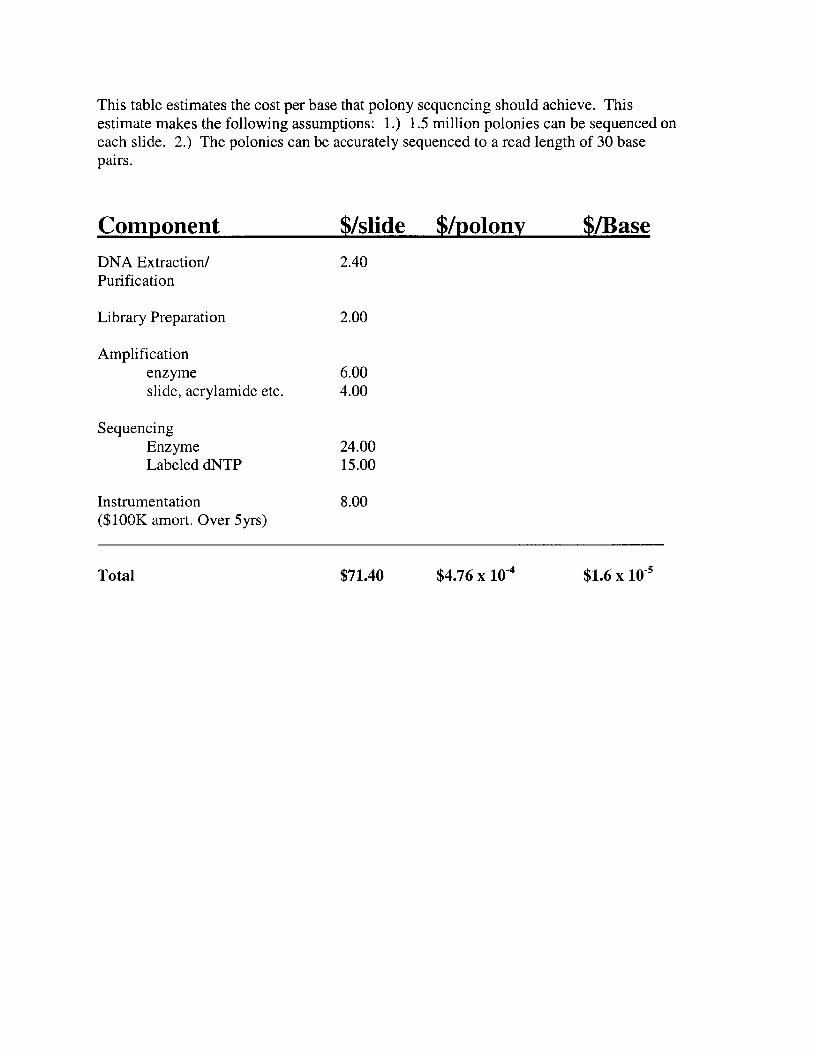
This table estimates the cost per base that polony sequencing should achieve. Thisestimate makes the following assumptions: 1.) 1.5 million polonies can be sequenced oneach slide. 2.) The polonies can be accurately sequenced to a read length of 30 basepairs.
Component $/slide $/polony $/BaseDNA Extraction/ 2.40Purification
Library Preparation 2.00
Amplificationenzyme 6.00slide, acrylamide etc. 4.00
SequencingEnzyme 24.00Labeled dNTP 15.00
Instrumentation 8.00($100K amort. Over 5yrs)
$71.40 $4.76 x 10⁻⁴ $1.6 x 10-sTotal