polyelectrolyte complexes: - diva portal
TRANSCRIPT
Polyelectrolyte complexes: Their preparation, adsorption behaviour, and effect on
paper properties
Caroline Ankerfors
Licentiate thesis
Royal Institute of Technology (KTH) Department of Fibre and Polymer Technology
Division of Fibre Technology
Stockholm 2008

TRITA-CHE-Report 2008:45 ISSN 1654-1081 ISBN 978-91-7415-015-5 Polyelectrolyte complexes: Their preparation, adsorption behaviour and effect on paper properties
Caroline Ankerfors
AKADEMISK AVHANDLING Som med tillstånd av Kungliga Tekniska Högskolan i Stockholm framlägges till offentlig granskning för avläggande av teknologie licentiatexamen fredagen den 13:e juni 2008, kl. 10.00 i STFI-salen, STFI-Packforsk AB, Drottning Kristinas väg 61, Stockholm. Avhandlingen försvaras på svenska. © Caroline Ankerfors Stockholm 2008 Department of Fibre and Polymer Technology Teknikringen 56 SE-100 44 Stockholm Sweden

Abstract In this work, the formation of polyelectrolyte complexes (PECs) has been studied using a jet mixing method not previously used for mixing polyelectrolytes. The PECs were formed from two weak polyelectrolytes, i.e., polyacrylic acid (PAA) and polyallylamine hydrochloride (PAH), with different mixing times, and the results were compared with those for PECs formed using the conventional polyelectrolyte titration method. The adsorption behaviour of the formed PECs on silicon oxide substrates and pulp fibres was analysed, and the results were compared with those for polyelectrolyte multilayers (PEMs) prepared from the same two polyelectrolytes. The results indicated that by using the jet mixer, the size of the formed PECs could be controlled, which was not the case with the polyelectrolyte titration method. The PECs produced by jet mixing were also found to be smaller than those produced by polyelectrolyte titration. From these results, a two-step mechanism for the formation of PECs was suggested: initial pre-complex formation, which is a fast and diffusion-controlled process, followed by a reconformation process, during which the vigorous mixing in the jet mixer can partially limit secondary aggregation. When the complexes were adsorbed to silicon oxide or pulp fibre surfaces, adsorption studies indicated that it was impossible to reach the same adsorption levels for PECs as for PEMs. This was explained in terms of free energy, entropical, reasons rather than to any geometric limitation of the surface. Despite the smaller amount of polyelectrolyte adsorbed from the PEC treatment than from the PEM treatment of pulp fibres, the PEC treatment had the greatest effect on paper strength per adsorbed amount of polymer. This was thought to be because the three-dimensional structure of the PECs, versus the smoother structure of PEMs, allows for the formation of multiple contact points between the macroscopically rough fibres and increased molecular contact area.

In the adsorption experiments, it was also found that net cationic complexes can adsorb to both anionic and cationic substrates. This phenomenon was explained by the occurrence of anionic patches on the surface of the net cationic PECs and the ability of the PECs, formed from weak polyelectrolytes, to partially change charge upon exposure to a surface of the same charge as the complex itself, due to a change of the degree of dissociation of the polyelectrolytes constituting the complex.

Sammanfattning I detta arbete har bildandet av polyelektrolytkomplex (PEC) studerats med hjälp av jetmixningsmetoden, en metod som inte tidigare använts för att blanda polyelektrolyter. PEC tillverkades av två svaga polyelektrolyter (polyakrylsyra, PAA, och polyallylaminhydroklorid, PAH) vid olika mixningstider och de bildade komplexens egenskaper jämfördes med komplex bildade med hjälp av den konventionella polyelektrolyttitreringsmetoden. De bildade komplexens adsorption till kiseloxidytor och till massafibrer studerades och resultaten jämfördes med polyelektrolytmultilager (PEM) bildade från samma två polyelektrolyter. Resultaten visade att storleken på de bildade komplexen kunde styras genom att använda jetmixern, vilket inte var möjligt med polyelektrolyttitreringsmetoden samt att PEC från jetmixern var mindre än PEC från polyelektrolyttitreringen. Utifrån dessa resultat föreslogs en tvåstegsprocess för bildandet av PEC; ett första steg då pre-komplex bildas i en snabb och diffusionskontrollerad process följt av en omkonformationsprocess under vilken sekundär-aggregation delvis kan begränsas genom den kraftiga omblandningen i jetmixern. Adsorptionsstudier, där komplexen adsorberades till kiseloxidytor (m.h.a. SPAR och QCM-D) samt till massafibrer, visade att adsorptionen av PEC inte nådde samma nivå som den som kan uppnås med PEM. Detta förklarades med hjälp av entropiska termer snarare än geometriska. Trots den låga mängden polyelektrolyt efter PEC-behandling av massa uppvisade dessa ark högst arkstyrka per adsorberad mängd polyelektrolyt. En föreslagen förklaring till detta var att komplexens tredimensionella struktur, jämfört med polyelektrolytmultilagren, möjliggör många kontaktpunkter och en ökad molekylär kontaktarea mellan de ytråa fibrerna. Adsorptionsförsöken visade också att katjoniska komplex kan adsorbera till anjoniska såväl som till katjoniska ytor. Detta förklarades av förekomsten av anjoniska zoner på de nettokatjoniska komplexens yta samt möjligheten för dessa komplex, bildade av svaga polyelektrolyter, att delvis

ändra sin laddning när de kommer i närheten av en yta med samma laddning som komplexen själva genom att ändra dissociationsgrad på de polyelektrolyter som bygger upp komplexen.

List of papers This thesis is a summary of the following papers. Paper I A comparison of polyelectrolyte complexes and multilayers: their adsorption behaviour and use for enhancing tensile strength properties of paper Caroline Ankerfors, Rikard Lingström, Lars Wågberg, and Lars Ödberg Manuscript
Paper II Applying jet mixing to the preparation of polyelectrolyte complexes: complex properties and their interaction with silicon oxide surfaces Caroline Ankerfors, Sedat Ondaral, Lars Wågberg, and Lars Ödberg Manuscript


Contents INTRODUCTION........................................................................................................................... 1 BACKGROUND ...............................................................................................................................3
POLYELECTROLYTE COMPLEXATION................................................................................................................... 3 Water-soluble PECs ...................................................................................................................................... 5 Colloidally stable PECs ................................................................................................................................ 5 Coacervates ................................................................................................................................................... 7 Methods for preparation of PECs ................................................................................................................. 7
PECS FOR ENHANCING PAPER QUALITY .............................................................................................................. 8 Wet and dry strength ..................................................................................................................................... 8 Other effects in the paper making process................................................................................................... 10
EXPERIMENTAL ......................................................................................................................... 11 MATERIALS....................................................................................................................................................... 11
Polyelectrolytes ........................................................................................................................................... 11 Substrates .................................................................................................................................................... 11 Pulp ............................................................................................................................................................. 12
METHODS.......................................................................................................................................................... 12 Complex formation through jet mixing........................................................................................................ 12 Complex formation through polyelectrolyte titration .................................................................................. 13 Filtration ..................................................................................................................................................... 14 Dynamic light scattering and electrophoretic mobility measurements........................................................ 14 Stagnation point adsorption reflectometry (SPAR) ..................................................................................... 14 Quartz crystal microbalance with dissipation (QCM-D) monitoring.......................................................... 14 Dynamic contact angle (DCA) analysis ...................................................................................................... 15 Atomic force microscopy (AFM) ................................................................................................................. 15 Environmental scanning electron microscopy (ESEM)............................................................................... 15 Sheet preparation and paper testing............................................................................................................ 16 Nitrogen analysis......................................................................................................................................... 16
RESULTS AND DISCUSSION ..................................................................................................... 17 THE POLYELECTROLYTE COMPLEXATION PROCESS (PAPER II) .......................................................................... 17 PEC ADSORPTION BEHAVIOUR (PAPERS I AND II) ............................................................................................. 19 PEC ADSORPTION TO FIBRE SURFACES (PAPER I) .............................................................................................. 25
Single fibre treatment and analysis with DCA............................................................................................. 26 PECs as a paper strength agent .................................................................................................................. 27
CONCLUSIONS ............................................................................................................................ 31 ACKNOWLEDGEMENTS............................................................................................................33 REFERENCES...............................................................................................................................35


List of abbreviations AFM atomic force microscopy CIJ confined impinging jet CMC carboxymethylated cellulose CPAM cationic polyacrylamide CTMP chemothermomechanical pulp DCA dynamic contact angle (analyser) ESEM environmental scanning electron microscope/microscopy IEP isoelectric point PAA polyacrylic acid PAE polyamideamine epichlorohydrin PAH polyallylamine hydrochloride PDADMAC polydiallyldimethyl ammonium chloride PEC polyelectrolyte complex PEM polyelectrolyte multilayer QCM-D quartz crystal microbalance with dissipation monitoring SPAR stagnation point adsorption reflectometry TAR titrant addition rate TMP thermomechanical pulp

1
Introduction Polyelectrolytes are a group of macromolecules with many interesting and practically useful properties. Being both polymers and electrolytes, they have both the properties of a macromolecule and the charge possibilities of an electrolyte. It was found early on by Fuoss et al. (1949) that polycations and polyanions can interact and form precipitates (i.e., polyelectrolyte complexes – PECs). At this point, no further investigations were performed, until Michaels et al. (1965) made a similar discovery over ten years later, forming spherical complexes between 20 and 40 nm in size, using different conditions, for example, types of polyelectrolytes, salt concentrations, and charge ratios (Michaels and Miekka 1961; Michaels et al. 1965). Various combinations of polyelectrolytes, for example, cationic starches and carboxymethyl cellulose, are today used to enhance paper properties, such as wet or dry strength. Recently, it has been shown that it can be of both technical and economic interest to pre-form polyelectrolyte complexes before letting them interact with fibres. This procedure offers an industrially interesting method for both exploiting the advantages of the separate polyelectrolytes and creating a new, nanostructured unit (of further advantage in itself in enhancing paper properties). Much later, in the early 1990s, the technique of forming layered structures of polyelectrolytes was developed (Decher et al. 1992; Decher 1997). These polyelectrolyte multilayers (PEMs) have been thoroughly investigated in various model systems. One of the numerous applications of these systems is fibre modification to enhance paper qualities (Wågberg et al. 2002). Research into PEMs has resulted in increased interest even in PECs, some of which will be reviewed here. Today, PECs are produced for industrial applications such as coatings, binders, and flocculants for water purification. In the future, many applications in medicine and biotechnology, such as protein immobilizers, and carriers for gene therapy or drug delivery, could be feasible due to the fact that so many biomolecules are in fact polyelectrolytes. Numerous studies of the preparation and performance of polyelectrolyte complexes in the different applications mentioned so far have been conducted over the years (Dautzenberg 2001;

2
Kabanov 2003). However, complete understanding of the formation of PECs and the control of both the processes underlying their formation and the mechanisms and driving forces of the adsorption of PECs at the solid–liquid interface, which are all so important for the development of any present or future application, is still lacking. This thesis aims to develop a technique for controlling the formation of these complexes and to clarify the factors controlling the adsorption of them at the solid–liquid interface.

3
Background Polyelectrolyte complexation Polyanions and polycations can co-react in aqueous solution and form polysalts (Fuoss and Sadek 1949; Michaels and Miekka 1961) in a complexation process closely linked to self-assembly processes (Thünemann et al. 2004). The general conception is that the main driving force of complex formation is the gain in entropy caused by the release of low-molecular-weight counterions (Figure 1). Other interactions, such as hydrogen bonding and hydrophobic interactions, can also contribute to the complexation process (Thünemann et al. 2004).
Figure 1. Schematic diagrammes of the release of counterions upon polyelectrolyte complex formation.
One of the theories about PEC structure and conformation was presented by Michaels and Miekka (1961). These authors suggested that the PECs could be of either ladder-like (complex formation at the molecular level) or “scrambled egg” structure (high number of chains in a particle), depending on the components and the external conditions (Figure 2).
4
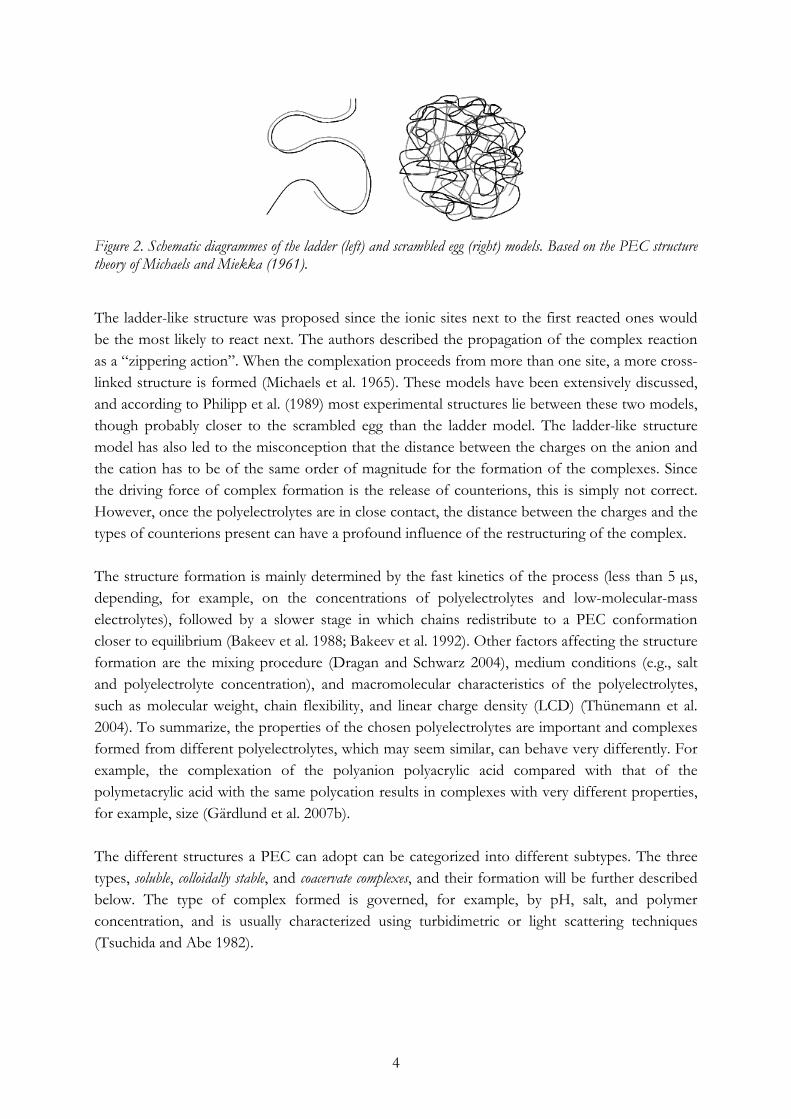
Figure 2. Schematic diagrammes of the ladder (left) and scrambled egg (right) models. Based on the PEC structure theory of Michaels and Miekka (1961).
The ladder-like structure was proposed since the ionic sites next to the first reacted ones would be the most likely to react next. The authors described the propagation of the complex reaction as a “zippering action”. When the complexation proceeds from more than one site, a more cross-linked structure is formed (Michaels et al. 1965). These models have been extensively discussed, and according to Philipp et al. (1989) most experimental structures lie between these two models, though probably closer to the scrambled egg than the ladder model. The ladder-like structure model has also led to the misconception that the distance between the charges on the anion and the cation has to be of the same order of magnitude for the formation of the complexes. Since the driving force of complex formation is the release of counterions, this is simply not correct. However, once the polyelectrolytes are in close contact, the distance between the charges and the types of counterions present can have a profound influence of the restructuring of the complex. The structure formation is mainly determined by the fast kinetics of the process (less than 5 µs, depending, for example, on the concentrations of polyelectrolytes and low-molecular-mass electrolytes), followed by a slower stage in which chains redistribute to a PEC conformation closer to equilibrium (Bakeev et al. 1988; Bakeev et al. 1992). Other factors affecting the structure formation are the mixing procedure (Dragan and Schwarz 2004), medium conditions (e.g., salt and polyelectrolyte concentration), and macromolecular characteristics of the polyelectrolytes, such as molecular weight, chain flexibility, and linear charge density (LCD) (Thünemann et al. 2004). To summarize, the properties of the chosen polyelectrolytes are important and complexes formed from different polyelectrolytes, which may seem similar, can behave very differently. For example, the complexation of the polyanion polyacrylic acid compared with that of the polymetacrylic acid with the same polycation results in complexes with very different properties, for example, size (Gärdlund et al. 2007b). The different structures a PEC can adopt can be categorized into different subtypes. The three types, soluble, colloidally stable, and coacervate complexes, and their formation will be further described below. The type of complex formed is governed, for example, by pH, salt, and polymer concentration, and is usually characterized using turbidimetric or light scattering techniques (Tsuchida and Abe 1982).
5
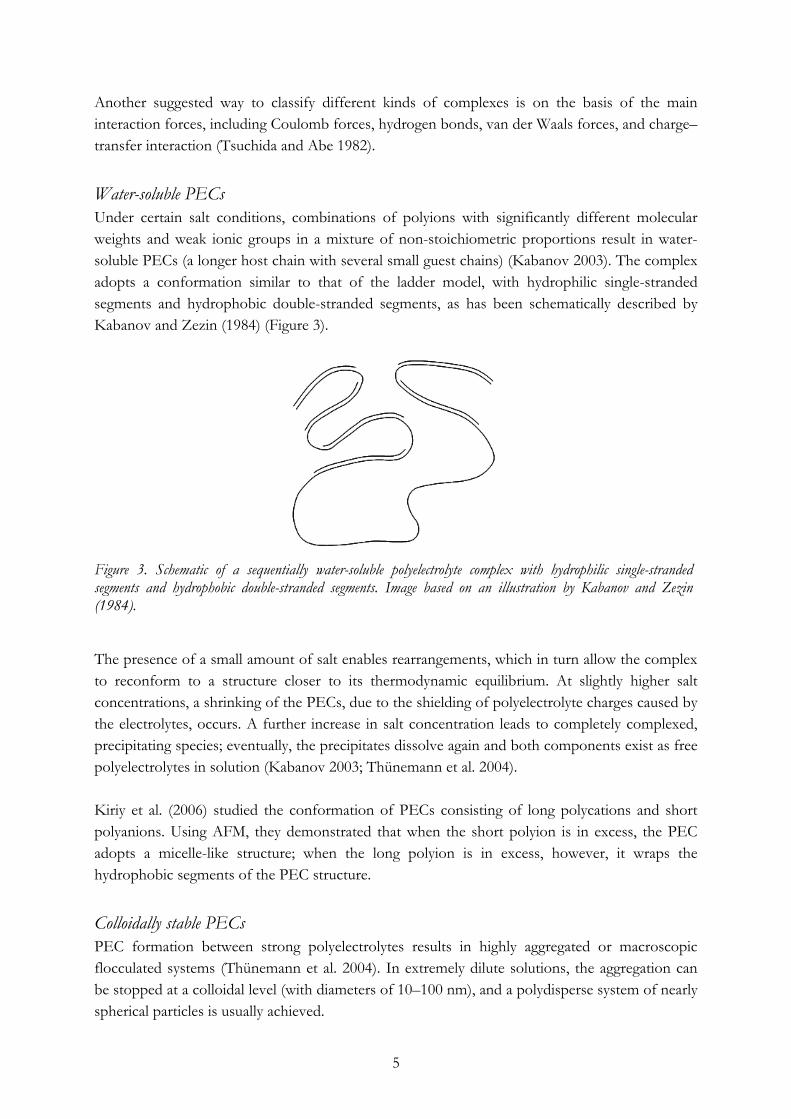
Another suggested way to classify different kinds of complexes is on the basis of the main interaction forces, including Coulomb forces, hydrogen bonds, van der Waals forces, and charge–transfer interaction (Tsuchida and Abe 1982). Water-soluble PECs Under certain salt conditions, combinations of polyions with significantly different molecular weights and weak ionic groups in a mixture of non-stoichiometric proportions result in water-soluble PECs (a longer host chain with several small guest chains) (Kabanov 2003). The complex adopts a conformation similar to that of the ladder model, with hydrophilic single-stranded segments and hydrophobic double-stranded segments, as has been schematically described by Kabanov and Zezin (1984) (Figure 3).
Figure 3. Schematic of a sequentially water-soluble polyelectrolyte complex with hydrophilic single-stranded segments and hydrophobic double-stranded segments. Image based on an illustration by Kabanov and Zezin (1984). The presence of a small amount of salt enables rearrangements, which in turn allow the complex to reconform to a structure closer to its thermodynamic equilibrium. At slightly higher salt concentrations, a shrinking of the PECs, due to the shielding of polyelectrolyte charges caused by the electrolytes, occurs. A further increase in salt concentration leads to completely complexed, precipitating species; eventually, the precipitates dissolve again and both components exist as free polyelectrolytes in solution (Kabanov 2003; Thünemann et al. 2004). Kiriy et al. (2006) studied the conformation of PECs consisting of long polycations and short polyanions. Using AFM, they demonstrated that when the short polyion is in excess, the PEC adopts a micelle-like structure; when the long polyion is in excess, however, it wraps the hydrophobic segments of the PEC structure. Colloidally stable PECs PEC formation between strong polyelectrolytes results in highly aggregated or macroscopic flocculated systems (Thünemann et al. 2004). In extremely dilute solutions, the aggregation can be stopped at a colloidal level (with diameters of 10–100 nm), and a polydisperse system of nearly spherical particles is usually achieved.
6
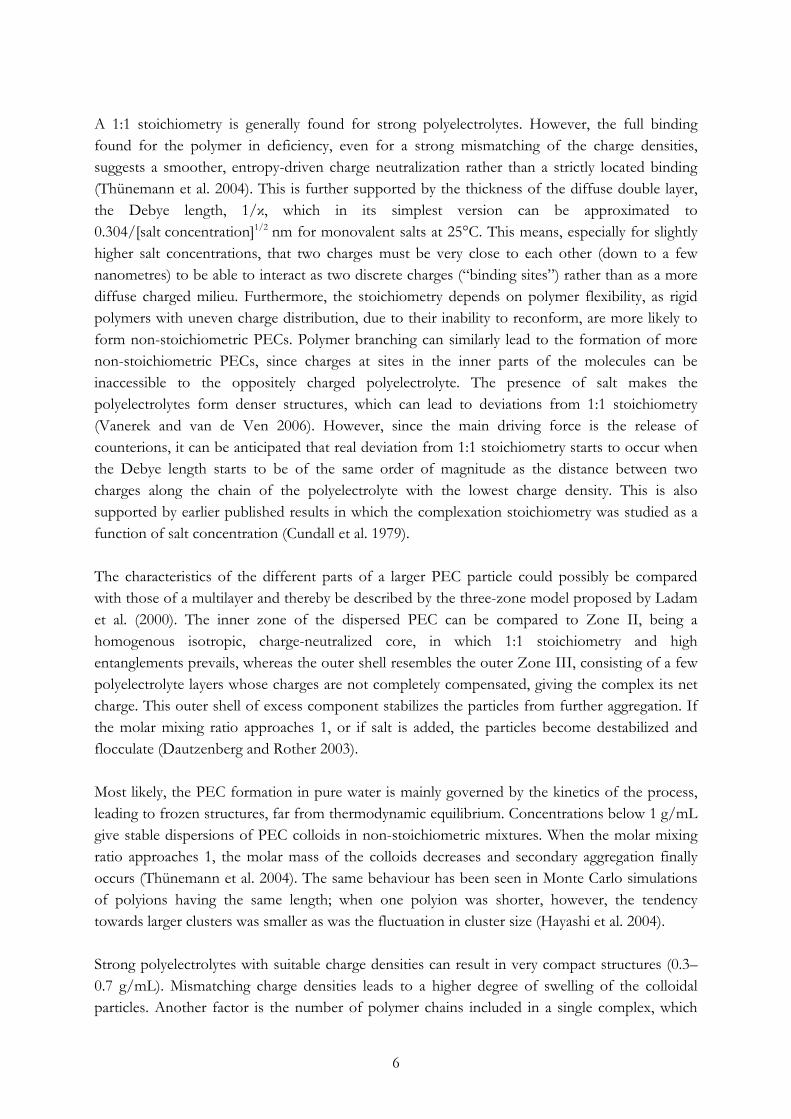
A 1:1 stoichiometry is generally found for strong polyelectrolytes. However, the full binding found for the polymer in deficiency, even for a strong mismatching of the charge densities, suggests a smoother, entropy-driven charge neutralization rather than a strictly located binding (Thünemann et al. 2004). This is further supported by the thickness of the diffuse double layer, the Debye length, 1/κ, which in its simplest version can be approximated to 0.304/[salt concentration]1/2 nm for monovalent salts at 25°C. This means, especially for slightly higher salt concentrations, that two charges must be very close to each other (down to a few nanometres) to be able to interact as two discrete charges (“binding sites”) rather than as a more diffuse charged milieu. Furthermore, the stoichiometry depends on polymer flexibility, as rigid polymers with uneven charge distribution, due to their inability to reconform, are more likely to form non-stoichiometric PECs. Polymer branching can similarly lead to the formation of more non-stoichiometric PECs, since charges at sites in the inner parts of the molecules can be inaccessible to the oppositely charged polyelectrolyte. The presence of salt makes the polyelectrolytes form denser structures, which can lead to deviations from 1:1 stoichiometry (Vanerek and van de Ven 2006). However, since the main driving force is the release of counterions, it can be anticipated that real deviation from 1:1 stoichiometry starts to occur when the Debye length starts to be of the same order of magnitude as the distance between two charges along the chain of the polyelectrolyte with the lowest charge density. This is also supported by earlier published results in which the complexation stoichiometry was studied as a function of salt concentration (Cundall et al. 1979). The characteristics of the different parts of a larger PEC particle could possibly be compared with those of a multilayer and thereby be described by the three-zone model proposed by Ladam et al. (2000). The inner zone of the dispersed PEC can be compared to Zone II, being a homogenous isotropic, charge-neutralized core, in which 1:1 stoichiometry and high entanglements prevails, whereas the outer shell resembles the outer Zone III, consisting of a few polyelectrolyte layers whose charges are not completely compensated, giving the complex its net charge. This outer shell of excess component stabilizes the particles from further aggregation. If the molar mixing ratio approaches 1, or if salt is added, the particles become destabilized and flocculate (Dautzenberg and Rother 2003). Most likely, the PEC formation in pure water is mainly governed by the kinetics of the process, leading to frozen structures, far from thermodynamic equilibrium. Concentrations below 1 g/mL give stable dispersions of PEC colloids in non-stoichiometric mixtures. When the molar mixing ratio approaches 1, the molar mass of the colloids decreases and secondary aggregation finally occurs (Thünemann et al. 2004). The same behaviour has been seen in Monte Carlo simulations of polyions having the same length; when one polyion was shorter, however, the tendency towards larger clusters was smaller as was the fluctuation in cluster size (Hayashi et al. 2004). Strong polyelectrolytes with suitable charge densities can result in very compact structures (0.3–0.7 g/mL). Mismatching charge densities leads to a higher degree of swelling of the colloidal particles. Another factor is the number of polymer chains included in a single complex, which

7
even in extremely dilute systems can be hundreds. This number increases strongly with rising concentrations of component solutions, up to several thousand chains per particle (Thünemann et al. 2004). The influence of salt on PEC structure The response of already formed PECs to the subsequent addition of salt has been investigated by Dautzenberg and Rother (2003), who found that after changes in ionic strength, swelling or deswelling of the PECs occurs immediately, whereas coagulation is a much slower process, dependant on the concentrations of the colloidal particles. Two major effects on the formation of PEC in the presence of salt were found in a study by Dautzenberg (1997). First, the presence of a very small amount of salt during formation gave a dramatic decrease in level of aggregation, probably due to the less stiff and more coiled structure the polymers can adopt. Second, a higher ionic strength resulted in macroscopic flocculation. This was explained by the screening of the protecting and stabilizing outer shell of excess component. According to the authors, the internal structure of most complex systems, however, is marginally affected by salt (Dautzenberg 1997). Other studies have shown that the valence (uni- or divalent) of the salt and even the specific ions involved (e.g., K+, Na+, or Li+) seem to be important for the interaction between the polyelectrolytes (Michaels et al. 1965; Sukhishvili et al. 2006). Coacervates A coacervate is formed when the mutual binding of opposite polyelectrolytes is of moderate strength as a result of low charge density. The coacervate is a liquid-like, mobile, and reversible structure (Biesheuvel and Cohen Stuart 2004a). The formation of such complexes, for example, from cationic polyacrylamide (CPAM) and sulphonated Kraft lignin, has been investigated (Vanerek and van de Ven 2006), and it was found that the molecular weight of the CPAM was a very important factor for coacervate formation, since a shorter chain can more easily adopt a coiled structure, which will precipitate. Potential applications mentioned in this study were flocculants and retention aids. According to the authors, soluble, colloidal, and coacervate complexes can be formed simultaneously. The electrostatic free energy change, which is important for the understanding of formation of coacervate complexes, has been modelled mathematically (Biesheuvel and Cohen Stuart 2004a; Biesheuvel and Cohen Stuart 2004b). From this model, it could be determined within which region (i.e., at what salt concentrations and molar mixing ratios) coacervate formation takes place. Parameters such as the distance between charges in the polyelectrolytes and the difference in pK between the polyacid and the polybase were studied. Methods for preparation of PECs What seems to be the predominant method for complex formation referred to in the literature is polyelectrolyte titration, which has been described by, for example, Dautzenberg (1997) and Gärdlund et al. (2003). In brief, one of the polyelectrolytes is, under stirring, slowly added (less

8
than 1 mL/min) to a beaker containing the oppositely charged polyelectrolyte (Gärdlund et al. 2007b). Obviously, this batch-wise procedure has a number of consequences. For example, the concentration of the polyelectrolyte in the beaker into which the other polyelectrolyte is titrated changes during titration. First, the solvent of the titrant dilutes the solution and, second, the polyelectrolyte in the beaker is consumed by the ongoing complexation process. To counteract this dilution, the first polyelectrolyte sometimes has a 2–10-times higher concentration than the second (Gärdlund et al. 2003). Furthermore, the titrant addition rate (TAR) has an influence on the properties of the formed complexes, as described, for example, by Dragan et al. (2006). In their studies of polydiallyldimethyl ammonium chloride (PDADMAC) together with different polyanions in salt-free solutions, the TAR was varied between 1–80 mol/mol starting polyion per hour. These rates correspond to reaching the isoelectric point (IEP; i.e., the point at which the numbers of cationic and anionic charges are the same) in times ranging from one hour down to 45 seconds. It was found that the higher the titrant addition rate, the higher the storage stability of the complexes. Using this complexation procedure, Gärdlund et al. (2007b) also demonstrated that the concentration of the polyelectrolytes affects the size of the complexes. A five-times-higher concentration increased the particle size somewhat and the molecular weight significantly, which was explained by the formation of larger and denser complexes.
PECs for enhancing paper quality Wet and dry strength One possible application of PECs is for improving the wet and dry strength of paper. Systematic studies of the interaction between PECs and pulp have been performed by a few research teams; some of this research will be briefly described here. A thorough investigation of the interaction between pre-formed PEC and pulp fibres and its influence on paper properties has been presented by Gärdlund (2006). Anionic complexes of different ratios between polyamideamine epichlorohydrin (PAE) and carboxymethylated cellulose (CMC) were added to a fully bleached fines-free sulphate pulp after PAE pre-treatment (Gärdlund et al. 2003). Complexes of different charge ratios were compared in terms of size and amount adsorbed to silica and to fibres, and the wet and dry strengths of the formed lab sheets were determined. The highest wet and dry strengths were found for complexes with a molar charge ratio of 0.9, and it was discussed whether the larger size or merely the lower charge of the complexes explained this. In a later study (Gärdlund et al. 2007a), the treatment of three different pulps (hardwood bleached Kraft pulp, softwood bleached Kraft pulp, and aspen bleached
9
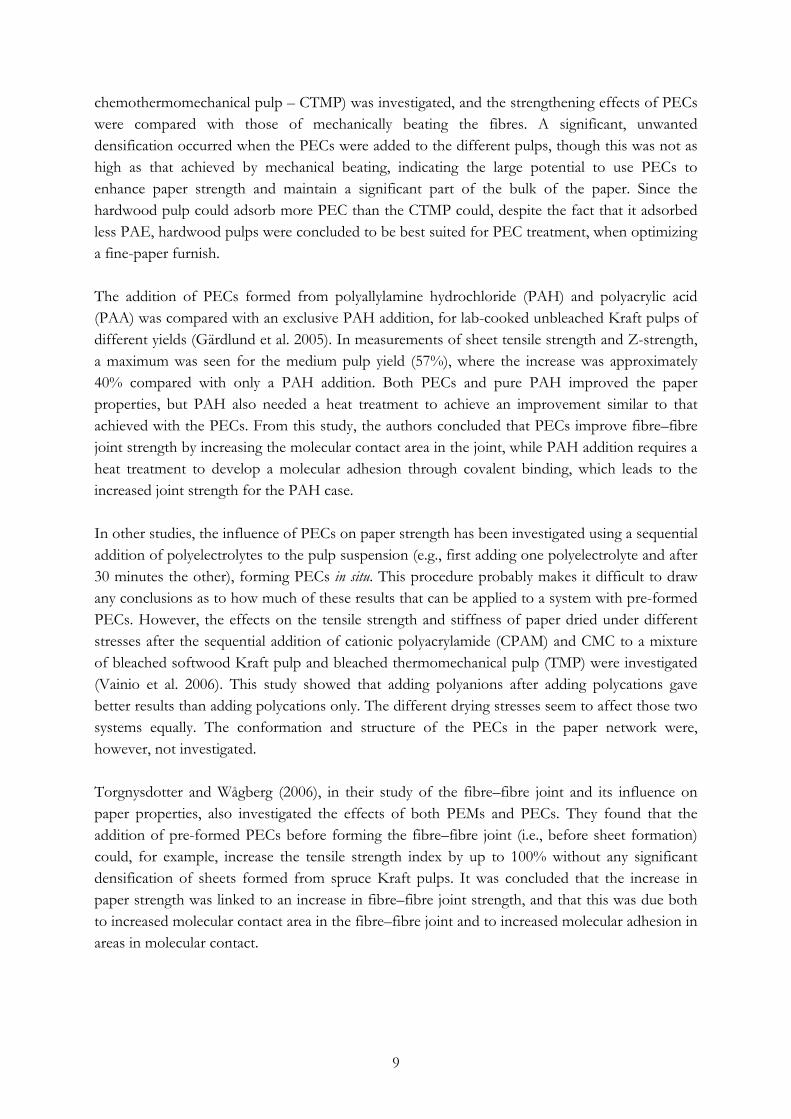
chemothermomechanical pulp – CTMP) was investigated, and the strengthening effects of PECs were compared with those of mechanically beating the fibres. A significant, unwanted densification occurred when the PECs were added to the different pulps, though this was not as high as that achieved by mechanical beating, indicating the large potential to use PECs to enhance paper strength and maintain a significant part of the bulk of the paper. Since the hardwood pulp could adsorb more PEC than the CTMP could, despite the fact that it adsorbed less PAE, hardwood pulps were concluded to be best suited for PEC treatment, when optimizing a fine-paper furnish. The addition of PECs formed from polyallylamine hydrochloride (PAH) and polyacrylic acid (PAA) was compared with an exclusive PAH addition, for lab-cooked unbleached Kraft pulps of different yields (Gärdlund et al. 2005). In measurements of sheet tensile strength and Z-strength, a maximum was seen for the medium pulp yield (57%), where the increase was approximately 40% compared with only a PAH addition. Both PECs and pure PAH improved the paper properties, but PAH also needed a heat treatment to achieve an improvement similar to that achieved with the PECs. From this study, the authors concluded that PECs improve fibre–fibre joint strength by increasing the molecular contact area in the joint, while PAH addition requires a heat treatment to develop a molecular adhesion through covalent binding, which leads to the increased joint strength for the PAH case. In other studies, the influence of PECs on paper strength has been investigated using a sequential addition of polyelectrolytes to the pulp suspension (e.g., first adding one polyelectrolyte and after 30 minutes the other), forming PECs in situ. This procedure probably makes it difficult to draw any conclusions as to how much of these results that can be applied to a system with pre-formed PECs. However, the effects on the tensile strength and stiffness of paper dried under different stresses after the sequential addition of cationic polyacrylamide (CPAM) and CMC to a mixture of bleached softwood Kraft pulp and bleached thermomechanical pulp (TMP) were investigated (Vainio et al. 2006). This study showed that adding polyanions after adding polycations gave better results than adding polycations only. The different drying stresses seem to affect those two systems equally. The conformation and structure of the PECs in the paper network were, however, not investigated. Torgnysdotter and Wågberg (2006), in their study of the fibre–fibre joint and its influence on paper properties, also investigated the effects of both PEMs and PECs. They found that the addition of pre-formed PECs before forming the fibre–fibre joint (i.e., before sheet formation) could, for example, increase the tensile strength index by up to 100% without any significant densification of sheets formed from spruce Kraft pulps. It was concluded that the increase in paper strength was linked to an increase in fibre–fibre joint strength, and that this was due both to increased molecular contact area in the fibre–fibre joint and to increased molecular adhesion in areas in molecular contact.

10
Other effects in the paper making process The complexation of polyelectrolytes can also be advantageous for the flocculation and retention of colloidal material in the paper making process. Britt (1973) and Moore (1976), for example, early found that adding two oppositely charged polymers after each other to the pulp suspension leads to higher retention than does the addition of only one polymer. This has been further investigated by Nyström and Rosenholm (2005), for example, in a study in which the flocculating ability of pre-formed complexes of polyacrylic acid and cationic starch on calcium carbonate dispersions was compared with that of adding the polymers sequentially. The results indicate that a pre-mixing of the components gave a better flocculation, but it is unclear what kind of complexes the pre-mixing procedure of this study resulted in. In other flocculation studies, Petzold et al. (1998) and Buchhammer et al. (1999) used pre-formed PECs of different combinations of polydiallyldimethyl ammonium chloride (PDADMAC) and polymaleic acid and its copolymer with α-methyl styrene, and investigated the flocculating ability on silica particles and clay. PECs were found to be able to flocculate colloidal material very rapidly and efficiently over a broad range of addition concentrations. PECs can also be formed from an added polyelectrolyte and polyions or other ionic material already present in the pulp, for example, lignin or colloidal fibre material (Nyström et al. 2004; Vanerek and van de Ven 2006). Generally, the complexation of the polyelectrolytes leads to a decrease of free polyelectrolyte in solution, which in turn leads to a lower viscosity of the water phase. This would be advantageous for dewatering in both the wire and the press sections of the paper machine, especially if the addition is combined with less pulp beating, as previously mentioned. To the best knowledge of the authors, systematic investigation of this use of PEC in practice is still missing in the literature.

11
Experimental Materials Polyelectrolytes Polyallylamine hydrochloride (PAH, cationic) with molecular weights of 15,000 and 70,000 Da and polyacrylic acid (PAA, anionic) with molecular weights of 5,000 and 240,000 Da, according to the supplier, were purchased from Sigma-Aldrich and used without further purification.
n
NH3+
**
m
O O-
**
Figure 4. Chemical structures of polyallylamine hydrochloride, PAH (left), and polyacrylic acid, PAA (right).
Substrates Silicon wafers of the p-type used as substrate for SPAR measurements and AFM imaging were purchased from MEMC Electronic Materials SpA, Italy. The substrates were rinsed with ethanol, oxidized in an oven at 1,000°C for three hours, and then rinsed with ultra-pure water (MilliQ), ethanol, and ultra-pure water in sequence, hydroxylated in 10 wt% NaOH for 30 s, thoroughly washed with ultra-pure water, blown dry with nitrogen gas, and finally treated in a plasma cleaner for 30 s. The oxide layer thickness was measured using an ellipsometer (model 43702-200E, Rudolph Research, USA) and was found to be 82 ± 2 nm for oxidized silicon surfaces. Silica-coated piezo-electric quartz crystals used for QCM-D measurements were purchased from Q-Sense AB, Sweden. The AT-cut crystals were thoroughly rinsed with ultra-pure water (MilliQ), ethanol, and ultra-pure water in sequence, blown dry with nitrogen gas, and finally treated in a plasma cleaner for 30 s before use.
Cl -
H+

12
All experiments were performed at pH 7 using ultra-pure water (MilliQ) containing 10 mM NaCl as solvent, unless otherwise stated. When necessary, pH was adjusted using NaOH or HCl. Pulp Totally chlorine-free (TCF) chemical Kraft softwood fibres, bleached according to the (OO)Q(OP)(ZQ)(PO) sequence, from SCA Forest Products, Östrand Pulp Mill, Sweden, were used for sheet preparation and adsorption experiments on single fibres. The pulp was delivered in dry form and disintegrated according to ISO 5263:1995. The pulp was diluted in deionized water to a concentration of approximately 2% before the pH was adjusted to 2 using HCl; it was kept at this level for 30 minutes to remove any unwanted metal ions. To increase the pH to 4.5–5.0, the pulp was washed several times with deionized water. As a second step, the fibres were washed for 15 minutes with 10–2 M NaHCO3 and the pH was adjusted to 9 using NaOH to convert the carboxyl groups on the fibres into their sodium form and to remove unwanted dissolved material, such as loosely associated hemicelluloses, from the pulp. The pulp was then again washed with deionized water several times until the conductivity was 5 μS. The pulp was stored in a refrigerator until use.
Methods Complex formation through jet mixing A new method for the formation of polyelectrolyte complexes is micromixing, which can be done in a confined impinging jet (CIJ) mixer (Johnson and Prud'homme 2003). In a CIJ mixer, depicted in Figure 5, two jets collide in a small chamber, giving mixing times as brief as a few milliseconds.
Figure 5. Schematic of the mixing chamber in a CIJ mixer showing the inlets and outlet; based on an illustration by Johnson and Prud’homme (2003).
13
What were discovered to be important characteristics of the mixing process are the chamber multiple (i.e., chamber diameter to jet diameter ratio, I/d) and the jet velocity or turbulence at the inlets (i.e., jet Reynolds number, Re = (u ⋅ d)/ν, where ν is the kinematic viscosity of the used liquid, ν = η/ρ). The effect of the outlet geometry on mixing is minimal when the chamber multiple is over 10. The mixing properties of the CIJ mixer have been thoroughly investigated and described by Johnson and Prud’homme (2003). By assuming that the density and mass flow of the two fluids are the same and that the viscosity of the fluid is constant after the mixing, the equation of Johnson and Prud’homme (2003) for calculating the mixing time, τmix, can be simplified to:
duIKmix 2/3
2/3
≈τ [1]
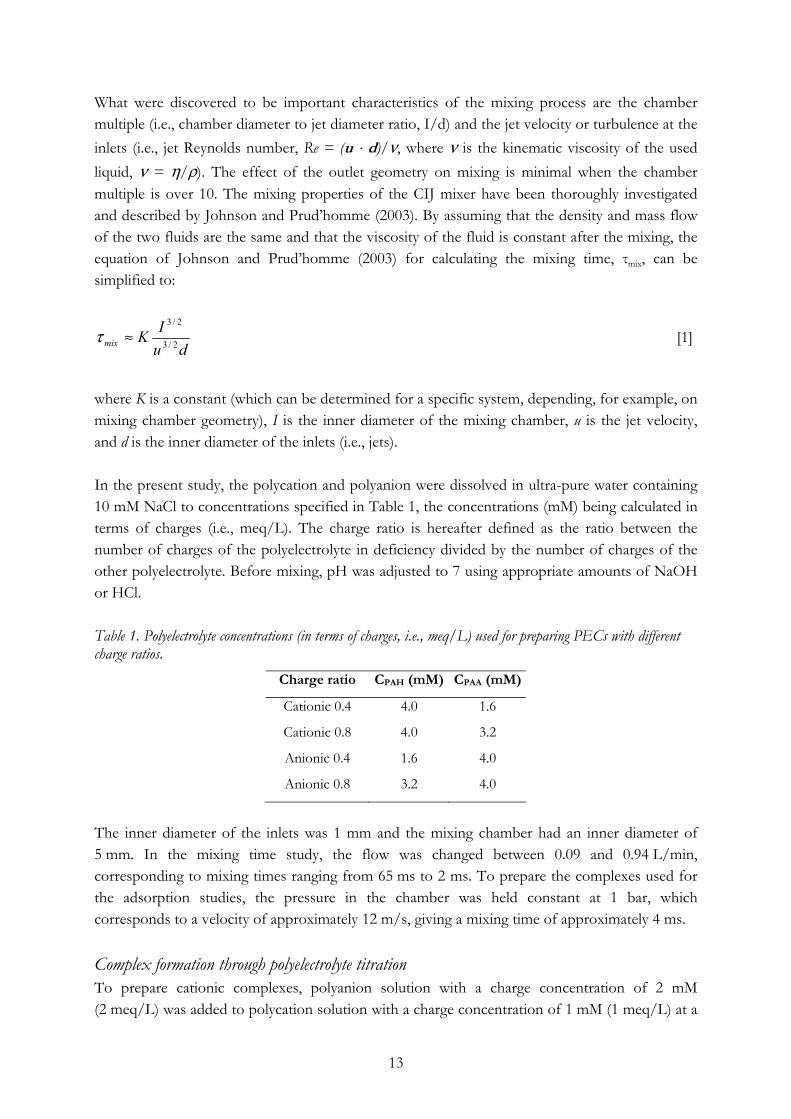
where K is a constant (which can be determined for a specific system, depending, for example, on mixing chamber geometry), I is the inner diameter of the mixing chamber, u is the jet velocity, and d is the inner diameter of the inlets (i.e., jets). In the present study, the polycation and polyanion were dissolved in ultra-pure water containing 10 mM NaCl to concentrations specified in Table 1, the concentrations (mM) being calculated in terms of charges (i.e., meq/L). The charge ratio is hereafter defined as the ratio between the number of charges of the polyelectrolyte in deficiency divided by the number of charges of the other polyelectrolyte. Before mixing, pH was adjusted to 7 using appropriate amounts of NaOH or HCl. Table 1. Polyelectrolyte concentrations (in terms of charges, i.e., meq/L) used for preparing PECs with different charge ratios.
Charge ratio CPAH (mM) CPAA (mM)
Cationic 0.4 4.0 1.6
Cationic 0.8 4.0 3.2
Anionic 0.4 1.6 4.0
Anionic 0.8 3.2 4.0
The inner diameter of the inlets was 1 mm and the mixing chamber had an inner diameter of 5 mm. In the mixing time study, the flow was changed between 0.09 and 0.94 L/min, corresponding to mixing times ranging from 65 ms to 2 ms. To prepare the complexes used for the adsorption studies, the pressure in the chamber was held constant at 1 bar, which corresponds to a velocity of approximately 12 m/s, giving a mixing time of approximately 4 ms. Complex formation through polyelectrolyte titration To prepare cationic complexes, polyanion solution with a charge concentration of 2 mM (2 meq/L) was added to polycation solution with a charge concentration of 1 mM (1 meq/L) at a

14
titration volumetric flow of 0.5 mL/min using a syringe pump (NE-1000, ProSense BV, The Netherlands); addition was done under continuous stirring using a magnetic stirrer until the desired charge ratio was achieved. To prepare anionic complexes, the same procedure was used, but titrating the polycation solution (with a charge concentration of 2 mM) into the polyanion solution (with a charge concentration of 1 mM). Filtration To separate any unreacted polymers from the formed complexes, a Pellicon XL Ultrafiltration Module Biomax with a 10 kDa cutoff (PXB010A50, Millipore Corp., USA) was used for some of the samples. This filter specification was chosen as a compromise, in order to remove as much as possible of the unreacted polyelectrolyte, while keeping as much as possible of the formed complexes. Dynamic light scattering and electrophoretic mobility measurements The size and charge of the formed complexes were determined using a Zetasizer Nano ZS particle characterization system (Malvern Instruments Ltd, UK) with a 633 nm red laser collecting the scattered light at an angle of 173°. The particle diameter was measured as the z-average size. Stagnation point adsorption reflectometry (SPAR) Adsorption experiments were performed using a stagnation point adsorption reflectometer (SPAR) from the Laboratory of Physical Chemistry and Colloidal Science, Wageningen University, The Netherlands. With this instrument, a linearly polarized laser beam is reflected at the stagnation point of the flow and Ip/Is (S) (i.e., the ratio of the parallel to the perpendicular intensity of the reflected light) is measured. Upon adsorption to the substrate, this ratio changes due to the change in the refractive index of the surface; the result is presented as ∆S/S0, where ∆S is the change of S upon polymer adsorption and S0 is the initial value of S. ∆S/S0 is proportional to the adsorbed amount according to Dijt et al. (1994), as follows:
0SSQ Δ=Γ [2]
where Q is a constant dependent on the refractive indices of the Si, SiO2, and solvent, the thickness of the oxide layer, and the refractive index increment (dn/dc) value of the adsorbed polyelectrolytes. The adsorbed amounts in this study were calculated using a four-layer optical model and the data were processed using the “Prof. Huygens” software (Dullware, The Netherlands). Quartz crystal microbalance with dissipation (QCM-D) monitoring In the quartz crystal microbalance with dissipation monitoring, using the QCM D300 microbalance material analyser (Q-Sense AB, Sweden), the frequency of the resonating crystal decreases when a polyelectrolyte is adsorbed to it. Assuming a flat and uniform conformation of
15
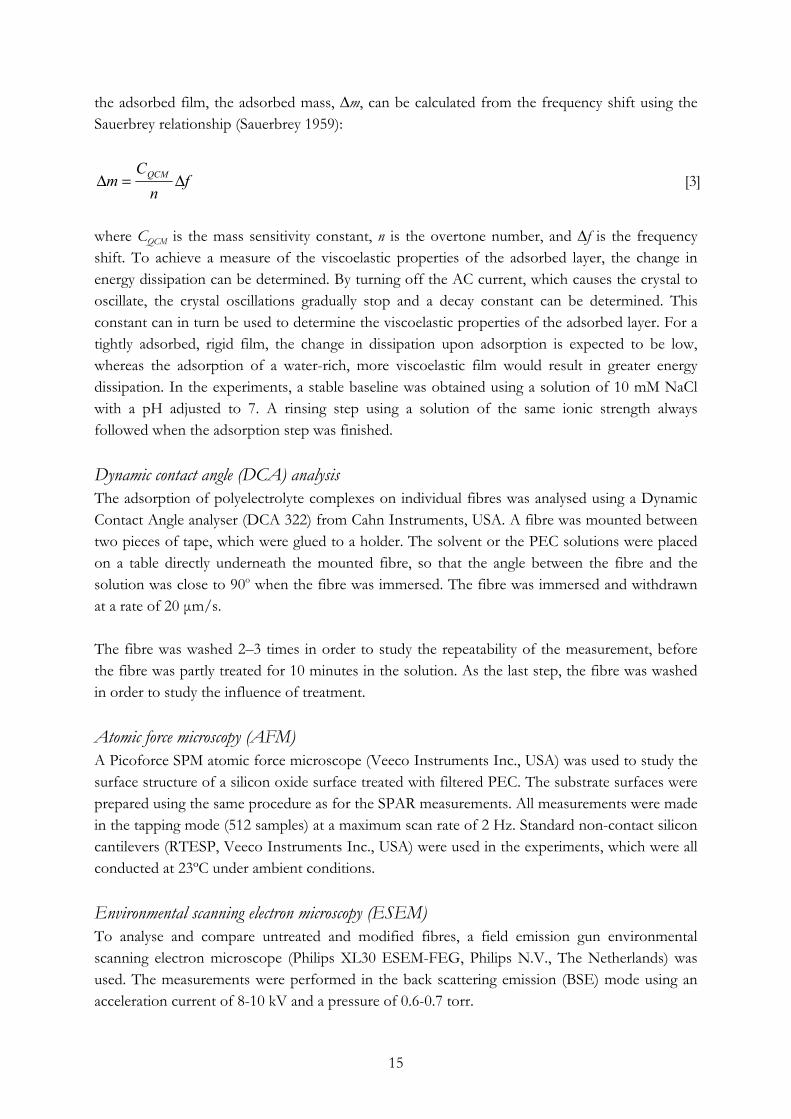
the adsorbed film, the adsorbed mass, ∆m, can be calculated from the frequency shift using the Sauerbrey relationship (Sauerbrey 1959):
fn
Cm QCM Δ=Δ [3]
where CQCM is the mass sensitivity constant, n is the overtone number, and ∆f is the frequency shift. To achieve a measure of the viscoelastic properties of the adsorbed layer, the change in energy dissipation can be determined. By turning off the AC current, which causes the crystal to oscillate, the crystal oscillations gradually stop and a decay constant can be determined. This constant can in turn be used to determine the viscoelastic properties of the adsorbed layer. For a tightly adsorbed, rigid film, the change in dissipation upon adsorption is expected to be low, whereas the adsorption of a water-rich, more viscoelastic film would result in greater energy dissipation. In the experiments, a stable baseline was obtained using a solution of 10 mM NaCl with a pH adjusted to 7. A rinsing step using a solution of the same ionic strength always followed when the adsorption step was finished. Dynamic contact angle (DCA) analysis The adsorption of polyelectrolyte complexes on individual fibres was analysed using a Dynamic Contact Angle analyser (DCA 322) from Cahn Instruments, USA. A fibre was mounted between two pieces of tape, which were glued to a holder. The solvent or the PEC solutions were placed on a table directly underneath the mounted fibre, so that the angle between the fibre and the solution was close to 90o when the fibre was immersed. The fibre was immersed and withdrawn at a rate of 20 μm/s. The fibre was washed 2–3 times in order to study the repeatability of the measurement, before the fibre was partly treated for 10 minutes in the solution. As the last step, the fibre was washed in order to study the influence of treatment. Atomic force microscopy (AFM) A Picoforce SPM atomic force microscope (Veeco Instruments Inc., USA) was used to study the surface structure of a silicon oxide surface treated with filtered PEC. The substrate surfaces were prepared using the same procedure as for the SPAR measurements. All measurements were made in the tapping mode (512 samples) at a maximum scan rate of 2 Hz. Standard non-contact silicon cantilevers (RTESP, Veeco Instruments Inc., USA) were used in the experiments, which were all conducted at 23ºC under ambient conditions. Environmental scanning electron microscopy (ESEM) To analyse and compare untreated and modified fibres, a field emission gun environmental scanning electron microscope (Philips XL30 ESEM-FEG, Philips N.V., The Netherlands) was used. The measurements were performed in the back scattering emission (BSE) mode using an acceleration current of 8-10 kV and a pressure of 0.6-0.7 torr.

16
Sheet preparation and paper testing Laboratory sheets were made of fibres treated with polyelectrolyte complexes, in order to study the change in paper properties due to the adsorbed complexes. The complexes were added to a fibre suspension of 5 g/L in deionized water. To study the influence of the concentration of the added complex, the addition was made at three different levels: 15 mg complex/g fibre, 30 mg/g, and 45 mg/g. The contact time between the fibres and the complexes was kept constant at 10 minutes. Sheets were prepared according to ISO 5269-2:1998 using Rapid-Köthen sheet preparation equipment from Paper Testing Instruments, Austria. The sheets were formed from a dispersion (5 g/L) of fibres that were vigorously stirred by air agitation just before sheet preparation; the sheets were then pressed at 100 kPa and dried at 93ºC. Paper testing was performed at 23ºC and 50% RH (ISO 187:1990). The mass per area was determined according to ISO 536:1995, and thickness and density according to ISO 534:1988. Dry tensile testing was conducted according to ISO 1924-3. Before testing, the sheets were heated to 180 degrees for 30 minutes to create amide linkages between PAH and PAA (Eriksson et al. 2006). Nitrogen analysis An ANTEK 7000 nitrogen analyser (Antek Instruments Inc., USA) was used to determine the amount of PAH adsorbed in the sheets made of complex-treated fibres. In this method, the sample is combusted at 1050oC in an atmosphere deficient in oxygen, in which the nitrogen of the polymer is oxidized to NO. In a second step, the NO is mixed with ozone and excited NO2 is formed. When the excited state of the molecule decays, light is emitted and detected by a photomultiplier tube. The amount of adsorbed PAH can easily be calculated following a simple calibration procedure.
17
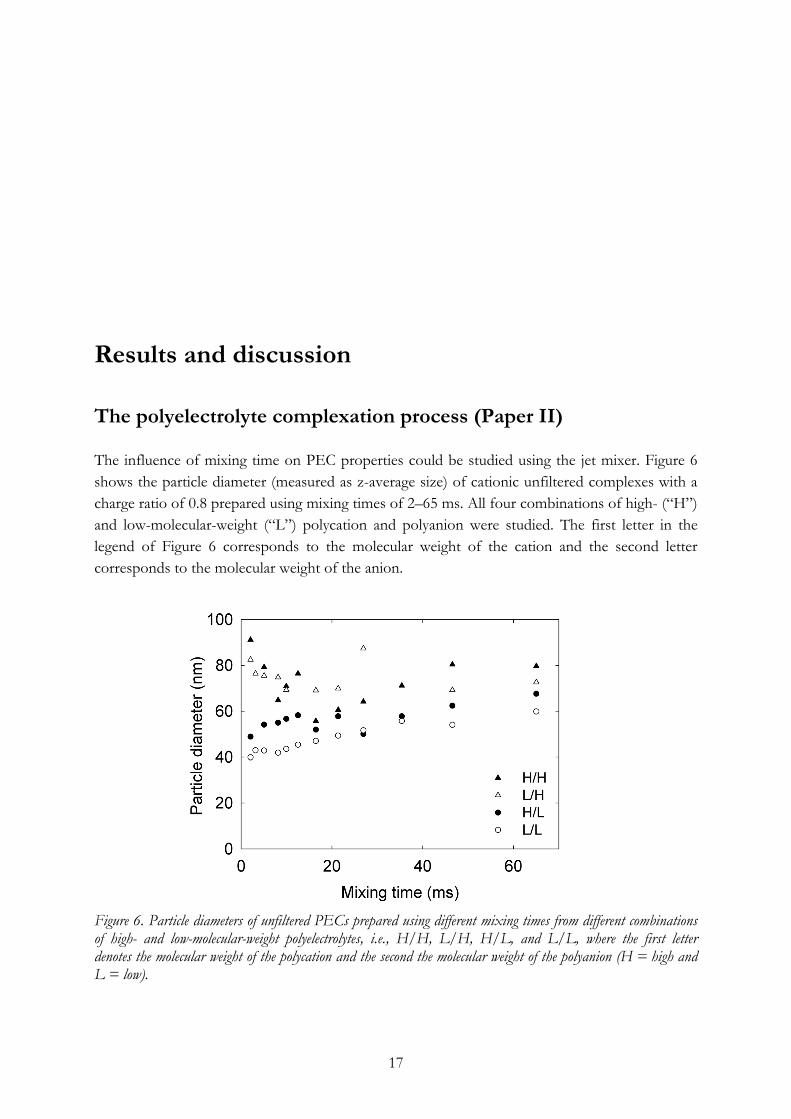
Results and discussion The polyelectrolyte complexation process (Paper II) The influence of mixing time on PEC properties could be studied using the jet mixer. Figure 6 shows the particle diameter (measured as z-average size) of cationic unfiltered complexes with a charge ratio of 0.8 prepared using mixing times of 2–65 ms. All four combinations of high- (“H”) and low-molecular-weight (“L”) polycation and polyanion were studied. The first letter in the legend of Figure 6 corresponds to the molecular weight of the cation and the second letter corresponds to the molecular weight of the anion.
Figure 6. Particle diameters of unfiltered PECs prepared using different mixing times from different combinations of high- and low-molecular-weight polyelectrolytes, i.e., H/H, L/H, H/L, and L/L, where the first letter denotes the molecular weight of the polycation and the second the molecular weight of the polyanion (H = high and L = low).

18
In Figure 6, it can be seen that the complexes prepared from low-molecular-weight polyelectrolytes are the smallest, and that when one or both polyelectrolytes are of higher molecular weight, the particle diameter of the formed PECs increases slightly. Going from a high to a low mixing time, the particle diameter generally slightly decreases. At the very lowest mixing times (<20 ms), however, another trend can be seen. The PECs prepared from a high-molecular-weight polyanion become larger, whereas the sizes of the other complexes continue to decrease. From these data, a two-step complexation mechanism is proposed. First, small pre-complexes are formed, in a fast and diffusion-controlled process, followed by a second step in which the final PEC structures are formed during the vigorous mixing of the jet mixer. For the smallest polyelectrolytes, the formation of pre-complexes is probably fast enough to result in stable pre-complexes, whereas the mixing of high-molecular-weight polyelectrolytes results in non-equilibrium pre-complexes more prone to form larger aggregates in the second step of the complexation process. To compare the two different PEC preparation methods, jet mixing and polyelectrolyte titration, PECs of different charge ratios, both net cationic and net anionic, were prepared. The results of the PEC particle diameter and Zeta potential measurements are presented in Figures 7a and 7b.
Figures 7a and 7b. Particle diameters (left) and absolute Zeta potential values (right) of unfiltered PECs with different charge ratios prepared with two different methods, jet mixing (circles) and polyelectrolyte titration (triangles), using combinations of low-molecular-weight polyelectrolytes (L/L, open symbols) and high-molecular-weight polyelectrolytes (H/H, filled symbols). To prepare PECs using the jet mixer, a mixing time of 2 ms was used. In the Zeta potential graph (right), the potentials of the anionic complexes (an 0.4 and an 0.8) are indicated by reversed sign. The results indicate that jet mixing method generally produces complexes with a smaller particle diameter than does polyelectrolyte titration. It can be also seen that complexes with a charge ratio closer to 1, produced by either method, are generally larger. The molecular weight of the polyelectrolytes influenced the particle size when jet mixing was used to prepare the PECs, but not when titration was used. The reason for this is not entirely understood, but probably relates to the high-speed mixing, which affects the polymer conformation in the complexes, as previously discussed.
A B

19
The zeta potential measurements (Figure 7b) indicate that PECs formed from low-molecular-weight polyelectrolytes, using either PEC preparation method, generally have a slightly lower charge. This could be because smaller polyelectrolytes are more mobile and have a chance to reconform, hence forming more neutral complexes, closer to thermodynamic equilibrium.
PEC adsorption behaviour (Papers I and II) In the following adsorption experiments, cationic PECs from two batches were used. Both batches had a charge ratio (anion/cation) of 0.8 and were prepared from low-molecular-weight polyelectrolytes under the same conditions. Table 2 shows the particle diameters (measured as z-average size) and zeta potential values of PECs from two batches, A and B, before and after filtration.
Table 2. Sizes and charges of two different PEC batches, A and B, before and after filtration.
Particle diameter
(nm)
Zeta potential
(mV) A: unfiltered 43 32 A: filtered 123 42 B: unfiltered 80 39 B: filtered 96 32
As seen from Table 2, while there can be some differences in size and potential between different batches, the average size and the electrophoretic mobility of the filtered complexes were similar and hence sufficiently equal for the batches to be used for comparative adsorption studies and sheet preparation. To investigate the adsorption behaviour of PECs on model surfaces, SPAR and QCM-D measurements were made. The idea of using both methods is that although they both measure the amount of PEC adsorbed to a silicon oxide substrate, the methods give different information. The results obtained using SPAR equipment indicate only the adsorbed amount of the complexes, whereas the QCM-D results indicate the adsorbed amount of complexes plus the amount of immobilized water. Combining these methods provides information about both the adsorbed amount and the structure of the adsorbed layer. In this study, adsorption experiments using QCM and SPAR were performed using filtered PECs that, after preparation (at pH 7) and filtration, were adjusted to pH 5.0, 7.0, and 8.5. The plateau values obtained from each QCM or SPAR measurement were converted to adsorbed amounts and are shown in Figure 8.
20
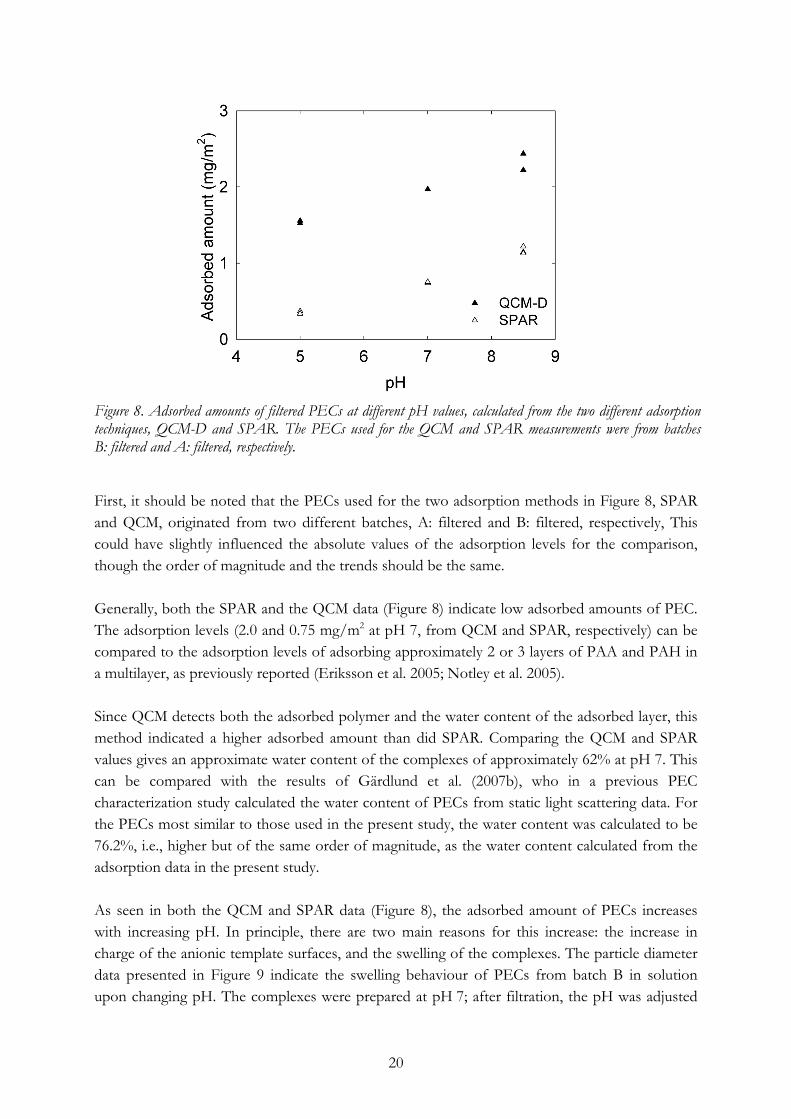
Figure 8. Adsorbed amounts of filtered PECs at different pH values, calculated from the two different adsorption techniques, QCM-D and SPAR. The PECs used for the QCM and SPAR measurements were from batches B: filtered and A: filtered, respectively. First, it should be noted that the PECs used for the two adsorption methods in Figure 8, SPAR and QCM, originated from two different batches, A: filtered and B: filtered, respectively, This could have slightly influenced the absolute values of the adsorption levels for the comparison, though the order of magnitude and the trends should be the same. Generally, both the SPAR and the QCM data (Figure 8) indicate low adsorbed amounts of PEC. The adsorption levels (2.0 and 0.75 mg/m2 at pH 7, from QCM and SPAR, respectively) can be compared to the adsorption levels of adsorbing approximately 2 or 3 layers of PAA and PAH in a multilayer, as previously reported (Eriksson et al. 2005; Notley et al. 2005). Since QCM detects both the adsorbed polymer and the water content of the adsorbed layer, this method indicated a higher adsorbed amount than did SPAR. Comparing the QCM and SPAR values gives an approximate water content of the complexes of approximately 62% at pH 7. This can be compared with the results of Gärdlund et al. (2007b), who in a previous PEC characterization study calculated the water content of PECs from static light scattering data. For the PECs most similar to those used in the present study, the water content was calculated to be 76.2%, i.e., higher but of the same order of magnitude, as the water content calculated from the adsorption data in the present study. As seen in both the QCM and SPAR data (Figure 8), the adsorbed amount of PECs increases with increasing pH. In principle, there are two main reasons for this increase: the increase in charge of the anionic template surfaces, and the swelling of the complexes. The particle diameter data presented in Figure 9 indicate the swelling behaviour of PECs from batch B in solution upon changing pH. The complexes were prepared at pH 7; after filtration, the pH was adjusted

21
to 5.0, 7.0, and 8.5. No significant difference in particle diameter could be seen after changing the pH from 7.0 to 5.0, but swelling clearly occurred when pH was increased from 7.0 to 8.5.
Figure 9. Particle diameter of filtered PECs prepared at pH 7 and adjusted to different pH values after filtration, measured in solution using dynamic light scattering. However, since the SPAR method (Figure 8) uses the refractive index to detect adsorbed polymer, this method should not detect any increase of adsorbed amount due to the swelling. Thus, the increase in signal from SPAR should mainly be due to the actual increase in adsorbed amount resulting from the increased charge of the template surface, and should indicate a higher total mass of adsorbed complexes. With the QCM technique, which detects adsorbed polyelectrolytes as well as bound water, the swelling should affect the measured adsorbed amount. It should therefore have been expected that one would detect an even greater increase in adsorbed amount from the QCM measurements than from the SPAR data than can actually be seen in Figure 8. Unlike the swelling behaviour evident in Figure 9, the QCM to SPAR ratio (Figure 8) decreases from more than 4 to 2 with increasing pH, which could be interpreted as the water content of the adsorbed complexes, or at least of the adsorbed PEC film, is decreasing from 77% to 50%. Part of the explanation of this discrepancy is that the swelling behaviour of PECs in solution might differ from the conformation of the adsorbed film when PECs are adsorbed to a surface, i.e., a more highly swollen complex with a higher charge interaction with the surface would be more prone to reconform than a more dense complex with a lower charge interaction. Another effect of the change in pH is that the number of charges of the cationic complexes should increase with decreasing pH, leading to higher complex charges at pH 5 and lower charges at pH 8.5. This is another explanation of the lower adsorption at low pH values, since the small, relatively highly charged complexes saturate the template surface more easily than do the larger, less charged ones.

22
Further information about the properties of the adsorbed film can be attained from the QCM-D measurements, by analyzing the dissipation data (Figure 10). The swelling of the complexes can also be seen as a significantly greater increase in change in dissipation at pH 8.5 compared with the change in dissipation at lower pH values as detected using QCM-D. However, all the changes in the dissipation signal found here are lower than would be expected in other systems, such as adsorption polyelectrolyte multilayers (Notley et al. 2005). The low change in dissipation is an indication of a rigid film, tightly adsorbed to the surface of the substrate.
Figure 10. Change in dissipation upon adsorption of filtered PECs (B: filtered) at different pH values.
AFM imaging was used to investigate the appearance of cationic PECs adsorbed to the silicon oxide substrates (Figure 11a). The cationic PECs were also adsorbed to a silicon oxide surface pre-treated with PAH to reverse the surface charge of the substrate, making it cationic (Figure 11b).

23
Figures 11a and 11b. AFM images of filtered PECs adsorbed to a silicon oxide surface (left) and to a silicon oxide surface pre-treated (cationized) with PAH (right). The images show the adsorbed PECs in dried state. The area depicted in each image is 1 × 1 μm. Interestingly, cationic complexes adsorbed to both anionic and cationic substrates (i.e., substrates pre-treated with a PAH adsorption step), as can be seen in both the AFM images (Figure 11b) and the SPAR adsorption data (Figure 12).
Figure 12. SPAR measurements showing the adsorption of a cationic unfiltered PEC dispersion to a silicon oxide surface, pre-treated with PAH. This could possibly be explained by a non-electrostatic contribution to the adsorption, which was also observed by Norgren et al. (2007) in a study in which anionic PECs were successfully adsorbed to an anionic lignin model surface. Other explanations could be the existence of anionic patches on the overall cationic complexes or that the charge of the complexes changes upon exposure to the cationic surface. The latter explanation is possible, since the complex is formed
PAH
PEC
Rinse
A B
24
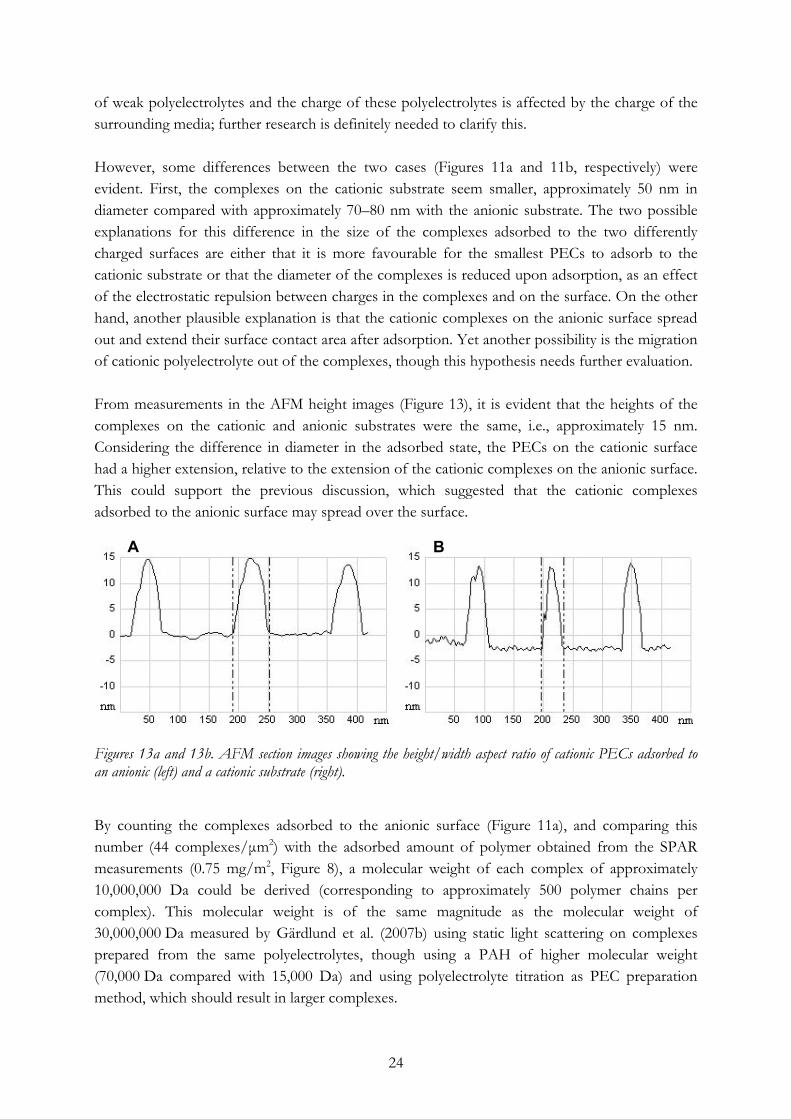
of weak polyelectrolytes and the charge of these polyelectrolytes is affected by the charge of the surrounding media; further research is definitely needed to clarify this. However, some differences between the two cases (Figures 11a and 11b, respectively) were evident. First, the complexes on the cationic substrate seem smaller, approximately 50 nm in diameter compared with approximately 70–80 nm with the anionic substrate. The two possible explanations for this difference in the size of the complexes adsorbed to the two differently charged surfaces are either that it is more favourable for the smallest PECs to adsorb to the cationic substrate or that the diameter of the complexes is reduced upon adsorption, as an effect of the electrostatic repulsion between charges in the complexes and on the surface. On the other hand, another plausible explanation is that the cationic complexes on the anionic surface spread out and extend their surface contact area after adsorption. Yet another possibility is the migration of cationic polyelectrolyte out of the complexes, though this hypothesis needs further evaluation. From measurements in the AFM height images (Figure 13), it is evident that the heights of the complexes on the cationic and anionic substrates were the same, i.e., approximately 15 nm. Considering the difference in diameter in the adsorbed state, the PECs on the cationic surface had a higher extension, relative to the extension of the cationic complexes on the anionic surface. This could support the previous discussion, which suggested that the cationic complexes adsorbed to the anionic surface may spread over the surface.
Figures 13a and 13b. AFM section images showing the height/width aspect ratio of cationic PECs adsorbed to an anionic (left) and a cationic substrate (right). By counting the complexes adsorbed to the anionic surface (Figure 11a), and comparing this number (44 complexes/μm2) with the adsorbed amount of polymer obtained from the SPAR measurements (0.75 mg/m2, Figure 8), a molecular weight of each complex of approximately 10,000,000 Da could be derived (corresponding to approximately 500 polymer chains per complex). This molecular weight is of the same magnitude as the molecular weight of 30,000,000 Da measured by Gärdlund et al. (2007b) using static light scattering on complexes prepared from the same polyelectrolytes, though using a PAH of higher molecular weight (70,000 Da compared with 15,000 Da) and using polyelectrolyte titration as PEC preparation method, which should result in larger complexes.
A B

25
PEC adsorption to fibre surfaces (Paper I) Using environmental scanning electron microscopy (ESEM), the appearance of PECs adsorbed to bleached Kraft softwood fibres was studied and the treated part of the fibre (Figure 14a) was compared with the untreated part of the same fibre (Figure 14b).
Figures 14a and 14b. ESEM images showing a bleached Kraft softwood fibre treated with PECs (a), and the untreated part of the same fibre (b). The scale bars in the figures are 10 μm.
A
B

26
In the ESEM image of PECs adsorbed to a cellulosic fibre (Figure 14a), the complexes seem more sparsely adsorbed and larger than in the AFM image: approximately 100–200 nm versus 50–70 nm. This is probably because the resolution ESEM microscopy makes it impossible to see the smaller complexes that constitute most of the complex solution. Single fibre treatment and analysis with DCA Using dynamic contact angle (DCA) analysis, it was possible to partially treat an individual fibre and compare its surface properties and the wettability of the treated and untreated parts of the fibres, as described in the experimental section. Recent results have indicated that low fibre wettability may give a stronger interaction between fibres during consolidation when the sheet is formed (Lingström et al. 2006). This probably influences the strength of the wet interaction of the fibre–fibre joints in the sheet. Figure 15 shows the force trace when a fibre was immersed in the solution (advancing) and withdrawn from the solution (receding) of the rinsing step after treating the individual fibre to 0.3 mm with filtered complexes. In the figure, a significant difference in wetting force can be detected between the treated and untreated parts of the fibre; the treated part displays a significantly lower advancing force, i.e., a less hydrophilic surface, than does the untreated part.
0.0 0.5-1
0
1
2
3
4
5
6
7
F (μ
Ν)
Fibre distance (mm)
Figure 15. Force traces of the washing step of a fibre treated with 30 mg/L filtered PEC dispersion, treated to 0.3 mm and washed to 0.5 mm. From the force traces, the advancing contact angles of the treated fibres can be calculated (see Paper I). Calculating the advancing contact angles indicates a lower average value for the fibres treated with the filtered than the non-filtered solution: 66 ±3 degrees versus 77 ±12 degrees, respectively. The intervals, calculated at a 95% confidence level, are such that there is no significant difference in influence depending on the solution. However, it can be seen that the
PEC No PEC
27
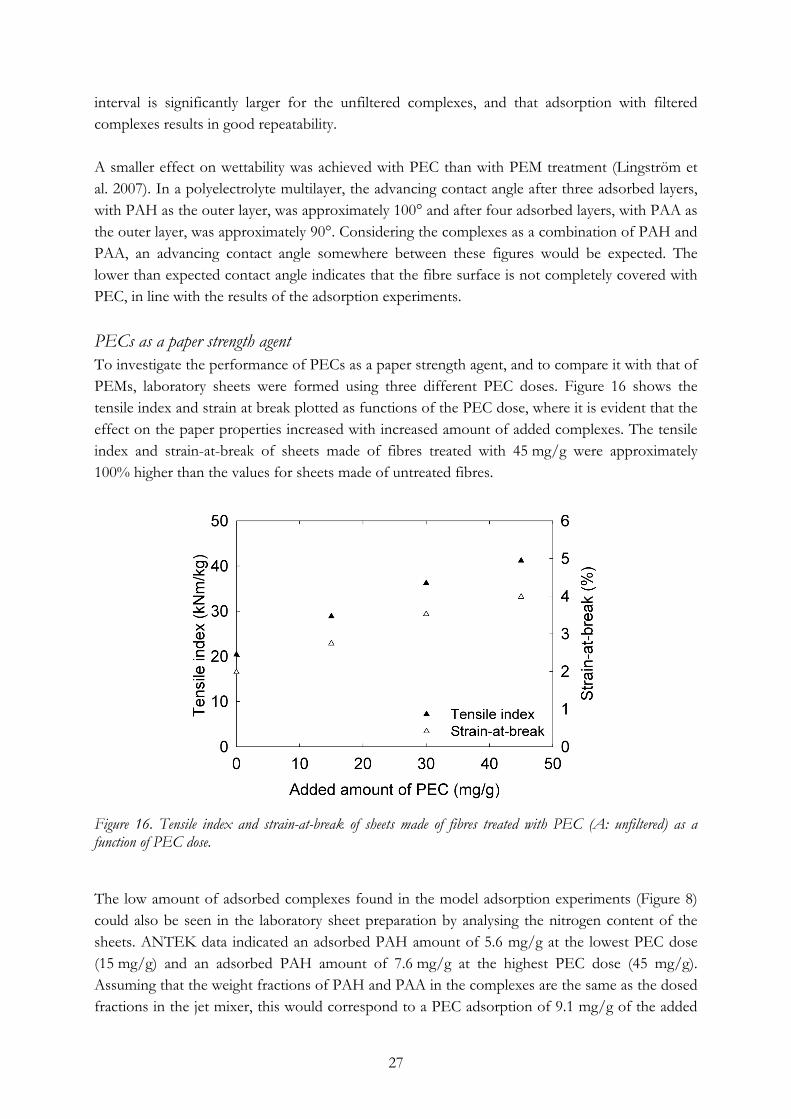
interval is significantly larger for the unfiltered complexes, and that adsorption with filtered complexes results in good repeatability. A smaller effect on wettability was achieved with PEC than with PEM treatment (Lingström et al. 2007). In a polyelectrolyte multilayer, the advancing contact angle after three adsorbed layers, with PAH as the outer layer, was approximately 100° and after four adsorbed layers, with PAA as the outer layer, was approximately 90°. Considering the complexes as a combination of PAH and PAA, an advancing contact angle somewhere between these figures would be expected. The lower than expected contact angle indicates that the fibre surface is not completely covered with PEC, in line with the results of the adsorption experiments. PECs as a paper strength agent To investigate the performance of PECs as a paper strength agent, and to compare it with that of PEMs, laboratory sheets were formed using three different PEC doses. Figure 16 shows the tensile index and strain at break plotted as functions of the PEC dose, where it is evident that the effect on the paper properties increased with increased amount of added complexes. The tensile index and strain-at-break of sheets made of fibres treated with 45 mg/g were approximately 100% higher than the values for sheets made of untreated fibres.
Figure 16. Tensile index and strain-at-break of sheets made of fibres treated with PEC (A: unfiltered) as a function of PEC dose. The low amount of adsorbed complexes found in the model adsorption experiments (Figure 8) could also be seen in the laboratory sheet preparation by analysing the nitrogen content of the sheets. ANTEK data indicated an adsorbed PAH amount of 5.6 mg/g at the lowest PEC dose (15 mg/g) and an adsorbed PAH amount of 7.6 mg/g at the highest PEC dose (45 mg/g). Assuming that the weight fractions of PAH and PAA in the complexes are the same as the dosed fractions in the jet mixer, this would correspond to a PEC adsorption of 9.1 mg/g of the added
28
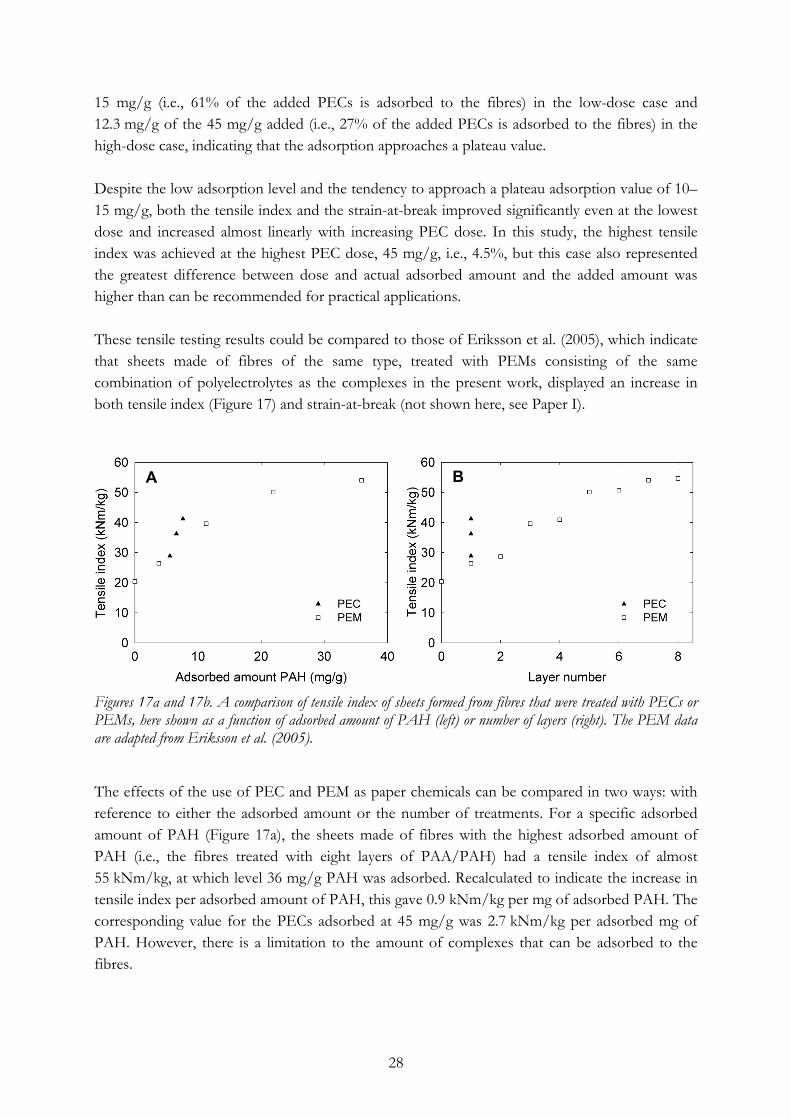
15 mg/g (i.e., 61% of the added PECs is adsorbed to the fibres) in the low-dose case and 12.3 mg/g of the 45 mg/g added (i.e., 27% of the added PECs is adsorbed to the fibres) in the high-dose case, indicating that the adsorption approaches a plateau value. Despite the low adsorption level and the tendency to approach a plateau adsorption value of 10–15 mg/g, both the tensile index and the strain-at-break improved significantly even at the lowest dose and increased almost linearly with increasing PEC dose. In this study, the highest tensile index was achieved at the highest PEC dose, 45 mg/g, i.e., 4.5%, but this case also represented the greatest difference between dose and actual adsorbed amount and the added amount was higher than can be recommended for practical applications. These tensile testing results could be compared to those of Eriksson et al. (2005), which indicate that sheets made of fibres of the same type, treated with PEMs consisting of the same combination of polyelectrolytes as the complexes in the present work, displayed an increase in both tensile index (Figure 17) and strain-at-break (not shown here, see Paper I).
Figures 17a and 17b. A comparison of tensile index of sheets formed from fibres that were treated with PECs or PEMs, here shown as a function of adsorbed amount of PAH (left) or number of layers (right). The PEM data are adapted from Eriksson et al. (2005). The effects of the use of PEC and PEM as paper chemicals can be compared in two ways: with reference to either the adsorbed amount or the number of treatments. For a specific adsorbed amount of PAH (Figure 17a), the sheets made of fibres with the highest adsorbed amount of PAH (i.e., the fibres treated with eight layers of PAA/PAH) had a tensile index of almost 55 kNm/kg, at which level 36 mg/g PAH was adsorbed. Recalculated to indicate the increase in tensile index per adsorbed amount of PAH, this gave 0.9 kNm/kg per mg of adsorbed PAH. The corresponding value for the PECs adsorbed at 45 mg/g was 2.7 kNm/kg per adsorbed mg of PAH. However, there is a limitation to the amount of complexes that can be adsorbed to the fibres.
A B

29
In practical terms, i.e., when chemicals are added to the pulp at the wet-end of a paper machine, the number of treatment steps is very important. Another comparison, considering the PEC treatment as a single layer, can therefore be made. In Figure 17a, it can be seen that even at the lowest PEC dose, the tensile index of the PEC-treated sheets is slightly higher than that of the PEM-treated sheets, while at the highest PEC dose, the tensile index was as much as 56% higher than that of the sheets treated with one layer of PEMs (i.e., one PAH layer). This comparison also indicates that 4 or 5 layers of PEM would be needed to achieve the same tensile index level as is achieved at the highest PEC dose. It should also be noted that the sheet density of the PEC-treated sheets was unaffected (Table 3), whereas the density of the PEM-treated sheets increased from 547 kg/m3 (reference sheets with no adsorbed layers) to 605 kg/m3 after the adsorption of eight layers (Eriksson et al. 2005).
Table 3. Density of paper sheets made of untreated fibres, and sheets made of fibres treated with PEC.
Added PEC (mg/g)
Density (kNm/kg)
0 532 15 500 30 552 45 489
To summarize, an excess of PEC is needed to achieve a high PEC adsorption. However, the adsorbed amount of PEC has a strong positive effect on the studied paper properties. With PEM it is always possible to adsorb an additional number of layers, increasing the total adsorbed amount of polymer. The limiting factor here is of a practical nature, especially bearing in mind the wet-end of a paper machine. One explanation of the improvement in strength properties achieved using PEC is that the treatment increases both the molecular contact area between the fibres and the fibre–fibre joint strength. This effect was seen and reported by Torgnysdotter and Wågberg (2006), who compared the properties of joints treated with PECs and with PEMs, demonstrating the influence of the fibre–fibre joint on the paper sheet properties. The greater effect on tensile index for a given adsorbed amount of PAH evident in the present study is well in line with the results of Torgnysdotter and Wågberg (2006), who found a larger increase in contact area with PEC than with PEM treatment at a given adsorption level. Another reason for the greater effect of PECs on paper properties, even at low adsorbed amounts, could be that the three-dimensional structure of the PECs, compared to the smoother structure of PEMs, can form multiple contact points between the macroscopically rough fibres.

30
31
Conclusions In this work, polyelectrolyte complexes were formed using a specially designed jet mixer. It was found that diffusion was important for an initial formation of pre-complexes, whereas the role of the vigorous mixing was to hinder these pre-complexes from forming larger aggregates. In the case of low-molecular-weight polyelectrolytes, the diffusion is a sufficiently fast process to result in stable pre-complexes, but when the polyelectrolytes are larger, non-equilibrium pre-complexes, more prone to aggregate, are formed. By studying the influence of mixing time, this effect could be seen as the formation of small complexes from the small polyelectrolytes and the formation of larger complexes from the larger polyelectrolytes, especially at the very shortest mixing times. Well in line with this, the comparison between jet mixing and polyelectrolyte titration for PEC formation indicated that jet mixing resulted in complexes of smaller size, and that with jet mixing the size could be controlled by the mixing time to some extent, which was not the case with polyelectrolyte titration. Generally, adsorption of polyelectrolytes in the form of PECs led to lower adsorption levels than if the same polyelectrolytes were adsorbed in the form of PEMs. This was ascribed to free energy, entropical, reasons for the adsorption of the PECs rather than to any geometric limitation of the surface. It was also found that cationic PECs formed from weak polyelectrolytes could be adsorbed to anionic as well as cationic surfaces. This was probably due to anionic patches on the net cationic PECs or to the ability of a PEC formed from weak polyelectrolytes to partially change its charge upon exposure to a surface of the same charge as the complex itself. By adsorbing polyelectrolytes in the form of PECs and PEMs to fibres, improvements of the tensile index and strain at break of handsheets made of the treated fibres were achieved. Since the PEM strategy enables larger adsorption levels than the PEC strategy, larger strength improvements were achieved using PEMs. However, PEC treatment resulted in the greatest effect per adsorbed amount of polymer, probably due to the increased molecular contact area and high number of contact points between fibres achieved using PEC treatment.

32
33
Acknowledgements First, I would like to thank Prof. Lars Wågberg for his supervision and support, especially when I needed it the most. Lars Ödberg, Joakim Carlén, Eka Chemicals AB, and Michael Persson, Eka Chemicals AB, are all thanked for the valuable discussions. All my colleagues at the Fibre Technology Division of the Department of Fibre and Polymer Technology are thanked for their support and help with small and big matters, every day. I would like to extend special thanks to Lars-Erik. I would also like to thank my co-authors Rikard Lingström and Sedat Ondaral. Christian Aulin is gratefully acknowledged for the AFM images and Joanna Hornatowska is thanked for the ESEM images. I would also like to thank my family and a special thanks to Micke – for everything. Eka Chemicals AB and the Knowledge Foundation through its graduate school YPK are gratefully thanked for their financial support.

34
35
References
Bakeev, K. N., V. A. Izumrudov, S. I. Kuchanov, A. B. Zezin and V. A. Kabanov (1992). "Kinetics and mechanism of interpolyelectrolyte exchange and addition reactions." Macromolecules 25(17): 4249-4254.
Bakeev, K. N., V. A. Izumrudov, A. B. Zezin and V. A. Kabanov (1988). "Kinetics and mechanism of the formation of polyelectrolyte complexes." Doklady Akademii Nauk SSSR 299(6): 1405-1408.
Biesheuvel, P. M. and M. A. Cohen Stuart (2004a). "Cylindrical cell model for the electrostatic free energy of polyelectrolyte complexes." Langmuir 20(11): 4764-4770.
Biesheuvel, P. M. and M. A. Cohen Stuart (2004b). "Electrostatic free energy of weakly charged macromolecules in solution and intermacromolecular complexes consisting of oppositely charged polymers." Langmuir 20(7): 2785-2791.
Britt, K. W. (1973). "Retention of additives during sheet formation." Tappi 56(3): 83-86.
Buchhammer, H.-M., G. Petzold and K. Lunkwitz (1999). "Salt effect on formation and properties of interpolyelectrolyte complexes and their interactions with silica particles." Langmuir 15: 4306-4310.
Cundall, R. B., J. B. Lawton, D. Murray and G. O. Phillips (1979). "Polyelectrolyte complexes, 1. The effect of pH and ionic strength on the stoichiometry of model polycation-polyanion complexes." Makromol. Chem. 180(12): 2913-2922.
Dautzenberg, H. (1997). "Polyelectrolyte complex formation in highly aggregating systems. 1. Effect of salt: Polyelectrolyte complex formation in the presence of NaCl." Macromolecules 30(25): 7810-7815.
Dautzenberg, H. (2001). Polyelectrolyte complex formation in highly aggregating systems: Methodical aspects and general tendencies. Physical Chemistry of Polyelectrolytes. T. Radeva, Marcel Dekker Inc., New York, USA. 99: 743-792.
Dautzenberg, H. and G. Rother (2003). "Response of polyelectrolyte complexes to subsequent addition of sodium chloride: Time-dependent static light scattering studies." Macromol. Chem. Phys. 205(1): 114-121.
36
Decher, G. (1997). "Fuzzy nanoassemblies: Toward layered polymeric multicomposites." Science 277: 1232-1237.
Decher, G., J. D. Hong and J. Schmitt (1992). "Buildup of ultrathin multilayer films by a self-assembly process: III. Consecutively alternating adsorption of anionic and cationic polyelectrolytes on charged surfaces." Thin Solid Films 210/211: 831-835.
Dijt, J. C., M. A. C. Stuart and G. J. Fleer (1994). "Reflectometry as a tool for adsorption studies." Adv. Colloid Interface Sci. 50: 79-101.
Dragan, E. S., M. Mihai and S. Schwarz (2006). "Polyelectrolyte complex dispersions with a high colloidal stability controlled by the polyion structure and titrant addition rate." Colloid Surface., A 290(1-3): 213-221.
Dragan, E. S. and S. Schwarz (2004). "Polyelectrolyte complexes. VII. Complex nanoparticles based on poly(sodium 2-acrylamido-2-methylpropanesulfonate) tailored by the titrant addition rate." J. Polym. Sci., Part A: Polym. Chem. 42(20): 5244-5252.
Eriksson, M., S. M. Notley and L. Wågberg (2005). "The influence on paper strength properties when building multilayers of weak polyelectrolytes onto wood fibers." J. Colloid Interface Sci. 292(1): 38-45.
Eriksson, M., A. Torgnysdotter and L. Wågberg (2006). "Surface modification of wood fibers using the polyelectrolyte multilayer technique: Effects on fiber joint and paper strength properties." Ind. Eng. Chem. Res. 45(15): 5279-5286.
Fuoss, R. M. and H. Sadek (1949). "Mutual interaction of polyelectrolytes." Science 110: 552-554.
Gärdlund, L. (2006). Polyelectrolyte complexes - their characterisation and use for modification of wood fibre surfaces. Doctoral Thesis. Fibre and Polymer Technology, Royal Institute of Technology, Stockholm, Sweden.
Gärdlund, L., J. Forsström, B. Andreasson and L. Wågberg (2005). "Influence of polyelectrolyte complexes on the strength properties of papers from unbleached kraft pulps with different yields." Nord. Pulp Paper Res. J. 20(1): 36-42.
Gärdlund, L., M. Norgren, L. Wågberg and A. Marklund (2007a). "The use of polyelectrolyte complexes (PEC) as strength additives for different pulps used for production of fine paper." Nord. Pulp Paper Res. J. 22(2): 210-216.
Gärdlund, L., L. Wågberg and R. Gernandt (2003). "Polyelectrolyte complexes for surface modification of wood fibres II. Influence of complexes on wet and dry strength of paper." Colloid Surface., A 218: 137-149.
Gärdlund, L., L. Wågberg and M. Norgren (2007b). "New insights into the structure of polyelectrolyte complexes." J. Colloid Interface Sci. 312(2): 237-246.
Hayashi, Y., M. Ullner and P. Linse (2004). "Oppositely charged polyelectrolytes. Complex formation and effects of chain asymmetry." J. Phys. Chem. B 108(39): 15266-15277.
Johnson, B. K. and R. K. Prud'homme (2003). "Chemical processing and micromixing in confined impinging jets." AIChE J. 49(9): 2264-2282.
Kabanov, V. (2003). Fundamentals of polyelectrolyte complexes in solution and the bulk. Multilayer Thin Films. G. Decher and J. B. Schlenoff, Wiley-VCH Verlag GmbH, Weinheim, Germany: 47-86.
Kabanov, V. A. and A. B. Zezin (1984). "Soluble interpolymeric complexes as a new class of synthetic polyelectrolytes." Pure Appl. Chem. 56(3): 343-354.
37
Kiriy, A., J. Yu and M. Stamm (2006). "Interpolyelectrolyte complexes: A single-molecule insight." Langmuir 22(4): 1800-1803.
Ladam, G., P. Schaad, J. C. Voegel, P. Schaaf, G. Decher and F. Cuisinier (2000). "In situ determination of the structural properties of initially deposited polyelectrolyte multilayers." Langmuir 16(3): 1249-1255.
Lingström, R., S. M. Notley and L. Wågberg (2007). "Wettability changes in the formation of polymeric multilayers on cellulose fibers and their influence on wet adhesion." J. Colloid Interface Sci. 314(1): 1-9.
Lingström, R., L. Wågberg and T. P. Larsson (2006). "Formation of polyelectrolyte multilayers on fibres: influence on wettability and fibre/fibre interaction." J. Colloid Interface Sci. 296(2): 396-408.
Michaels, A. S. and R. G. Miekka (1961). "Polycation-polyanion complexes: Preparation and properties of poly-(vinylbenzyltrimethylammonium) poly-(styrenesulfonate)." J. Phys. Chem. 65: 1765-1773.
Michaels, A. S., L. Mir and N. S. Schneider (1965). "A conductometric study of polycation-polyanion reactions in dilute aqueous solution." J. Phys. Chem. 69(5): 1447-1455.
Moore, E. E. (1976). "Charge relationships of dual polymer retention aids." Tappi 59(6): 120-122.
Norgren, M., L. Gärdlund, S. M. Notley, M. Htun and L. Wågberg (2007). "Smooth Model Surfaces from Lignin Derivatives. II. Adsorption of Polyelectrolytes and PECs Monitored by QCM-D." Langmuir 23(7): 3737-3743.
Notley, S. M., M. Eriksson and L. Wågberg (2005). "Visco-elastic and adhesive properties of adsorbed polyelectrolyte multilayers determined in situ with QCM-D and AFM measurements." J. Colloid Interface Sci. 292(1): 29-37.
Nyström, R., G. Hedström, J. Gustafsson and J. B. Rosenholm (2004). "Mixtures of cationic starch and anionic polyacrylate used for flocculation of calcium carbonate - influence of electrolytes." Colloid Surface., A 234(1-3): 85-93.
Nyström, R. and J. B. Rosenholm (2005). "Highly cationic starch and "anionic trash" for optimal filler retention and paper strength?" Colloid Surface., A 252(2-3): 135-141.
Petzold, G., A. Nebel, H. M. Buchhammer and K. Lunkwitz (1998). "Preparation and characterization of different polyelectrolyte complexes and their application as flocculants." Colloid Polym. Sci. 276(2): 125-130.
Philipp, B., H. Dautzenberg, K. J. Linow, J. Koetz and W. Dawydoff (1989). "Polyelectrolyte complexes - recent developments and open problems." Prog. Polym. Sci. 14(1): 91-172.
Sauerbrey, G. (1959). "Verwendung von Schwingquarzen zur Wägung dünner Schichten und zur Mikrowägung." Z. Phys. 155: 206-222.
Sukhishvili, S. A., E. Kharlampieva and V. Izumrudov (2006). "Where polyelectrolyte multilayers and polyelectrolyte complexes meet." Macromolecules 39(26): 8873-8881.
Thünemann, A. F., M. Müller, H. Dautzenberg, J.-F. Joanny and H. Löwen (2004). Polyelectrolyte complexes. Polyelectrolytes with defined molecular architecture II. M. Schmidt, Springer-Verlag Berlin Heidelberg, Germany. 166: 113-171.
Torgnysdotter, A. and L. Wågberg (2006). "Tailoring of fibre/fibre joints in order to avoid the negative impacts of drying on paper properties." Nord. Pulp Paper Res. J. 21(3): 411-418.

38
Tsuchida, E. and K. Abe (1982). Interactions between macromolecules in solution and intermacromolecular complexes. Advances in Polymer Science. H.-J. Cantow, G. Dall'Asta et al., Springer-Verlag Berlin Heidelberg, Germany. 45: 1-130.
Vainio, A., H. Paulapuro, K. Koljonen and J. Laine (2006). "The effect of drying stress and polyelectrolyte complexes on the strength properties of paper." J. Pulp Paper Sci. 32(1): 9-13.
Vanerek, A. and T. G. M. van de Ven (2006). "Coacervate complex formation between cationic polyacrylamide and anionic sulfonated kraft lignin." Colloid Surface., A 273: 55-62.
Wågberg, L., S. Forsberg, A. Johansson and P. Juntti (2002). "Engineering of fibre surface properties by application of the polyelectrolyte multilayer concept. Part I: Modification of paper strength." J. Pulp Paper Sci. 28: 222-227.