polyelectrolyte–surfactant complexes (synthesis, structure and
TRANSCRIPT

Polyelectrolyte–surfactant complexes
(synthesis, structure and materials aspects)
Andreas F. Thunemann
Fraunhofer Institute for Applied Polymer Research, Geiselbergstrasse 69, D-14476 Golm, Germany
Received 29 October 2001; revised 20 February 2002; accepted 21 February 2002
Abstract
Self-assembled polyelectrolyte–surfactant complexes in the solid state and as nanoparticles are the topic of this
review. These materials combine the properties of polymers (mechanical stability) and surfactants (formation of
highly ordered mesophases). Their building principle is modular which allows a great variety in their designing as
well as their structural and functional properties. Typical examples discussed in this review are complexes of
fluorinated surfactants. Thin and ultra-thin films of these polyelectrolyte–fluorosurfactant complexes form
different smectic structures with low surface energies. The critical surface energies are in the range 6–18 mN/m.
Optically functionalized complexes form rigid-rod, smectic A, B and turbostratic layered mesophases.
Electroluminescent complexes with low turn-on points are described. It is reported that complexes of hexa-
peri-hexabenzocoronene with polysiloxanes and poly(ethylene imine) form different columnar discotic structures
with columns as long as 200 nm. These materials behave as viscoelastic solids. q 2002 Elsevier Science Ltd. All
rights reserved.
Keywords: Polyelectrolyte–surfactant complexes; Small-angle X-ray scattering; Liquid crystal-like complexes; Self-assembly;
Wetting; Fluorinated surfactants; Low surface energies; Light-emitting diodes; Discotic-columnar complexes; Hexa-peri-
hexabenzocoronene; Nanoparticles; Nanodispersions; Poly(ethylene imine); Poly( p-phenyleneethynylene); Diazosulfonate
polymers; Polysiloxanes
Contents
1. Introduction . . . . . . . . . . . . . . . . . . . . . . . . . . . . . . . . . . . . . . . . . . . . . . . . . . . . . . . . . . . . . . . . . . .1474
1.1. The scope of this review . . . . . . . . . . . . . . . . . . . . . . . . . . . . . . . . . . . . . . . . . . . . . . . . . . . . .1474
1.2. Definitions of order . . . . . . . . . . . . . . . . . . . . . . . . . . . . . . . . . . . . . . . . . . . . . . . . . . . . . . . . .1475
1.3. Methods of measuring the degree of order. . . . . . . . . . . . . . . . . . . . . . . . . . . . . . . . . . . . . . . . .1476
1.4. X-ray diffraction . . . . . . . . . . . . . . . . . . . . . . . . . . . . . . . . . . . . . . . . . . . . . . . . . . . . . . . . . . .1476
1.4.1. Kratky camera . . . . . . . . . . . . . . . . . . . . . . . . . . . . . . . . . . . . . . . . . . . . . . . . . . . . . . .1476
1.4.2. Nanostructures with sharp interfaces . . . . . . . . . . . . . . . . . . . . . . . . . . . . . . . . . . . . . . .1477
1.4.3. Lamellar nanostructures in the bulk material . . . . . . . . . . . . . . . . . . . . . . . . . . . . . . . . .1478
1.4.4. Finite lamellar structures of nanoparticles . . . . . . . . . . . . . . . . . . . . . . . . . . . . . . . . . . .1479
2. Self-assembly and wetting . . . . . . . . . . . . . . . . . . . . . . . . . . . . . . . . . . . . . . . . . . . . . . . . . . . . . . . .1482
0079-6700/02/$ - see front matter q 2002 Elsevier Science Ltd. All rights reserved.
PII: S0079-6700(02)00017-5
Prog. Polym. Sci. 27 (2002) 1473–1572www.elsevier.com/locate/ppolysci

2.1. Complexes of polyelectrolytes and fluorinated surfactants (PEFAs) . . . . . . . . . . . . . . . . . . . . . .1482
2.1.1. Complex formation . . . . . . . . . . . . . . . . . . . . . . . . . . . . . . . . . . . . . . . . . . . . . . . . . . .1483
2.1.2. Variation of the surfactant [17] . . . . . . . . . . . . . . . . . . . . . . . . . . . . . . . . . . . . . . . . . . .1484
2.1.3. Variations in the charge density [21] . . . . . . . . . . . . . . . . . . . . . . . . . . . . . . . . . . . . . . .1487
2.1.4. Coatings from nanodispersions of PEFAs [22] . . . . . . . . . . . . . . . . . . . . . . . . . . . . . . . .1490
2.1.5. Surface structure [32] . . . . . . . . . . . . . . . . . . . . . . . . . . . . . . . . . . . . . . . . . . . . . . . . . .1493
2.1.6. Hexagonal columnar discotic structures [36] . . . . . . . . . . . . . . . . . . . . . . . . . . . . . . . . .1494
2.1.7. Ultra-thin films [43] . . . . . . . . . . . . . . . . . . . . . . . . . . . . . . . . . . . . . . . . . . . . . . . . . . .1498
2.1.8. Fine-tuning of the surface energy [53] . . . . . . . . . . . . . . . . . . . . . . . . . . . . . . . . . . . . . .1505
2.2. Diazosulfonate polymer complexes . . . . . . . . . . . . . . . . . . . . . . . . . . . . . . . . . . . . . . . . . . . . . .1511
2.2.1. Super-strongly segregated lamellar structures [60] . . . . . . . . . . . . . . . . . . . . . . . . . . . . .1512
2.2.2. Structures and wetting of ultra-thin films [63] . . . . . . . . . . . . . . . . . . . . . . . . . . . . . . . .1520
2.3. Polyelectrolyte–silicon–surfactant complexes [66] . . . . . . . . . . . . . . . . . . . . . . . . . . . . . . . . . .1526
2.3.1. Nanostructures . . . . . . . . . . . . . . . . . . . . . . . . . . . . . . . . . . . . . . . . . . . . . . . . . . . . . . .1527
2.3.2. Wetting . . . . . . . . . . . . . . . . . . . . . . . . . . . . . . . . . . . . . . . . . . . . . . . . . . . . . . . . . . . .1530
2.4. Polysiloxane–fluorosurfactant complexes [77]. . . . . . . . . . . . . . . . . . . . . . . . . . . . . . . . . . . . . .1531
2.4.1. Wetting . . . . . . . . . . . . . . . . . . . . . . . . . . . . . . . . . . . . . . . . . . . . . . . . . . . . . . . . . . . .1532
2.4.2. Cross-linking . . . . . . . . . . . . . . . . . . . . . . . . . . . . . . . . . . . . . . . . . . . . . . . . . . . . . . . .1535
3. Optically functionalized complexes . . . . . . . . . . . . . . . . . . . . . . . . . . . . . . . . . . . . . . . . . . . . . . . . . .1535
3.1. Rigid-rod complex [87] . . . . . . . . . . . . . . . . . . . . . . . . . . . . . . . . . . . . . . . . . . . . . . . . . . . . . .1536
3.2. A fluorescent complex with a layered nanoarchitecture [101] . . . . . . . . . . . . . . . . . . . . . . . . . . .1539
3.2.1. Nanostructure. . . . . . . . . . . . . . . . . . . . . . . . . . . . . . . . . . . . . . . . . . . . . . . . . . . . . . . .1539
3.2.2. Ultra-thin films. . . . . . . . . . . . . . . . . . . . . . . . . . . . . . . . . . . . . . . . . . . . . . . . . . . . . . .1542
3.2.3. Optical properties . . . . . . . . . . . . . . . . . . . . . . . . . . . . . . . . . . . . . . . . . . . . . . . . . . . . .1544
3.3. Electroluminescent polyelectrolyte complexes [119,151] . . . . . . . . . . . . . . . . . . . . . . . . . . . . . .1547
3.3.1. Thermal properties . . . . . . . . . . . . . . . . . . . . . . . . . . . . . . . . . . . . . . . . . . . . . . . . . . . .1548
3.3.2. Nanostructures . . . . . . . . . . . . . . . . . . . . . . . . . . . . . . . . . . . . . . . . . . . . . . . . . . . . . . .1548
3.3.3. Optical properties . . . . . . . . . . . . . . . . . . . . . . . . . . . . . . . . . . . . . . . . . . . . . . . . . . . . .1552
4. Columnar discotic complexes . . . . . . . . . . . . . . . . . . . . . . . . . . . . . . . . . . . . . . . . . . . . . . . . . . . . . .1554
4.1. Polyethyleneimine hexa-peri-hexabenzocoronene [139] . . . . . . . . . . . . . . . . . . . . . . . . . . . . . . .1555
4.1.1. Nanostructures . . . . . . . . . . . . . . . . . . . . . . . . . . . . . . . . . . . . . . . . . . . . . . . . . . . . . . .1555
4.1.2. Mechanical properties. . . . . . . . . . . . . . . . . . . . . . . . . . . . . . . . . . . . . . . . . . . . . . . . . .1558
4.2. Polysiloxane hexa-peri-hexabenzocoronene [144] . . . . . . . . . . . . . . . . . . . . . . . . . . . . . . . . . . .1559
4.2.1. Nanostructures . . . . . . . . . . . . . . . . . . . . . . . . . . . . . . . . . . . . . . . . . . . . . . . . . . . . . . .1560
4.2.2. Thermal and mechanical properties . . . . . . . . . . . . . . . . . . . . . . . . . . . . . . . . . . . . . . . .1563
5. Summary and outlook. . . . . . . . . . . . . . . . . . . . . . . . . . . . . . . . . . . . . . . . . . . . . . . . . . . . . . . . . . . .1565
Acknowledgements . . . . . . . . . . . . . . . . . . . . . . . . . . . . . . . . . . . . . . . . . . . . . . . . . . . . . . . . . . . . . . . .1566
References . . . . . . . . . . . . . . . . . . . . . . . . . . . . . . . . . . . . . . . . . . . . . . . . . . . . . . . . . . . . . . . . . . . . . . .1566
1. Introduction
1.1. The scope of this review
The self-assembly of matter is manifest throughout biotic and abiotic nature. In scientific discourse, it
is commonly accepted that self-assembly is the cornerstone of so-called ‘bottom-up’ synthetic routes to
nano- and mesostructured materials [1]. The ‘bottom-up’ nanotechnologies are, however, competing
with ‘top-down’ methods. In the latter, structures are carved or sculpted out of macroscopic materials,
which are difficult and costly procedures. Experimental work on self-assembly is, therefore, a very active
and scientifically rich field of inquiry.
A.F. Thunemann / Prog. Polym. Sci. 27 (2002) 1473–15721474

In this review, the concept of self-assembly is applied in order to construct ordered arrays of organic
molecules or, more generally speaking, to form periodic nanostructures. A typical periodicity is on a
length scale of about 5 nm. For the construction of ordered organic molecules—periodic
nanostructures—two basic building blocks are used: polyelectrolytes and ionic surfactants of opposite
charges, defined as polyelectrolyte–surfactant complexes. The design and investigation of polyelec-
trolyte–surfactant complexes undertaken in this study is of an interdisciplinary nature. It lies on the
border between polymer and colloid science, concerning issues that belong equally to the fields of
physics and chemistry.
The formation of polyelectrolyte–surfactant complexes is modular and, accordingly, very
comprehensive, as an immense number of building blocks are available. Polyelectrolytes as well as
the surfactants used as building blocks, can be of either natural or synthetic origin. Polyethyleneimine,
polyamino acids and DNA are examples of polyelectrolytes, while typical representatives of useful
surfactants are carboxylic acids and lipids. For the purposes of this review, an effective criterion for the
selection of building blocks and their combinations had to be created. Therefore, it was decided to accept
only those combinations of building blocks that offer insight into the development of new materials.
Highly ordered nanostructures are to be utilized in such a way that new materials will have, at least in
theory, useful physical properties for everyday applications.
Section 1 of this review introduces the definitions of order and the methods of their measurement as
far as they are used for the characterization of the polyelectrolyte–surfactant complexes presented here.
Section 2 covers the self-assembly and the wetting of complexes containing fluorine and silicon
moieties. It focuses on the formation of low surface energies. The optical properties of
nanostructured complexes including their fluorescence and electroluminescene are presented in Section
3. Section 4 present columnar discotic complexes that are formed by complexes of hexa-peri-
hexabenzocoronenes.
Diagrams illustrating the structures of chemical compounds are provided when it is unlikely that
readers are familiar with their names. On the other hand, the derivations of formulae, the origins of which
are readily available in the literature, have been omitted.
1.2. Definitions of order
In Section 1.1, the words ‘order’ and ‘self-assembly’ are used without any precise definition. Most
definitions of order involve thermodynamic concepts. In this context, one might say that the most
ordered state of a system is the one in which the system approaches as the temperature tends to zero.
However, this definition would be of little service in the context of polyelectrolyte–surfactant
complexes. Many of the complexes discussed here, either as a powder or as films, are in states of
metastable equilibrium which are likely to survive longer periods than the time taken to carry out
experiments. Typically, these periods are as long as 4 weeks and in some cases years. Therefore, a
different definition of order is used in this review, one which can also be found in the description of order
in thin organic films as shown by Tredgold [2]. From a practical point of view, the extent to which
disorder can be tolerated depends widely on the context. In a system like DNA encoding the structure of
a particular enzyme, a single defect may render the entire system useless. By contrast, a nematic liquid
crystal display may perform its function well if the axis of each molecule in a particular region lies at an
angle not too far removed from that of the director, even when no other order exists.
In solid-state physics, a perfect, single crystal is usually considered as the ideal, ordered system. In
A.F. Thunemann / Prog. Polym. Sci. 27 (2002) 1473–1572 1475

practice, however, typical crystals contain dislocations and localized lattice defects. In the materials
formed by polyelectrolyte–surfactant complexes, the degree of perfection of typical crystals is not
achieved. Most of these complexes are really best described as frozen liquid crystals. For this reason the
nomenclature of liquid crystals is used for the description of the self-assembled nanostructures of
polyelectrolyte–surfactant complexes.
1.3. Methods of measuring the degree of order
A discussion of the concept of order is related to the description of the various experimental
techniques used to measure this in polyelectrolyte–surfactant complexes. The list given below includes
the techniques which have been employed in this review.
1. The most important is X-ray diffraction in the small-angle mode for the determination of order at
length scales in the range 1–100 nm. Two types of system are used: pinhole cameras and a Kratky
camera.
2. X-ray diffraction in the wide-angle mode is used to determine the degree of order on an atomic length
scale, i.e. smaller than 1 nm. Examples are the side-chain crystallinity of the tail of alkyl chains of
surfactants within the polyelectrolyte–surfactant structures.
3. Optical polarization microscopy is a method used to obtain information quickly about optical
anisotropy of films of complexes and about liquid crystalline-like structures.
4. Electron microscopy is useful to supplement the information of the small-angle X-ray scattering about
periodic nanostructures in the complexes as bulk material. Furthermore, it is a method for the
investigation of nanoparticles of the complexes, especially in types of core–shell morphology.
5. Atomic force microscopy (AFM) is suitable for creating images of the surfaces of complexes
deposited as thin films and of nanoparticles that have been settled on a solid substrate. This method is
successfully used in order to visualize terraced structures of the surfaces of films and their dewetting.
It is further used to characterize nanoparticles of different morphology such as compact, core–shell
and doughnut shape.
6. Infrared, UV–Vis and fluorescence spectroscopies are techniques for the investigation of the degree
of complexation and the optical properties of polyelectrolyte–surfactant complexes.
1.4. X-ray diffraction
The scattering intensities are given as a function of the scattering vector which is defined here as
s ¼ q=2p ¼ 2=l sin u; where u is the Bragg angle and l is the wavelength of the X-ray radiation
(0.154 nm).
1.4.1. Kratky camera
It is well known that the maximum position of a small-angle scattering peak, using a Kratky camera, is
different from that found using a pinhole system. In general, it can be observed that the peak position
determined by using a pinhole system is located between the maximum of the Kratky peak and its point
of inflection. Two possibilities exist for the determination of the correct peak position of a Kratky peak.
The first is a desmearing of the scattering curve. The second is to fit a length-smeared peak onto a Kratky
peak. The solution for the latter has been given by Ruland [3]. In this work length-smeared Lorentzian
A.F. Thunemann / Prog. Polym. Sci. 27 (2002) 1473–15721476

peaks are used. Here, they correspond better with the experimental data than Gaussian peaks. The
spherical average k lv of a three-dimensional Lorentzian distribution IL3ðsÞ with the integral width b and
the distance sh from the origin of the reciprocal space is given by ILðsÞ ¼ pb=ðb2 þ p2ðs 2 shÞ2Þ2: A
length slit smearing of this function, with the approximation of an infinite length of the slit, produces
JðsÞ ¼1
2sh
ðA2 þ B2Þ1=2 2 A
2ðA2 þ B2Þ
!ð1:1Þ
in which A ¼ b2 þ p2ðs2 2 sh2Þ and B ¼ 2pbsh: J represents the slit-smeared intensity and sh is the
reflex position without slit-smearing effects. This expression can be fitted easily to peaks measured with
a Kratky camera and produces a good determination of peak positions and width when compared to
measurements carried out with a high-resolution pinhole small-angle X-ray camera.
1.4.2. Nanostructures with sharp interfaces
The nanostructures of periodic or non-periodic microphase-separated systems normally show density
transitions at interfaces that separate the different phases. In the ideal case, the density transitions
between these regions are sharp. Examples are strongly segregated block copolymers and numerous
polyelectrolyte–surfactant complexes. Sharp phase boundaries are identified in the small-angle
scattering by the presence of Porod’s law [4] which is given by
lims!1
2p3s4IðsÞ ¼k
lp
; ð1:2Þ
I is the scattering intensity when measured with a pinhole system, lp is the average cord length, and k is
the invariant, which is given by the expression
k ¼ 4pð1
0s2IðsÞ ds: ð1:3Þ
The scattering intensity is experimentally available between a lower limiting value of the scattering
vector smin and an upper value smax. In order to calculate the invariant as precisely as possible, the
experimental limits are taken into account by approximations of the region of high and low scattering
vectors, which results in
k ¼4
3psmin
3IðsminÞ þ 4pðsmax
smin
s2IðsÞ ds þ4p
smax
lims!1
½s4IðsÞ�: ð1:4Þ
A similar approximation for measurements performed with a Kratky camera was used earlier by Ruland
[5]. Typically the first and third term in Eq. (1.4) represents less than 10% of the invariant. When using a
Kratky camera, Porod’s law is modified due to its length smearing effect, which results in
lims!1
4p2s3JðsÞ ¼k
lp
; ð1:5Þ
where k is given by the expression
k ¼ 2pð1
0sJðsÞ ds: ð1:6Þ
A.F. Thunemann / Prog. Polym. Sci. 27 (2002) 1473–1572 1477

Again in order to calculate the invariant as precisely as possible the experimental limits are taken into
account by approximations of the region of high and low scattering vectors, which results in
k ¼ psmin2JðsminÞ þ 2p
ðsmax
smin
sJðsÞ ds þ2p
smax
lims!1
½s3IðsÞ�: ð1:7Þ
The main source of error in the range of validity covered by Porod’s law is the scattering due to density
fluctuations and the widths of the domain boundary [6]. Broader transitions or a statistical structuring of
the domain boundary, as typically observed in microphase-separated block copolymers change the
scaling of IðsÞ / s24 when using a pinhole camera system or the scaling of JðsÞ / s23 when using a
Kratky camera. Small deviations from a sharp boundary would indicate a significant deviation from
Porod’s law [6]. A linear behavior of a scattering curve in a s4IðsÞ–s4 plot of a pinhole camera
measurement or in a s3JðsÞ–s3 plot of a Kratky camera measurement proves that the only deviation from
Porod’s law is a three-dimensional homogeneous density fluctuation. The latter is given as the slope of a
straight line in the curve. Then a broader transition or a statistical structuring of the domain boundary, as
typically observed in microphase-separated block copolymers [7], can be excluded. If Porod’s law is
strictly fulfilled the phase boundaries of the nanostructures are in the order of 1–2 atomic distances.
1.4.3. Lamellar nanostructures in the bulk material
An ideal lamellar nanostructure is here considered to be a two-phase system with sharp boundaries
and planar interfaces. The scattering of such a structure is determined by the statistics of the thicknesses
of the lamellae as well as the finite size of the stacks of the lamellae. If the evaluation of the small-angle
scattering is limited to the angular range of the first-order maximum, the separation of these effects is not
possible. The wider the angular range, and the more precise the measurements at higher angles, the more
detailed and reliable are the results of the evaluation. The simplest lamellar nanostructure of a
polyelectrolyte–surfactant complex is a microphase-separated model consisting of an ionic phase and a
non-ionic phase. The ionic phase contains the polyelectrolyte chains and the ionic head groups of the
surfactants, where the non-ionic phase contains the hydrophobic moieties such as alkyl chains. The
repeat unit of a lamellar system d is given by d ¼ d1 þ d2; where d1 and d2 are the thicknesses of the two
lamellae. Their values can be determined by calculating the interface distribution function gðrÞ [8],
which is defined as the second derivative of a one-dimensional autocorrelation function for positive
definite values of the distance r in real space. The interface distribution function can be computed by a
combination of the inverse Fourier transformation and the slit-length desmearing, given by the
expression
gðrÞ /ð1
0GðsÞ 4J0ð2prsÞ2
1 2 4p2r2s2
prsJ1ð2prsÞ
!ds; ð1:8Þ
where Jn is the Bessel function of the first kind and the nth order, and GðsÞ is the interference function
defined by
GðsÞ / lims!1
s3JðsÞ
� �2 s3JðsÞ: ð1:9Þ
The interface distribution function can be written in the form
gðrÞ / h1 þ h2 2 2h12 þ h121 þ h212 2 2h1212 þ · · ·; ð1:10Þ
A.F. Thunemann / Prog. Polym. Sci. 27 (2002) 1473–15721478

where hi represents the normalized distributions of the distances between interfaces, measured at a
perpendicular to the planes of the lamellae. A model that can describe the statistics of lamellar phases is
the lattice model, in which the statistics are given by the distributions h1ðd1Þ and hdðdÞ of the lamellar
thicknesses [7].
If the interfaces of the lamellae are completely planar, and the lateral dimensions are large compared
to the thicknesses of the lamellae, the total interface area per volume is given by S0=V ¼ 2=d: But, if the
interface is not planar, the total interface area S obtained from lp is larger than S0 obtained from d. A
measure of the planarity of the interfaces is obtained from the ratio
S
S0
¼2d1d2
dlp: ð1:11Þ
Obviously S=S0 is 1 for planar interfaces and becomes larger than 1 for undulated or wavy interfaces.
The thicknesses d1 and d2 can be calculated by using the interface distribution function of Eq. (1.10) but,
if planar interfaces are present, then the thicknesses can also be calculated [7]. This can be done by the
relationships
d1 ¼d
21 2
ffiffiffiffiffiffiffiffiffiffiffi1 2
2lp
d
s0@
1A and d2 ¼ d 2 d1: ð1:12Þ
1.4.4. Finite lamellar structures of nanoparticles
The X-ray scattering intensities for spheres with an internal lamellar structure used to discriminate
between different mesomorphous structured nanoparticles have been discussed [25]. In particular,
indicators which distinguish an onion-type structure of concentric lamellae (Fig. 1(A)) from a structure
of parallel layers (Fig. 1(B)) are of interest. This object is called a tart-type particle. Other structures may
be constructed by the superposition of these limiting cases, which then will look more like a ‘patch-
work’.
The scattering amplitude of the onion-type is given by
AðsÞ ¼3
ð2pRsÞ
XðFð2prjsÞ2Fð2prj21sÞÞrj ð1:13Þ
with
FðxÞ ¼ sinðxÞ2 x cosðxÞ:
The onion is assumed to be a sphere of diameter D ¼ 2R with layer boundaries at 0 ¼ r0 , r1 , r2 ,
· · · , rn ¼ R and layer densities r1;…; rn: The amplitude is normalized such that Að0Þ ¼ 1 for a sphere
of constant unit density r1 ¼ r2 ¼ · · · ¼ rn ¼ 1: The corresponding intensity is given as IðsÞ ¼ lAðsÞl2:The scattering amplitude of the tarts, i.e. spheres with an internal structure of parallel lamellae (Fig. 1(B))
is given by the following Fourier integral:
Aðs;qÞ ¼1
R3
ðR
2RdzrðzÞ
ðrðzÞ
2rðzÞdr0
ð2p
0df exp ið2psrz cos qþ 2psr0 sin q cos fÞ
¼1
R3
ðR
2RdzrðzÞ
rðzÞ
2ps sin qJ1ð2psrðzÞ sin qÞ expði2psz cos qÞ: ð1:14Þ
Here, the f and r0 integrations are reduced to the Bessel function J1ðxÞ: The sphere has a diameter of
D ¼ 2R with layer boundaries at 2R ¼ z0 , z2 , · · · , zn ¼ R and layer densities r1;…; rn: The
A.F. Thunemann / Prog. Polym. Sci. 27 (2002) 1473–1572 1479

scattering intensity results from an integration over all orientations of these tart-type particles:
IðsÞ ¼1
2
ðp
0dq sin qlAðs;qÞl2: ð1:15Þ
To produce results that allow for a comparison of the two limiting internal structures for a lamellar
sphere, the intensities for model systems using realistic data are taken. The two parameters that are taken
where the ratio of the two densities rð1Þ=rð2Þ and the ratio of the thickness d1 of the first part of the double
layer to its total thickness d ¼ d1 þ d2: The parameter d1 is interpreted here as the thickness of the non-
ionic rich phase, and d2 as the thickness of the ionic, that is the polyelectrolyte-rich phase. Two
complexes ‘C1’ and ‘C2’ with differing parameter values are considered. For the complex C1, the
densities are rð1Þ=rð2Þ ¼ 0:9=1:1; and for the layer thickness they are d1=d ¼ 1:80=3:00: For the other
complex, C2, values are 0.9/1.1 and 2.07/3.00, respectively. Fig. 2 shows the logarithmic intensities for
complex C1 in simultaneous plots for the onion- and tart-type structures. The main peaks in intensity
correspond to integer values of m ¼ sd: For C1 the peak at m ¼ 5 is missing. The reason is that here
d1=d ¼ 3=5 and cancellation takes place in both sublayers individually for m ¼ 5: The fine structure of
the curves can be shown to result from the overall dimensions of the spheres, i.e. from integer values of
sD. Obviously this fine structure is a lot more pronounced in the case of the spherically symmetric onion
structure. This difference results from the spherical symmetry and the uniform boundaries of the onion
and, in principle, makes it possible to distinguish onion- and tart-type structures by small-angle X-ray
scattering experiments. Note that in the logarithmic plot values close to zero also become pronounced.
300 nm
3 nm
300 nm
3 nmA
B
Fig. 1. Idealized models for the finite lamellar structures of nanoparticles are the onion-like (A) and the tart-like structures (B).
The size of the particles is about 300 nm whereas the internal lamellar structure has a unit cell dimension of about 3 nm.
Reprinted with permission from Langmuir 2000;16:850 q American Chemical Society [25].
A.F. Thunemann / Prog. Polym. Sci. 27 (2002) 1473–15721480

No significance can be given to the amplitudes of these downward ‘peaks’, because they have an
artificial distribution due to the numerical cut-off.
To study the difference of the two internal structures in more detail, the intensities near the first peak
at s ¼ 1=d in linear plots are given in Fig. 3.
Fig. 2. Theoretical scattering curves of lamellar nanoparticles with an onion-type structure (a) and a tart-type structure (b). The
lamellar unit cell dimension is d ¼ 3:00 nm; d1 ¼ 1:80 nm: The densities are r1 ¼ 0:9 and r2 ¼ 1:1: The size of the particle is
100 d ¼ 300 nm: The density of the surroundings is 1. Reprinted with permission from Langmuir 2000;16:850 q American
Chemical Society [25].
0.32 0.33 0.34 0.35
0
200
400
600
800
1000 (a)
s [nm-1]
Inte
nsity
[arb
.uni
ts]
s [nm-1]0.32 0.33 0.34 0.35
(b)
Fig. 3. Scattering in the region of the first Bragg reflection. The scattering of the onion-type particle is characterized by a
number of additional maxima (diagram a, solid line). By contrast, no additional maxima are present in the scattering of the tart-
type particle (diagram a, dashed line). A polydispersity of 1% smears out the additional maxima (b, dashed line) which are
present in the scattering of the same but monodisperse onion-type particles (b, solid line). The particle parameters are
d ¼ 3:00 nm; d1 ¼ 1:80 nm; r1 ¼ 0:9; r2 ¼ 1:1 and D ¼ 100d: Reprinted with permission from Langmuir 2000;16:850 q
American Chemical Society [25].
A.F. Thunemann / Prog. Polym. Sci. 27 (2002) 1473–1572 1481

In addition it is considered as to whether the apparent difference in the signal could indeed be detected
in a realistic experiment. To this end a polydispersity is assumed for the diameter D of the ‘onions’ to a
value of 1%. In the model this means a deviation of up to ^1 layer. The scattering intensity of such a
polydisperse sample is calculated by averaging over intensities ID for onions with diameter D in the
range D0 ^ 1% assuming a uniform distribution for D. An onion for which the diameter D is not an
integer multiple of the layer thickness d is allowed to have a core layer that is smaller than d. The
intensity resulting from this average is plotted together with the original curves in Fig. 3. Obviously
polydispersity smears out the fine structure of the onion-type signal, but a slight yet significant difference
to the tart-type signal remains. From the width of the Bragg reflection, a correlation length of about the
size of the particle (300 nm) is determined. This is an order of magnitude larger than those observed
experimentally. It must be stated that currently the polydispersity (.10%) of the nanoparticles of the
polyelectrolyte–surfactant complexes is too large to permit detailed information by small-angle X-ray
scattering to be obtained.
It is easier to detect the onion-type scattering experimentally when the particle sizes are smaller. In
these cases, the distance between the minima next to the Bragg peak (Fig. 3) increases. This is clearly
shown in Fig. 4. The influence of the polydispersity on the scattering curve is considerable. It seems to be
realistic to think that it is possible to detect onion-type structures experimentally if the number of double
layers is not greater than 20 and the polydispersity is lower than 5%.
2. Self-assembly and wetting
2.1. Complexes of polyelectrolytes and fluorinated surfactants (PEFAs)
The systematic preparation of low energy surfaces prepared by the self-assembly of PEFA complexes
0 20 40 60 80 000.31
0.32
0.33
0.34
0.35
s min
[nm
-1]
number of double layers1
Fig. 4. The positions of the two minima next to the first Bragg reflection. The particle parameters are d ¼ 3:00 nm; d1 ¼
1:80 nm; r1 ¼ 0:9; r2 ¼ 1:1 and D ¼ (number of layers)d. Reprinted with permission from Langmuir 2000;16:850 q
American Chemical Society [25].
A.F. Thunemann / Prog. Polym. Sci. 27 (2002) 1473–15721482

is potentially of high technological importance as well of fundamental scientific interest. There are a
variety of possible applications for these new materials as coatings. Due to their easy preparation, such
coatings are very promising, for example, as easy-to-clean surfaces such as thin protective coatings for
walls which are prone to contamination (graffiti), coatings for sport equipment (as a colloidal
substitution of ski wax) or as anti-soiling coatings for textiles. PEFA materials are the fluoro-containing
mirror image of non-fluorinated solid polyelectrolyte–surfactant complexes (PE-surfs), which have
been reviewed recently [9–11,152]. The various properties of PEFAs and non-fluorinated PE-surfs are
comparable to those of the classical polymers PTFE and polyethylene. A common property of PEFA and
PE-surfs is a pronounced tendency to form well-ordered liquid crystalline-like structures with a high
mechanical and thermal stability. The main difference is in their wetting behavior: PEFA form highly
oleophobic, while PE-surfs form oleophilic surfaces.
This section is divided in the following way: In Section 2.1.1, the general principle of the complex
formation is introduced. Sections 2.1.2 and 2.1.3 show the variability of lamellar nanostructures formed
when the surfactant and the charge density are varied. Coatings from nanoparticles of complexes are
presented in Section 2.1.4. This is followed by Section 2.1.5, which focus on the surface structure.
Columnar discotic complexes of PEFAs are the subjects of Section 2.1.6. A description of ultra-thin
films of a PEFA is given in Section 2.1.7, followed by Section 2.1.8 on the fine-tuning of the surface
energy by varying the length of the fluorinated groups. Diazosulfonate polymer complexes form the
content of Section 2.2. Then in Section 2.3 an investigation of polyelectrolyte–silicon–surfactant
complexes is given, and finally polysiloxane–fluorosurfactant complexes are dealt in Section 2.4.
2.1.1. Complex formation
Recently, the solid-state structures of PEFA materials, which are first presented in 1996 [12], have
become a focus of interest. The preparations of these complexes are carried out by common precipitation
from aqueous solution. As a result of a cooperative zipper mechanism between a polyelectrolyte and
oppositely charged surfactants, a 1:1 stoichiometry can be achieved [13–15].
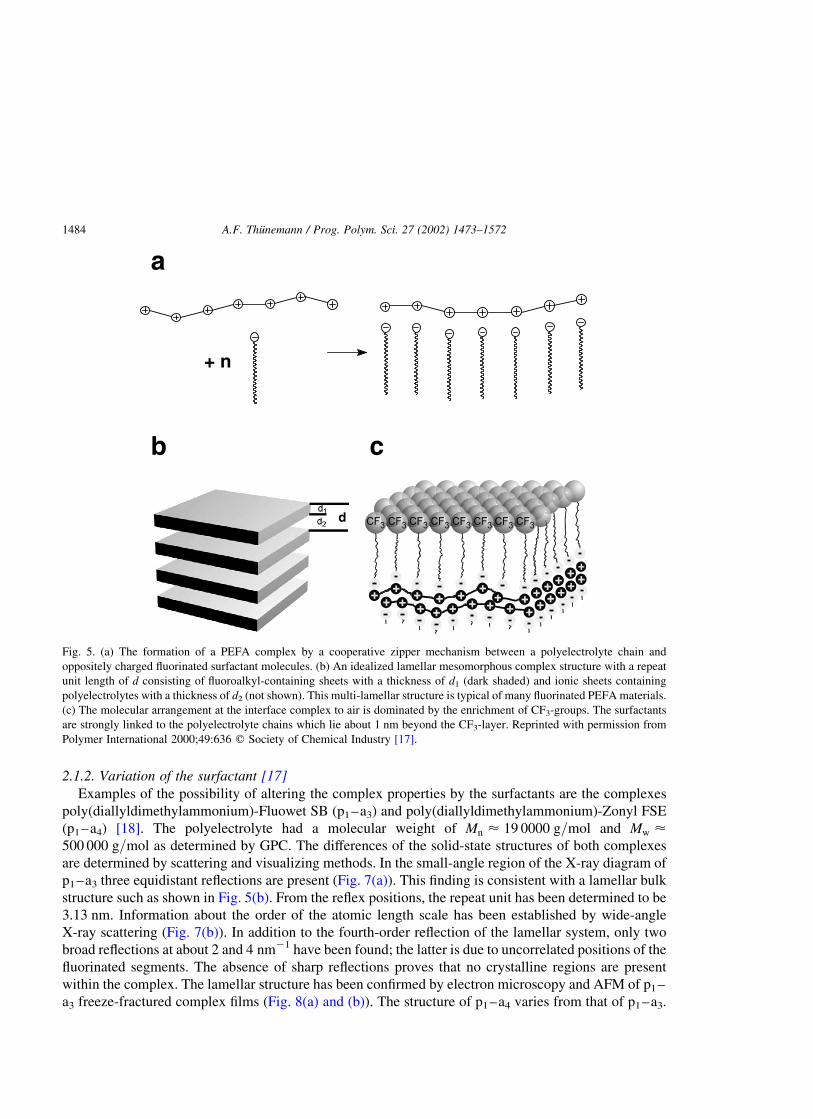
The complexation of a single chain is schematically shown in Fig. 5(a). It can be seen that two
building blocks are used normally to form a nanostructured polymeric material. The predominant phase
morphology of the bulk materials is the lamellar architecture which looks, in ideal cases, like the sketch
in Fig. 5(b). Fluorinated lamellar sheets (dark shaded) alternate with ionic sheets in a super-strongly
segregated arrangement similar to block copolymers in the super-strongly segregation regime [16]. The
molecular arrangement at the PEFA/air interface is characterized by an enrichment of CF3-groups,
which are responsible for the low surface energies of these types of complexes (Fig. 5(c)). In well-
aligned structures the first ionic layer lies parallel to the CF3-group layer at a distance of 1–2 nm from
the surface layer.
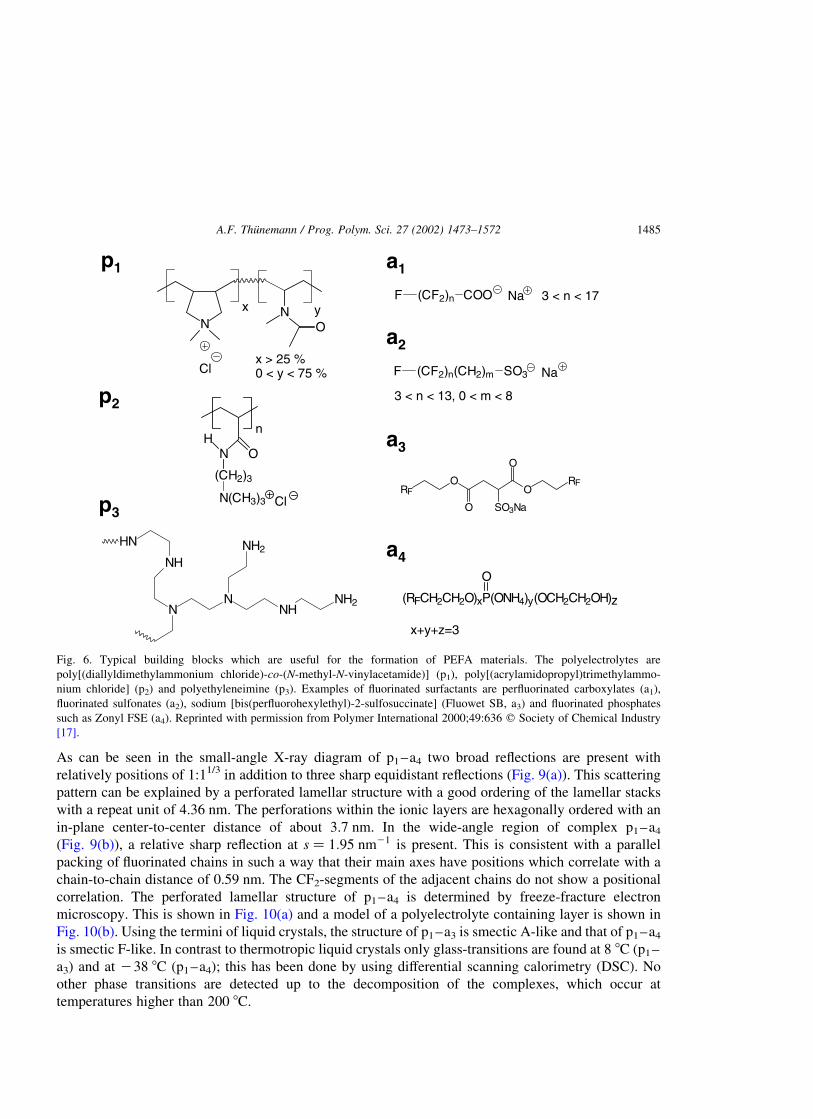
Typical building blocks which are useful for the formation of PEFA complexes are shown in Fig. 6
The polymers p, the first building blocks, are homopolymers and copolymers of diallyldimethylammo-
nium chloride such as poly[(diallyldimethylammonium chloride)-co-(N-methyl-N-vinylacetamide)] (p1)
or commercial polymers such as poly[(acrylamidopropyl)trimethylammonium chloride] (p2) and
polyethyleneimine (p3). Examples of fluorinated surfactants a, which compose the second building
blocks, are perfluorinated carboxylates (a1), fluorinated sulfonates (a2), sodium [bis(perfluorohex-
ylethyl)-2-sulfosuccinate] (Fluowet SB, a3) and fluorinated phosphates such as Zonyl FSE (a4). The
possibilities of modifying the solid-state structures and the surface properties by varying each of the
building blocks are manifold.
A.F. Thunemann / Prog. Polym. Sci. 27 (2002) 1473–1572 1483
2.1.2. Variation of the surfactant [17]
Examples of the possibility of altering the complex properties by the surfactants are the complexes
poly(diallyldimethylammonium)-Fluowet SB (p1–a3) and poly(diallyldimethylammonium)-Zonyl FSE
(p1–a4) [18]. The polyelectrolyte had a molecular weight of Mn < 19 0000 g=mol and Mw <500 000 g=mol as determined by GPC. The differences of the solid-state structures of both complexes
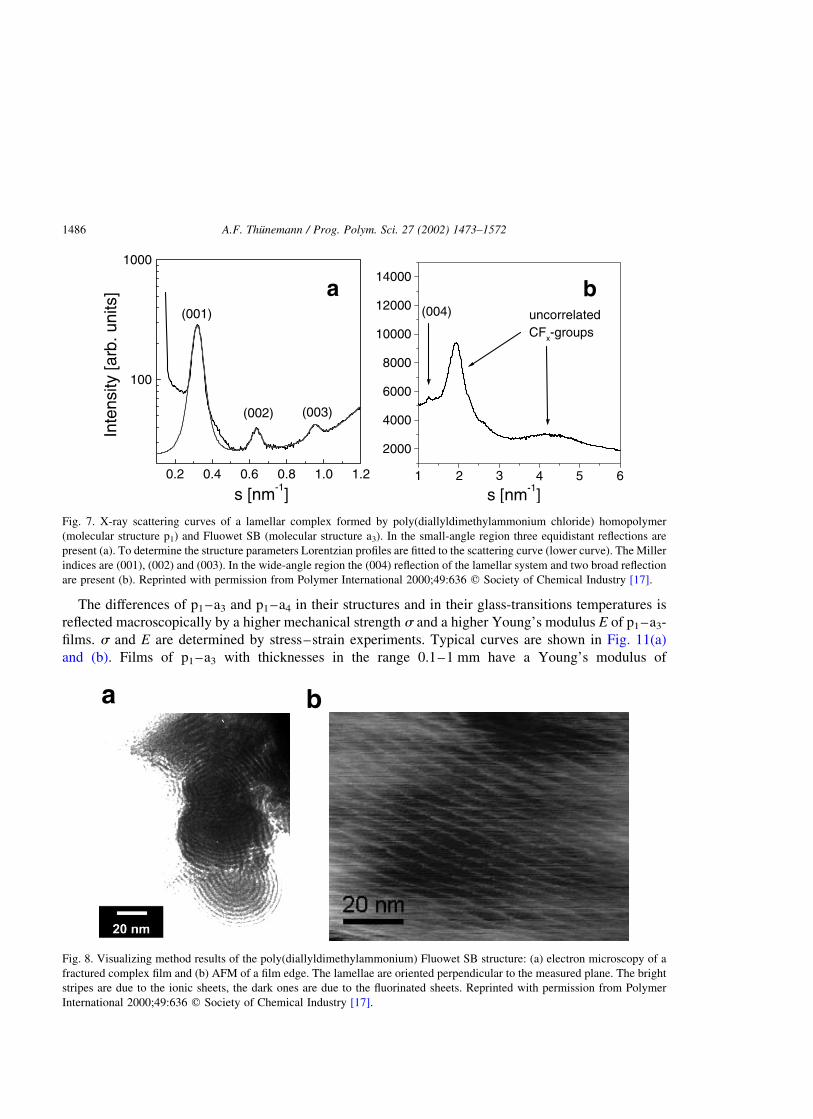
are determined by scattering and visualizing methods. In the small-angle region of the X-ray diagram of
p1–a3 three equidistant reflections are present (Fig. 7(a)). This finding is consistent with a lamellar bulk
structure such as shown in Fig. 5(b). From the reflex positions, the repeat unit has been determined to be
3.13 nm. Information about the order of the atomic length scale has been established by wide-angle
X-ray scattering (Fig. 7(b)). In addition to the fourth-order reflection of the lamellar system, only two
broad reflections at about 2 and 4 nm21 have been found; the latter is due to uncorrelated positions of the
fluorinated segments. The absence of sharp reflections proves that no crystalline regions are present
within the complex. The lamellar structure has been confirmed by electron microscopy and AFM of p1–
a3 freeze-fractured complex films (Fig. 8(a) and (b)). The structure of p1–a4 varies from that of p1–a3.
+ n
a
b c
d
Fig. 5. (a) The formation of a PEFA complex by a cooperative zipper mechanism between a polyelectrolyte chain and
oppositely charged fluorinated surfactant molecules. (b) An idealized lamellar mesomorphous complex structure with a repeat
unit length of d consisting of fluoroalkyl-containing sheets with a thickness of d1 (dark shaded) and ionic sheets containing
polyelectrolytes with a thickness of d2 (not shown). This multi-lamellar structure is typical of many fluorinated PEFA materials.
(c) The molecular arrangement at the interface complex to air is dominated by the enrichment of CF3-groups. The surfactants
are strongly linked to the polyelectrolyte chains which lie about 1 nm beyond the CF3-layer. Reprinted with permission from
Polymer International 2000;49:636 q Society of Chemical Industry [17].
A.F. Thunemann / Prog. Polym. Sci. 27 (2002) 1473–15721484
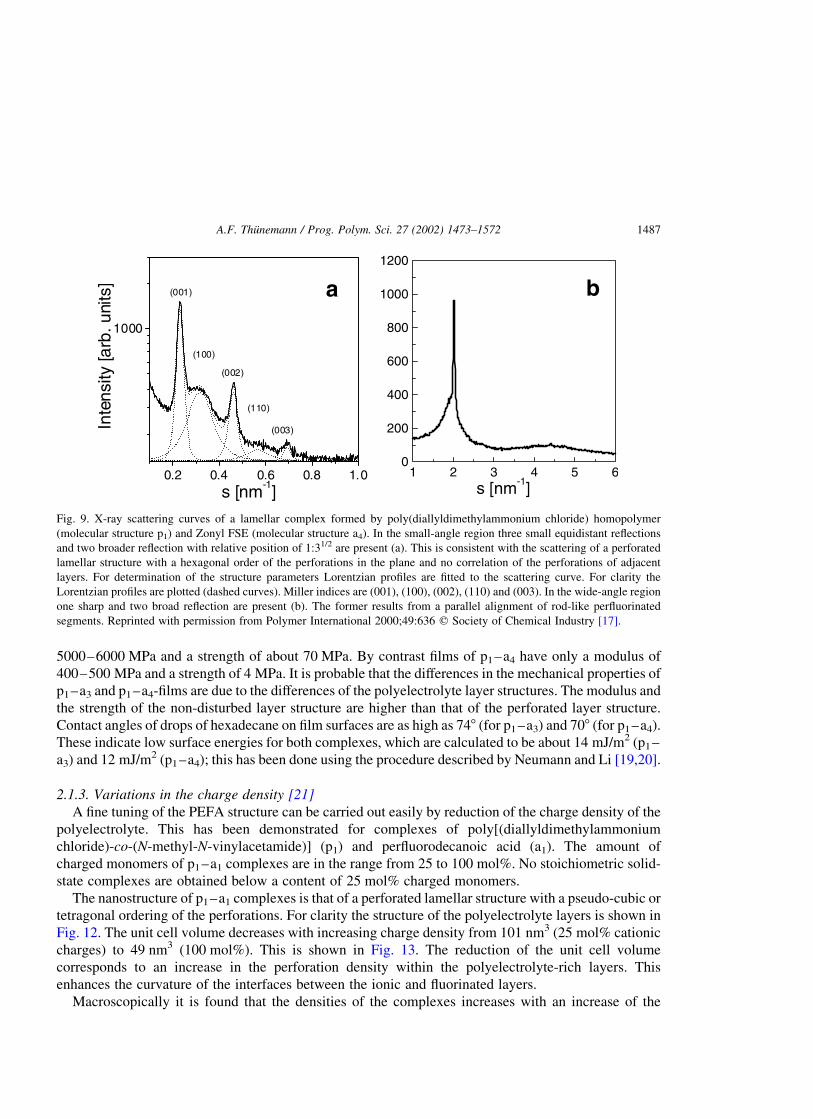
As can be seen in the small-angle X-ray diagram of p1–a4 two broad reflections are present with
relatively positions of 1:11/3 in addition to three sharp equidistant reflections (Fig. 9(a)). This scattering
pattern can be explained by a perforated lamellar structure with a good ordering of the lamellar stacks
with a repeat unit of 4.36 nm. The perforations within the ionic layers are hexagonally ordered with an
in-plane center-to-center distance of about 3.7 nm. In the wide-angle region of complex p1–a4
(Fig. 9(b)), a relative sharp reflection at s ¼ 1:95 nm21 is present. This is consistent with a parallel
packing of fluorinated chains in such a way that their main axes have positions which correlate with a
chain-to-chain distance of 0.59 nm. The CF2-segments of the adjacent chains do not show a positional
correlation. The perforated lamellar structure of p1–a4 is determined by freeze-fracture electron
microscopy. This is shown in Fig. 10(a) and a model of a polyelectrolyte containing layer is shown in
Fig. 10(b). Using the termini of liquid crystals, the structure of p1–a3 is smectic A-like and that of p1–a4
is smectic F-like. In contrast to thermotropic liquid crystals only glass-transitions are found at 8 8C (p1–
a3) and at 238 8C (p1–a4); this has been done by using differential scanning calorimetry (DSC). No
other phase transitions are detected up to the decomposition of the complexes, which occur at
temperatures higher than 200 8C.
p1 a1
N ONx y
Clx > 25 %0 < y < 75 %
O
O
O
O
SO3Na
RFRF
3 < n < 13, 0 < m < 8
F (CF2)n(CH2)m SO3 Na
a2
a3
(RFCH2CH2O)xP(ONH4)y
O
(OCH2CH2OH)z
a4
x+y+z=3
p2
Cl
(
n
N O
CH2)3
H
N(CH3)3p3
HN
NH
NN
NH2
NHNH2
F (CF2)n COO Na 3 < n < 17
Fig. 6. Typical building blocks which are useful for the formation of PEFA materials. The polyelectrolytes are
poly[(diallyldimethylammonium chloride)-co-(N-methyl-N-vinylacetamide)] (p1), poly[(acrylamidopropyl)trimethylammo-
nium chloride] (p2) and polyethyleneimine (p3). Examples of fluorinated surfactants are perfluorinated carboxylates (a1),
fluorinated sulfonates (a2), sodium [bis(perfluorohexylethyl)-2-sulfosuccinate] (Fluowet SB, a3) and fluorinated phosphates
such as Zonyl FSE (a4). Reprinted with permission from Polymer International 2000;49:636 q Society of Chemical Industry
[17].
A.F. Thunemann / Prog. Polym. Sci. 27 (2002) 1473–1572 1485
The differences of p1–a3 and p1–a4 in their structures and in their glass-transitions temperatures is
reflected macroscopically by a higher mechanical strength s and a higher Young’s modulus E of p1–a3-
films. s and E are determined by stress–strain experiments. Typical curves are shown in Fig. 11(a)
and (b). Films of p1–a3 with thicknesses in the range 0.1–1 mm have a Young’s modulus of
0.2 0.4 0.6 0.8 1.0 1.2
100
1000
(003)(002)
(001)
Inte
nsity
[arb
.uni
ts]
s [nm-1]
2000
4000
6000
8000
10000
12000
14000
uncorrelatedCFx-groups
(004)
s [nm-1]
a
1 2 3 4 5 6
b
Fig. 7. X-ray scattering curves of a lamellar complex formed by poly(diallyldimethylammonium chloride) homopolymer
(molecular structure p1) and Fluowet SB (molecular structure a3). In the small-angle region three equidistant reflections are
present (a). To determine the structure parameters Lorentzian profiles are fitted to the scattering curve (lower curve). The Miller
indices are (001), (002) and (003). In the wide-angle region the (004) reflection of the lamellar system and two broad reflection
are present (b). Reprinted with permission from Polymer International 2000;49:636 q Society of Chemical Industry [17].
a b
Fig. 8. Visualizing method results of the poly(diallyldimethylammonium) Fluowet SB structure: (a) electron microscopy of a
fractured complex film and (b) AFM of a film edge. The lamellae are oriented perpendicular to the measured plane. The bright
stripes are due to the ionic sheets, the dark ones are due to the fluorinated sheets. Reprinted with permission from Polymer
International 2000;49:636 q Society of Chemical Industry [17].
A.F. Thunemann / Prog. Polym. Sci. 27 (2002) 1473–15721486
5000–6000 MPa and a strength of about 70 MPa. By contrast films of p1–a4 have only a modulus of
400–500 MPa and a strength of 4 MPa. It is probable that the differences in the mechanical properties of
p1–a3 and p1–a4-films are due to the differences of the polyelectrolyte layer structures. The modulus and
the strength of the non-disturbed layer structure are higher than that of the perforated layer structure.
Contact angles of drops of hexadecane on film surfaces are as high as 748 (for p1–a3) and 708 (for p1–a4).
These indicate low surface energies for both complexes, which are calculated to be about 14 mJ/m2 (p1–
a3) and 12 mJ/m2 (p1–a4); this has been done using the procedure described by Neumann and Li [19,20].
2.1.3. Variations in the charge density [21]
A fine tuning of the PEFA structure can be carried out easily by reduction of the charge density of the
polyelectrolyte. This has been demonstrated for complexes of poly[(diallyldimethylammonium
chloride)-co-(N-methyl-N-vinylacetamide)] (p1) and perfluorodecanoic acid (a1). The amount of
charged monomers of p1–a1 complexes are in the range from 25 to 100 mol%. No stoichiometric solid-
state complexes are obtained below a content of 25 mol% charged monomers.
The nanostructure of p1–a1 complexes is that of a perforated lamellar structure with a pseudo-cubic or
tetragonal ordering of the perforations. For clarity the structure of the polyelectrolyte layers is shown in
Fig. 12. The unit cell volume decreases with increasing charge density from 101 nm3 (25 mol% cationic
charges) to 49 nm3 (100 mol%). This is shown in Fig. 13. The reduction of the unit cell volume
corresponds to an increase in the perforation density within the polyelectrolyte-rich layers. This
enhances the curvature of the interfaces between the ionic and fluorinated layers.
Macroscopically it is found that the densities of the complexes increases with an increase of the
1 2 3 4 5 60
200
400
600
800
1000
1200
s [nm-1]0.2 0.4 0.6 0.8 1.0
1000
(110)
(002)
(003)
(100)
(001)
Inte
nsity
[arb
.uni
ts]
s [nm-1]
a b
Fig. 9. X-ray scattering curves of a lamellar complex formed by poly(diallyldimethylammonium chloride) homopolymer
(molecular structure p1) and Zonyl FSE (molecular structure a4). In the small-angle region three small equidistant reflections
and two broader reflection with relative position of 1:31/2 are present (a). This is consistent with the scattering of a perforated
lamellar structure with a hexagonal order of the perforations in the plane and no correlation of the perforations of adjacent
layers. For determination of the structure parameters Lorentzian profiles are fitted to the scattering curve. For clarity the
Lorentzian profiles are plotted (dashed curves). Miller indices are (001), (100), (002), (110) and (003). In the wide-angle region
one sharp and two broad reflection are present (b). The former results from a parallel alignment of rod-like perfluorinated
segments. Reprinted with permission from Polymer International 2000;49:636 q Society of Chemical Industry [17].
A.F. Thunemann / Prog. Polym. Sci. 27 (2002) 1473–1572 1487

charge density from 1.44 g/cm3 (25 mol% cationic monomers) to 1.87 g/cm3 (100 mol%, Fig. 13). The
increase of the density in the solid state is accompanied by an increase of the molecular order. This has
been determined by wide-angle X-ray measurements. Only broad reflections are present in the wide-
angle X-ray scattering diagrams of p1–a1 complexes with 25, 47 and 65 mol% cationic monomers
(Fig. 14), indicating that there is no order on an atomic length scale. The degree of the molecular order of
a p1–a1 complex with a charge density of 87 mol% is similar to that of p1–a4, i.e. a parallel alignment of
b
a
Fig. 10. TEM picture of a perforated lamellar structure of a poly(diallyldimethylammonium)-Zonyl FSE complex (a). Some
perforations are indicated by arrows. The molecular structures of the building blocks are shown in Fig. 6 (p1 and a4). (b) Shows a
simulated model of one perforated polyelectrolyte layer. Reprinted with permission from Polymer International 2000;49:636 q
Society of Chemical Industry [17].
0 2 4 6 8 100
20
40
60
80
σ[M
Pa]
ε [ %]
0 2 4 6 8 100
1
2
3
4
5
6
7
8
σ[M
Pa]
ε [ %]
a b
Fig. 11. Stress–strain diagrams of complex films: (a) is poly(diallyldimethylammonium) Fluowet SB which has an E-modulus
of 5600 MPa, a glass transition at 301 K and a non-disturbed lamellar structure with a repeat unit of 3.22 nm. (b) is
poly(diallyldimethylammonium) Zonyl FSE which has an E-modulus of 400 MPa, a glass transition at 236 K and a hexagonal
perforated lamellar structure with a repeat unit of 4.38 nm. Reprinted with permission from Polymer International 2000;49:636
q Society of Chemical Industry [17].
A.F. Thunemann / Prog. Polym. Sci. 27 (2002) 1473–15721488

fluorinated chains. A typical pattern of a side-chain crystalline-like ordered structure is found for p1–a1
with 100 mol% cationic groups, which crystallize from solution as sharp elongated needles. The wetting
behavior of all p1–a1 complex films, even with different charge densities, is very similar. The contact
angles of hexadecane are between 71 and 798.
Fig. 12. A model of the tetragonal perforated lamellar layer structure of poly[(diallyldimethylammonium)-co-(N-methyl-N-
vinylacetamide)] perfluorodecanoate. Within this structure, the polyelectrolyte phase is plotted in gray. The surfactant
molecules fill the interlayer space. Reprinted with permission from Langmuir 1998;14:4901 q American Chemical
Society[21].
20 40 60 80 1000
20
40
60
80
100
120
unit
cell
volu
me
[nm
3 ]
contentDADMAC
[ mol-%]
1.3
1.4
1.5
1.6
1.7
1.8
1.9
density[g
cm-3]
Fig. 13. The unit cell volume of the tetragonal supramolecular structure of poly[(diallyldimethylammonium)-co-(N-methyl-N-
vinylacetamide)] perfluorodecanoate complexes (triangles) and the density (circles) of the complexes depending on the content
of diallyldimethylammonium groups. The diallyldimethylammonium content is given in mol% of the copolymer composition.
Reprinted with permission from Langmuir 1998;14:4902 q American Chemical Society[21].
A.F. Thunemann / Prog. Polym. Sci. 27 (2002) 1473–1572 1489

2.1.4. Coatings from nanodispersions of PEFAs [22]
Films of PEFAs are regularly prepared by the solvent cast procedure form organic solutions. The best
solvents for these complexes are fluorinated. For scientific purposes this situation is acceptable,
however, not for the development of commercially viable PEFA products. Only materials that combine
low cost and ecologically friendly synthesis have a chance of coming into everyday use. Here, it is
important to avoid organic solvents. In order to do this, waterborne nanodispersions of PEFA complex
coatings have been developed. One example is the complex of polyethyleneimine (p3), a branched
water-soluble polymer that is widely used in the paper industry [23], and Fluowet SB (a3), which is
frequently used as a spreading agent [24].
Complex dispersions of p3–a3, which are stabilized by an excess of a3, consist of particles with
diameters of about 200 nm. These complex dispersions are freeze-dried and redispersed in water. An
interesting characteristic of the nanoparticles is their internal lamellar structure. The X-ray scattering
diagrams of a solvent cast film and a complex dispersion are shown in Fig. 15(a) and (b). In the small-
angle region, two reflections are found; these correspond to a first- and third-order reflection of a lamellar
smectic A-like mesophase. The reflex positions show the long period to be d ¼ 3:6 nm for the powder
complex, and 3.8 nm for the complex nanodispersion. The absence of second-order reflections indicates
a symmetrical lamellar two-phase system that consists of two types of alternating layers. One layer is
strongly enriched with perfluorinated alkyl chains while the second layer is enriched with
polyelectrolyte chains and ionic head groups. The thickness of each is about 1.8 nm for the powder
complex and 1.9 nm for the nanodispersion complex. The slightly larger long period found for the
nanodispersion complex particles compared to that of the powder complex is explained by the less
densely packed structure of the latter, which is caused by the boundary effects of small particles
(curvature). The scattering behavior of lamellar particles of finite-size has been described in detail [25].
Only an amorphous halo at about 2 nm21 is found in the wide-angle region (Fig. 15), thus proving the
1 2 3 4 5 60
1000
2000
(65)
(47)
(25)Inte
nsity
[arb
.uni
ts]
s [nm-1]
10
1000
2000
3000
4000
(100)
(87)
s [nm-1]2 3 4 5 6
Fig. 14. Wide-angle X-ray scattering diagrams of poly[(diallyldimethylammonium)-co-(N-methyl-N-vinylacetamide)]
perfluorodecanoate complexes. The content of cationic monomers is given in brackets. The molecular order increases
successively with increasing charge density from amorphous (25% cationic monomers) to highly crystalline (100% cationic
monomers). Reprinted with permission from Langmuir 1998;14:4902 q American Chemical Society[21].
A.F. Thunemann / Prog. Polym. Sci. 27 (2002) 1473–15721490
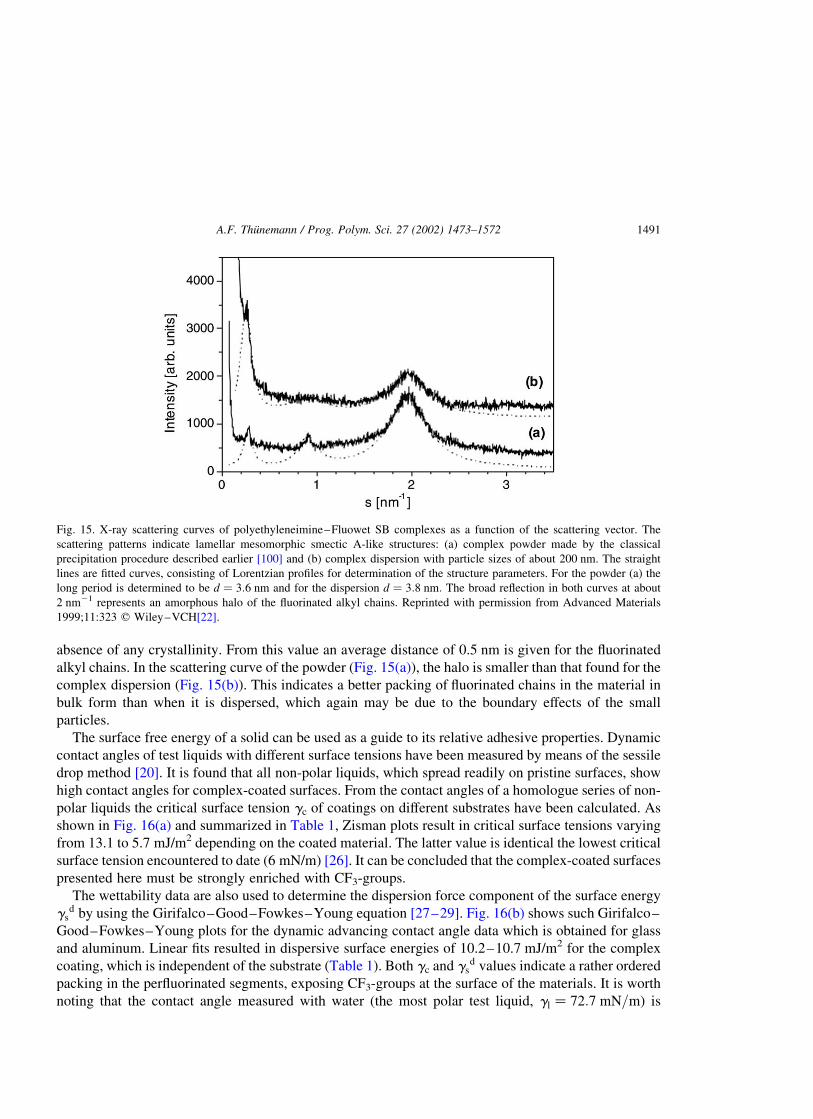
absence of any crystallinity. From this value an average distance of 0.5 nm is given for the fluorinated
alkyl chains. In the scattering curve of the powder (Fig. 15(a)), the halo is smaller than that found for the
complex dispersion (Fig. 15(b)). This indicates a better packing of fluorinated chains in the material in
bulk form than when it is dispersed, which again may be due to the boundary effects of the small
particles.
The surface free energy of a solid can be used as a guide to its relative adhesive properties. Dynamic
contact angles of test liquids with different surface tensions have been measured by means of the sessile
drop method [20]. It is found that all non-polar liquids, which spread readily on pristine surfaces, show
high contact angles for complex-coated surfaces. From the contact angles of a homologue series of non-
polar liquids the critical surface tension gc of coatings on different substrates have been calculated. As
shown in Fig. 16(a) and summarized in Table 1, Zisman plots result in critical surface tensions varying
from 13.1 to 5.7 mJ/m2 depending on the coated material. The latter value is identical the lowest critical
surface tension encountered to date (6 mN/m) [26]. It can be concluded that the complex-coated surfaces
presented here must be strongly enriched with CF3-groups.
The wettability data are also used to determine the dispersion force component of the surface energy
gsd by using the Girifalco–Good–Fowkes–Young equation [27–29]. Fig. 16(b) shows such Girifalco–
Good–Fowkes–Young plots for the dynamic advancing contact angle data which is obtained for glass
and aluminum. Linear fits resulted in dispersive surface energies of 10.2–10.7 mJ/m2 for the complex
coating, which is independent of the substrate (Table 1). Both gc and gsd values indicate a rather ordered
packing in the perfluorinated segments, exposing CF3-groups at the surface of the materials. It is worth
noting that the contact angle measured with water (the most polar test liquid, gl ¼ 72:7 mN=mÞ is
Fig. 15. X-ray scattering curves of polyethyleneimine–Fluowet SB complexes as a function of the scattering vector. The
scattering patterns indicate lamellar mesomorphic smectic A-like structures: (a) complex powder made by the classical
precipitation procedure described earlier [100] and (b) complex dispersion with particle sizes of about 200 nm. The straight
lines are fitted curves, consisting of Lorentzian profiles for determination of the structure parameters. For the powder (a) the
long period is determined to be d ¼ 3:6 nm and for the dispersion d ¼ 3:8 nm: The broad reflection in both curves at about
2 nm21 represents an amorphous halo of the fluorinated alkyl chains. Reprinted with permission from Advanced Materials
1999;11:323 q Wiley–VCH[22].
A.F. Thunemann / Prog. Polym. Sci. 27 (2002) 1473–1572 1491

smaller than that of methylene iodide ðgl ¼ 50:0 mN=mÞ and that it depends strongly on the coated
surface (i.e. u is higher for a sprayed car bodywork than for a glass slide). This is clear evidence of the
surface reconstruction of the complex surface when it is in contact with water. Such reconstruction
phenomena are widespread in polymer coatings, e.g. those observed in self-organizing semifluorinated
side-chain ionenes [30] and even polymers containing only a few polar groups like Teflon–PFA show
surface reconstruction when they are in contact with water [31].
5 10 15 20 25 300.0
0.2
0.4
0.6
0.8
1.0
cos
θ
γl [mN/m]
5 10 15 20 25 30
0.00 0.05 0.10 0.15 0.20 0.25 0.30
-1.00
-0.75
-0.50
-0.25
0.00
0.25
0.50
0.75
1.00
cos
θ
γl
-1/2
a b
Fig. 16. Surface energy determination of complex coated surfaces. (a) Zisman plots for different polyethyleneimine–Fluowet
SB coated surfaces. The points are obtained with (1) hexane, gl ¼ 18:4 mN=m; (2) PDMS, gl ¼ 18:7 mN=m; (3) octane,
gl ¼ 21:8 mN=m; (4) decane, gl ¼ 23:9 mN=m;(5) dodecane, gl ¼ 25:4 mN=m; (6) hexadecane, gl ¼ 27:6 mN=m; the critical
surface tensions are 5.7 mJ/m2 (glass, squares), 6.6 mJ/m2 (airplane wing, circles), 8.6 mJ/m2 (aluminum, diamonds),
13.1 mJ/m2 (painted car bodywork, triangles). Advancing contact angles are used for cos u. (b) Girifalco–Good–Fowkes–
Young plots for the determination of the dispersive surface energy of the PEI–Fluowet SB coated surfaces. From left to right
points are values obtained with (1) methylene iodide, gl ¼ 50:0 mN=m; (2) a-bromonaphthalene, gl ¼ 44:0 mN=m; (3)
hexadecane, gl ¼ 27:6 mN=m; (4) dodecane, gl ¼ 25:4 mN=m; (5) decane, gl ¼ 23:9 mN=m; (6) octane, gl ¼ 21:8 mN=m; (7)
PDMS gl ¼ 18:7 mN=m; (8) hexane gl ¼ 18:4 mN=m; From the slope both values of gsd are calculated to be 10.3 mJ/m2
(glass, squares) and 10.7 mJ/m2 (aluminum, diamonds). Reprinted with permission from Advanced Materials 1999;11:322 q
Wiley–VCH [22].
Table 1
Zisman critical surface energies gc and the dispersive surface energies gsd according to the Girifalco–Fowkes–Young equation
for thin complex films on different substrates
Substrate gc (mJ/m2) gsd (mJ/m2)
Glass 5.7 ^ 1.7 10.3 ^ 0.2
‘VW’ sheet 13.1 ^ 1.2 10.2 ^ 0.6
‘Lufthansa’ sheet 6.6 ^ 1.4 10.3 ^ 0.4
Aluminum 8.6 ^ 2.1 10.7 ^ 0.3
Reprinted with permission from Adv Mater 1999;11:322 q Wiley–VCH [22].
A.F. Thunemann / Prog. Polym. Sci. 27 (2002) 1473–15721492

2.1.5. Surface structure [32]
A detailed investigation of the surface structure and the solid-state properties of poly[(acrylamido-
propyl)trimethylammonium chloride] (p2) and Fluowet SB (a3) complex (p2–a3) has been presented
[32]. Surfaces from complex p2–a3 show Zisman critical surface energies of 6.9 ^ 0.8 mJ/m2 on
complex coated aluminum surfaces and 4.6 ^ 1.4 mJ/m2 on complex coated glass slides. The dispersive
surface energies according to the Girifalco–Fowkes–Young equation are 8.1 ^ 0.4 and 9.3 ^ 0.5 mJ/
m2, respectively. The complex p2–a3 shows a fast but reversible reorganization when in contact with
water, which results in enhanced surface energies of about 34 mJ/m2 on aluminum as well as on glass
substrates.
This surface reconstruction when in contact with water seems to be very fast, as shown by the constant
contact angle of water, which adjusts to an equilibrium within some seconds. The reason for this is found
at the nanometer level. Visualization of surfaces of complex p2–a3 films is achieved by AFM. The film
surface is smooth, even at the micrometer level, whereas it appears structured at a nanometer level
(Fig. 17 inset). This structuring consists of elevations and depressions with the distances between
elevations ranging from 100 to 300 nm, resulting in a pattern resembling a leopard’s fur. Remarkably the
elevations have a very uniform height of about 3.4 nm (Fig. 17).
An important question is whether this surface structuring modifies the surface properties. Indeed, it is
well known that contact angles are influenced by surface roughness. However, the length scale and
roughness morphology observed for complex p2–a3 surfaces cannot be compared to a Lotus-like [33,34]
or a fractal surface [35]. As far as is known the high values of advancing and static contact angles are not
due to the roughness of the surfaces. Nevertheless, this roughness may explain the relatively low
receding angles, which are sensitive to physical as well as chemical heterogeneities. The uniform
0 1 2-3-2-1012345678
d
d
Hei
ght[
nm]
Length [µm]3
Fig. 17. A typical AFM depth profile of a poly[(acrylamidopropyl)trimethylammonium] Fluowet SB complex surface. A
uniform height of about 3.4 nm was measured for the elevations, which is originated by a bilayer structure. It can be seen in the
right hand figure that sometimes a second elevation on the first elevation can be found, as would be expected from a bilayer on a
bilayer. The inset shows a 2 £ 2 mm AFM image of the surface (the scale bar is 10 nm). Reprinted with permission from
Langmuir 1999;15:4870 q American Chemical Society [32].
A.F. Thunemann / Prog. Polym. Sci. 27 (2002) 1473–1572 1493

elevation height of 3.4 nm can be explained by the presence of large islands (100–300 nm) of lamellar
complex sheets in a head-to-head double-layer arrangement. Within such islands, the sulfonate head
groups are separated by cationic polyelectrolyte chains. However, the edges of the islands are
energetically very unfavorable, allowing highly polar solvent molecules to penetrate into the
polyelectrolyte-rich region. Consequently, when in contact with water, a fast surface reorganization
occurs resulting in a much higher-energy surface (34.2 mJ/m2) than observed for non-polar liquids. This
indicates that the thermodynamic equilibrium state of the complex/liquid interface depends on the
polarity of the liquid, and that water induces a kinetically favored enrichment of polar groups at the edge
of the complex islands.
2.1.6. Hexagonal columnar discotic structures [36]
Perfluorodecanoic acid is a hydrophobic fluorinated surfactant which forms disk-like micelles in
diluted aqueous solution [37]. It is shown in Section 2.1.3 that the complexation of poly[(diallyldi-
methylammonium chloride)-co-(N-methyl-N-vinylacetamide)] with perfluorodecanoic acid results in
perforated lamellar complexes with an increasing density of perforations per unit area and an increasing
degree of side-chain crystallinity when the charge density of the polymer is increased. The question in
this section is whether the charge density influences the structure of the complexes even when the length
of the fluorinated moiety is as large as 17. For clarity a representation of the complex formation is given
in Fig. 18.
In order to investigate the influence of the charge density on the structure five polymer complexes,
varying in the amount of diallyldimethylammonium units, i.e. 25, 47, 65, 83 and 100 mol%, are prepared
(P1a–C18 to P1e–C18). These salt-free binary systems with 1:1 stoichiometry present, similar to
x y(a) 25 75(b) 47 53(c) 65 35(d) 83 17(e) 100 0
O OC
CF2)16
CF3
Cl
P1
C18
P1-C18
- NaCl
solution solid
Na
complexation
CO
O(CF2)16CF3
(
N ONx y
yxN O
N
Fig. 18. Complex formation: (P1a–P1e) poly[(diallyldimethylammonium chloride)-co-(N-methyl-N-vinylacetamide)s]; (C18)
perfluorooctadecanoic acid; (P1a–C18 to P1e–C18) stoichiometric polyelectrolyte–surfactant complexes. Reprinted with
permission from Langmuir 1999;15:6724 q American Chemical Society [36].
A.F. Thunemann / Prog. Polym. Sci. 27 (2002) 1473–15721494

diblock copolymers, the simplest case for studying various aspects of microphase transition of
fluorinated long-chain surfactants [36].
2.1.6.1. Wetting. Surface energies of the complexes are determined by n-alkane wettability
measurements. The preparation of complex surfaces is carried out by pressing discs from powder, as
described for the preparation of Teflon FEP [19]. However, the procedure is modified by restricting the
temperature to not more than 30 8C. The wettability of the complex surfaces with a series of n-alkanes is
then determined by dynamic contact angle measurements (Table 2). For comparison of the contact angle
data, the solid surface energies are calculated using the equation of Neumann and Li [19]. Within the
series the maximum value is found for complex P1a–C18 to be 13–14 mN/m.
A minimum surface energy is found for complex P1e–C18, which is between 9 and 10 mN/m
(Table 2). Obviously, the surface energy of the complexes decreases with the increasing charge density
of the polyelectrolyte, which is accompanied by an increasing amount of perfluorooctadecanoate. For
determination of the dispersive component, the wetting relation according to the Girifalco–Good–
Fowkes–Young equation [27–29] is found to be suitable. The resulting values for the dispersive surface
energies are summarized in Table 2. A comparison of gs with gsd shows that the gs-values are, at most,
1–3 mN/m higher than the gsd-values. From this it can be concluded that the polymer–liquid interaction
is to a large extent dispersive. For the complexes P1a–C18 to P1e–C18, the maximum distance of the
Table 2
The solid surface energies of complexes P1a–C18 to P1e–C18 shown in Fig. 18
Complex Test liquid uadv (8) ust (8) urec (8) gs (mN/m) gsd (mN/m)
P1a–C18 Decane 61 60 54 13.3
Dodecane 65 65 55 13.3 13.0
Hexadecane 67 67 52 14.1
Decane 62 60 49 13.0
P1b–C18 Dodecane 68 68 51 12.5 12.4
Hexadecane 70 69 52 13.2
P1c–C18 Decane 65 64 44 12.2
Dodecane 70 69 50 12.0 11.7
Hexadecane 72 72 49 12.6
P1d–C18 Decane 72 70 53 10.5
Dodecane 75 74 55 10.6 9.9
Hexadecane 80 80 48 10.3
P1e–C18 Decane 76 74 50 9.5
Dodecane 78 77 54 9.9 9.1
Hexadecane 82 81 55 9.8
The surface energies gs are calculated using the equation of Neumann and Li [19]. Surface tensions of test liquids used for
calculations are 23.43 mN/m (decane), 25.44 mN/m (dodecane) and 27.76 mN/m (hexadecane). gsd is the dispersion force
component of the surface energy extrapolated according to the Girifalco–Good–Fowkes–Young equation [27–29] using
advancing contact angles. uadv, ust, urec are advancing, static and receding angles. Reprinted with permission from Langmuir
1999;15:6724 q American Chemical Society [36].
A.F. Thunemann / Prog. Polym. Sci. 27 (2002) 1473–1572 1495
carboxylate groups and the polyelectrolyte chains to the surface is about 2 nm. This is large enough to
suppress the polar components of the surface energy [38].
From the very low surface energies, consisting predominantly of dispersive forces, it can be
concluded that these low surface energies indicate rather ordered packing of the perfluoroalkyl
segments, exposing CF3-groups at the surface of the complexes. Further, it can be concluded that the
surface packing density of CF3-groups increases with the increasing charge density of the
polyelectrolyte. This is in contrast to complexes with short-chain perfluorinated acids, which do not
show a dependence of the surface energy on the charge density (Section 2.1.3).
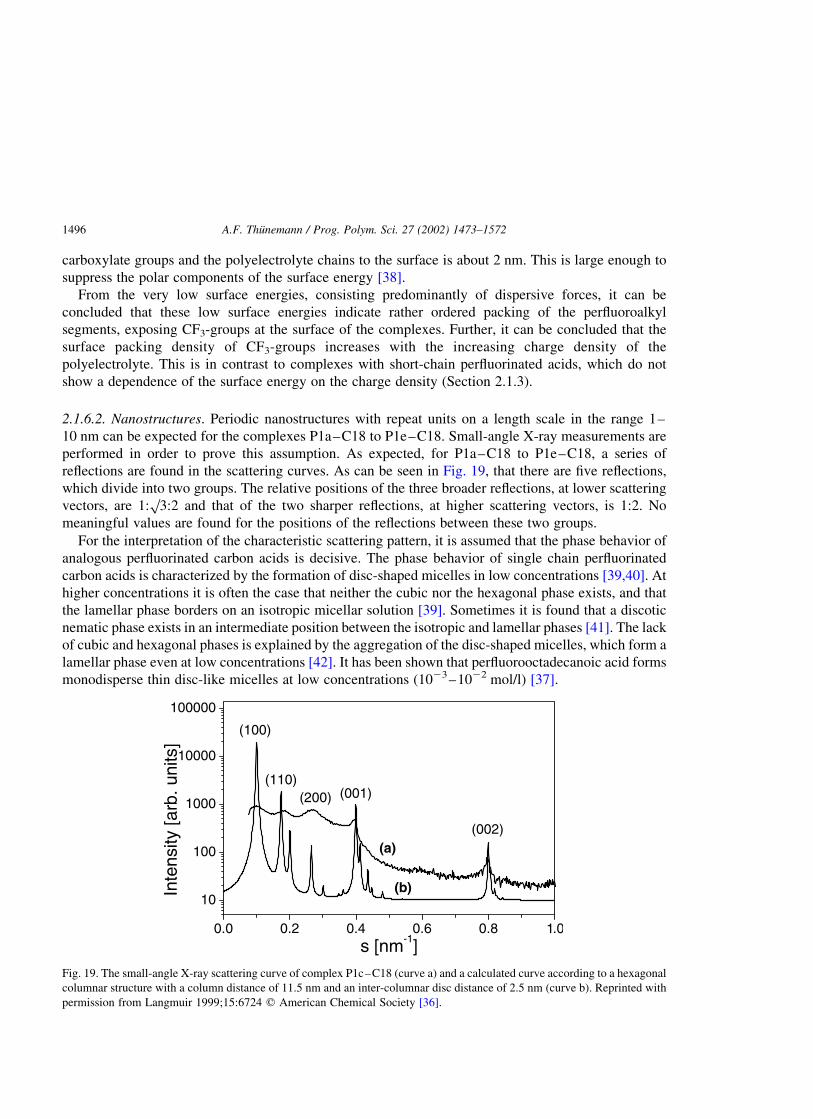
2.1.6.2. Nanostructures. Periodic nanostructures with repeat units on a length scale in the range 1–
10 nm can be expected for the complexes P1a–C18 to P1e–C18. Small-angle X-ray measurements are
performed in order to prove this assumption. As expected, for P1a–C18 to P1e–C18, a series of
reflections are found in the scattering curves. As can be seen in Fig. 19, that there are five reflections,
which divide into two groups. The relative positions of the three broader reflections, at lower scattering
vectors, are 1:p
3:2 and that of the two sharper reflections, at higher scattering vectors, is 1:2. No
meaningful values are found for the positions of the reflections between these two groups.
For the interpretation of the characteristic scattering pattern, it is assumed that the phase behavior of
analogous perfluorinated carbon acids is decisive. The phase behavior of single chain perfluorinated
carbon acids is characterized by the formation of disc-shaped micelles in low concentrations [39,40]. At
higher concentrations it is often the case that neither the cubic nor the hexagonal phase exists, and that
the lamellar phase borders on an isotropic micellar solution [39]. Sometimes it is found that a discotic
nematic phase exists in an intermediate position between the isotropic and lamellar phases [41]. The lack
of cubic and hexagonal phases is explained by the aggregation of the disc-shaped micelles, which form a
lamellar phase even at low concentrations [42]. It has been shown that perfluorooctadecanoic acid forms
monodisperse thin disc-like micelles at low concentrations (1023–1022 mol/l) [37].
0.0 0.2 0.4 0.6 0.8 .0
10
100
1000
10000
100000
(b)
(a)
(001)(200)
(002)
(110)
(100)
Inte
nsity
[arb
.uni
ts]
s [nm-1]1
Fig. 19. The small-angle X-ray scattering curve of complex P1c–C18 (curve a) and a calculated curve according to a hexagonal
columnar structure with a column distance of 11.5 nm and an inter-columnar disc distance of 2.5 nm (curve b). Reprinted with
permission from Langmuir 1999;15:6724 q American Chemical Society [36].
A.F. Thunemann / Prog. Polym. Sci. 27 (2002) 1473–15721496

The complex preparations are performed at a temperature at which monodisperse micelles are
present. Therefore, the complex formation may be explained by the following simple mechanism. At
first, the micelles agglomerate into columns which are packed into a two-dimensional hexagonal lattice
in a second step. In this model the polyelectrolyte chains act as a kind of glue which prevents the
merging of micelles forming extended lamellar sheets. The repulsive Coulomb forces between
negatively charged micelles are replaced by attractive forces. Probably the very long fluorinated C17
alkyl chains cause slow exchange dynamics between the micelles and the soluted molecules. Therefore,
the micelles may be stable while the complexation proceeds. Further, the critical micelle concentration
of about 8 £ 1025 mol/l is extremely low [37], from which it can be concluded that the complexation of
single molecules [13] cannot be a relevant competitive process. Analytical scattering curves of
hexagonally packed discotic columns are calculated and compared with the measured scattering curves.
An example is shown in Fig. 19. It can be seen that reflex positions and approximated intensities are
reproduced in this simple model. From the position of the 001 and 002 reflections, an intra-columnar
distance of about 2.5 nm is calculated which is independent of the charge density of the polyelectrolyte.
The positions of the 100, 110 and 200 reflections give the distances of the column centers which
decreases slightly from 12.0 nm (complex P1a–C18) to 10.0 nm (P1e–C18).
The lengths of the perfluorooctadecanoate chains in an all-trans conformation are calculated to be
about 2.45 nm [37]. This is nearly the same as the intra-columnar disc distance. An interdigitated
arrangement of the fluorinated chains within the discs is consistent with this length and the known
stiffness of perfluorinated alkyl chains [39]. Further, the surface of each disc is enriched with carboxylate
head groups. A model of the hexagonal columnar discotic structure is hown in Fig. 20.
2.1.6.3. Side-chain order. In Section 2.1.3 it is shown that the ordering of fluorinated chains in solid
polyelectrolyte–fluorosurfactant complexes may be tuned between liquid-like and crystalline structures
by the charge density of the polyelectrolyte. In the wide-angle diagram of the complexes P1a–C18 to
P1e–C18, two broad reflections with maxima at 1.8 and 4.2 nm21 are found, superimposed by an intense
Fig. 20. A model of the hexagonal columnar discotic structure. The column center distance decreases slightly from 12.0 to
10.0 nm with the increasing charge density of the polyelectrolyte (P1a–C18 to P1e–C18), while the intra-columnar distance
remains constant (2.5 nm). The polyelectrolyte (not shown) fills the space between the discs. Reprinted with permission from
Langmuir 1999;15:6724 q American Chemical Society [36].
A.F. Thunemann / Prog. Polym. Sci. 27 (2002) 1473–1572 1497

sharp reflection at 2.03 nm21 and two weak reflections at 3.53 and 4.08 nm21 (Fig. 21(c)). The relative
positions of the latter are 1:p
3:2. This is indicative of a partially hexagonal arrangement of the
long-chain perfluorinated moieties. A comparison of the scattering curves of the complexes P1a–C18 to
P1e–C18 with that of pure perfluorooctadecanoic acid (Fig. 21(b)) and polytetrafluoroethylene
(Fig. 21(a)) reveal a very similar shape. In particular the reflex positions are found to be almost identical.
From this it is concluded that a kind of side-chain crystallinity is present in the complexes, which
crystallizes in a lattice in a very similar way to that described for polytetrafluoroethylene in the
hexagonal IV phase, and with the same lateral chain-to-chain order. The chain-to-chain distance is
therefore 0.57 nm. In contrast to the hexagonal IV phase, the lower number of reflections and the
increased width of the reflections are explained by the lack of a periodic arrangement in the direction of
the chains, as well as a smaller domain size. The domain size relevant for the wide-angle scattering is
that of a crystallite of polytetrafluoroethylene. For the complexes, the domain size is limited to that of the
discs. The structure shown in Fig. 20 may result from a fast crystallization of the perfluorinated moieties.
Therefore, on the basis of the current data, non-equilibrium structures cannot be ruled out.
2.1.7. Ultra-thin films [43]
This section reports on the nanostructure and the physical properties of a complex (PEI–FSA), which
are formed by PEI (Section 2.1.4) and a partially fluorinated carboxylic acid, FSA. The complexation is
shown schematically in Fig. 22. The lithium salt of FSA is used as an active spreading agent. A
comparison of the IR spectra of FSA and PEI–FSA shows that the carboxylic acid vibrations found for
FSA at 1690 cm21 (CyO stretch, dimer) and at 1300 cm21 (C–O stretch, dimer) are absent in the
spectrum of PEI–FSA (Fig. 23). From this it can be concluded that the complex has a 1:1 stoichiometry.
2.1.7.1. Thermal properties. The thermal properties of the surfactant FSA and the complex PEI–FSA
have been investigated by using DSC and TGA. The second heating DSC traces are shown in Fig. 24. A
sharp endothermic peak at 45 8C is present for FSA and a peak at 180 8C for PEI–FSA. These peaks are
1 2 3 4 5
10
100
1000 a
Inte
nsity
[arb
.uni
ts]
s [nm-1]1 2 3 4 5
b
1 2 3 4 5 6
c
Fig. 21. Wide-angle X-ray diagrams of polytetrafluoroethylene in the hexagonal IV phase (curve a), perfluorooctadecanoic acid
(curve b) and complex P1c–C18 (curve c). Reprinted with permission from Langmuir 1999;15:6724 q American Chemical
Society [36].
A.F. Thunemann / Prog. Polym. Sci. 27 (2002) 1473–15721498

attributed to the melting transitions of the compounds. Below these temperatures the morphology of the
compounds are constant. The considerable rise of 135 8C in the melting point of the complexed
surfactant PEI–FSA compared to that of the non-complexed compound FSA is surprising and must be
considered as a consequence of the stabilizing effect of the complexation. It is known that
polyethyleneimine possesses good thermal stability compared to other polyelectrolytes and that no
substantial decomposition in air occurs below 300 8C [44]. Therefore, it is suggested that its complexes
with fluorinated surfactants are also thermally stable. This has been proved by TGA. It is found that the
decomposition of the complex starts at temperatures above 280 8C, followed by a rapid decrease of about
NH CH2 CH2n
PEI
FSA
nNH CH2 CH2
H
aqu solid
PEI-FSA
+ HCl
- LiCl
O O
CH2)2
S
CH2)2
CF2)7
CF3
(CF2)7F3C (CH2)2 S (CH2)2 CO
OLi
(
(
(
Fig. 22. Complex formation: (PEI) polyethyleneimine; (FSA) 3-[(1H,1H,2H,2H-fluorooctyl)thio] propionic acid; (PEI–FSA)
stoichiometric polyelectrolyte–surfactant complex. Reprinted with permission from Langmuir 2000;16:8562 q American
Chemical Society [43].
2000 1800 1600 1400 1200 10000
20
40
60
80
100(b)
1300
1690
(a)
Tra
nsm
issi
on[%
]
Wavelength [ cm-1]
1800 1700 1600
Fig. 23. FTIR-spectrum of the surfactant FSA (curve a) and that of its complex PEI–FSA with polyethyleneimine PEI (curve b).
For the structures of the compounds see Fig. 22. In the spectrum of the surfactant an intense carboxylic acid band at a wave
number of 1690 cm21 is found. This results from the CyO stretch vibration. Reprinted with permission from Langmuir
2000;16:8562 q American Chemical Society [43].
A.F. Thunemann / Prog. Polym. Sci. 27 (2002) 1473–1572 1499

80% of the total mass up to 350 8C. Therefore, it is concluded that the thermal stability of the complex is
not much lower than that of PEI.
2.1.7.2. Wetting. Complex surfaces are prepared by spin-casting a 0.1% (w/w) complex solution onto
silicon wafers. Dynamic contact angles of the test liquids with different surface tensions are measured by
means of the sessile drop method [45] after the evaporation of the solvent (1,1,1,3,3,3-
hexafluoropropanol). It is found, in particular, that all non-polar liquids, which spread readily on
uncoated surfaces, show high contact angles on complex-coated surfaces (Table 3). In addition the
values of the contact angles are independent of the film thickness in the experimental range 5.7–370 nm
(see section, thin films). The surface energies calculated using the equation of Neumann and Li [19],
range from 9.7 to 12.6 mN/m for all test liquids with surface tensions in the range 18.4–50.0 mN/m
(Table 3). Zisman plots result in a critical surface tension of 7.1 ^ 1.2 mN/m for complex coated silicon
wafers (Fig. 25). Within the experimental range of error, the value is equal to the lowest critical surface
tension observed to date (6 mN/m) [26], which are measured for an oriented closely packed monolayer
of perfluorododecanoic acid. Such low critical surface tensions characterize the resulting properties of a
surface of closely packed perfluoromethyl –CF3-groups. Therefore, it is concluded that the complex-
coated surfaces presented are strongly enriched with CF3-groups.
The wettability data are also used to determine the dispersion force component of the surface energy
gsd by using the Girifalco–Good–Fowkes–Young equation [27–29]. The Girifalco–Good–Fowkes–
Young plots are used to show the dynamic advancing contact angle data obtained for complex surfaces
on silicon wafers (Fig. 26). Linear fits result in a dispersive surface energy of gsd ¼ 10:1 ^ 0:3 mN=m:
Both gc and gsd values indicate a fairly ordered packing of the perfluorinated segments, exposing CF3-
groups on the surface. It is particularly interesting that the contact angles of water (the most polar test
liquid with gl ¼ 72:7 mN=mÞ are smaller than those of methylene iodide ðgl ¼ 50:0 mN=mÞ: The
calculated surface energy using the equation of Neumann and Li [19] has been determined to be
-100 -50 0 50 100 150 200 2500.0
0.2
0.4
0.6
0.8
1.0
1.2
1.4
1.6
(b)
(a)Hea
tFlo
w[m
W/m
g]
T [ ˚C]Fig. 24. DSC heating traces of the surfactant FSA (curve a) and the complex PEI–FSA (curve b). Melting points are at 45 and
180 8C for FSA and PEI–FSA, respectively. Reprinted with permission from Langmuir 2000;16:8562 q American Chemical
Society [43].
A.F. Thunemann / Prog. Polym. Sci. 27 (2002) 1473–15721500

35.5 mN/m. The low surface energies determined for non-polar liquids can be reproduced, even when
the complex coated surfaces are dried after their re-immersion in water. These surface reconstructions
seem to be very fast when in contact with water, as shown by the constant contact angle of water, which
adjusts to an equilibrium within a few seconds. It is suggested that the reason for this could be found in a
nanometer scale topology such as the leopard’s fur pattern, which is found for a polymeric complex of a
fluorinated double-chain surfactant (Section 2.1.5 and Fig. 17). This nanoscale structured surface is
proved to perform fast and reversible surface reconstruction when in contact with water.
Table 3
List of contact angles of different test liquids on materials coated with complex PEI–FSA at 20 8C
Solvent gl (mN/m) Advancing angle (8)a Stationary angle (8)a Receding angle (8)a gs (mN/m)
Hexane 18.4 57 55 39 11.1
PDMSb 18.7 60 59 40 10.7
Octane 21.8 67 65 60 10.9
Decane 23.9 72 72 65 10.7
Dodecane 25.4 76 74 69 10.3
Hexadecane 27.6 82 80 73 9.7
a-Bromonaphthalene 44.0 93 93 87 12.6
Methylene iodide 50.0 102 100 90 11.4
Water 72.7 80 75 20 35.5
The surface tensions of the test liquids gl, advancing, stationary and receding contact angles, are measured by a Kruss
contact angle goniometer and are listed. gs is the surface energy calculated by using equation of Neumann and Li [19] and
advancing contact angles. Reprinted with permission from Langmuir 2000;16:8562 q American Chemical Society [43].a Error of measurement ca. 18.b Commercial product of poly(dimethylsiloxane) oligomers (trimethylsiloxy terminated) from Geltest Inc.
5 10 15 20 25 00.0
0.2
0.4
0.6
0.8
1.0
γc
cos
θ
γl[mN/m]
5 10 15 20 25 03
3
Fig. 25. Zisman plot for complex coated silicon wafers. Points are obtained with (1) hexane, (2) PDMS, (3) octane, (4) decane,
(5) dodecane, (6) hexadecane. The critical surface tension of a complex on a silicon wafer is calculated to be 7.1 ^ 1.2 mN/m
by extrapolating a linear fit (solid line) of the cos u (circles) to cos u ¼ 1: Advancing contact angles are used for cos u.
Reprinted with permission from Langmuir 2000;16:8562 q American Chemical Society [43].
A.F. Thunemann / Prog. Polym. Sci. 27 (2002) 1473–1572 1501

2.1.7.3. Nanostructure in the bulk material. The molecular order of fluorinated side-chain polymers is
determined primarily by the length of the fluorinated moieties, which act in addition as mesogenic
groups [30,46]. In Sections 2.1.2 and 2.1.4, it is shown that the ordering of fluorinated chains in solid
polyelectrolyte–fluorosurfactant complexes are liquid-like for short-chain surfactants, and in Section
2.1.3 it is shown that the ordering can be tuned between liquid-like and crystalline by the charge density
of the polyelectrolyte. In the case of long-chain surfactants, this is semicrystalline (Section 2.1.6.3). It
can be seen in the wide-angle diagram of a powder of PEI–FSA (Fig. 27) that an intense reflection is
0.00 0.05 0.10 0.15 0.20 0.25
-1.0
-0.8
-0.6
-0.4
-0.2
0.0
0.2
0.4
0.6
cos
θ
γl
-1/2
Fig. 26. Girifalco–Good–Fowkes–Young plots for the determination of the dispersive surface energy of a complex coated
silicon wafer surface. From left to right the points are values obtained with (1) methylene iodide, (2) a-bromonaphthalene, (3)
hexadecane, (4) dodecane, (5) decane, (6) octane, (7) PDMS (8) hexane. gsd are calculated to be 10.1 ^ 0.3 mN/m from the
slope (circles are measured angles; the solid line is their least square fit). Reprinted with permission from Langmuir
2000;16:8562 q American Chemical Society [43].
0.0 0.5 1.0 1.5 2.0 2.5 3.0
10
100
1000
(004)
(003)(002)
(001)
Inte
nsity
[arb
.uni
ts]
s [nm-1]Fig. 27. X-ray diffraction pattern of a complex PEI–FSA powder measured by transmission geometry. Reprinted with
permission from Langmuir 2000;16:8562 q American Chemical Society [43].
A.F. Thunemann / Prog. Polym. Sci. 27 (2002) 1473–15721502

present in the wide-angle region at 2.0 nm21. This indicates a two-dimensional hexagonal lattice which
is interpreted as arising from the close packing of the fluorinated segments, which have a chain-to-chain-
distance of 0.577 nm. A similar molecular ordering has been reported for a fluorinated poly(a,L-
glutamate) with a C12 semifluorinated side-chain [46]. Furthermore, this is similar to the close packing
of fluorinated chains in poly(tetrafluoroethylene) crystals of the hexagonal IV phase with a chain-to-
chain distance of 0.57 nm [47].
The finding of a side-chain crystallinity is consistent with the DSC measurements, from which it is
concluded that the crystalline side-chains melt at 180 8C. This result is similar to the side-chain
crystallinity of a complex of PEI with perfluorinated acids, where a melting transition is observed at
163 8C for a fluorinated chain length of C16 (Section 2.1.8). In contrast to complexes of PEI with
perfluorinated acids, the fluorinated chains of PEI–FSA are significantly shorter (C8) but show a higher
melting point. This is attributed to the better packing of the latter. It can be seen in the small-angle region
of Fig. 27 that four equidistant reflections are present, this is characteristic of a layered structure in the
bulk material. A layer distance of d ¼ 3:75 nm is determined from the peak positions. This is consistent
with the investigations of fluorinated polyelectrolyte–surfactant complexes presented in the preceding
sections and reveals that they have highly ordered nanostructures. By analogy with strongly separated
mesophase structures, the lamellar structure are interpreted as consisting of sheets of a thickness d1,
which are enriched in their fluorinated groups and sheets of a thickness d2, which are enriched in their
ionic groups and their polymer backbones. The long period is given by d ¼ d1 þ d2: From the relative
intensities of the lamellar (001) to (004) reflections, the thicknesses of d1 and d2 are calculated to be
1.70 ^ 0.05 nm and 2.05 ^ 0.05 nm by using the J.J. Hermans model [7]. Using the terminology of the
description of liquid crystals, the structure of complex PEI–FSA is designated as a bulk material which
has a smectic B structure, and is stable, at least from 20 to 185 8C. The remarkably high thermal stability
of the smectic B structure is comparable to that observed for a complex of a rod-like polyelectrolyte,
which has been investigated by temperature dependent X-ray scattering [48].
The next question is, are ordered supramolecular structures possible in view of the branching of the
PEI? This commercial product, which is used widely in the paper industry, has a molecular weight of
Mw ¼ 25 000 g=mol and ratios of primary to secondary to tertiary amino groups of 34:40:26. Chen and
Hsiao [49] have reported on lamellar complexes with dodecylbenzenesulfonic acid for the same PEI.
They showed that considerable branching does not hinder the formation of an ordered supramolecular
complex structure. Further, Hwang and Kim [50] have shown that the PEI of the same molecular weight
and degree of branching could be very effective in assembling rigid Langmuir–Blodgett monolayers of
fatty acids. Therefore, the occurrence of self-assembled structures with a high degree of order is not
inconsistent with the irregular structure of the polymer backbone of PEI.
2.1.7.4. Structure of thin films. Thin complex films on silicon wafers are prepared by the spin-coat
technique from complex solutions. The film structure is then investigated by X-ray reflectivity.
Reflectivity curves of ultra-thin and thin complex films are shown in Figs. 28 and 29. Surprisingly well-
defined double-layer stacks developed within a few seconds simply as the result of the deposition of
droplets of the complex solution. In Fig. 28 the presence of Kiessig fringes indicate a smooth complex
film. A thickness of 5.7 ^ 0.5 nm is calculated from the angular positions of the fringes [51].
The reflectivity curve can be explained as resulting from 1.5 double layers. Here, a double layer is
defined as a structure building block with an ionic sheet surrounded by fluorinated sheets. The latter are
formed by the tails of the surfactants. With this definition the structure is given as follows: half an ionic
A.F. Thunemann / Prog. Polym. Sci. 27 (2002) 1473–1572 1503

layer (ca. 1.0 nm) lies at the complex/wafer interface, a double layer is in the middle (3.75 nm) and
finally a fluorinated layer (ca. 1.0 nm) is located at the complex/air interface (Fig. 28 inset). This
assumption can be confirmed by using a box model based on the Parrat formalism [52]. The fit is shown
in Fig. 28 (dotted line). The lowest thickness of films is 5.7 nm which could be prepared. For films of
larger thicknesses, which are in the range 20–400 nm, as determined by a surface profiler, three Bragg
peaks appear. The differences between the peak positions are equidistant. Examples are shown in Fig. 29
0.0 0.2 0.4 0.6 0.8 1.01E-6
1E-5
1E-4
1E-3
0.01
0.1
1
Ref
lect
ivity
s [nm-1]
silicon wafer
3.7 nm5.7 nm
1 nm
1 nm
Fig. 28. X-ray reflectivity curve of an ultra-thin complex film (5.7 nm) complex PEI–FSA film on a silicon wafer (solid line,
experimental curve; dotted line, fitted curve). The inset shows a sketch of the film structure in the direction vertical to the wafer
surface. Reprinted with permission from Langmuir 2000;16:8562 q American Chemical Society [43].
0.2 0.4 0.6 0.8 1.010-1
101
103
105
107
109
(d)
(b)
(c)
(a)
Inte
nsity
[a.u
.]
s [nm-1]Fig. 29. X-ray reflectivity curves of complex PEI–FSA films on silicon wafers with vertically ordering of alternating fluorinated
and ionic layers. The film thicknesses are 5.7 nm (curve a), 16 nm (curve b), 39 nm (curve c) and 370 nm (curve d). Reprinted
with permission from Langmuir 2000;16:8562 q American Chemical Society [43].
A.F. Thunemann / Prog. Polym. Sci. 27 (2002) 1473–15721504

(curves (b)–(d)). A lamellar spacing of 3.70 ^ 0.05 nm is calculated from the reflex positions. Within
the experimental error, this value is identical to that determined for the complex as material in the bulk
form (3.75 nm). Because of the same nanostructure is developed in a slow film forming process (solvent
casting) and in a fast film forming process (spin coating), it is concluded that the time which is necessary
for the formation of the nanostructure is shorter than the time necessary for the formation of films. The
latter is in the order of 1 s. Furthermore, as expected for a stack of multi-layers, the sharpness of the
Bragg peaks increases with increasing film thickness in the line from curve b to d (Fig. 29). Vertical
correlation lengths of 16 ^ 1 nm (b), 39 ^ 2 nm (c) and 370 ^ 10 nm (d) are determined from the
integral widths of the reflections.
The structure of the films consists of multi-layers aligned parallel to the wafer surface. In addition,
from the result of the contact angle measurements and from the good adhesion of the films on the wafers,
it is concluded that a fluorinated layer lies on the complex/air interface and an ionic layer lies on the
wafer/complex interface. Therefore, the film resulting in curve b (Fig. 29) contains 4.5 double layers,
that resulting in curve c contains 10.5 double layers and that in curve d contains about 100 double layers.
The observed macroscopic orientation of the complex to multi-layers with a variability of about two
decades in their thicknesses, which are produced in a single-step procedure, is a significant progress in
using self-assembly for the preparation of thin organic films. Mechanical fields, present during the spin
coating procedure, are probably the reason for the macroscopic orientation of the lamellar stacks parallel
to the underlying substrate surface.
2.1.8. Fine-tuning of the surface energy [53]
This section reports on lamellar mesophases formed by complexes of polyethyleneimine (PEI) and
perfluorinated carboxylic acids of different chain length (C4 to C16) resulting in polyethyleneimine
perfluorocarboxylates (PEI–C4 to PEI–C16). The PEI is the same as described in Section 2.1.7. Varying
the chain length of the surfactant complexes allow a fine-tuning of the surface energy. The stoichiometry
of the complexes is determined by FTIR spectroscopy in the way described in Section 2.1.7.
2.1.8.1. Wetting. Thin films of the complexes with smooth surfaces are prepared by the spin-cast
procedure using a 0.1% (w/w) complex solution onto silicon wafers. After the evaporation of the solvent
(1,1,1,3,3,3-hexafluoropropanol), the wafers are stored overnight at 30 8C and then for 60 min at 100 8C.
From the weight uptake, the thicknesses of the resultant complex coatings are calculated to be in the
range 100–400 nm.
The wettability of the complex surfaces with n-decane, n-hexadecane, diiodomethane and water is
then determined by dynamic contact angle measurements (Tables 4–7). It is found that the contact
angles of the test liquid increase with an increasing chain length. By comparison, the static contact
angles of PEI–C10 ðust;n-hexadecane ¼ 778Þ and PEI–C12 ðust;n-hexadecane ¼ 828Þ complex surfaces are at
least as high as those found for adsorbed monolayers of C10 ðust;n-hexadecane ¼ 728Þ and C12
ðust;n-hexadecane ¼ 788Þ on platinum surfaces [26,54]. The latter are known to be the surfaces showing
the lowest critical surface tension observed to date (6 mN/m). Similar high contact angles have been
reported for side-chain crystalline polymers with C8F17 fluorocarbon substituents with a poly-
styreneðuadv;n-hexadecane ¼ 828Þ [55], a methacrylateðuadv;n-hexadecane ¼ 81–828Þ [56] and an ionene-6,6
backbone ðuadv;n-hexadecane ¼ 818; ust;n-hexadecane ¼ 758Þ [30], are all been shown to yield double layers of
the hydrocarbon backbone and their fluorocarbon chains.
The use of contact angles to calculate surface energies is only reliable in the case of homogeneous and
A.F. Thunemann / Prog. Polym. Sci. 27 (2002) 1473–1572 1505
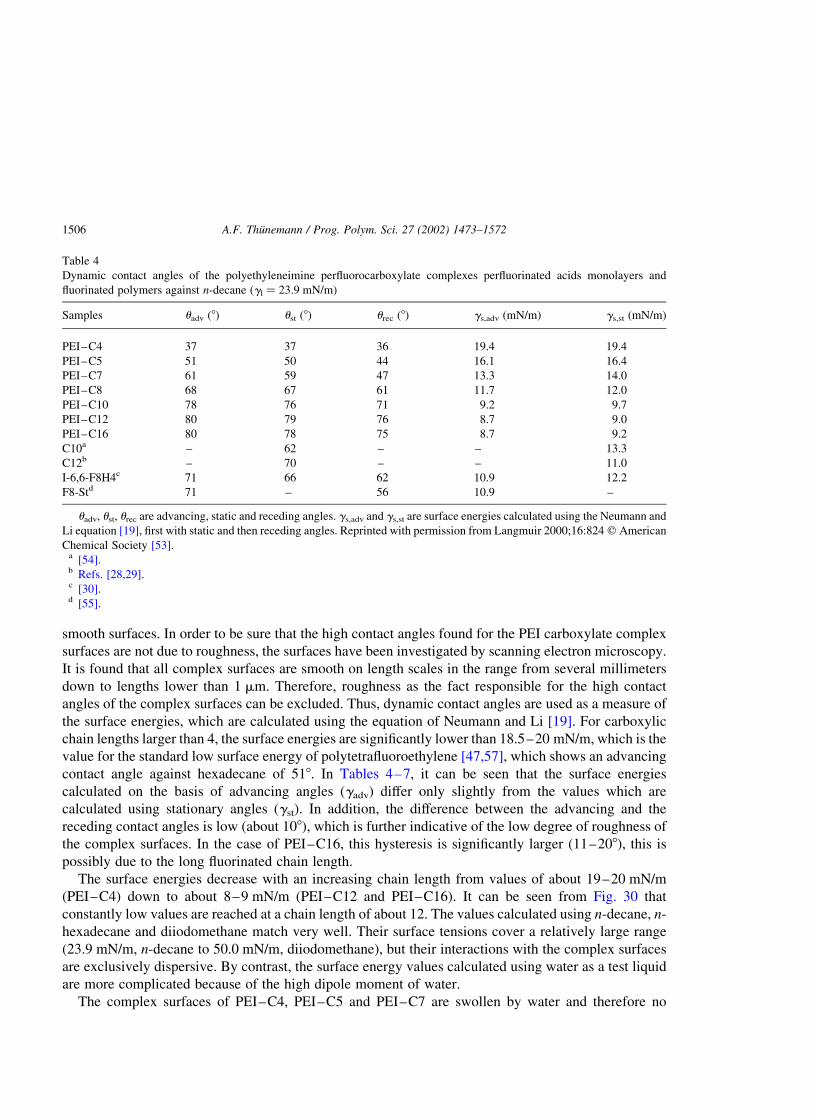
smooth surfaces. In order to be sure that the high contact angles found for the PEI carboxylate complex
surfaces are not due to roughness, the surfaces have been investigated by scanning electron microscopy.
It is found that all complex surfaces are smooth on length scales in the range from several millimeters
down to lengths lower than 1 mm. Therefore, roughness as the fact responsible for the high contact
angles of the complex surfaces can be excluded. Thus, dynamic contact angles are used as a measure of
the surface energies, which are calculated using the equation of Neumann and Li [19]. For carboxylic
chain lengths larger than 4, the surface energies are significantly lower than 18.5–20 mN/m, which is the
value for the standard low surface energy of polytetrafluoroethylene [47,57], which shows an advancing
contact angle against hexadecane of 518. In Tables 4–7, it can be seen that the surface energies
calculated on the basis of advancing angles (gadv) differ only slightly from the values which are
calculated using stationary angles (gst). In addition, the difference between the advancing and the
receding contact angles is low (about 108), which is further indicative of the low degree of roughness of
the complex surfaces. In the case of PEI–C16, this hysteresis is significantly larger (11–208), this is
possibly due to the long fluorinated chain length.
The surface energies decrease with an increasing chain length from values of about 19–20 mN/m
(PEI–C4) down to about 8–9 mN/m (PEI–C12 and PEI–C16). It can be seen from Fig. 30 that
constantly low values are reached at a chain length of about 12. The values calculated using n-decane, n-
hexadecane and diiodomethane match very well. Their surface tensions cover a relatively large range
(23.9 mN/m, n-decane to 50.0 mN/m, diiodomethane), but their interactions with the complex surfaces
are exclusively dispersive. By contrast, the surface energy values calculated using water as a test liquid
are more complicated because of the high dipole moment of water.
The complex surfaces of PEI–C4, PEI–C5 and PEI–C7 are swollen by water and therefore no
Table 4
Dynamic contact angles of the polyethyleneimine perfluorocarboxylate complexes perfluorinated acids monolayers and
fluorinated polymers against n-decane (gl ¼ 23.9 mN/m)
Samples uadv (8) ust (8) urec (8) gs,adv (mN/m) gs,st (mN/m)
PEI–C4 37 37 36 19.4 19.4
PEI–C5 51 50 44 16.1 16.4
PEI–C7 61 59 47 13.3 14.0
PEI–C8 68 67 61 11.7 12.0
PEI–C10 78 76 71 9.2 9.7
PEI–C12 80 79 76 8.7 9.0
PEI–C16 80 78 75 8.7 9.2
C10a – 62 – – 13.3
C12b – 70 – – 11.0
I-6,6-F8H4c 71 66 62 10.9 12.2
F8-Std 71 – 56 10.9 –
uadv, ust, urec are advancing, static and receding angles. gs,adv and gs,st are surface energies calculated using the Neumann and
Li equation [19], first with static and then receding angles. Reprinted with permission from Langmuir 2000;16:824 q American
Chemical Society [53].a [54].b Refs. [28,29].c [30].d [55].
A.F. Thunemann / Prog. Polym. Sci. 27 (2002) 1473–15721506
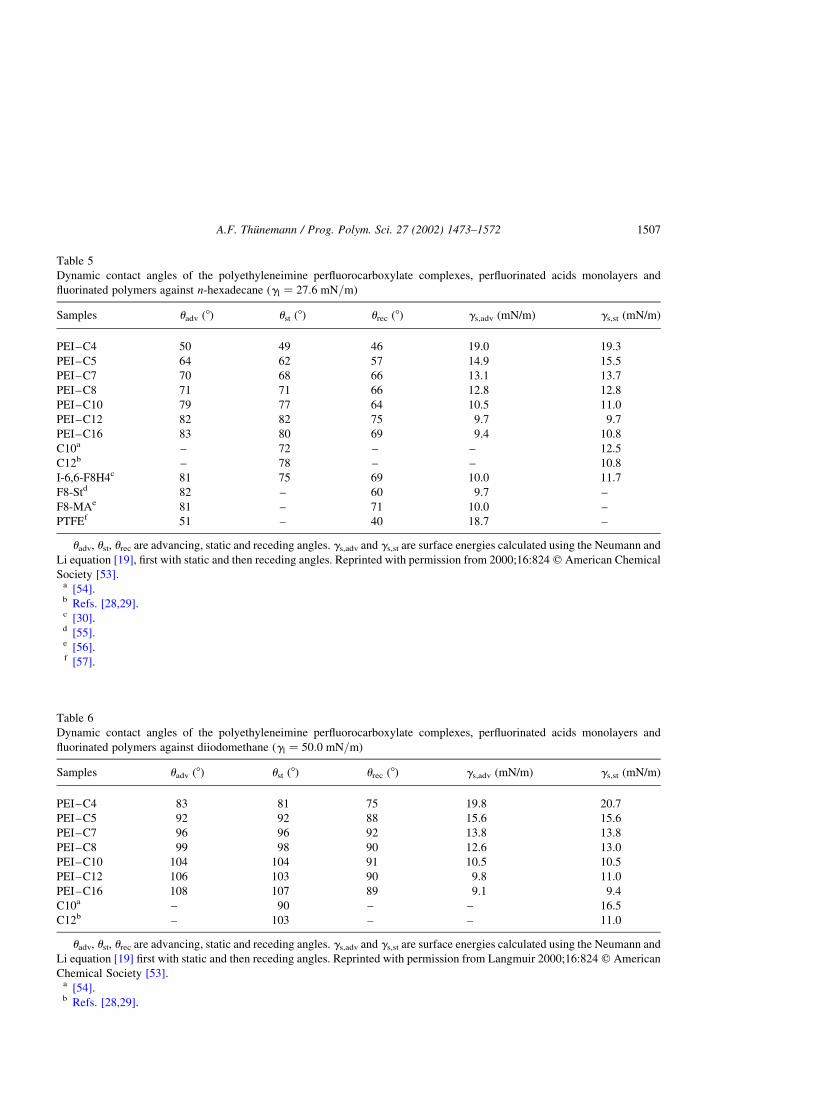
Table 5
Dynamic contact angles of the polyethyleneimine perfluorocarboxylate complexes, perfluorinated acids monolayers and
fluorinated polymers against n-hexadecane ðgl ¼ 27:6 mN=mÞ
Samples uadv (8) ust (8) urec (8) gs,adv (mN/m) gs,st (mN/m)
PEI–C4 50 49 46 19.0 19.3
PEI–C5 64 62 57 14.9 15.5
PEI–C7 70 68 66 13.1 13.7
PEI–C8 71 71 66 12.8 12.8
PEI–C10 79 77 64 10.5 11.0
PEI–C12 82 82 75 9.7 9.7
PEI–C16 83 80 69 9.4 10.8
C10a – 72 – – 12.5
C12b – 78 – – 10.8
I-6,6-F8H4c 81 75 69 10.0 11.7
F8-Std 82 – 60 9.7 –
F8-MAe 81 – 71 10.0 –
PTFEf 51 – 40 18.7 –
uadv, ust, urec are advancing, static and receding angles. gs,adv and gs,st are surface energies calculated using the Neumann and
Li equation [19], first with static and then receding angles. Reprinted with permission from 2000;16:824 q American Chemical
Society [53].a [54].b Refs. [28,29].c [30].d [55].e [56].f [57].
Table 6
Dynamic contact angles of the polyethyleneimine perfluorocarboxylate complexes, perfluorinated acids monolayers and
fluorinated polymers against diiodomethane ðgl ¼ 50:0 mN=mÞ
Samples uadv (8) ust (8) urec (8) gs,adv (mN/m) gs,st (mN/m)
PEI–C4 83 81 75 19.8 20.7
PEI–C5 92 92 88 15.6 15.6
PEI–C7 96 96 92 13.8 13.8
PEI–C8 99 98 90 12.6 13.0
PEI–C10 104 104 91 10.5 10.5
PEI–C12 106 103 90 9.8 11.0
PEI–C16 108 107 89 9.1 9.4
C10a – 90 – – 16.5
C12b – 103 – – 11.0
uadv, ust, urec are advancing, static and receding angles. gs,adv and gs,st are surface energies calculated using the Neumann and
Li equation [19] first with static and then receding angles. Reprinted with permission from Langmuir 2000;16:824 q American
Chemical Society [53].a [54].b Refs. [28,29].
A.F. Thunemann / Prog. Polym. Sci. 27 (2002) 1473–1572 1507

contact angles could be measured. In the case of PEI–C8, PEI–C10, the surface energies are
significantly higher possibly due to a surface reconstruction as described in Section 2.1.5 as well as for
fluorinated side-chain ionenes [30]. The surface reconstruction seems to be absent or very much lower
for PEI–C12 and PEI–C16. Probably in these cases, the ionic polymer backbone is far enough below the
surface to allow the attack of water, at least within the time of the experiments (30 min). The contact
angle hysteresis between advancing and receding angles are typically in the order of 108. This can be
caused by small imperfections, e.g. heterogeneity, swelling and penetration by the wetting liquid.
Table 7
Dynamic contact angles of the polyethyleneimine perfluorocarboxylate complexes, perfluorinated acids monolayers and
fluorinated polymers against water ðgl ¼ 72:3 mN=mÞ
Samples uadv (8) ust (8) urec (8) gs,adv (mN/m) gs,st (mN/m)
PEI–C8 112 110 103 15.9 17.1
PEI–C10 120 117 105 11.6 13.1
PEI–C12 123 120 109 10.0 11.6
PEI–C16 124 120 100 9.6 11.5
C10a – 102 – 21.8 –
C12b – 103 – 21.2 –
I-6,6-F8H4c 121 – 111 11.1 –
uadv, ust, urec are advancing, static and receding angles. gs,adv and gs,st are surface energies calculated using Eq. (1), first with
static and then receding angles. Reprinted with permission from Langmuir 2000;16:824 q American Chemical Society [53].a [54].b Refs. [28,29].c [30].
4 6 8 10 12 14 16
8
10
12
14
16
18
20 waterdiiodomethanen-hexadecanen-decane
γ[m
N/m
]
number of carbon atomsFig. 30. Surface energies for polyethyleneimine carboxylate complexes are dependent on the chain length of the fluorinated
carboxylate moieties. The surface energies were calculated using Neumann and Li equation for water (diamonds),
diiodomethane (circles), n-hexadecane (triangles), and n-decane (squares) as test liquids. Reprinted with permission from
Langmuir 2000;16:824 q American Chemical Society [53].
A.F. Thunemann / Prog. Polym. Sci. 27 (2002) 1473–15721508

2.1.8.2. Side-chain order. In the wide-angle diagram of the PEI-complexes (Fig. 31), it can be seen that
the reflection pattern, and therefore the molecular ordering, changes with the chain length of the
perfluorinated acid. For the shorter chain length complexes (PEI–C4 to PEI–C10), only one broad
reflection is found (curves (a) and (b) in Fig. 31). Its maximum corresponds to a Bragg spacing of
0.51 nm. The presence of only very broad wide-angle reflections confirms that the complexes PEI–C4,
PEI–C5, PEI–C7, PEI–C8, and PEI–C10 are non-crystalline materials. In the wide-angle diagram of
PEI–C12, a reflection with a slightly lower Bragg spacing of 0.50 nm, but with a significantly smaller
width, is found (Fig. 31(c)). This is indicative of a better lateral ordering of the adjacent fluorinated
chains than those present in PEI–C4 to PEI–C10. The simplest molecular arrangement that conforms to
the sharper wide-angle reflection of PEI–C12 is that of a parallel alignment of the rod-like
perfluoroalkyl chains arranged in a two-dimensional lattice with a rotational disorder and with an
average distance of 5.7 nm between the chains. A similar molecular ordering has been reported for a
fluorinated poly(a,L-glutamate) with a C12 semifluorinated side-chain [46]. As can be seen in Fig. 31(d),
in addition to an intense reflection (Bragg distance of 4.88 nm), further weak reflections are found
(Bragg distances of 0.430, 0.472, 0.518, 0.548 nm, respectively) in the wide-angle X-ray scattering
curve of PEI–C16. This finding is consistent with a further increase in the molecular order. Probably, the
order is three-dimensional with a chain-to-chain distance of 0.56 nm. This is similar to the close packing
of fluorinated chains in poly(tetrafluoroethylene) crystals of the hexagonal IV phase with a chain-to-
chain distance of 0.57 nm [47].
The presence of side-chain crystallinity of PEI–C16 is confirmed by a first-order transition in the
DSC thermogram with a maximum at 163 8C (not shown). This transition is ascribed to the melting of
crystalline C16 side-chains. By contrast, no melt transitions are observed in DSC for the other
complexes.
2.1.8.3. Nanostructures. An ordering on a length scale in the range 1–10 nm is assumed for the PEI–
perfluorocarboxylate complexes. Small-angle X-ray measurements have been performed in order to
prove this assumption. The scattering curves of complex powders are shown in Figs. 32 and 33. It can be
1.0 1.5 2.0 2.5 3.00
1000
2000
3000
4000
5000
(d)
(c)
(b)
(a)Inte
nsity
[arb
.uni
ts]
s [ nm-1]
Fig. 31. Wide-angle X-ray scattering diagrams of complex powder of PEI–C8 (a), PEI–C10 (b), PEI–C12 (c) and PEI–C16
(d). Reprinted with permission from Langmuir 2000;16:824 q American Chemical Society [53].
A.F. Thunemann / Prog. Polym. Sci. 27 (2002) 1473–1572 1509
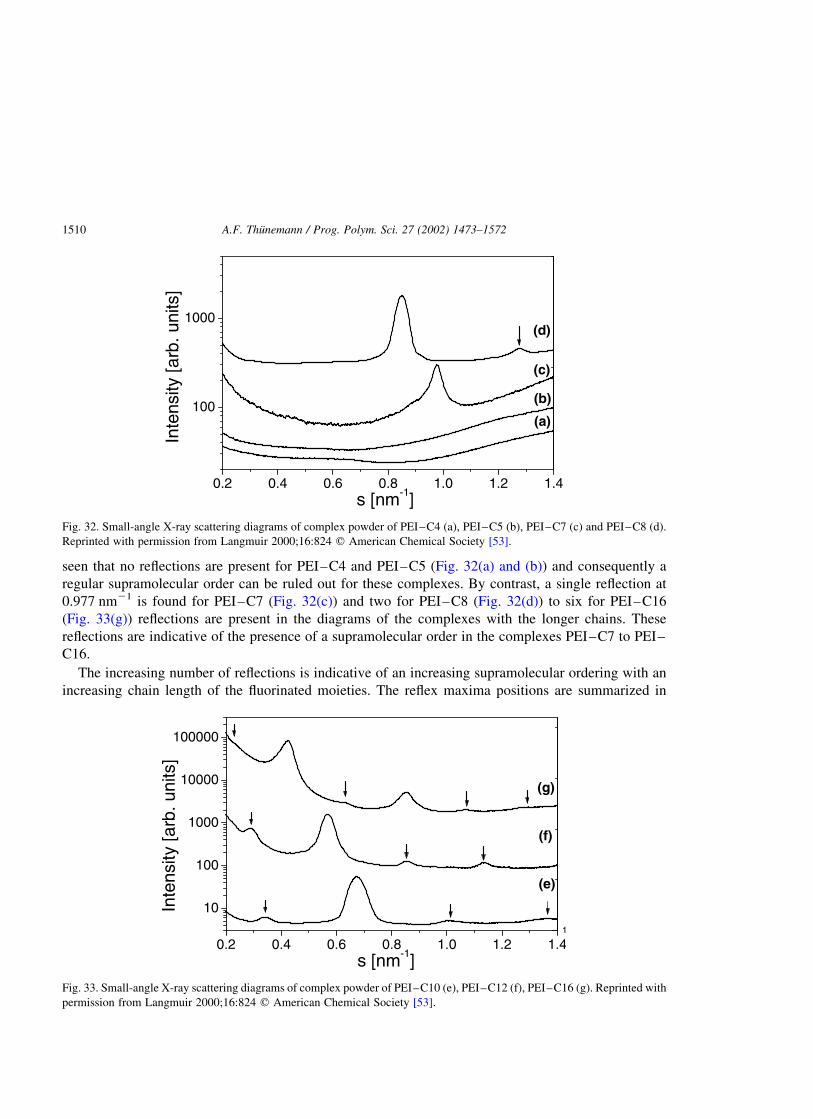
seen that no reflections are present for PEI–C4 and PEI–C5 (Fig. 32(a) and (b)) and consequently a
regular supramolecular order can be ruled out for these complexes. By contrast, a single reflection at
0.977 nm21 is found for PEI–C7 (Fig. 32(c)) and two for PEI–C8 (Fig. 32(d)) to six for PEI–C16
(Fig. 33(g)) reflections are present in the diagrams of the complexes with the longer chains. These
reflections are indicative of the presence of a supramolecular order in the complexes PEI–C7 to PEI–
C16.
The increasing number of reflections is indicative of an increasing supramolecular ordering with an
increasing chain length of the fluorinated moieties. The reflex maxima positions are summarized in
0.2 0.4 0.6 0.8 1.0 1.2 1.4
100
1000(d)
(c)
(b)
(a)
Inte
nsity
[arb
.uni
ts]
s [nm-1]Fig. 32. Small-angle X-ray scattering diagrams of complex powder of PEI–C4 (a), PEI–C5 (b), PEI–C7 (c) and PEI–C8 (d).
Reprinted with permission from Langmuir 2000;16:824 q American Chemical Society [53].
0.2 0.4 0.6 0.8 1.0 1.2 1.4
10
100
1000
10000
100000
Inte
nsity
[arb
.uni
ts]
s [nm-1]
1
(g)
(f)
(e)
Fig. 33. Small-angle X-ray scattering diagrams of complex powder of PEI–C10 (e), PEI–C12 (f), PEI–C16 (g). Reprinted with
permission from Langmuir 2000;16:824 q American Chemical Society [53].
A.F. Thunemann / Prog. Polym. Sci. 27 (2002) 1473–15721510

Table 8. From these the relative reflex positions are determined to be 2.0:3.0 (PEI–C8), 1.0:2.0:3.0
(PEI–C10), 1.0:2.0:3.0:3.9 (PEI–C12), and 1.0:2:0:3.0:4.0:5.0:6.1 (PEI–C16). Therefore, lamellar
mesophases are assumed to be present in PEI–C7 to PEI–C16 complexes. In the same sequence form
PEI–C7 to PEI–C16, the long period increases with the increasing chain length of the fluorinated
chains. The absence of a lamellar structuring in PEI–C4 and PEI–C5 is explained as being due to the
chain lengths of perfluorobutanoic and perfluoropentanoic acid, which are not long enough to induce a
periodic microphase separation. It is striking that in the scattering curves of PEI–C10, PEI–C12 and
PEI–C16, the first reflection is much weaker in intensity than the second.
A possible explanation of the observed ratios and the large differences in the intensities is the presence
of two lamellar structures, an a phase and a b phase. Assuming this, the long period of a is about twice
as large as the long period of b. The reflections with the indices l ¼ 2; 4, 6 of the a modification are
found at the same s-values as the reflections with l ¼ 1; 2, 3 of the b modification. From the high
intensity of the reflection (001) of the b phase (overlapped by reflection (002) of the a phase) compared
to the reflection (001) of the a phase it is concluded that the b modification is dominant. The increases of
the long periods of the a and b phases as functions of the number of carbon atoms of the carboxylate
chains are linear (Fig. 34). The increase of the long period per CF2-group is determined to be
0.295 ^ 0.010 and 0.147 ^ 0.002 nm (a and b phase, respectively) from the straight lines in Fig. 34.
The length of an axial projection of a CF2-group in a fluorinated chain is 0.13 nm [58] which gives a
thickness of ðn 2 1Þ 0.13 nm of fluorinated sheets in a monolayer arrangement and 2 ðn 2 2Þ 0.13 nm of
fluorinated sheets in a bilayer arrangement of the perfluorinated acids. n is the number of carbon atoms of
the acids. It can be seen in Fig. 34 that the theoretical and experimental slopes are in good agreements
with a bilayer arrangement of the fluorinated chains in the a phase and a monolayer arrangement in the b
phase. Within this model the layer distances of the a phase are 2.92 nm (PEI–C10), 3.46 nm (PEI–
C12), and 4.55 nm (PEI–C16). For the shorter chain length, no a phase has been observed. The layer
distances of the b phase are 1.02 nm (PEI–C7), 1.17 nm (PEI–C8), 1.49 nm (PEI–C10), 1.76 nm (PEI–
C12), and 2.35 nm (PEI–C16).
2.2. Diazosulfonate polymer complexes
In this section, it will be shown that diazosulfonate groups can be integrated as functional moieties in
highly ordered nanostructured polyelectrolyte–surfactant complexes. The focus of Section 2.2.1 is on
Table 8
Small-angle X-ray diffraction maxima in units of the scattering vector s (nm21) ðs ¼ 2=l sin uÞ and estimates of the observed
relative intensities (s, strong; w, weak)
PEI–C7 PEI–C8 PEI–C10 PEI–C12 PEI–C16
0.977s 0.852s 0.342w 0.289w 0.220w
1.275w 0.672s 0.568s 0.425s
1.011w 0.860w 0.640w
1.134w 0.853s
1.062w
1.294w
Reprinted with permission from Langmuir 2000;16:824 q American Chemical Society [53].
A.F. Thunemann / Prog. Polym. Sci. 27 (2002) 1473–1572 1511

super-strongly segregated lamellar complexes and that of Section 2.2.2 is on the wetting of ultra-thin
films. Water-insoluble complexes are formed by diazosulfonate containing polyelectrolytes and
fluorinated cationic surfactants capable of forming low energy surfaces. A fine-tuning of the structures
and the surface energies is achieved by varying the composition of the polymer backbone, the charge
density and the pH value. It has been shown earlier that polyelectrolytes containing diazosulfonate
chromophores are useful for the preparation of solid complexes with non-fluorinated surfactants [59].
The diazosulfonate groups of the polymers act as a functionality that makes the complexes sensitive to
light.
2.2.1. Super-strongly segregated lamellar structures [60]
This section reports on complexes of anionic polyelectrolytes which contain diazosulfonate groups
and a commercially available fluorinated cationic surfactant (Hoe-L-3658-1). In the experiments,
mixing equimolar amounts of polyelectrolyte (Fig. 35, structures (a)–(g)) and fluorinated surfactant
resulted in complexes which precipitate immediately. After purification by washing with water, the
complexes are dried in vacuum, subsequently soluted in trifluoroethanol and cast into transparent films.
The nature of surfactant chain packing in the complexes is determined by wide-angle X-ray
scattering. In the wide-angle X-ray scattering patterns of all complexes, only a broad reflection is found,
which corresponded to a Bragg spacing of 0.52 nm. This is attributed to an amorphous packing of
fluorinated alkyl chains. This finding is similar to that observed for complexes of cationic copolymers
of low charge density with perfluorodecanoic acid but this is in contrast to a complex of
poly(diallyldimethylammonium) chloride homopolymer with perfluorodecanoic acid, which is partially
crystalline (Section 2.1.3). The absence of crystallinity for the complexes D1a to D1g can probably be
6 7 8 9 10 11 12 13 14 15 16 170.5
1.0
1.5
2.0
2.5
3.0
3.5
4.0
4.5
5.0
β
α
laye
rdi
stan
ce[n
m]
number of carbon atomsFig. 34. Layer distances of PEI-complexes are dependent on the number of carbon atoms of the fluorinated acid used for
complexation. In the lamellar a phase, the fluorinated chains are arranged in bilayers (squares are measured values, the dashed
line is a linear fit, and the dash-dotted line represents the theoretical values of fluorinated bilayer sheets, only). In the lamellar b
phase, the fluorinated chains are arranged in monolayers (circles are measured values. The solid line is a linear fit, and the dotted
line represents the theoretical values for the fluorinated monolayer sheets). Reprinted with permission from Langmuir
2000;16:824 q American Chemical Society [53].
A.F. Thunemann / Prog. Polym. Sci. 27 (2002) 1473–15721512
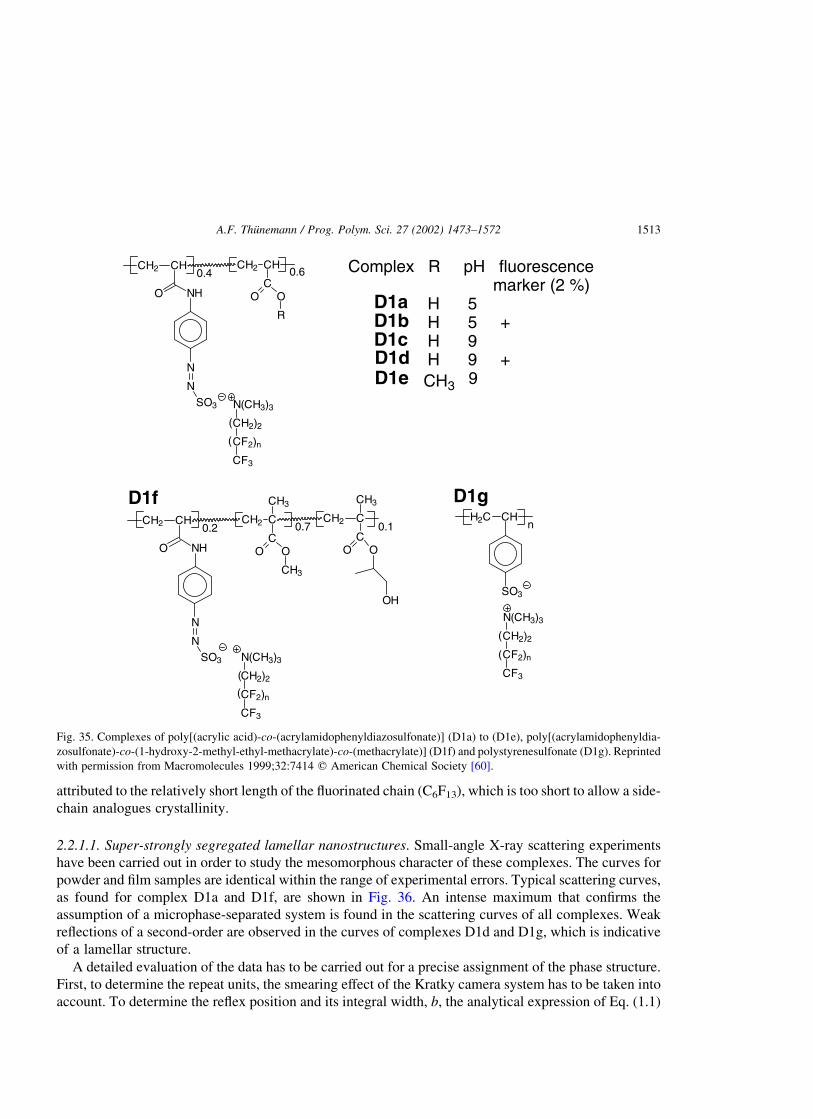
attributed to the relatively short length of the fluorinated chain (C6F13), which is too short to allow a side-
chain analogues crystallinity.
2.2.1.1. Super-strongly segregated lamellar nanostructures. Small-angle X-ray scattering experiments
have been carried out in order to study the mesomorphous character of these complexes. The curves for
powder and film samples are identical within the range of experimental errors. Typical scattering curves,
as found for complex D1a and D1f, are shown in Fig. 36. An intense maximum that confirms the
assumption of a microphase-separated system is found in the scattering curves of all complexes. Weak
reflections of a second-order are observed in the curves of complexes D1d and D1g, which is indicative
of a lamellar structure.
A detailed evaluation of the data has to be carried out for a precise assignment of the phase structure.
First, to determine the repeat units, the smearing effect of the Kratky camera system has to be taken into
account. To determine the reflex position and its integral width, b, the analytical expression of Eq. (1.1)
0.6CH2 CH
NHO
N
NSO3
CH2 CH
CO O
R
0.4
H2C CH
SO3
n0.7CH2 CH
NHO
N
NSO3
CH2 C
CO O
CH3
CH3
CH2 C
CH3
CO O
OH
0.2 0.1
Complex R pH fluorescencemarker (2 %)
H 5H 5 +H 9H 9 +
9
D1f D1g
D1aD1b
D1dD1c
D1e CH3
(
(
N(CH3)3
CH2)2
CF2)n
CF3
N(CH3)3
CH2)2
CF2)n
CF3
N(CH3)3
CH2)2
CF2)n
CF3
(
(
(
(
Fig. 35. Complexes of poly[(acrylic acid)-co-(acrylamidophenyldiazosulfonate)] (D1a) to (D1e), poly[(acrylamidophenyldia-
zosulfonate)-co-(1-hydroxy-2-methyl-ethyl-methacrylate)-co-(methacrylate)] (D1f) and polystyrenesulfonate (D1g). Reprinted
with permission from Macromolecules 1999;32:7414 q American Chemical Society [60].
A.F. Thunemann / Prog. Polym. Sci. 27 (2002) 1473–1572 1513
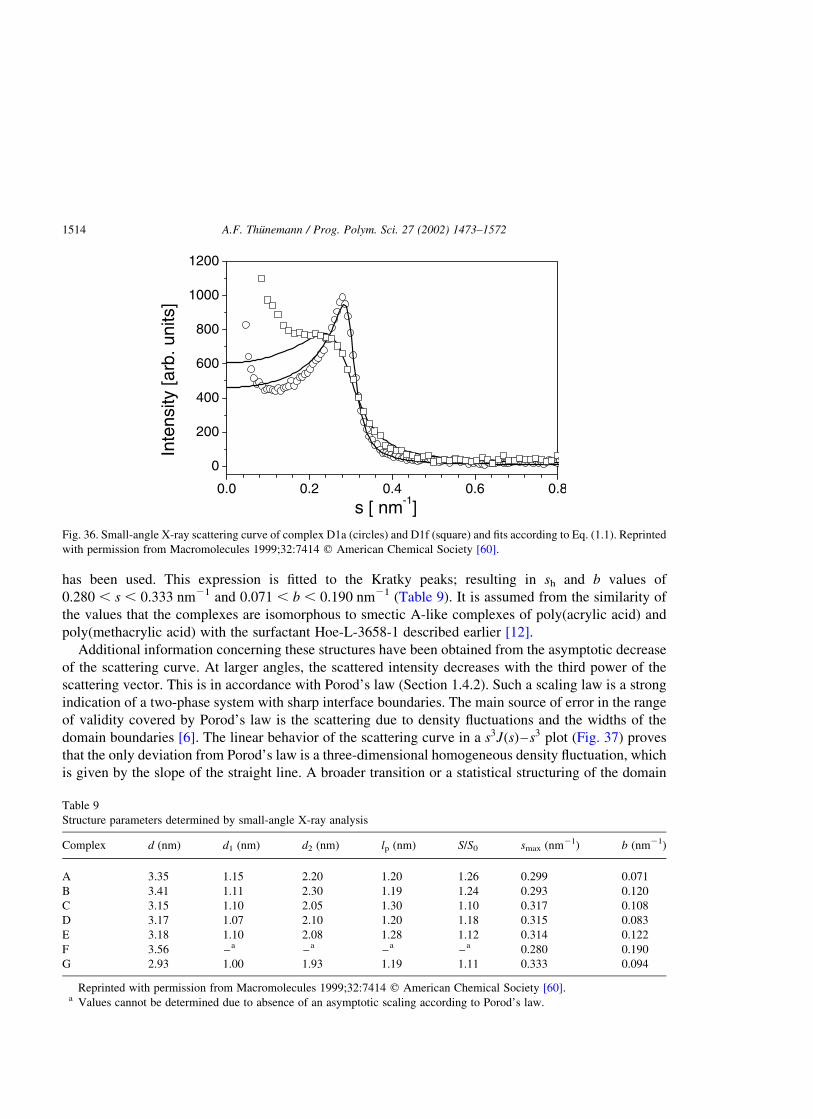
has been used. This expression is fitted to the Kratky peaks; resulting in sh and b values of
0.280 , s , 0.333 nm21 and 0.071 , b , 0.190 nm21 (Table 9). It is assumed from the similarity of
the values that the complexes are isomorphous to smectic A-like complexes of poly(acrylic acid) and
poly(methacrylic acid) with the surfactant Hoe-L-3658-1 described earlier [12].
Additional information concerning these structures have been obtained from the asymptotic decrease
of the scattering curve. At larger angles, the scattered intensity decreases with the third power of the
scattering vector. This is in accordance with Porod’s law (Section 1.4.2). Such a scaling law is a strong
indication of a two-phase system with sharp interface boundaries. The main source of error in the range
of validity covered by Porod’s law is the scattering due to density fluctuations and the widths of the
domain boundaries [6]. The linear behavior of the scattering curve in a s3JðsÞ–s3 plot (Fig. 37) proves
that the only deviation from Porod’s law is a three-dimensional homogeneous density fluctuation, which
is given by the slope of the straight line. A broader transition or a statistical structuring of the domain
0.0 0.2 0.4 0.6 0.8
0
200
400
600
800
1000
1200
Inte
nsity
[arb
.uni
ts]
s [ nm-1]Fig. 36. Small-angle X-ray scattering curve of complex D1a (circles) and D1f (square) and fits according to Eq. (1.1). Reprinted
with permission from Macromolecules 1999;32:7414 q American Chemical Society [60].
Table 9
Structure parameters determined by small-angle X-ray analysis
Complex d (nm) d1 (nm) d2 (nm) lp (nm) S/S0 smax (nm21) b (nm21)
A 3.35 1.15 2.20 1.20 1.26 0.299 0.071
B 3.41 1.11 2.30 1.19 1.24 0.293 0.120
C 3.15 1.10 2.05 1.30 1.10 0.317 0.108
D 3.17 1.07 2.10 1.20 1.18 0.315 0.083
E 3.18 1.10 2.08 1.28 1.12 0.314 0.122
F 3.56 –a –a –a –a 0.280 0.190
G 2.93 1.00 1.93 1.19 1.11 0.333 0.094
Reprinted with permission from Macromolecules 1999;32:7414 q American Chemical Society [60].a Values cannot be determined due to absence of an asymptotic scaling according to Porod’s law.
A.F. Thunemann / Prog. Polym. Sci. 27 (2002) 1473–15721514

boundary, as typically observed in microphase-separated block copolymers [7], can be excluded. Small
deviations from a sharp boundary would indicate a significant deviation from Porod’s law (Section
1.4.2). Therefore, it has been concluded that the phase boundaries of the complexes are in the order of 1–
2 atomic distances, i.e. the lamellar nanostructure is super-strongly segregated. Using Eq. (1.2) the
average chord lengths have been calculated to be in the range from 1.19 to 1.30 nm, which is similar to
the polymeric complexes of siloxane surfactants described in Section 2.3.
The simplest structure which is in agreement with these numbers is a microphase-separated model
constructed from a smaller ionic phase (polyelectrolyte plus ionic head groups) and a larger non-ionic
phase (hydrophobic moieties). The repeat unit of a lamellar system d is given by d ¼ d1 þ d2; where d1
and d2 are the thicknesses of the two lamellae. Their values are determined by calculating the interface
distribution function gðrÞ (Section 1.4.3). The interface distribution is computed by the expression (Eq.
(1.8)). A model that can describe the statistics of lamellar phases is the lattice model, in which the
statistics are described by the distributions h1ðd1Þ and h2ðdÞ of the lamellar thicknesses (Section 1.4.3). In
Fig. 38, for example, the interface distribution function computed from the scattering curve of complex
D1a and the best fit using the lattice model are plotted. As shown in Table 9, the thicknesses of the ionic
layers of complex D1a to D1e are in a narrow range between 1.07 and 1.15 nm, and the thickness of the
hydrophobic layers varies between 2.08 and 2.30 nm. The thickness of an ionic layer of complex D1g
(1.00 nm) is slightly lower, which is in agreement with its lower ratio of mass per charge. In contrast to
the complexes D1a to D1e and D1g, no asymptotic behavior in accordance with Porod’s law is
found for complex D1f. Consequently, the thicknesses d1 and d2 cannot be computed. It must be
assumed that the phase separation of D1f is not as strong as that found for the other complexes.
A possible reason for this is the lower amount of ionic monomers of D1f (20 mol%). For the other
complexes, the amount of ionic monomers (in mol%) is 100 (D1c), 98 (D1d), 40 (D1a and D1e) and 38
(D1b).
In addition to the lamellar thicknesses, the curvature of the interface between ionic and non-ionic
0.00 0.05 0.10 0.15 0.20 0.250
10
20
30
s3In
tens
ity
s3 [ nm-3]Fig. 37. s 3J–s 3 plots of the small-angle X-ray scattering of complex D1a (circles) and their ideal behavior according to Porod’s
law (solid line). Reprinted with permission from Macromolecules 1999;32:7414 q American Chemical Society [60].
A.F. Thunemann / Prog. Polym. Sci. 27 (2002) 1473–1572 1515

domains is an important characteristic of the description of the complex morphology. Using Eq. (1.11),
the surface ratios S=S0 are found to be in the range 1.10–1.26 (Table 9). The surface ratios of D1c (1.10),
D1e (1.12) and D1g (1.11) are small and nearly identical, and can be seen as essentially flat interface
boundaries. The slightly higher value of D1d (1.18) compared to D1c (1.10) may be due to the presence
of the fluorescence label (2 mol%), which enhances the waviness to a small extent. The larger values of a
(1.26) and b (1.24) are indicative of a significantly higher waviness of the interfaces. These values are
similar to those determined by Ruland et al. for the lamellar structures of diblock copolymers. Such
undulations are typically due to packing constraints [4].
2.2.1.2. Wetting. Films of the complexes D1a to D1g are prepared by casting 0.1–0.5% (w/w) complex
solutions on glass surfaces. The complex solutions are dried at room temperature in dry air resulting in
thin transparent coatings with thicknesses of about 500 nm. Dynamic contact angles u of the test liquids
with different surface tensions are measured by means of the sessile drop method [20]. It has been found
in particular that all non-polar liquids, which spread readily on uncoated surfaces, show high contact
angles on complex-coated surfaces.
The surface free energies have been calculated using the equation of Neumann and Li equation [19].
They range from 11.4 to 16.9 mN/m for all test liquids with surface tensions in the range 18.4–50.0 mN/
m (hexane to methylene iodide). Zisman plots (Fig. 39 and Table 10) result in critical surface tensions of
7.5 mN/m (complex D1c) to 13.2 mN/m (complex D1f). These values are significantly lower than those
expected for a surface enriched predominantly with CF2-groups (ca. 18.5 mN/m) and are higher than
those expected for an oriented closely packed monolayer of perfluorododecanoic acid (6 mN/m) [26].
Considering the critical surface energy data it seems that the complex surfaces are strongly enriched with
loosely packed CF3-groups. The packing increases along line D1f, D1a, and D1c. This results in a
parallel shift of the straight lines (Fig. 39).
The wettability data are also used to determine the dispersion force component of the surface energy
0 5 10 15 20-0.8
-0.6
-0.4
-0.2
0.0
0.2
0.4
0.6
0.8
g(r)
r [ nm]Fig. 38. Interface distribution function computed from the experimental values for complex D1a (circles). The solid line is the
theoretical curve with lamellar thicknesses of d1 ¼ 1:15 nm and d2 ¼ 2:20 nm: Reprinted with permission from
Macromolecules 1999;32:7414 q American Chemical Society [60].
A.F. Thunemann / Prog. Polym. Sci. 27 (2002) 1473–15721516

gsd by using the Girifalco–Good–Fowkes–Young equation [27–29]. The Girifalco–Good–Fowkes–
Young plots are used to show the dynamic advancing contact angle data (Fig. 40). Linear fits result in
dispersive surface energies of gsd ¼ 11:4 mN=m (complex D1c) and 16.2 mN/m (complex D1f). The
results are summarized in Table 10. The OH groups present in the polymer may be responsible for the
higher surface energy of D1f. From the very similar values found for complex D1a and D1b (14.0 and
14.2 mN/m) as well as for D1c and D1d (11.4 mN/m both), it is concluded that the fluorescence markers
(2 mol%) do not affect the surface energy.
A significant effect on the surface energy is found when the complexation is performed in either an
Fig. 39. Zisman plots for complex coated glass surfaces. Points are obtained with (1) hexane, gl ¼ 18:4 mN=m; (2) PDMS,
gl ¼ 18:7 mN=m; (3) octane, gl ¼ 21:8 mN=m; (4) decane, gl ¼ 23:9 mN=m; (5) dodecane, gl ¼ 25:4 mN=m; (6) hexadecane,
gl ¼ 27:6 mN=m: The critical surface tension of complex D1a is calculated to be 11.7 mN/m by extrapolating a linear fit (solid
line) of the cos u (squares) to cos u ¼ 1. For complex D1c (circles), a critical surface tension of 7.5 mN/m is determined
(dashed line) and for complex D1f (triangles) gc is 13.2 mN/m. Advancing contact angles were used for cos u. Reprinted with
permission from Macromolecules 1999;32:7414 q American Chemical Society [60].
Table 10
Zisman critical surface energies gc and the dispersive surface energies gsd according to the Girifalco–Fowkes–Young equation
of complex films on glass
Complex gc (mN/m) gsd (mN/m)
D1a 11.7 ^ 1.5 14.0 ^ 0.3
D1b 11.9 ^ 1.2 14.2 ^ 0.4
D1c 7.5 ^ 1.9 11.4 ^ 0.3
D1d 9.1 ^ 1.4 11.4 ^ 0.2
D1e 9.2 ^ 0.9 12.4 ^ 0.3
D1f 13.2 ^ 1.4 16.2 ^ 0.3
D1g 8.7 ^ 1.8 12.3 ^ 0.3
Reprinted with permission from Macromolecules 1999;32:7414 q American Chemical Society [60].
A.F. Thunemann / Prog. Polym. Sci. 27 (2002) 1473–1572 1517

acidic or a basic medium. The complexes D1a and D1b are prepared at a pH value of 5, at which the
acidic moieties are protonated, the polymeric backbone contains 40 mol% ionic monomers. Under these
conditions only the sulfonate groups are complexed by the cationic surfactant, and the 60 mol%
carboxylic acid groups, which may enhance the surface energy, remained uncomplexed. Using a pH
value of 9, the carboxylic moieties are deprotonated and are able to complex with cations. Under this
condition 100% of the monomer units are complexed. The surface energy in these cases (11.4 mN/m) is
significantly lower than that determined for D1a and D1b (14.0 mN/m). For the complex of another
polymer with 100 mol% ionic monomers (styrenesulfonate) D1g, the surface energy of 12.3 mN/m is
close to the low values of D1a and D1b. Here, it is obvious that the lower surface energy values are found
for the complexes with the denser packing of the surfactants. Complex D1e, which has 40 mol% ionic
monomers, has a significantly lower surface energy than D1a, D1b. This is explained by the presence of
the less polar methacrylate group compared to the carboxylate group. The gc and gsd values indicate an
enrichment of the CF3-groups on the complex surface.
It is particularly interesting that the contact angles of water (the most polar test liquid with gl ¼
72:7 mN=mÞ is only as high as, or smaller than, that of methylene iodide ðgl ¼ 50:0 mN=mÞ: The surface
energies calculated using the Neumann and Li equation [19] increase in the order of complex D1g
(18.2 mN/m), D1c (25.5 mN/m), D1e (29.2 mN/m), D1a (31.1 mN/m) and D1f (50.8 mN/m). The low
surface energies determined for non-polar liquids can be reproduced, even when the complex coated
surfaces are dried after exposure to water. This indicates a reversible surface reconstruction of the
complex surface after it has been in contact with water. It is worth noting that the surface reconstruction
of the complex when in contact with water seems to be very fast, as shown by the static constant contact
0.00 0.05 0.10 0.15 0.20 0.25
-0.8
-0.4
0.0
0.4
0.8 complex D1acomplex D1ccomplex D1f
n-hexane
CH2I2
cos
θ
γl
-1/2
Fig. 40. Girifalco–Good–Fowkes–Young plots for the determination of the dispersive surface energy of complex coated glass
surfaces. From left to right the points are values obtained with (1) methylene iodide, gl ¼ 50:0 mN=m; (2)
a-bromonaphthalene, gl ¼ 44:0 mN=m; (3) hexadecane, gl ¼ 27:6 mN=m; (4) dodecane, gl ¼ 25:4 mN=m; (5) decane, gl ¼
23:9 mN=m; (6) octane, gl ¼ 21:8 mN=m; (7) PDMS gl ¼ 18:7 mN=m; (8) hexane gl ¼ 18:4 mN=m: gsd are calculated from
the slope to be 14.0 mN/m for complex D1a (squares represent measured angles, the solid line the least square fit), 11.4 mN/m
for complex D1c (circles, dotted line), and 16.2 mN/m for complex D1f (triangles, dotted line). Reprinted with permission from
Macromolecules 1999;32:7414 q American Chemical Society [60].
A.F. Thunemann / Prog. Polym. Sci. 27 (2002) 1473–15721518
angle of water which adjusts to an equilibrium within a few seconds. The degree and velocity of surface
reconstruction is assumed to be dependent on several factors, such as the number of polar groups within
a distance of about 1 nm from the surface and the flexibility of the polymeric backbone, which is affected
by the glass transition temperature of the polymer.
2.2.1.3. Thermal properties. The thermal behavior of the complexes has been investigated by DSC.
Weak glass transitions can be detected at several degrees above room temperature for the complexes
D1c (34 8C), D1d (27 8C), D1e (31 8C), and D1f (30 8C). Above a temperature of 170 8C decomposition
sets in, which reaches a maximum decomposition rate at about 200–220 8C. For complexes D1a and
D1b, it is not possible to detect glass transitions but their decomposition behavior is essentially the same
as that of the other azo containing complexes. The absence of glass transitions is typical for
polyelectrolytes.
The highest glass transition, at about 48 8C, has been detected for D1g, a complex, which contains no
azo groups. Such a high value may be explained by the higher rigidity of the polystyrenesulfonate
backbone compared to that of the polymeric backbones of the other complexes. Below 250 8C no
significant decomposition is found. Therefore, the decomposition process is regarded as the thermal
decomposition of the diazo groups. This assumption is supported by investigations of the thermal
decomposition of diazosulfonate containing polymers and diazosulfonate containing surfactants [61].
No other thermal transitions have been observed in the temperature range from 2100 to 170 8C. It is
concluded that the thermal stability of the complexes is determined mainly by the stability of the
polymer.
2.2.1.4. Optical properties. The significant difference observed in supramolecular structure, surface
energies and thermal properties between complex D1a and D1b, and D1c and D1d is assumed to result
from different degrees of ionization of the carboxylic groups. This has been proved by IR-measurements.
The carbonyl stretch vibration band of complex D1a is located at 1730 cm21, whereas that of complex
D1c at 1689 cm21. These values can be assigned to the protonated and deprotonated form of the
carboxylic acid moieties. Therefore, within the solid complex D1a approximately 40 mol% of the
monomer units ðSO32Þ are charged, and approximately 100 mol% in complex D1c. The aromatic ring
vibrations can be found at 1598 and 1508 cm21, the band at 1542 cm21 can be designated to the amidic
group. The UV/Vis-spectra for all diazosulfonate containing complexes show an absorption with a
maximum at 331 nm referring to the diazo group. Loss of absorption is found after irradiation with UV-
light.
The difference between complex D1a, D1b and D1c, D1d in their supramolecular order as well as in
their surface properties may partly result from a different organization of the polyelectrolyte chains
within the complexes. In order to investigate the polymer chain organization in D1b and D1d, the
polymers are copolymerized with 2 mol% N-vinylcarbazole, which acts as fluorescence label. At an
excitation wavelength of 293 nm, the free monomer shows a structured emission band at 350 nm,
whereas for vinylcarbazole homo- and copolymers an additional emission band at lower energies is
present due to the formation of excimers. The fluorescence of the polymers is dominated by the
emissions of two excimer species: emission centered at ca. 420 nm originates from a conventional
‘sandwich like’ excited-state dimer, whereas the peak at 370 nm is attributed to luminescence from
partially overlapping dimer, which is a ‘second’ excimer [62]. It can be seen in Fig. 41(a) that the
emission spectra of diluted complexes D1b and D1d solutions (5 £ 1023 w/w%) differ significantly. All
A.F. Thunemann / Prog. Polym. Sci. 27 (2002) 1473–1572 1519

spectra in Fig. 41 are normalized to equal intensity at 370 nm. The fluorescence intensity at 420 nm is
found to be much higher for complex D1b (dotted line) than for complex D1d (solid line). Further, the
monomeric emission at about 350 nm is higher for D1d than for D1b. From this it is concluded that in
diluted solution the formation of conventional excimers is favored for complex D1b, whereas for
complex D1d the uncorrelated, i.e. monomeric emission is predominant. Therefore, at a high degree of
complexation (complex D1d, 98 mol%), the tendency to excimer formation is lower than at a lower
degree of complexation (complex D1b, 40%). This behavior is found to be even more pronounced for
free-standing complex films (Fig. 41(b)). In the spectrum of complex D1b (dotted line), most of the
intensity is due to the ‘sandwich like’ excimer, the monomer emission is negligible. The spectrum of
complex D1d (solid line) is even dominated by the emission of the sandwich like excimer, but the
emission of the monomer is still present to a considerable degree.
2.2.2. Structures and wetting of ultra-thin films [63]
The subject of this section is the wetting behavior of diazosulfonate polymer complexes in ultra-thin
films and on the nanostructures of the films. The diazosulfonate polymers are the same as in Section
2.2.1, but the fluorinated ammonium surfactant has a longer fluorinated tail. The surfactant is
commercially available (Fluorad FC135), and the charge density of the polymers is in the range 20–
100 mol%. Mixing equimolar amounts of polyelectrolyte (see Fig. 42, structure D2a to D2d) and a
fluorinated surfactant resulted in complexes which precipitated immediately. After purification by
washing with water, the complexes have been dried in a vacuum, subsequently dissolved in
trifluoroethanol and then cast onto wafers to form transparent films.
2.2.2.1. Thermal properties. The thermal behavior of the complexes has been investigated by DSC and
TGA. Typical DSC thermograms are shown in Fig. 43. It is found that all the complexes show glass
350 400 450 5000.0
0.4
0.8
1.2
1.6(a)
Inte
nsity
[arb
.uni
ts]
Wavelength [nm]350 400 450 500
(b)
Fig. 41. Steady-state fluorescence spectra of complex D1b (dotted lines) and D1d (solid lines). The measurements are
performed on solution (figure left) and on free-standing films (figure right). The excitation wavelength is 293 nm. Reprinted
with permission from Macromolecules 1999;32:7414 q American Chemical Society [60].
A.F. Thunemann / Prog. Polym. Sci. 27 (2002) 1473–15721520

transitions at 71 ^ 3 8C. This result is somewhat surprising because one would have expected the glass
transition to depend on the composition of the polymer. In accordance with the general properties of
polyelectrolytes, no glass transitions are found for the pristine diazosulfonate polymers before the
decomposition of the diazo groups taken place.
Above the glass transition of all complexes, no further thermal transitions have been detected. From
this it is concluded that the complexes are stable up to 180 8C. TGA measurements show that no
significant weight loss of any of the complexes can be observed below 180 8C, which confirms the DSC
1-xCH2 CH
NHO
N
NSO3
CH2 CR
CO O
R
x Complex x R
0.20 CH0.30 H0.50 H1.00 H
D2aD2b
D2dD2c
(
(
N(CH3)3
CH2)3
NH
SO2
CF2)7
CF3
3
Fig. 42. Complexes of poly[(acrylamidophenyldiazosulfonate)-co-(methacrylate)] (D2a) and poly[(acrylic acid)-co-
(acrylamidophenyldiazosulfonate)] (D2b) to (D2d). Reprinted with permission from Macromolecules 2000;33:5665 q
American Chemical Society [63].
-60 -40 -20 0 20 40 60 80 100 120 140 160 180
0.2
0.4
0.6
0.8
1.0
Tg
complex D2a
complex D2d
Hea
tFlo
w[m
W/m
g]
T [ ˚C]Fig. 43. DSC thermograms of the complexes of D2a and D2d during heating (second heating cycle). Reprinted with permission
from Macromolecules 2000;33:5665 q American Chemical Society [63].
A.F. Thunemann / Prog. Polym. Sci. 27 (2002) 1473–1572 1521
results. It is found that significant decomposition starts only above 200 8C, and further, that the
maximum decomposition rate of the complexes occurs in the range 230–240 8C. It is found that the
complexes with higher charge densities are slightly more stable than the complexes with lower charge
densities. The decomposition process is regarded as the thermal decomposition of the azo groups. This
assumption is supported by an investigation of the thermal decomposition of diazosulfonate containing
polymers and surfactants [61]. Therefore, it is concluded that the thermal stability of the complexes is
predominantly determined by the stability of the polymer.
2.2.2.2. Structure in the bulk material. The molecular and supramolecular structures of the complexes
have been examined using wide- and small-angle X-ray scattering methods. In the wide-angle scattering
diagram of all complexes one single broad peak is found. The peak maxima of all complexes correspond
to a Bragg spacing of 0.52 nm. This is attributed to the amorphous packing of the fluorinated chains
(C8F17), in powder, as well as in film samples, which is similar to the packing of shorter chains (C6F13) in
complexes described in Section 2.2.1. By contrast a number of sharp reflections are found in the wide-
angle scattering diagram of the pure surfactant which proves that it is a crystalline material. As for
different types of complexes described earlier, it is concluded that the crystallization of the surfactant
can be strongly reduced as a result of the complexation. The reason for this is that any movement of the
surfactant in the complex is accompanied by a rearrangement of the polymeric backbone via the ionic
bonds. It is found that a high charge density and a C9F19 chain of the fluorinated moieties is necessary to
produce a side-chain crystalline structure in the complex (Section 2.1.3).
The presence of sharp reflections in the small-angle scattering curves of the complexes proves that the
charge density of all diazosulfonate polymers is sufficiently high for the formation of periodic
nanostructures. This confirms that a charge density of at least 25% is necessary to form ordered complex
structures (Section 2.1.3) The width of the most intense reflection is smaller for the complexes of
medium charge densities (D2b, D2c) than it is for the complexes with either a low or a high charge
density (D2a and D2d). For the former, reflections of a higher order are present with relative positions of
1:2:3. Together with the results from the wide-angle scattering and the DSC, it is concluded that the
complexes are isomorphous with a lamellar structure of a smectic A type. From the reflex positions, the
long periods have been determined to be 4.4 nm (D2a), 3.8 nm (D2b), 3.9 nm (D2c), and 4.0 nm (D2d).
This is in agreement with a multilayer structure of alternating fluorinated and ionic sheets. From the
integral width of the first-order reflection, the correlation lengths [64] of the complexes have been
determined to be 10 nm (D2a), 30 nm (D2b), 45 nm (D2c), and 11 nm (D2d). Therefore, the complexes
D2b and D2c, which have medium charge densities of 30 and 50%, are better ordered than the complexes
with the lowest and highest charge densities (D2a and D2d). Probably, the steric constraints within the
structure of the complexes are reduced to an optimum at a charge density of about 50 mol% for the
diazosulfonate groups.
2.2.2.3. Ultra-thin films. Thin complex films on silicon wafers can be prepared by the spin-coat
technique from complex solutions and investigated by X-ray reflectivity. Examples of reflectivity curves
of ultra-thin films are shown in Fig. 44. Well-defined double-layer stacks are developed within a few
seconds simply as a result of the deposition of droplets of the complex solution.
It has been found that complex D2c, which has the highest correlation length in the bulk material,
forms also the best ordered films. In Fig. 44(a), the presence of Kiessig fringes indicate a smooth
complex film. A thickness of 4.0 ^ 0.5 nm has been calculated from the angular position of the fringes
A.F. Thunemann / Prog. Polym. Sci. 27 (2002) 1473–15721522

[51]. In the diagrams of films of larger thickness, three equidistant Bragg peaks appear. The peak
positions result in lamellar spacings which are equal, or slightly larger than, that of the complexes in the
materials in bulk form. As an example, Fig. 44(b) shows the scattering curve of a film of complex D2c
with a lamellar spacing of 4.0 nm and a correlation length between 36 and 40 nm. Because the same
nanostructure has been developed in a slow film forming process (solvent casting) and in a fast film
forming process (spin coating), it is concluded that the time which is necessary for the formation of the
mesophase is shorter than the time necessary for the formation of the films. The latter is in the order of
1 s.
The structure of a film producing a scattering curve such as that in Fig. 44(b) can be explained as
consisting of multi-layers aligned parallel to the wafer surface. The macroscopic orientation of
complexes to multi-layers with a variability of about two orders of magnitudes in their thicknesses is
described in detail in Section 2.1.7. Such polymer multilayers produced in a single-step procedure are of
interest in the formation of self-assembled organic multilayer films.
In order to determine the elemental composition at the film surfaces X-ray photo-electron
spectroscopic (XPS) measurements are carried out. In this surface spectroscopic experiment, the sample
of interest is irradiated with Mg Ka X-rays. The kinetic energy of the emitted photoelectrons are
measured. Since the mean free path of the ejected photoelectron controls the analysis depth, an analysis
of the outer 5 nm of the polymeric surface can be obtained by changing the angle of the sample surface
relative to the collection aperture of the spectrometer. The complex coated silicon wafers are examined
using this approach and they are compared with the average complex composition in the bulk material.
The results are shown in Table 11. It can be seen there that the fluorine content at the surface of all the
complexes is higher than that of the calculated average bulk composition. Furthermore, the fluorine
content depends strongly on the take-off angle. The take-off angle is defined as the angle between the
sample surface and the detector. At the lower take-off angle of 458, which corresponds to the lower
sampling depth of roughly 3 nm, the detected amount of fluorine increases from 41 to 46 at% in the
0.2 0.4 0.6 0.8 1.0100
101
102
103
104
105
Inte
nsity
[arb
.uni
ts]
s [nm-1]
(b)
(a)
Fig. 44. X-ray reflectivity curves of thin films of complex D2b on silicon wafer surfaces. The film thicknesses are 4 nm (curve a)
and about 40 nm (curve b). Reprinted with permission from Macromolecules 2000;33:5665 q American Chemical Society
[63].
A.F. Thunemann / Prog. Polym. Sci. 27 (2002) 1473–1572 1523

series from complex D2a to D2d. These values are significantly higher than the average values of the
fluorine content of the complexes, which increase from 21 to 32 at%, and indicate an enrichment of the
fluorine groups at the complex surfaces.
High-resolution spectra have been collected in the region of the carbon 1s in order to estimate the
CF2/CF3 ratios. Typical examples for take-off angles of 90 and 458 are given in Fig. 45 for complex D2b.
Discrete peaks at binding energies of 292 and 294 eV are assigned to the CF2 and CF3 functional groups
and show clearly the (CF2)7–CF3 chains at the air/complex interface. The ratios of the CF3 to CF2 groups
are about 0.24 and 0.35 for take-off angles of 90 and 458, respectively. Both values are significantly
higher than the value calculated for the average composition (0.14). This confirms the assumption that
the fluorinated chains are oriented towards the air/complex surface. It is found that the polymer
Table 11
XPS data for complex coated silicon wafers
Complex Exit angle Atom%
Experimental Theorya
C F N O S C F N O S
D2a 90 45.1 28.6 4.9 17.9 3.5 53.1 20.9 6.2 17.3 2.5
45 38.2 41.4 4.1 13.4 2.9
D2b 90 47.0 33.4 5.7 11.8 2.1 46.4 26.3 7.7 16.5 3.1
45 38.9 43.0 4.6 11.0 2.5
D2c 90 44.7 33.4 5.7 13.7 2.5 44.8 29.3 8.6 13.8 3.5
45 39.2 42.4 4.6 11.3 2.5
D2d 45 37.4 46.2 4.7 9.0 2.7 43.4 32.1 9.4 11.3 3.8
Reprinted with permission from Macromolecules 2000;33:5665 q American Chemical Society [63].a Values represent the bulk composition of a stoichiometric complex.
275 280 285 290 295 300
45 ˚
90 ˚
CF3
CF2
CF3
CF2
Inte
nsity
[arb
.uni
ts]
Binding Energy [eV]Fig. 45. XPS carbon 1s core-level spectra of complex D2b films on silicon wafer. The take-off angles are 908 (lower curve) and
458 (upper curve). Reprinted with permission from Macromolecules 2000;33:5665 q American Chemical Society [63].
A.F. Thunemann / Prog. Polym. Sci. 27 (2002) 1473–15721524
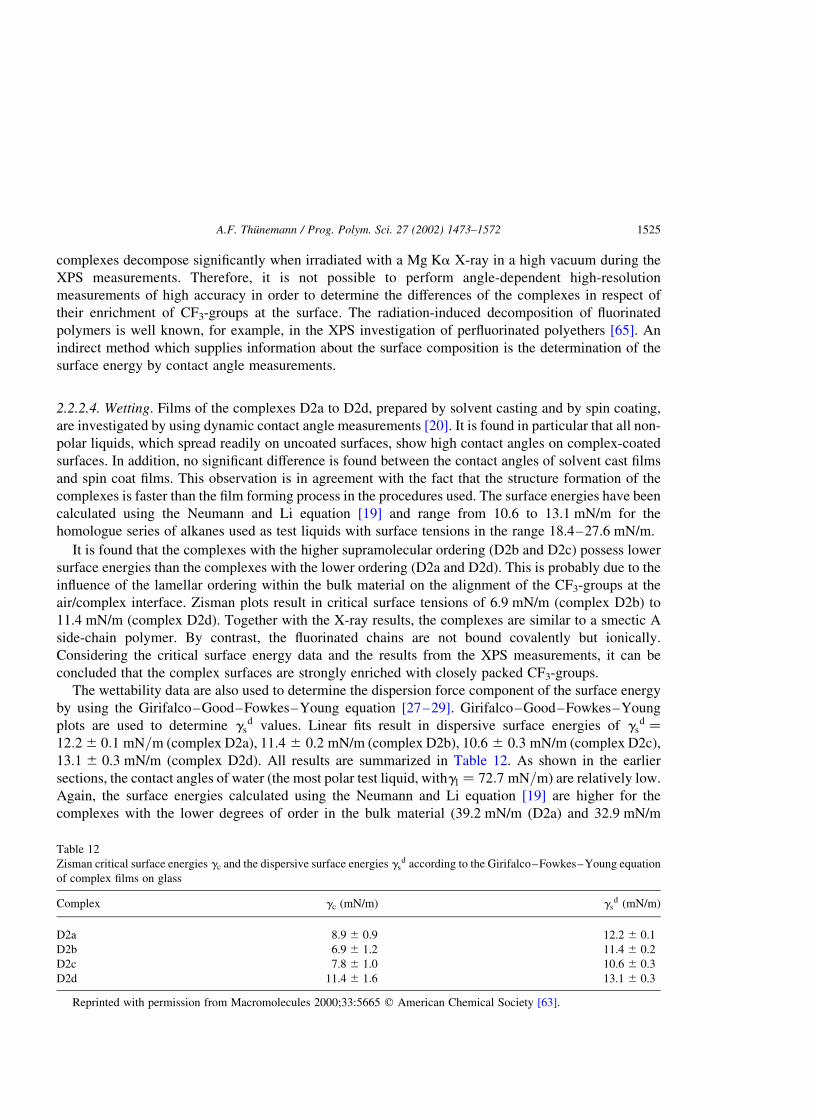
complexes decompose significantly when irradiated with a Mg Ka X-ray in a high vacuum during the
XPS measurements. Therefore, it is not possible to perform angle-dependent high-resolution
measurements of high accuracy in order to determine the differences of the complexes in respect of
their enrichment of CF3-groups at the surface. The radiation-induced decomposition of fluorinated
polymers is well known, for example, in the XPS investigation of perfluorinated polyethers [65]. An
indirect method which supplies information about the surface composition is the determination of the
surface energy by contact angle measurements.
2.2.2.4. Wetting. Films of the complexes D2a to D2d, prepared by solvent casting and by spin coating,
are investigated by using dynamic contact angle measurements [20]. It is found in particular that all non-
polar liquids, which spread readily on uncoated surfaces, show high contact angles on complex-coated
surfaces. In addition, no significant difference is found between the contact angles of solvent cast films
and spin coat films. This observation is in agreement with the fact that the structure formation of the
complexes is faster than the film forming process in the procedures used. The surface energies have been
calculated using the Neumann and Li equation [19] and range from 10.6 to 13.1 mN/m for the
homologue series of alkanes used as test liquids with surface tensions in the range 18.4–27.6 mN/m.
It is found that the complexes with the higher supramolecular ordering (D2b and D2c) possess lower
surface energies than the complexes with the lower ordering (D2a and D2d). This is probably due to the
influence of the lamellar ordering within the bulk material on the alignment of the CF3-groups at the
air/complex interface. Zisman plots result in critical surface tensions of 6.9 mN/m (complex D2b) to
11.4 mN/m (complex D2d). Together with the X-ray results, the complexes are similar to a smectic A
side-chain polymer. By contrast, the fluorinated chains are not bound covalently but ionically.
Considering the critical surface energy data and the results from the XPS measurements, it can be
concluded that the complex surfaces are strongly enriched with closely packed CF3-groups.
The wettability data are also used to determine the dispersion force component of the surface energy
by using the Girifalco–Good–Fowkes–Young equation [27–29]. Girifalco–Good–Fowkes–Young
plots are used to determine gsd values. Linear fits result in dispersive surface energies of gs
d ¼
12:2 ^ 0:1 mN=m (complex D2a), 11.4 ^ 0.2 mN/m (complex D2b), 10.6 ^ 0.3 mN/m (complex D2c),
13.1 ^ 0.3 mN/m (complex D2d). All results are summarized in Table 12. As shown in the earlier
sections, the contact angles of water (the most polar test liquid, withgl ¼ 72:7 mN=mÞ are relatively low.
Again, the surface energies calculated using the Neumann and Li equation [19] are higher for the
complexes with the lower degrees of order in the bulk material (39.2 mN/m (D2a) and 32.9 mN/m
Table 12
Zisman critical surface energies gc and the dispersive surface energies gsd according to the Girifalco–Fowkes–Young equation
of complex films on glass
Complex gc (mN/m) gsd (mN/m)
D2a 8.9 ^ 0.9 12.2 ^ 0.1
D2b 6.9 ^ 1.2 11.4 ^ 0.2
D2c 7.8 ^ 1.0 10.6 ^ 0.3
D2d 11.4 ^ 1.6 13.1 ^ 0.3
Reprinted with permission from Macromolecules 2000;33:5665 q American Chemical Society [63].
A.F. Thunemann / Prog. Polym. Sci. 27 (2002) 1473–1572 1525

(D2d)) than for the complexes with the higher degrees of order (23.0 mN/m (D2b) and 24.8 mN/m
(D2c)).
The low surface energies determined for non-polar liquids are reproduced, even when the complex
coated surfaces are dried after exposure to water. This indicates a reversible surface reconstruction of the
complex surface after it has been in contact with water. The surface reconstruction of the complex when
in contact with water seems to be very fast as shown by the static constant contact angle of water which
adjusts to an equilibrium within a few seconds. The degree and speed of surface reconstruction is
assumed to be dependent on several factors, such as the number of polar groups within a distance of
about 1 nm from the surface. Taking into account the correlation lengths, there seems to be an optimum
at a content of about 30–50 mol% of charged monomers in forming low energy surfaces and in forming
ordered structures. Thin coatings of the complexes seem to be promising for the development of surfaces
which can be switched irreversibly from ultra-low energy surfaces to a high energy surfaces by using a
laser beam.
2.3. Polyelectrolyte–silicon–surfactant complexes [66]
Many silicon compounds are able to reduce the surface energy of materials, which is responsible for
many applications. The origins of these unusual and useful properties are closely related to silicons’
unique chemistry [67]. Silicon-containing surfactants have been successfully used as auxiliaries in the
manufacturing and processing of paints and coatings [68,69]. They are also valuable as surface-active
ingredients in the textile and fiber industries, acting as emulsifiers, softeners, etc. [70].
The aggregation behavior of silicon-containing surfactants has been investigated in detail by small-
angle neutron and static light scattering, where, for example, hexagonal and lamellar mesophases are
found in concentrated aqueous solution [71]. Nothing has yet been reported on the formation of ordered
structures, on a nanometer scale, in solid polyelectrolyte–silicon–surfactant complexes. Comparable
complexes of fluorine-containing surfactants and polyelectrolytes have been described in Sections
2.1.1–2.2.2.
This section reports on the properties of the complexes PD-Sa and PD-Sb, which are formed using the
cationic polyelectrolyte, poly(diallyldimethylammonium chloride) (PD), the anionic surfactants
isopropylammonium 6-(trimethylsilyl)-n-hexyl sulfate (Sa) and isopropylammonium [3-(1,1,3,3,5,5,5-
heptamethyltrisiloxan-1-yl)hexyl-1-sulfate] (Sb). The complex formation is schematically shown in
Fig. 46. Polyelectrolyte PD has been chosen because it has already been used successfully for various
solid complexes, e.g. with lipids [72], amphiphilic drugs [73], and fluorinated surfactants [12]. The
silicon surfactant with only one trimethyl group has been chosen for different reasons. First, salts of
sulfatic esters have excellent surfactant properties combined with good hydrolysis stability [74], and
second, it is known that the chemical and physical behavior of silicon compounds, e.g. their high
flexibility, is different from that of their carbon analogous. The experience with non-silyl-containing
complexes can be transferred to silicon-containing surfactants if the influence of silicon is not
predominant. Additionally only atoms at, or near, the film/air interface are responsible for the surface
energy. A perfect alignment of (CH3)3Si groups at the film surface interface results in a surface energy
significantly lower than that found for high molecular weight poly(dimethylsiloxane) (24 mN/m) [67]. In
principle, one trimethylsilyl moiety at the tail of the surfactant may be enough to form a low-energy
surface material. For example, sodium methyl siliconate (CH3Si(OH)2ONa) is used successfully in the
hydrophobizing of walls while maintaining permeability for moisture [75]. The trisiloxanylhexamethyl
A.F. Thunemann / Prog. Polym. Sci. 27 (2002) 1473–15721526

sulfate Sb has been synthesized in order to compare the influence of a single silyl group Sa with a
trisiloxane in the structure and surface energy of equivalent complexes.
The complexation of PD with Sa and Sb produces the ionic complexes PD-Sa and PD-Sb (Fig. 46).
The complexes are processed as transparent and flexible films by solvent casting and spin coating. Free-
standing films with thicknesses down to 50 mm are produced by the solvent cast procedure. Because of
their physicochemical relationship to the polyelectrolyte–fluorosurfactant complexes, self-assembled
structures are expected for the complexes PD-Sa and PD-Sb.
2.3.1. Nanostructures
To study the mesomorphic character of the complexes, small-angle X-ray scattering experiments have
been conducted (powder and films). The resulting scattering curves are shown in Fig. 47. In the
scattering curves of both complexes, an intense maximum that confirms the assumption of a microphase-
separated system is found. The reflex positions and widths revealed further that complex PD-Sb has a
larger, less ordered structure than that of PD-Sa. No reflections of a higher order are present, which does
not allow the precise assignment of the phase structure. To obtain this information, a more detailed
evaluation of the data has to be carried out. For determining the long period, the smearing effect of the
camera has to be taken into account (Section 2.2.1.1). To determine the corrected reflex positions sh and
widths b, Eq. (1.1) is used resulting in da ¼ 1=sa ¼ 2:63 nm; db ¼ 1=sb ¼ 3:57 nm; ba ¼ 0:086 nm21;and bb ¼ 0:140 nm21 (Fig. 47), where a corresponds to complex PD-Sa and b to complex PD-Sb. The
results obtained from the refined evaluation of the X-ray data have been confirmed by molecular
modeling calculations.
Si
CH3
CH3
OSiCH3
CH3
CH3
(CH2)6 O
O
O
SO
PD-Sa (p=0)PD-Sb (p=2)
pp
n
Cl- NH3O
S OO
O
CH2)6
H3C CH3CH3
Si
O
H3C CH3Si
(
NCH3H3C
NH3
Complexation
Sa (p=0)Sb (p=2)
P
SolidSolution
Cl
nNCH3H3C
Fig. 46. Sketch of complex formation: (PD) poly(diallyldimethylammonium chloride); (S) isopropylammonium 6-
(trimethylsilyl)-n-hexyl sulfate ( p ¼ 0, Sa) isopropylammonium [3-(1,1,3,3,5,5,5-heptamethyltrisiloxan-1-yl)hexyl-1-sulfate]
( p ¼ 2, Sb); (PD-Sa and PD-Sb) stoichiometric polyelectrolyte–silicon–surfactant complexes. Reprinted with permission
from Langmuir 1998;14:6220 q American Chemical Society [66].
A.F. Thunemann / Prog. Polym. Sci. 27 (2002) 1473–1572 1527

Calculating a lamellar, smectic A-like structure consisting of alternating polyelectrolyte and
surfactant layers gives ca. 2.6 nm for PD-Sa and ca. 3.5 nm for PD-Sb. From the sh and b values, it is
assumed that PD-Sa and PD-Sb are isomorphous but that PD-Sb has a larger and less perfect structure
than PD-Sa. Further information about the structures is obtained from the asymptotic decrease of the
scattering curves. At values in the range 0.5–0.8 nm21, the scattered intensity decreases with the third
power of the scattering vector. This is in accordance with Porod’s law (Section 2.2.1.1), a strong
Fig. 47. Small-angle X-ray curves of complexes PD-Sa (a) and PD-Sb (b) and fits according to Eq. (1.1). Reprinted with
permission from Langmuir 1998;14:6220 q American Chemical Society [66].
0.0 0.1 0.2 .3
0
10
20
30
40
50
60
(b)
(a)
s3In
tens
ity
s3 [ nm-3]0
Fig. 48. s 3J–s 3 plots of the small-angle X-ray scattering of complexes PD-Sa (a) and PD-Sb (b) and their ideal behavior
according to Porod’s law for PD-Sa (dashed line) and PD-Sb (dotted line). Reprinted with permission from Langmuir
1998;14:6220 q American Chemical Society [66].
A.F. Thunemann / Prog. Polym. Sci. 27 (2002) 1473–15721528

indication for a two-phase system with sharp interface boundaries. The main source of error in the range
of validity of Porod’s law is the scattering due to density fluctuations and the width of the domain
boundary [6]. The linear behavior of the scattering curve in a s3JðsÞ–s3 plot (Fig. 48) proves that the only
deviation from Porod’s law is a three-dimensional homogeneous density fluctuation, which is given by
the slope of the straight line. A broader transition of a statistical structuring of the domain boundary, as is
typically observed for microphase-separated block copolymers [7] can be excluded. Small deviations
from a sharp boundary would lead to strong and significant deviations from Porod’s law (Section 1.4.2).
Therefore, it is concluded that the phase boundaries of both complexes are in the order of 1 or 2 atomic
distances. Using Eq. (1.5), the average chord lengths are calculated to be 1.23 nm (complex PD-Sa) and
1.27 nm (complex PD-Sa). It should be noted that the values for the average cord length of both
complexes are similar, although the d values are very different. The complexes are microphase
separated, constructed of a smaller ionic phase (polyelectrolyte plus sulfonate head groups) and a larger
non-ionic phase (hydrophobic moieties). Regarding the definition of the cord length, it becomes clear
that the smaller distances are much more highly weighted than the larger.
From the similarity of both cord lengths, it is concluded that the ionic phases PD-Sa and PD-Sb are
nearly identical. In the special case of a lamellar two phase system, the parameter lp. is in the range of
0 # lp # ðd1 þ d2Þ=2 ¼ L=2 (Section 1.4.3). From experimental analysis the long period of PD-Sa is
2.63 nm; the maximum value, lp,max, is theoretically 1.32 nm. Other mesophases show smaller
maximum values of lp. Therefore, although no higher order reflexes are observed in the small-angle
X-ray scattering curve, a lamellar mesophase structure and flat lamellar surfaces are assumed to be very
likely for complex PD-Sa. This is different from the highly undulated lamellae found for
polyelectrolyte–lipid complexes reported previously [72,76].
In contrast to the complexes with undulated surfaces, the silicon surfactant Sa is monodisperse, has a
very short alkyl chain, and, in addition to a bulky head group ½SO42�; also has a large tail group [Si-
(CH3)3]. The same considerations for PD-Sb do not allow an unambiguous determination of the
mesophase of this complex. The long period of a lamellar system d is given by d ¼ d1 þ d2; where d1
and d2 are the thicknesses of the two lamellae. Their values are determined by calculating the interface
distribution function (Section 1.1.3). In Fig. 49 the interface distribution functions computed from the
scattering curves and the best fits using the stack model are plotted. For complex PD-Sa, this results in
d ¼ 2:58 nm; d1 ¼ 1:03 nm; and d2 ¼ 1:55 nm: For complex PD-Sb the values are d ¼ 3:34 nm; d1 ¼
1:03 nm; and d2 ¼ 2:31 nm: The smaller lamellar type for both complexes have the same thickness.
These 1.03 nm-thick lamellae are formed by polyelectrolyte chains and sulfate groups, which are very
likely to be identically structured for both complexes. The 1.55 nm-thick lamellae of PD-Sa consist of –
(CH2)6Si–(CH3)3 groups, and the 2.31 nm-thick lamellae of PD-Sb consist of –(CH3)6Si(CH3)2-
OSi(CH3)2OSi(CH3)3 groups. In addition to the lamellar thickness, the curvature of the interface
between ionic and non-ionic domains is an important feature for the description of the morphology of the
complexes. A measure of the planarity of the interface is obtained from the ratio S=S0 ¼ ð2d1d2Þ=ðdlpÞ
(Section 1.1.3). The surface ratio is calculated to be 1.01 for PD-Sa and to be 1.12 for PD-Sb. It is
concluded that the lamellar surface of PD-Sa are perfectly planar (see Fig. 49 inset) and those of PD-SB
show only small undulations. Obviously, the surfaces of these complexes show almost no curvature and,
therefore, have a low curvature energy. This finding stands in contrast to those polyelectrolyte–
lipid complexes, for example, some of whose lamellar mesophases show high undulations with
S=S0 values up to 1.38 [72]. The lipids of the complexes described there have a broad alkyl chain length
and head group distribution. Further, Antonietti et al. have shown that the undulations of
A.F. Thunemann / Prog. Polym. Sci. 27 (2002) 1473–1572 1529

poly(styrenesulfonate)-alkyltrimethylammonium surfactant complexes increase with increasing alkyl
chain length. The lack of undulations of complex PD-Sa is attributed to the small hydrophobic chain
length and an appropriate charge density of the polyelectrolyte PD. The small undulations of PD-Sb can
be explained by the packing disorder of the bulky siloxane groups.
As is frequently observed for solid polyelectrolyte–surfactant complexes, wide-angle X-ray
scattering measurements confirm that the complexes PD-Sa and PD-Sb are non-crystalline. The
absence of crystallinity in the complexes is confirmed by DSC. The glass transitions are at 210 8C (PD-
Sa) and 256 8C (PD-Sb). These low glass transitions explain the high flexibility of the films at room
temperature. The lower glass transition of PD-Sb compared to PD-Sa is due to the high flexibility of the
siloxane segments of the surfactant.
2.3.2. Wetting
Surface energies of films of the complexes PD-Sa and PD-Sb are determined by contact angle
measurements with different test liquids: water, glycerol, and methylene iodide. The use of the Neumann
and Li equation [19] results in surface energies in the range 36–39 mN/m for complex PD-Sa and 20–
22 mN/m for complex PD-Sb (Table 13).
In contrast to the fluorinated complexes of the Sections 2.3.1 liquids with low polarity, e.g. decane,
are rapidly adsorbed and spread on surfaces of both complexes. The surface energies calculated for PD-
Sb are close to those of the dimethylsiloxane surfaces (21–23 mN/m) [67]. The surface energy of PD-Sb
approximates that of a relatively closed packed array of methyl groups. The surface energy of PD-Sa is
significantly higher that that of PD-Sb comparable, for example, with values reported for poly(ethylene
terephthalate) surfaces (35–36 mN/m) [19]. It has been explained that both complexes are well-ordered
Fig. 49. Interface distribution functions computed from the experimental values for complexes PD-Sa (squares) and PD-Sb
(circles). The solid line is the theoretical curve for complex PD-Sa with lamellar thicknesses of d1 ¼ 1:03 nm and d2 ¼
1:55 nm: The dashed line is the theoretical curve for complex PD-Sb with d1 ¼ 1:03 and d2 ¼ 2:31 nm: The inset shows a
model of the layer structure. The polyelectrolyte phase is plotted gray. Surfactant molecules fill the space between the
polyelectrolyte phases (not drawn). Reprinted with permission from Langmuir 1998;14:6220 q American Chemical Society
[66].
A.F. Thunemann / Prog. Polym. Sci. 27 (2002) 1473–15721530
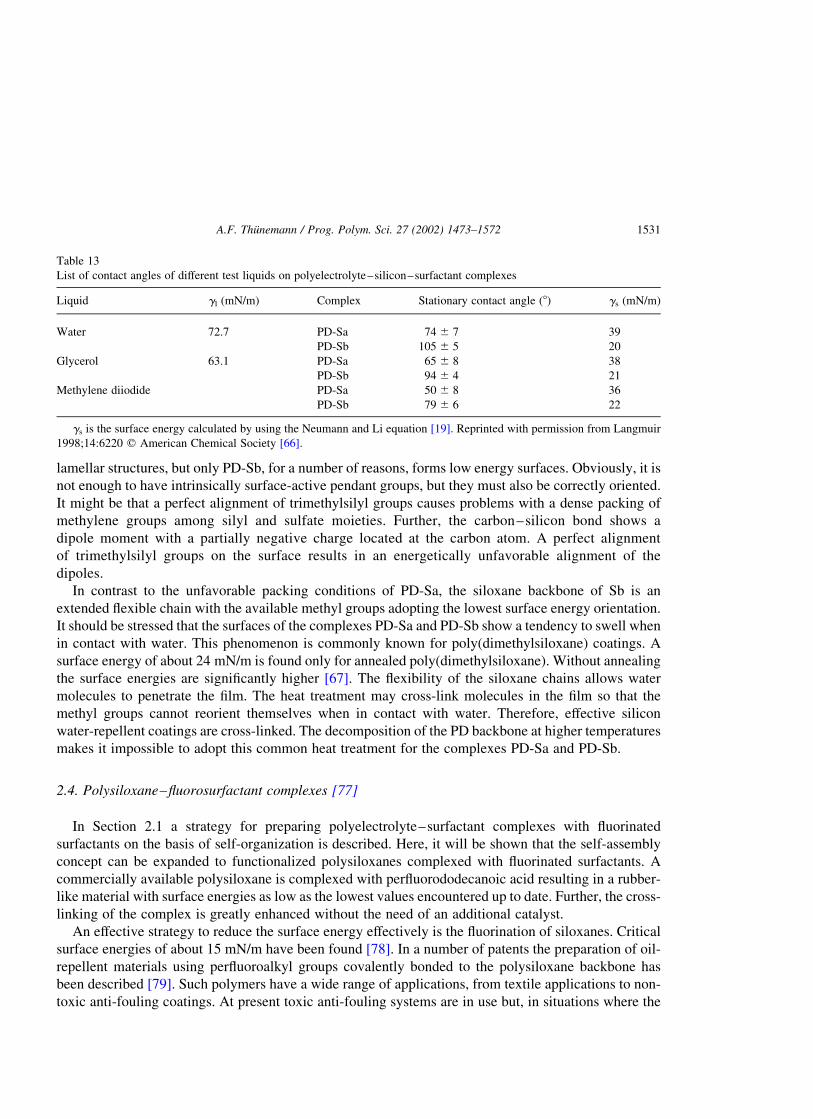
lamellar structures, but only PD-Sb, for a number of reasons, forms low energy surfaces. Obviously, it is
not enough to have intrinsically surface-active pendant groups, but they must also be correctly oriented.
It might be that a perfect alignment of trimethylsilyl groups causes problems with a dense packing of
methylene groups among silyl and sulfate moieties. Further, the carbon–silicon bond shows a
dipole moment with a partially negative charge located at the carbon atom. A perfect alignment
of trimethylsilyl groups on the surface results in an energetically unfavorable alignment of the
dipoles.
In contrast to the unfavorable packing conditions of PD-Sa, the siloxane backbone of Sb is an
extended flexible chain with the available methyl groups adopting the lowest surface energy orientation.
It should be stressed that the surfaces of the complexes PD-Sa and PD-Sb show a tendency to swell when
in contact with water. This phenomenon is commonly known for poly(dimethylsiloxane) coatings. A
surface energy of about 24 mN/m is found only for annealed poly(dimethylsiloxane). Without annealing
the surface energies are significantly higher [67]. The flexibility of the siloxane chains allows water
molecules to penetrate the film. The heat treatment may cross-link molecules in the film so that the
methyl groups cannot reorient themselves when in contact with water. Therefore, effective silicon
water-repellent coatings are cross-linked. The decomposition of the PD backbone at higher temperatures
makes it impossible to adopt this common heat treatment for the complexes PD-Sa and PD-Sb.
2.4. Polysiloxane–fluorosurfactant complexes [77]
In Section 2.1 a strategy for preparing polyelectrolyte–surfactant complexes with fluorinated
surfactants on the basis of self-organization is described. Here, it will be shown that the self-assembly
concept can be expanded to functionalized polysiloxanes complexed with fluorinated surfactants. A
commercially available polysiloxane is complexed with perfluorododecanoic acid resulting in a rubber-
like material with surface energies as low as the lowest values encountered up to date. Further, the cross-
linking of the complex is greatly enhanced without the need of an additional catalyst.
An effective strategy to reduce the surface energy effectively is the fluorination of siloxanes. Critical
surface energies of about 15 mN/m have been found [78]. In a number of patents the preparation of oil-
repellent materials using perfluoroalkyl groups covalently bonded to the polysiloxane backbone has
been described [79]. Such polymers have a wide range of applications, from textile applications to non-
toxic anti-fouling coatings. At present toxic anti-fouling systems are in use but, in situations where the
Table 13
List of contact angles of different test liquids on polyelectrolyte–silicon–surfactant complexes
Liquid gl (mN/m) Complex Stationary contact angle (8) gs (mN/m)
Water 72.7 PD-Sa 74 ^ 7 39
PD-Sb 105 ^ 5 20
Glycerol 63.1 PD-Sa 65 ^ 8 38
PD-Sb 94 ^ 4 21
Methylene diiodide PD-Sa 50 ^ 8 36
PD-Sb 79 ^ 6 22
gs is the surface energy calculated by using the Neumann and Li equation [19]. Reprinted with permission from Langmuir
1998;14:6220 q American Chemical Society [66].
A.F. Thunemann / Prog. Polym. Sci. 27 (2002) 1473–1572 1531

use of biocides is restricted, silicone elastomeric coatings are accepted as a viable alternative to
traditional anti-fouling treatment [80,81].
In view of present political demands [82], effective non-toxic anti-fouling coatings will play a
technologically key role in the near future, especially for the protection of ship hulls. An important factor
which influences the performance and effectiveness of such silicone coatings is their surface energy. For
example, measurement of liquid barnacle repellent indicates that coatings with a surface free energy
lower than 12 mN/m are required to prevent attachment [83]. This value is very much lower than that
found for standard low energy surfaces made of polytetrafluoroethylene (19 mN/m) [84] or high
molecular weight polysiloxanes (24 mN/m) [67]. Only surfaces highly enriched with CF3-groups can
achieve such surface energies.
2.4.1. Wetting
To prepare water-stable ultra-low energy surfaces an amino-functionalized polydimethylsiloxane
(PDMS) is used for complexation (Fig. 50). PDMS is a commercially available silicone oil, widely used
to give textile fabrics a softer texture [85]. For a good adhesion of PDMS on a textile fabric, about 0.6–
2.4 mol% of its monomer units are functionalized with aminoethyl aminopropyl groups. The
polysiloxane is end capped with hydroxyl functions by which it can be condensed. For complexation,
perfluorododecanoic acid, dissolved in a 2-butanol/methanol mixture, is added to PDMS, resulting in a
transparent complex solution. To reduce the viscosity of the polysiloxane and for the homogeneity of the
mixture, the PDMS is diluted with hexane. By removing the solvent in a vacuum, highly viscous films
with smooth surfaces are formed.
At elevated temperatures, in the range from 120 to 200 8C, the films are cross-linked. To be sure that
traces of weakly bound acid are removed, the films are immersed in large volumes of water for 24 h.
Then, dynamic contact angles, u of test liquids with different surface tensions are measured by means of
the sessile drop method [20]. Data are given for complexation degrees of 100, 50 and 0%, which
correspond to the ratios of amino to carboxylic acid groups of 1:1, 1:0.5 and 1:0 (Table 14). Surfaces of
the pure polysiloxane are hydrophobic ðu ¼ 988Þ but not oleophobic, i.e. decane and dodecane spread on
the polysiloxane surface. By contrast, with increasing fluorine content, the complex surfaces become
HO Si O
CH3
CH3
Si O
CH3
CH3
Si
CH3
CH2)3
O
NH CH2CH2NH2
Si
CH3
CH3
OH
m(
n
PDMS
C12
F3C (CF2)10 COOH
n(
R Si
CH3
CH2)3
O
NH CH2CH2NH2
Si
CH3
CH3
OH
H H
PDMS-C12
C
CF2)p-2
OO
CF3
( (
C
CF2)p-2
OO
CF3
Fig. 50. Sketch of complex formation: (PDMS) amino-functionalized polysiloxane with hydroxyl end groups. The monomers of
0.6 mol% contain aminoethyl aminopropyl groups; (C12) perfluorododecanoic acid; (PDMS–C12) stoichiometric
polysiloxane–surfactant complex. Reprinted with permission from J Mater Chem 2001;11:381 q The Royal Society of
Chemistry [77].
A.F. Thunemann / Prog. Polym. Sci. 27 (2002) 1473–15721532

more hydrophobic and reach a maximum of water- and oil-repellency at a complexation degree of about
50%. It can be seen that the contact angles of water are 1308 for a complexation degree of 50% and 1318
for 100%. The corresponding values of hexadecane are 84 and 858, those for decane are 75 and 788. For
an adsorbed monolayer of perfluorododecanoic acid Zisman reported values of 1058 for water (which is
erratic because of dissolution) 788 for hexadecane and 708 for decane. Obviously, the contact angles of
the different liquids on complex surfaces are larger than on the corresponding monolayer surfaces.
To be sure that the high contact angles found for complex PDMS-C12 surfaces are not due to
roughness, the surfaces are investigated by scanning electron microscopy. It is found that all
polysiloxane complex surfaces are very smooth on length scales in the range from several millimeters
down to values lower than a micrometer. Therefore, roughness can be excluded as being responsible for
the high contact angles of the complex surfaces, and dynamic contact angles are considered meaningful
as a measure of the surface energy. The surface energies are calculated using the Neumann and Li
equation [19] (Table 14). The values, as calculated for the different test liquids, range between 6.8 and
9.9 mN/m for a complexation degree of 50 and 100%, which is very much lower than that of the non-
complexed polysiloxane (24.3–26.3 mN/m). Second, using the procedure introduced by Zisman [26], an
extremely low critical surface tensions of about 6 mN/m is found for a complexation degree of 50% as
well as that for 100%. These values are determined after an immersion time of 24 h in water to be sure
that any slightly adsorbed acid have been removed. The Girifalco–Good–Fowkes–Young equation
[27–29] is used to determine the dispersion force component of the surface energy, gsd: Nearly
identically low values are determined for complexation degrees of 50% ðgsd ¼ 9:0 mN=mÞ and for
100% (8.4 mN/m). This may be interpreted as a saturation of the complex surface by CF3-groups even at
a complexation degree of 50%.
Table 14
Contact angles of different test liquids of WR1100-C12 film cured for 12 h at 125 8C
Complexation degree 0 50% 100%
Fluorine content
(w/w)
0% 4.58% 8.76%
Storage condition Water Water SDS Methanol NaCl Water
Test liquid gl
(mN/m)
u
(gs)
(8)
(mN/m)
u
(gs)
(8)
(mN/m)
u
(gs)
(8)
(mN/m)
u
(gs)
(8)
(mN/m)
u
(gs)
(8)
(mN/m)
u
(gs)
(8)
(mN/m)
Decane 23.9 0 75 (9.9) 70 (11.2) 61 (13.5) 69 (11.2) 78 (9.2)
Dodecane 25.4 0 79 (9.6) 75 (10.6) 69 (12.2) 73 (11.2) 82 (8.8)
Hexadecane 27.6 19 (26.3) 84 (9.2) 83 (9.4) 80 (10.2) 76 (11.4) 85 (8.9)
CH2I2 50.0 71 (25.5) 115 (6.7) 107 (9.4) 103 (11.0) 107 (9.4) 114 (7.0)
Water 72.7 98 (24.3) 130 (6.8) 127 (8.1) 122 (10.5) 125 (9.1) 131 (6.4)
Surface energy com-
ponent gsd (mN/m)
– 9.0 ^ 0.3 9.9 ^ 0.5 11.5 ^ 0.9 10.8 ^ 0.1 8.4 ^ 0.1
Film thickness is 1 mm. The ratio of amino functions to carboxylic groups is 1:0, 1:0.5 and 1:1. Reprinted with permission
from J Mater Chem 2001;11:381 q The Royal Society of Chemistry [77]. The error of measurement for the advancing contact
angles u is about 18. The surface energies gs are calculated from the advancing contact angles using the Neumann and Li
equation [19].
A.F. Thunemann / Prog. Polym. Sci. 27 (2002) 1473–1572 1533

As a test of the complex stability, the complex surfaces are immersed, while stirring, for 24 h in
different solvents of practical relevance: 1% aqueous surfactant solution (sodium dodecyl sulfate), in
methanol and in 3% aqueous sodium chloride solution. The latter has an ionic strength about equal to
that of seawater. The contact angles after immersion in surfactant and salt solution are only slightly
reduced compared to that of the pristine surfaces. For the complex surface stored in methanol solution a
larger reduction of contact angles is found. But compared with the non-complexed silicon, the contact
angles are strongly enhanced. The surface energies using the Neumann and Li equation [19] are in the
range between 8.1 and 13.5 mN/m (Table 14). Values of gsd range between 9.9 and 11.5 mN/m. From
the low surface energy values, it is concluded that the complex surfaces are still highly enriched with
CF3-groups after immersion. Neither surfactant nor salt solution removes the perfluorododecanoic acid
from the complex. Methanol is able to detach minor amounts of the fluorinated acid (Fig. 51). This
relatively good stability against solvents is an important advantage of the complex compared to surfaces
of perfluorododecanoic acid on platinum. When in contact with water, films of non-complexed
perfluorododecanoic acid are dissolved readily [26]. In contrast films of PDMS-C12 are stable enough to
withstand even polar solvents.
The sensitivity of contact angles to the chemical composition of PDMS-C12 extends to only a few
atomic layers on and near the surface, with polar liquids showing a greater sensing depth than non-polar
liquids [38]. In order to measure the surface-near element composition XPS measurements have been
carried out. The analysis depth of this method is less than 5 nm for a low take-off angle (208). It has been
found within this surface-near region, that the element composition deviates considerably from the
average composition of the complex. A remarkable excess of fluorine at the surface has been detected
20 30 40 50 60 70
0
20
40
60
80
100
120
140
cont
acta
ngle
γl[mN/m]
Fig. 51. Advancing contact angles of various kinds of liquid on cross-linked polysiloxane surfaces plotted against the surface
tension gl of the liquids. From left to right points are values obtained with (1) decane, gl ¼ 23:9 mN=m; (2) dodecane,
gl ¼ 25:4 mN=m; (3) hexadecane, gl ¼ 27:6 mN=m; (4) methylene iodide, gl ¼ 50:0 mN=m; (5) water, gl ¼ 72:7 mN=m:Contact angles are shown for a cross-linked complex with a complexation degree of 50% after immersion in water (circles),
sodium dodecyl sulfate solution (diamonds), sodium chloride solution (crosses) and methanol (stars). For comparison, the
values of the non-complexed polysiloxane are given (triangles). Reprinted with permission from J Mater Chem 2001;11:381 q
The Royal Society of Chemistry [77].
A.F. Thunemann / Prog. Polym. Sci. 27 (2002) 1473–15721534
with a relative atomic amount of 32.4%, which is a 5.2-fold above the bulk level, which is 6.2% of the
total. Similarly high fluorine enrichments at polymer surfaces have been recently reported for carbon
containing backbone polymers [86]. Because the depth of XPS analysis is larger than the length of the
fluorinated chain (ca. 1.5 nm), even for a theoretical densely packed perfluorododecanoate monolayer at
the surface, nitrogen and silicon are found. The surface-near atomic concentrations of nitrogen and
silicon are 2.0 and 11.4%, respectively, whereas the corresponding values for the bulk composition are
0.5 and 22.1%. The higher nitrogen content found in the surface-near region is consistent with the
complex structure, i.e. the migration of fluorinated chains to the surface is accompanied by the
movement of an equimolar amount of ammonium carboxylate ion pairs. Obviously, the predominant
part of the ions is not located directly on the surface, otherwise much lower contact angles than the ones
observed would be found. As expected, the enrichment in fluorine at the surface is accompanied by a
decrease of silicone.
2.4.2. Cross-linking
The cross-linking of the complexes to films with rubber-like properties has been performed without
catalysts. Cross-linking of the complex could even be carried out at a temperature where no significant
cross-linking is observed for the pure polysiloxane (125 8C). Further, non-stoichiometric complexes
contain free amino functions that cross-link faster than stoichiometric or over-complexed PDMS-C12.
From this it can be concluded that cross-linking is not only due to the addition of acid.
An optimum amount of perfluorododecanoic acid for a high reaction rate of cross-linking is found to
be at a complexation degree of about 50%. In order to determine quantitatively the reaction rate of cross-
linking, time-dependent isochronal dynamic-mechanical measurements at constant temperatures are
carried out. As shown in Fig. 52 (dotted line), the shear modulus of the non-complexed polysiloxane
increases only slowly at 125 8C. After 7 £ 104 s the value of the sheer modulus is as low as 3 £ 103 Pa.
By contrast, in the presence of 2% dibutyltin dilaurate, an effective cross-linking catalyst, the modulus
increases steeply within the first 0.5 £ 104 s due to a high cross-linking rate (Fig. 52, dashed line). A
constant modulus of 1.4 £ 105 Pa is reached within about 2 £ 104 s. The modulus of the complexed
polysiloxanes shows a similar high cross-linking reaction rate as found for the heavy metal catalyst
(Fig. 52, solid line). The modulus of the complex increases steeply within the first 104 s, levels off and
reaches a constant value of about 1.2 £ 105 Pa within 3 £ 104 s. Although not as good as heavy metal
compounds, the ammonium perfluorododecanoate moieties can be considered as effective catalytic
entities for cross-linking.
3. Optically functionalized complexes
The nanostructures and the optical properties of self-assembled complexes are described in this
section. These are in particular the fluorescence and the electroluminescence of complexes that contain
polyelectrolytes with a conjugated backbone such as poly( p-phenylene)s (PPP) and poly( p-
phenyleneethynylene)s (PPE). Section 3.1 contains a description of a mesomorphous columnar
complex with interesting fluorescent properties, which are prepared from a rigid-rod-like polyelectrolyte
and a fluorinated surfactant. Section 3.2 describes the random layer nanostructure and optical properties
of a highly fluorescent PPE complex. In Section 3.3 lamellar structured complexes of PPE will be
A.F. Thunemann / Prog. Polym. Sci. 27 (2002) 1473–1572 1535

described and it will be demonstrated that the optical properties of single-layer light emitting diodes
(LEDs) of the PPE complexes depend on the nature of the counter ions.
3.1. Rigid-rod complex [87]
Substituted rigid-rod-like polymers with conjugated backbones are interesting building blocks for
photonic devices. They facilitate the control of microscopic order as well as a predictable and defined
molecular alignment [88]. Poly- and oligo( p-phenylene)s are typical representatives of this class of
molecule. Blue photoluminescence with a quantum yield of 30% in the solid state is the reason for using
p-phenylenes in organic LEDs [89–91]. There have been numerous studies dedicated to trying to
understand the electronic properties of these highly luminescent materials [92,93]. Theoretical and
experimental findings on short-chain model compounds in the solid state show that the planarity of p-
phenylenes, and therefore the optical properties, are affected by hydrostatic pressure and temperature
[94]. The orientation and diffusion dynamics as well as the aggregation behavior of poly( p-phenylene)s
and their dependence on concentrations and the amount of added salt have been investigated in detail by
Wegner et al. [95–97]. It has been shown that ultra-thin films made of poly( p-phenylene)s display a
complicated dependence on the underlying substrate, the degree of polymerization and the preparation
conditions [98]. Further, negatively charged poly( p-phenylene)s with hydrophobic moieties show a
complex association behavior in solution which depends on their hydrophobic hydrophilic balance [99].
0 1 2 3 4 5 61
10
100
1000
10000
100000
1000000
(c)
(b)
(a)
G´[P
a]
t [104 s]7
Fig. 52. Time-dependent isochronal shear modulus of amino-functionalized polysiloxane at T ¼ 125 8C: The moduli rise due to
cross-linking reactions. The modulus of a non-complexed amino-functionalized polysiloxane (curve, a) rises slowly. At the end
of the experimental time (7 £ 104 s), no plateau is reached. The modulus of a complexed polysiloxane with a complexation
degree of 50% (curve b), increases steeply within 104 s and reaches a constant value of 1.2 £ 105 Pa at about 4 £ 104 s. For
comparison of the cross-linking rate an effective cross-linking catalyst, dibutyltin dilaurate (2% w/w), is used for the non-
complexed polysiloxane. Then the modulus increases steeply within 0.5 £ 104 s and reaches a constant value of 1.4 £ 105 Pa at
about 2 £ 105 s (curve c). The frequency of measurements was 1 Hz. Reprinted with permission from J Mater Chem
2001;11:381 q The Royal Society of Chemistry [77].
A.F. Thunemann / Prog. Polym. Sci. 27 (2002) 1473–15721536

The structures obtained are considered to represent the behavior of biogenic materials with respect to the
formation of well-defined superstructures.
The complexation of the cationic poly( p-phenylene) PPP with perfluoro-1-octane sulfonate F8 is
performed in aqueous solution resulting in the polymeric complex PPP–F8, which is obtained as a
yellow-brownish precipitate. A schematic view is given in Fig. 53.
Films of PPP–F8 are prepared from complex solution in methanol by the common solvent casting
procedure [100]. Their structure is investigated by wide- and small-angle X-ray scattering. A number of
sharp reflections can be seen in the wide-angle diagram of F8, which is a highly crystalline compound,
3.3 nm
5.2 nm
(CF2)7 SO3F3C
O3S (CF2)7 CF3(CH2)6
(CH2)6N
N
C2H5
C2H5
C2H5
C2H5
H5C2
C2H5
n
n
(CH2)6
(CH2)6N
N
C2H5
C2H5
C2H5
C2H5
H5C2
C2H5
I
IN(C2H5)4 O3S (CF2)7 CF3
N(C2H5)4I2
2
F8PPP
PPP-F8
Fig. 53. Complex formation: (PPP) cationic poly( p-phenylene) as iodide; (F8) perfluoro-1-octane sulfonic acid
tetraethylammonium salt; (PPP–F8) stoichiometric complex. The degree of polymerization is Pn ¼ 11: The lower sketch
shows a model of the proposed complex structure, which contains two columns per unit cell ordered in a centered two-
dimensional unit cell. The columns are formed by strands of poly( p-phenylene) molecules which are embedded in an
amorphous matrix of fluorinated alkyl chains (not drawn). Reprinted with permission from Macromolecules 2000;33:2124 q
American Chemical Society [87].
A.F. Thunemann / Prog. Polym. Sci. 27 (2002) 1473–1572 1537
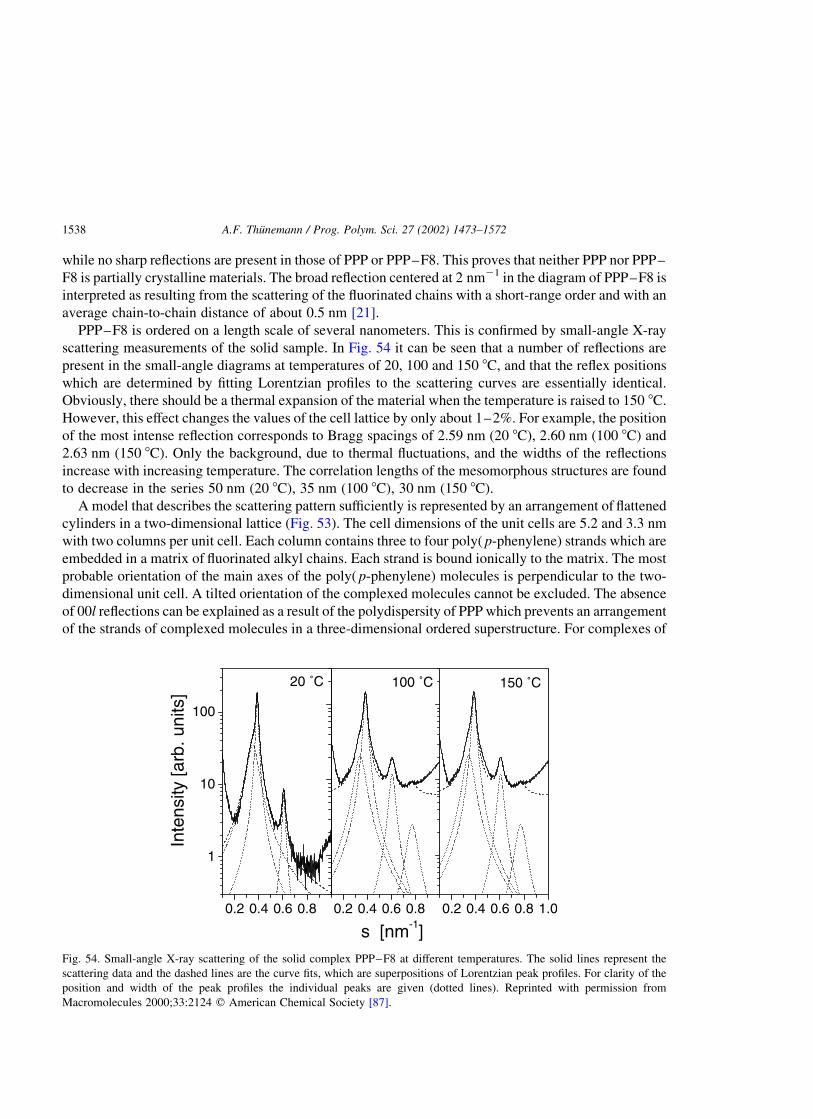
while no sharp reflections are present in those of PPP or PPP–F8. This proves that neither PPP nor PPP–
F8 is partially crystalline materials. The broad reflection centered at 2 nm21 in the diagram of PPP–F8 is
interpreted as resulting from the scattering of the fluorinated chains with a short-range order and with an
average chain-to-chain distance of about 0.5 nm [21].
PPP–F8 is ordered on a length scale of several nanometers. This is confirmed by small-angle X-ray
scattering measurements of the solid sample. In Fig. 54 it can be seen that a number of reflections are
present in the small-angle diagrams at temperatures of 20, 100 and 150 8C, and that the reflex positions
which are determined by fitting Lorentzian profiles to the scattering curves are essentially identical.
Obviously, there should be a thermal expansion of the material when the temperature is raised to 150 8C.
However, this effect changes the values of the cell lattice by only about 1–2%. For example, the position
of the most intense reflection corresponds to Bragg spacings of 2.59 nm (20 8C), 2.60 nm (100 8C) and
2.63 nm (150 8C). Only the background, due to thermal fluctuations, and the widths of the reflections
increase with increasing temperature. The correlation lengths of the mesomorphous structures are found
to decrease in the series 50 nm (20 8C), 35 nm (100 8C), 30 nm (150 8C).
A model that describes the scattering pattern sufficiently is represented by an arrangement of flattened
cylinders in a two-dimensional lattice (Fig. 53). The cell dimensions of the unit cells are 5.2 and 3.3 nm
with two columns per unit cell. Each column contains three to four poly( p-phenylene) strands which are
embedded in a matrix of fluorinated alkyl chains. Each strand is bound ionically to the matrix. The most
probable orientation of the main axes of the poly( p-phenylene) molecules is perpendicular to the two-
dimensional unit cell. A tilted orientation of the complexed molecules cannot be excluded. The absence
of 00l reflections can be explained as a result of the polydispersity of PPP which prevents an arrangement
of the strands of complexed molecules in a three-dimensional ordered superstructure. For complexes of
0.2 0.4 0.6 0.8
1
10
100
20 ˚C
Inte
nsity
[arb
.uni
ts]
s [nm-1]0.2 0.4 0.6 0.8
100 ˚C
0.2 0.4 0.6 0.8 1.0
150 ˚C
Fig. 54. Small-angle X-ray scattering of the solid complex PPP–F8 at different temperatures. The solid lines represent the
scattering data and the dashed lines are the curve fits, which are superpositions of Lorentzian peak profiles. For clarity of the
position and width of the peak profiles the individual peaks are given (dotted lines). Reprinted with permission from
Macromolecules 2000;33:2124 q American Chemical Society [87].
A.F. Thunemann / Prog. Polym. Sci. 27 (2002) 1473–15721538

monodisperse poly( p-phenylene) molecules a three-dimensional order such as a smectic H structure is
expected.
By differential calorimetry it has been confirmed that the two-dimensional columnar structure is
stable over a wide range of temperatures. It is found in the DSC traces that two phase transitions are
present for F8, a weak endothermic transition at 173 8C and a strong one at 191 8C. The former is
probably a solid/solid phase transition from one crystalline phase a to a second crystalline phase b. The
latter is the melting transition of the b phase. By contrast no transition is found in the range 250–300 8C
for PPP–F8. The first and the second heating traces are identical. Together with the results from the
small-angle scattering it is concluded that the supramolecular structure of the complex is stable within
this remarkably large range of temperatures.
3.2. A fluorescent complex with a layered nanoarchitecture [101]
In the past decade, conjugated organic polymers have found many applications such as emitting layers
in LEDs [88,102], ‘plastic’ lasers [103], light-emitting electrochemical cells [104], to name just a few. In
contrast to the strictly crystalline inorganic semiconductors with their well-defined long-range order,
conjugated polymers, as organic semiconductors, can display a wide variety of different morphologies
and solid-state structures with changes in their optical properties and band gaps, even if the same
backbone is employed. Recently, Bunz et al. [105] produced evidence of the aggregate formation for
dialkylpoly( p-phenyleneethynylene)s in solution using fluorescence investigations.
A recently developed synthetic route makes the synthesis of poly(phenyleneethynylene) without diine
defects possible [106]. On the basis of such well-defined polymers, Schnablegger et al. [107] found a
three-step hierarchy of structures. For example, potassium poly(1,4-phenylene-ethynylene carboxylate)
forms aggregates similar to cylinders in a first step. In a second step, the cylinders form fibrils of a higher
order and in a third step bundles of fibrils are transformed into globular clusters. The polymer can
perform a structure transition into double layers when adsorbed onto substrate materials. An earlier study
considers a polyelectrolyte–surfactant complex of dihexadecyldimethylammonium–poly(1,4-pheny-
lene-ethynylene carboxylate) which forms an undisturbed lamellar mesophase in the solid state and can
be used for a blue LED with a low turn-on point [119].
This section reports on a polyelectrolyte complex with a random layer structure formed by
dimethylditetradecylammonium-poly(1,4-phenylene-ethynylene carboxylate). A sketch of the complex
formation is given in Fig. 55.
3.2.1. Nanostructure
Information about the molecular packing of the complex PPE-2C14 in bulk material is obtained by
wide-angle X-ray scattering. Only a broad maximum is present in the wide-angle region whose position
corresponds to a Bragg spacing of 0.45 nm. This value is typical for long alkyl chain polyelectrolyte–
surfactant complexes [100] and slightly larger than that found for dihexadecyldimethylammonium-
poly(1,4-phenylene-ethynylene carboxylate) (0.43 nm) [119].
By contrast, numerous sharp reflections are present in the pattern of the pristine crystalline surfactant.
This proves that PPE-2C14 contains neither side-chain crystalline regions nor crystalline impurities of
non-complexed surfactant or sodium bromide. The absence of crystallinity is verified by differential
calorimetry. Within a temperature range of 2100 to 250 8C a glass-transition is found in the
thermograms at 247 8C, but no melt transitions are present. This is in contrast to a homologue complex
A.F. Thunemann / Prog. Polym. Sci. 27 (2002) 1473–1572 1539

with longer alkyl chains, dihexadecyldimethylammonium-poly(1,4-phenylene-ethynylene carboxylate)
which shows, in addition to a glass-transition ðTg ¼ 241 8CÞ; side-chain crystallinity. About 10% of the
alkyl chains are crystalline at temperatures below216 8C. Therefore, it can be concluded that the transition
between a non-crystalline to a side-chain crystalline complex lies between a chain length of C14 and C16.
The small-angle scattering pattern of PPE-2C14 in the form of bulk material is characteristic (Fig. 56).
In addition to three sharp symmetric reflections at higher angles with relative positions of 1:2:3 two
asymmetric reflections at lower angles are present with relative positions of 1:31/2. The latter two show a
n
C C
CO O OO
C
C C
n
PPE PPE-2C14
1. saponification
2. complexation
N
(n-C14H29)
Fig. 55. Sketch of complex formation: poly(2-ethylhexyloxycarbonyl-1,4-phenyleneethynylene carboxylate) PPE. It is
saponified and then complexed with dihexadecyldimethylammonium bromide to dimethylditetradecylammonium poly(1,4-
phenyleneethynylene carboxylate) PPE-2C14. Reprinted with permission from Langmuir 2000;16:3221 q American Chemical
Society [101].
0.2 0.4 0.6 0.8 1.010-1
100
101
102
103
(003)
(002)
(001)
(110)(100)
datafit(100)(110)(001)(002)(003)
Inte
nsity
[a.u
.]
s [nm-1]Fig. 56. Small-angle X-ray scattering diagram of (PPE-2C14) (solid line) and a fit (dotted line) which is a superposition of two
random layer profiles according to Eq. (3.1) with the indices (100) and (110) and three equidistant Lorentzian peak profiles
indexed as (001), (002), (003). Reprinted with permission from Langmuir 2000;16:3221 q American Chemical Society [101].
A.F. Thunemann / Prog. Polym. Sci. 27 (2002) 1473–15721540

steep decrease in the direction of their low-angle side and a slow decrease towards their high-angle side.
Such a scattering pattern is typical for stacks of random layers. This X-ray pattern is due to stacks
consisting of alternating ionic layers which are formed by the polyelectrolyte and the ionic head groups,
and non-ionic layers which contain the alkyl surfactant tails. From the positions of the (001), (002) and
(003) reflections, the long period is determined to be 3.20 nm and from their width the correlation length
is given in the range 300–500 nm. A fit of the lamellar reflections with Lorentzian profiles is shown in
Fig. 56. The large values of the correlation length must result from a good stacking order and is the
highest value observed to date for polyelectrolyte–surfactant complexes.
For the determination of the layer thicknesses, the ‘stacking model’ is used [7,108] in which the
statistics of the lamellar stacks is determined by the distributions h1ðd1Þ and h2ðd2Þ of the thicknesses of
the two lamellae d1 and d2. These distributions are considered to be statistically independent, i.e. there is
no correlation between the two variances s12 and s2
2: The period d is given by d ¼ d1 þ d2: For a
randomly oriented two-phase system with sharp boundaries and normalized distributions h1ðd1Þ and
h2ðd2Þ; the scattering intensity for the stacking model is given by
IðsÞ ¼k
4p3s4Re
ð1 2 H1ðsÞÞð1 2 H2ðsÞÞ
1 2 H1H2ðsÞ
� �; ð3:1Þ
where Hn is the one-dimensional Fourier transformation of hn; which is expð22pisi2s2 2 2pidisÞ; and
Re stands for the ‘real part’. A fit of Eq. (3.1) to the scattering curve results in d1 ¼ 1:30 ^ 0:05 nm and
d2 ¼ 1:9 ^ 0:05 nm (not shown). From the volume fractions of polyelectrolyte and surfactant d1 are
ascribed to the thickness of the ionic layers and d2 to the non-ionic layers. The random layer profiles are
interesting details, which may be caused by hexagonal undulations or perforations.
Both periodic undulations and periodic perforations within the layers represent two-dimensional
lattices which lead to additional reflections. If the undulations of different layers are not correlated, the
peak profiles are asymmetric. In the event of truly random orientations of the two-dimensional layers no
00l reflections would be produced but in the great majority of cases the layers tend to stack together into
parallel-layer groups as might be expected [109]. These structures posses no interlayer order other than
the parallelism and degree of separation of the layers. Therefore (00l ) and (hk0), but no mixed (hkl )
reflections are present. The scattering of random-layer (turbostratic) structures have been dealt with in
detail by Ruland [110,111]. For a Lorentzian intensity distribution {Ih} ¼ L=ð1 þ p2L2s2Þ normal to an
hk reciprocal lattice rod an exact solution is given as
IðsÞ ¼1
4s
ffiffiffiffiffiL
ps
rF
pL
2ss2 2 sh
2 21
p2L2
� �� �; ð3:2Þ
where
FðzÞ ¼
ffiffiffiffiffiffiffiffiffiffiffiffiffiffiffiffiffiffiffiffiffiffiffiffiffiffiffiffiffiffiffiffiffiðz2 2 1Þ þ z
pz2 þ 1
s; ð3:3Þ
and L is defined as the integral width of {Ih}: Peak profiles of Eq. (3.2) are shown in Fig. 56. From the
peak positions of the (100) and (110) reflections, given by Eq. (3.2), a distance of the perforations or
undulations of 7.5 nm is calculated. It must be stressed here that it is not possible on the basis of the
scattering data to distinguish between an undulated and a perforated structure. This distinction has to be
made by further experiments (e.g. by gas permeation measurements). Therefore, a model with hexagonal
undulated ionic layers is proposed as is shown in Fig. 57.
A.F. Thunemann / Prog. Polym. Sci. 27 (2002) 1473–1572 1541
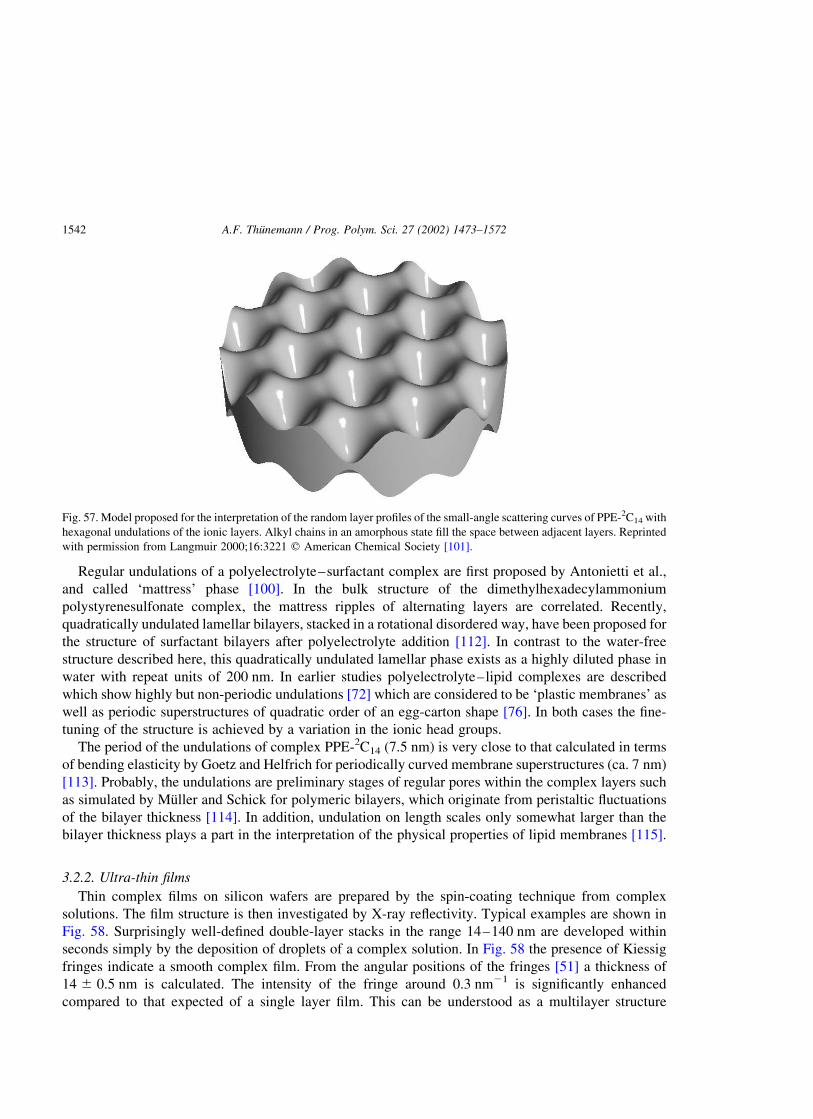
Regular undulations of a polyelectrolyte–surfactant complex are first proposed by Antonietti et al.,
and called ‘mattress’ phase [100]. In the bulk structure of the dimethylhexadecylammonium
polystyrenesulfonate complex, the mattress ripples of alternating layers are correlated. Recently,
quadratically undulated lamellar bilayers, stacked in a rotational disordered way, have been proposed for
the structure of surfactant bilayers after polyelectrolyte addition [112]. In contrast to the water-free
structure described here, this quadratically undulated lamellar phase exists as a highly diluted phase in
water with repeat units of 200 nm. In earlier studies polyelectrolyte–lipid complexes are described
which show highly but non-periodic undulations [72] which are considered to be ‘plastic membranes’ as
well as periodic superstructures of quadratic order of an egg-carton shape [76]. In both cases the fine-
tuning of the structure is achieved by a variation in the ionic head groups.
The period of the undulations of complex PPE-2C14 (7.5 nm) is very close to that calculated in terms
of bending elasticity by Goetz and Helfrich for periodically curved membrane superstructures (ca. 7 nm)
[113]. Probably, the undulations are preliminary stages of regular pores within the complex layers such
as simulated by Muller and Schick for polymeric bilayers, which originate from peristaltic fluctuations
of the bilayer thickness [114]. In addition, undulation on length scales only somewhat larger than the
bilayer thickness plays a part in the interpretation of the physical properties of lipid membranes [115].
3.2.2. Ultra-thin films
Thin complex films on silicon wafers are prepared by the spin-coating technique from complex
solutions. The film structure is then investigated by X-ray reflectivity. Typical examples are shown in
Fig. 58. Surprisingly well-defined double-layer stacks in the range 14–140 nm are developed within
seconds simply by the deposition of droplets of a complex solution. In Fig. 58 the presence of Kiessig
fringes indicate a smooth complex film. From the angular positions of the fringes [51] a thickness of
14 ^ 0.5 nm is calculated. The intensity of the fringe around 0.3 nm21 is significantly enhanced
compared to that expected of a single layer film. This can be understood as a multilayer structure
Fig. 57. Model proposed for the interpretation of the random layer profiles of the small-angle scattering curves of PPE-2C14 with
hexagonal undulations of the ionic layers. Alkyl chains in an amorphous state fill the space between adjacent layers. Reprinted
with permission from Langmuir 2000;16:3221 q American Chemical Society [101].
A.F. Thunemann / Prog. Polym. Sci. 27 (2002) 1473–15721542

consisting of alternating ionic and non-ionic layers with the same repeat unit as in the bulk material.
Assuming this, the reflectivity curve can be explained as resulting from four double layers (ionic–non-
ionic) plus an ionic layer at the complex/wafer interface. For a film of about 140 ^ 20 nm thickness—
determined by a surface profiler—two sharp Bragg reflections with equidistant position are found
(Fig. 58(b)). From their positions, a lamellar spacing of 3.18 ^ 0.02 nm is calculated. Within the
experimental error this value is identical to that determined for the complex in bulk material (3.2 nm).
From the integral width of the reflections a correlation length of about 140 nm is determined. This is of
the same order of magnitude as the film thickness. Therefore, it can be concluded that the complex layers
are oriented almost perfectly parallel to the wafer surface.
The strong depression of the asymmetric reflections—only a weak shoulder is present at about
0.28 nm21—is probably due to boundary effects of the underlying wafer surface, which prevent
undulations of the lamellae. In order to prove this assumption, visualization of the complex surfaces is
achieved by AFM. The film surface is smooth at a micrometer scale, whereas defects at the edges of the
wafer can be found on a nanometer level (Fig. 59(a)). These defects have the form of plate islands
consisting of terraces of different heights. Each terrace has a height of about 3 nm, which is in good
agreement with the lamellar repeat unit. As expected from the reflectivity measurements no regular
undulations on the surface are found in addition to defects.
At elevated temperatures (40 8C) self-dewetting of the complex films sets in and finally results in
symmetric complex droplets with sizes in the range 50–500 nm in diameter and heights in the range 30–
300 nm (Fig. 59(b)). Therefore, it can be concluded that the flat lamellar complex structures are
metastable when oriented macroscopically onto a wafer surface. Such instabilities of thin films have not
been reported for polyelectrolyte–surfactant complexes elsewhere but they are well known for typical
polymers. For example, Reiter et al. have shown that even dispersion forces of less than 1 Pa are capable
0.1 0.2 0.3 0.4 0.5 0.6101
102
103
104
105
106
107
108
(b)
(a)
Inte
nsity
[arb
.uni
ts]
s [nm-1]Fig. 58. X-ray reflectivity curves of thin complex films on silicon wafers. Curve a results from a film of complex PPE-2C14 with
a thickness of 14 nm consisting of four double layers plus one ionic layer at the wafer/complex interface. The thickness was
determined from the position of angular positions of the Kiessig fringes. Curve b results from a film of about 140 nm thickness
(determined by a surface profiler). The peaks correspond to the first and second Bragg reflection of the lamellar stacking.
Reprinted with permission from Langmuir 2000;16:3221 q American Chemical Society [101].
A.F. Thunemann / Prog. Polym. Sci. 27 (2002) 1473–1572 1543

of destroying 100 nm thick polymer films of polydimethylsiloxane [116]. Vandenbrouck et al. have
shown that liquid crystal films show a dewetting of thin films while thick ones remain stable. They
interpreted this behavior as a competition between elasticity and van der Waals forces [117]. Further,
Moller et al. investigated the self-dewetting of smectic A side-chain liquid crystalline polymers and
discussed it in terms of a progressive disordering of the side-chains with increasing distance from the
substrate [56]. Similar to the polymers described by these authors, the dewetting phenomena of complex
PPE-2C14 films have an important influence for any possible thin film applications of such complexes.
3.2.3. Optical properties
Neher [88] has pointed out that morphology plays a crucial role in the manipulation of the optical
properties of conjugated polymers, and recently Bunz et al. produced evidence of lamellar, nematic and
sanidic crystalline structures of alkylated poly( p-phenyleneethynylene)s which have been proposed to
allow an improved design of optical devices based on these organic semiconductors [118]. As Bunz
showed for the side-chain crystalline polymers a strong influence of the nanostructure of the complex on
0 1 20
2
4
6
8
10
r [µm]
Hei
ght[
nm]
(a)
0 µm 4 0 µm
(b)
(c)
7
3
Fig. 59. AFM images of a complex PPE-2C14 surface coated on a silicon wafer. Defects are found as terraces of different heights
(a). The final stage of the self-dewetting process (2 weeks at 40 8C) are symmetric complex droplets (b). The lower figure (c)
shows the height profiles of the terraces from a section of (a, straight line). The height of the steps is about 3 nm. Reprinted with
permission from Langmuir 2000;16:3221 q American Chemical Society [101].
A.F. Thunemann / Prog. Polym. Sci. 27 (2002) 1473–15721544
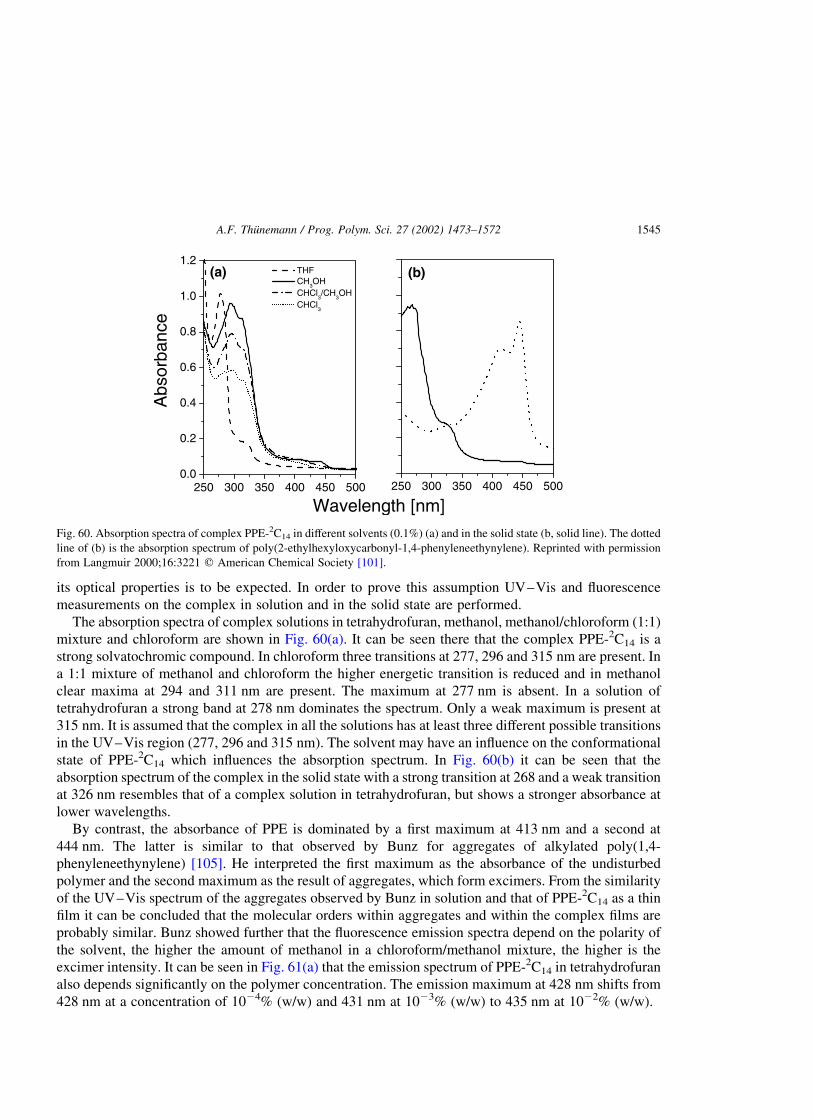
its optical properties is to be expected. In order to prove this assumption UV–Vis and fluorescence
measurements on the complex in solution and in the solid state are performed.
The absorption spectra of complex solutions in tetrahydrofuran, methanol, methanol/chloroform (1:1)
mixture and chloroform are shown in Fig. 60(a). It can be seen there that the complex PPE-2C14 is a
strong solvatochromic compound. In chloroform three transitions at 277, 296 and 315 nm are present. In
a 1:1 mixture of methanol and chloroform the higher energetic transition is reduced and in methanol
clear maxima at 294 and 311 nm are present. The maximum at 277 nm is absent. In a solution of
tetrahydrofuran a strong band at 278 nm dominates the spectrum. Only a weak maximum is present at
315 nm. It is assumed that the complex in all the solutions has at least three different possible transitions
in the UV–Vis region (277, 296 and 315 nm). The solvent may have an influence on the conformational
state of PPE-2C14 which influences the absorption spectrum. In Fig. 60(b) it can be seen that the
absorption spectrum of the complex in the solid state with a strong transition at 268 and a weak transition
at 326 nm resembles that of a complex solution in tetrahydrofuran, but shows a stronger absorbance at
lower wavelengths.
By contrast, the absorbance of PPE is dominated by a first maximum at 413 nm and a second at
444 nm. The latter is similar to that observed by Bunz for aggregates of alkylated poly(1,4-
phenyleneethynylene) [105]. He interpreted the first maximum as the absorbance of the undisturbed
polymer and the second maximum as the result of aggregates, which form excimers. From the similarity
of the UV–Vis spectrum of the aggregates observed by Bunz in solution and that of PPE-2C14 as a thin
film it can be concluded that the molecular orders within aggregates and within the complex films are
probably similar. Bunz showed further that the fluorescence emission spectra depend on the polarity of
the solvent, the higher the amount of methanol in a chloroform/methanol mixture, the higher is the
excimer intensity. It can be seen in Fig. 61(a) that the emission spectrum of PPE-2C14 in tetrahydrofuran
also depends significantly on the polymer concentration. The emission maximum at 428 nm shifts from
428 nm at a concentration of 1024% (w/w) and 431 nm at 1023% (w/w) to 435 nm at 1022% (w/w).
250 300 350 400 450 5000.0
0.2
0.4
0.6
0.8
1.0
1.2(a) THF
CH3OH
CHCl3/CH
3OH
CHCl3
Abs
orba
nce
Wavelength [nm]250 300 350 400 450 500
(b)
Fig. 60. Absorption spectra of complex PPE-2C14 in different solvents (0.1%) (a) and in the solid state (b, solid line). The dotted
line of (b) is the absorption spectrum of poly(2-ethylhexyloxycarbonyl-1,4-phenyleneethynylene). Reprinted with permission
from Langmuir 2000;16:3221 q American Chemical Society [101].
A.F. Thunemann / Prog. Polym. Sci. 27 (2002) 1473–1572 1545
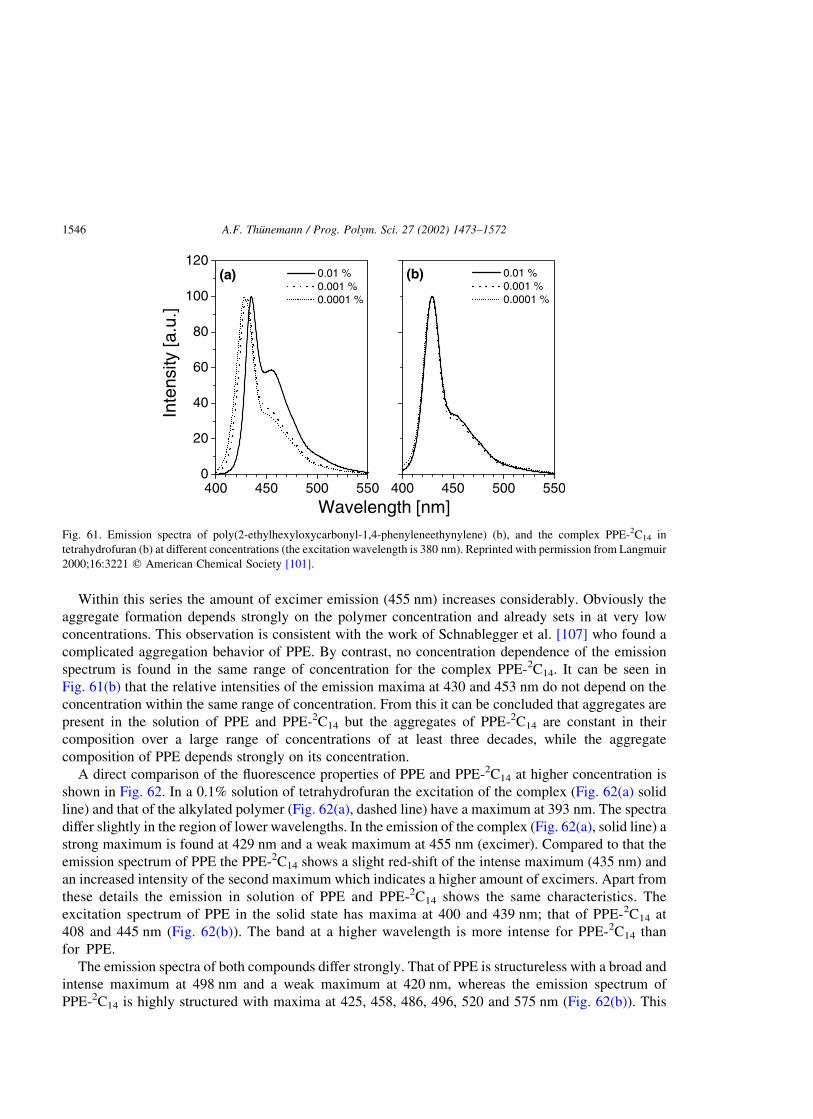
Within this series the amount of excimer emission (455 nm) increases considerably. Obviously the
aggregate formation depends strongly on the polymer concentration and already sets in at very low
concentrations. This observation is consistent with the work of Schnablegger et al. [107] who found a
complicated aggregation behavior of PPE. By contrast, no concentration dependence of the emission
spectrum is found in the same range of concentration for the complex PPE-2C14. It can be seen in
Fig. 61(b) that the relative intensities of the emission maxima at 430 and 453 nm do not depend on the
concentration within the same range of concentration. From this it can be concluded that aggregates are
present in the solution of PPE and PPE-2C14 but the aggregates of PPE-2C14 are constant in their
composition over a large range of concentrations of at least three decades, while the aggregate
composition of PPE depends strongly on its concentration.
A direct comparison of the fluorescence properties of PPE and PPE-2C14 at higher concentration is
shown in Fig. 62. In a 0.1% solution of tetrahydrofuran the excitation of the complex (Fig. 62(a) solid
line) and that of the alkylated polymer (Fig. 62(a), dashed line) have a maximum at 393 nm. The spectra
differ slightly in the region of lower wavelengths. In the emission of the complex (Fig. 62(a), solid line) a
strong maximum is found at 429 nm and a weak maximum at 455 nm (excimer). Compared to that the
emission spectrum of PPE the PPE-2C14 shows a slight red-shift of the intense maximum (435 nm) and
an increased intensity of the second maximum which indicates a higher amount of excimers. Apart from
these details the emission in solution of PPE and PPE-2C14 shows the same characteristics. The
excitation spectrum of PPE in the solid state has maxima at 400 and 439 nm; that of PPE-2C14 at
408 and 445 nm (Fig. 62(b)). The band at a higher wavelength is more intense for PPE-2C14 than
for PPE.
The emission spectra of both compounds differ strongly. That of PPE is structureless with a broad and
intense maximum at 498 nm and a weak maximum at 420 nm, whereas the emission spectrum of
PPE-2C14 is highly structured with maxima at 425, 458, 486, 496, 520 and 575 nm (Fig. 62(b)). This
400 450 500 5500
20
40
60
80
100
1200.01 %0.001 %0.0001 %
(a)
Inte
nsity
[a.u
.]
Wavelength [nm]400 450 500 550
0.01 %0.001 %0.0001 %
(b)
Fig. 61. Emission spectra of poly(2-ethylhexyloxycarbonyl-1,4-phenyleneethynylene) (b), and the complex PPE-2C14 in
tetrahydrofuran (b) at different concentrations (the excitation wavelength is 380 nm). Reprinted with permission from Langmuir
2000;16:3221 q American Chemical Society [101].
A.F. Thunemann / Prog. Polym. Sci. 27 (2002) 1473–15721546

observation is unexpected and its origin is as yet not clear. For a first interpretation it is assumed that the
structure of the emission results from the regularity of the undulations of the lamellar structure, which
may lead to a number of definite emission bands. But more detailed work has to be done in order to
clarify the relation between the mesomorphous ordering and the optical properties of fluorescent
polyelectrolyte–surfactant complexes.
In summary it has been demonstrated that the optical properties of the highly fluorescent alkylated
polymer PPE can be changed to a considerable degree by its conversation to an ionic polymer complex
PPE-2C14. The effect of complexation is pronounced in the solid state where the emission properties of
PPE is structureless, while those of PPE-2C14 show a detailed structuring. The solid-state structure of
PPE-2C14 is lamellar with a hexagonal in-plane order of undulations but with no plane-to-plane
correlation. The complex can be prepared as a highly ordered multilayer film in a single step procedure
which makes it, in principle, superior because it is faster compared to established methods for the
formation of thin multilayer films.
3.3. Electroluminescent polyelectrolyte complexes [119,151]
Conjugated polymeric materials have been subjects of intense academic and industrial research for
their use in LEDs in the last decade. The work on organic LEDs has been summarized in a number of
reviews [102,120–124]. Typically, polymers in organic LEDs have a conjugated backbone and
normally they are non-ionic. On the other hand, it has been shown that polyelectrolytes such as
polyaniline (in its form as an emeraldine salt) increase the hole transport via the indium tin oxide
electrode. As a result, the light-emitting characteristics of the LEDs are strongly improved [125]. It has
been shown recently that polyelectrolytes are useful in forming stepped and graded electronic profiles
300 400 500 6000
20
40
60
80
100
120
emission
excitation (a)
Inte
nsity
[a.u
.]
Wavelength [nm]300 400 500 600
excitation
emission
(b)
Fig. 62. Fluorescence excitation and emission spectra of PPE and PPE-2C14 in solutions of 0.1% (w/w) tetrahydrofuran (a) and
as solid-state materials (b). The dotted lines correspond to PPE and the solid lines to PPE-2C14. The excitation wavelength are
380 nm, the emission wavelength is 550 nm. Reprinted with permission from Langmuir 2000;16:3221 q American Chemical
Society [101].
A.F. Thunemann / Prog. Polym. Sci. 27 (2002) 1473–1572 1547

leading to remarkably efficient single-layer polymeric LEDs [126]. In addition, complexes of
polyelectrolytes and surfactants form interesting nanostructured materials in the solid state [9,10]. The
first example of the combination of a rigid-rod-like polyelectrolyte and a surfactant into a material which
is useful for the production of LEDs has been given by Neher et al. [91]. Further, a nanostructured PPE
complex, dihexadecyldimethylammonium-poly(1,4-phenyleneethynylene carboxylate) has been described.
This material displays blue electroluminescence in single-layer LEDs with low turn-on-points [119].
In this section, complexes of PPE with a number of different counter ions will be introduced. The
molecular structures of the compounds are given in Fig. 63. The emphasis is on the solid-state structures
of the complexes and their optical properties.
3.3.1. Thermal properties
The thermal properties of the complexes have been investigated by using DSC. It is found that none of
the complexes show a glass transition, which is probably due to the high ionic character of the materials
in combination with the rigid-rod-like polymeric backbone. Melting peaks are found for alkyl chain
lengths higher than 12 in the series of the double-chain surfactant containing complexes. The complex
PPE-2C14 displays a melt transition at 227 8C, PPE-2C16 at 5 8C and PPE-2C18 at 20 8C (Fig. 64). The
endothermic transitions are attributed to a melting of crystalline side-chains, which are represented by
the alkyl tails of the surfactants. In the way recommended in the literature [127] the amount of crystalline
CH2 groups have been calculated to be 8% (PPE-2C14), 15% (PPE-2C16) and 20% (PPE-2C18). They are
present in the structures below the individual melt transition of each complex. The complex PPE-Py16
displays a melt transition at 18 8C and an amount of about 10% crystalline CH2 groups. No crystallinity
has been detected for the other complexes in the temperature range 2100 to 150 8C.
3.3.2. Nanostructures
Wide- and small-angle X-ray measurements are undertaken in order to complement the information
OOC
C C
n
PPE
N (n-C10H21): 2C10
(n-C12H25): 2C12
(n-C14H29): 2C14
(n-C16H33): 2C16
(n-C18H37): 2C18
N
4C14C2
N N (n-C12H25): Py12(n-C16H33): Py16
S
OH
OH
OHS
Fig. 63. The molecular structures of the compounds used for complexation: poly( p-phenyleneethynylene carboxylate) (PPE),
tetramethylammonium (4C1), tetraethylammonium (4C2), dialkyldimethylammonium (2C10, 2C12, 2C14, 2C16, 2C18),
alkylpyridinium (Py12, Py16), 2-hydroxy-S,S(bis(2-hydroxyethyl)dodecylsulfonium) (S). Reprinted with permission from
Langmuir 2001;17:5098 q American Chemical Society [151].
A.F. Thunemann / Prog. Polym. Sci. 27 (2002) 1473–15721548

on the molecular and supramolecular structures of the complexes. The wide-angle diagrams of the
complexes reveal that only two of the 10 complexes, PPE-2C18 and PPE-Py16, contain crystalline side-
chains at temperatures below 16 8C. It can be seen, for example, that an amorphous halo is found in the
wide-angle diagram of PPE-2C16 (Fig. 65(a), upper curve) while, in addition to this, an intense reflection
is found in the wide-angle diagram of PPE-2C18 (Fig. 65(b), upper curve). By contrast, a number of sharp
reflections are present in the diagrams of the surfactants 2C16 and 2C18 (see lower curves in Fig. 65(a) and
(b)). Both surfactants are highly crystalline compounds at room temperature. It is a typical property of
-50 0 50 1000.0
0.2
0.4
0.6
0.8
1.0
PPE-2C14
PPE-2C16
PPE-2C18
-27 ˚C
5 ˚C
20 ˚C
Hea
tFlo
w[m
W/m
g]
T [ ˚C]Fig. 64. The DSC traces of PPE-2C14, PPE-2C16 and PPE-2C18. Reprinted with permission from Langmuir 2001;17:5098 q
American Chemical Society [151].
1 2 3 40
500
1000
1500
PPE-2C16
2C18
2C16
s [nm-1]
(a)
Inte
nsity
[a.u
.]
s [nm-1]1 2 3 4
PPE-2C18
(b)
Fig. 65. The wide-angle X-ray scattering diagrams of 2C16, PPE-2C16 (a) and 2C18, PPE-2C18 (b). Reprinted with permission
from Langmuir 2001;17:5098 q American Chemical Society [151].
A.F. Thunemann / Prog. Polym. Sci. 27 (2002) 1473–1572 1549
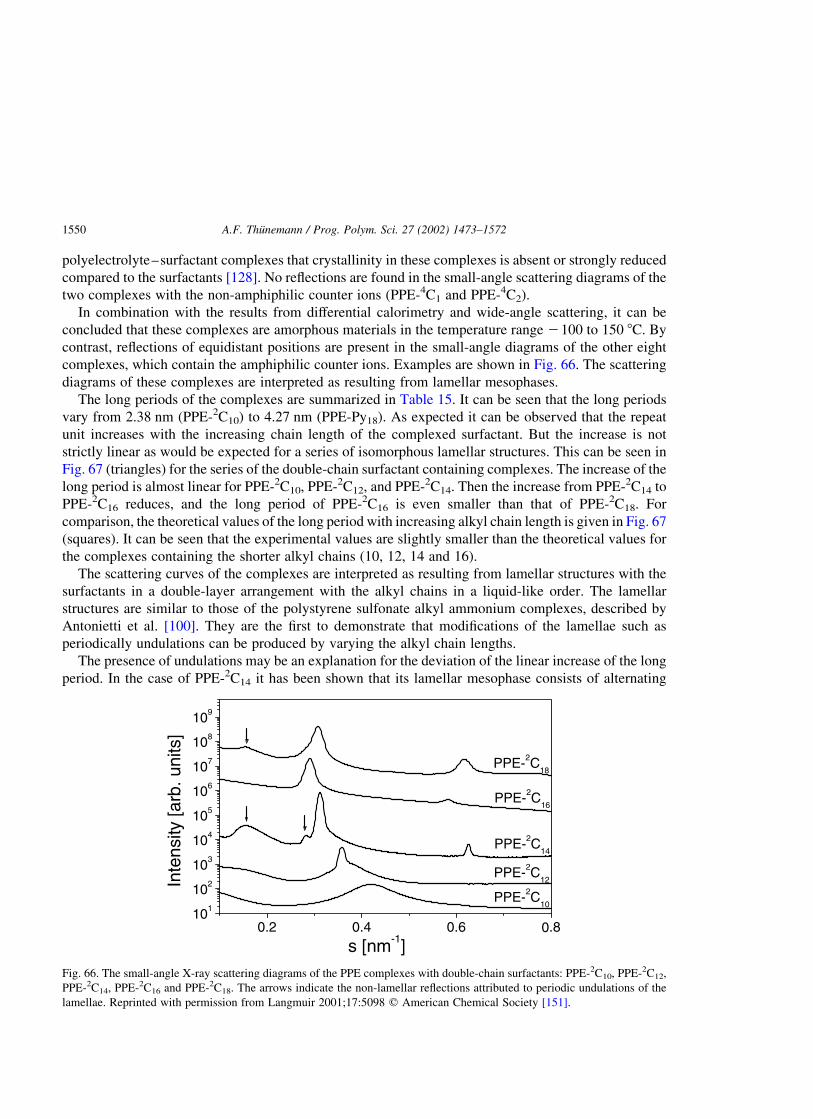
polyelectrolyte–surfactant complexes that crystallinity in these complexes is absent or strongly reduced
compared to the surfactants [128]. No reflections are found in the small-angle scattering diagrams of the
two complexes with the non-amphiphilic counter ions (PPE-4C1 and PPE-4C2).
In combination with the results from differential calorimetry and wide-angle scattering, it can be
concluded that these complexes are amorphous materials in the temperature range 2100 to 150 8C. By
contrast, reflections of equidistant positions are present in the small-angle diagrams of the other eight
complexes, which contain the amphiphilic counter ions. Examples are shown in Fig. 66. The scattering
diagrams of these complexes are interpreted as resulting from lamellar mesophases.
The long periods of the complexes are summarized in Table 15. It can be seen that the long periods
vary from 2.38 nm (PPE-2C10) to 4.27 nm (PPE-Py18). As expected it can be observed that the repeat
unit increases with the increasing chain length of the complexed surfactant. But the increase is not
strictly linear as would be expected for a series of isomorphous lamellar structures. This can be seen in
Fig. 67 (triangles) for the series of the double-chain surfactant containing complexes. The increase of the
long period is almost linear for PPE-2C10, PPE-2C12, and PPE-2C14. Then the increase from PPE-2C14 to
PPE-2C16 reduces, and the long period of PPE-2C16 is even smaller than that of PPE-2C18. For
comparison, the theoretical values of the long period with increasing alkyl chain length is given in Fig. 67
(squares). It can be seen that the experimental values are slightly smaller than the theoretical values for
the complexes containing the shorter alkyl chains (10, 12, 14 and 16).
The scattering curves of the complexes are interpreted as resulting from lamellar structures with the
surfactants in a double-layer arrangement with the alkyl chains in a liquid-like order. The lamellar
structures are similar to those of the polystyrene sulfonate alkyl ammonium complexes, described by
Antonietti et al. [100]. They are the first to demonstrate that modifications of the lamellae such as
periodically undulations can be produced by varying the alkyl chain lengths.
The presence of undulations may be an explanation for the deviation of the linear increase of the long
period. In the case of PPE-2C14 it has been shown that its lamellar mesophase consists of alternating
0.2 0.4 0.6 .8101
102
103
104
105
106
107
108
109
PPE-2C10
PPE-2C12
PPE-2C14
PPE-2C16
PPE-2C18
Inte
nsity
[arb
.uni
ts]
s [nm-1]0
Fig. 66. The small-angle X-ray scattering diagrams of the PPE complexes with double-chain surfactants: PPE-2C10, PPE-2C12,
PPE-2C14, PPE-2C16 and PPE-2C18. The arrows indicate the non-lamellar reflections attributed to periodic undulations of the
lamellae. Reprinted with permission from Langmuir 2001;17:5098 q American Chemical Society [151].
A.F. Thunemann / Prog. Polym. Sci. 27 (2002) 1473–15721550

ionic layers (1.3 nm) and non-ionic layers (1.9 nm) with periodic undulations of a hexagonal symmetry
and a maximum-to-maximum distance of 7.5 nm (Section 3.2.1). The positions of the undulations in
adjacent layers are not correlated. Reflections resulting from undulations are marked by arrows in
Fig. 66. It is found that the structures do not follow a simple correlation in the series form PPE-2C10 to
PPE-2C18. For example, for PPE-2C14 it is possible to show a high probability of the existence of
undulations. No indications of undulations are present in the scattering curve of PPE-2C16, while a weak
reflection with a Bragg distance of about 6 nm in the curve of PPE-2C18 indicates that this complex also
10 12 14 16 18
2.5
3.0
3.5
4.0
4.5
5.0
Long
perio
d[n
m]
Number of carbonsFig. 67. The long periods of the double-chain containing surfactant complexes depend on the number of carbon atoms in the
surfactant chains. The triangles represent the values determined by small-angle scattering measurements and the squares
represent values that were calculated for a double-layer arrangement of the surfactant with extended alkyl chains. Reprinted
with permission from Langmuir 2001;17:5098 q American Chemical Society [151].
Table 15
Structural properties of the PPE complexes as determined from X-ray measurements and the positions of the maxima of the
electroluminescence
Complex Long period (nm) Correlation length (nm) Structure Maximum in the electroluminescence (nm)
PPE-4C1 –a –a Amorphous 430
PPE-4C2 –a –a Amorphous 430
PPE-2C10 2.38 11 ^ 2 Smectic A 440–450
PPE-2C12 2.80 70 ^ 5 Smectic A 440–450
PPE-2C14 3.20 170 ^ 10 Smectic A 480
PPE-2C16 3.45 65 ^ 5 Smectic A 440–450
PPE-2C18 3.25 60 ^ 5 Smectic B 440–450
PPE-Py12 3.24 14 ^ 2 Smectic A 470
PPE-Py18 4.27 50 ^ 5 Smectic B 480
PPE-S 3.33 <10 Smectic A 515
Reprinted with permission from Langmuir 2001;17:5098 q American Chemical Society [151].a No reflections are found in the small-angle scattering diagrams.
A.F. Thunemann / Prog. Polym. Sci. 27 (2002) 1473–1572 1551

has undulations. If the possibility of undulations is ignored, even though it is an interesting detail of the
lamellar structures of the complexes, then the structures at 16 8C are classified into three structural
categories: amorphous (PPE-4C1, PPE-4C2), smectic A (PPE-2C10, PPE-2C12, PPE-2C14, PPE-2C16, PPE-
Py12, PPE-S) and smectic B (PPE-2C18, PPE-Py16). Above the melt transition of the side-chains at 20 and
18 8C, respectively. It is assumed that PPE-2C18 and PPE-Py16 undergo an order–order transition from
smectic B to smectic A.
The correlation lengths of the complexes are calculated in order to compare their degree of order. This
is done by using the widths of the (001) reflections [64]. It can be seen in Table 15 that the correlation
lengths are in the range 10–170 nm. The trend that the correlation lengths of the complexes with the
shorter alkyl chains are lower than that of the complexes with the longer chains can be seen. For
example, 14 nm are found for PPE-Py12 and 50 nm PPE-Py18. But there is an exception: PPE-2C14,
which has the highest correlation length (170 nm). Probably, this results from its additional ordering in
the plane of the lamellae.
3.3.3. Optical properties
The optical properties of a number of poly(1,4-phenyleneethynylene)s in solution are found to depend
strongly on the concentration of the polymer solution, which is interpreted as the result of the
aggregation behavior of these polymers [105]. By contrast, it is found that the photoluminescence of the
complexes depends on the type of the counter ions but it is widely independent of their concentrations.
The emission spectra of thin films are given in Fig. 68 as an example. The excitation wavelength is
380 nm.
The positions of the emission maxima of the complexes depend on the nature of the head group. They
shift in the line PPE-4C1 (470 nm), PPE-2C18 (490 nm), PPE-Py16 (510 nm) and PPE-S (515 nm). The
same sequence is found in the electroluminescence diagrams of single layer LEDs, which contain the
complexes in the form of thin films (140 nm) as the active layer. It can be seen in Fig. 69 that the shift of
400 500 600 700
515510
490470
Inte
nsity
[a.u
.]
Wavelength [nm]Fig. 68. Fluorescence emission spectra of PPE-4C2, (solid line), PPE-2C18 (dashed line), PPE-Py16 (dotted line) and PPE-S
(dash-dotted line). The emission maxima are indicated by arrows. The excitation wavelength is 380 nm. Reprinted with
permission from Langmuir 2001;17:5098 q American Chemical Society [151].
A.F. Thunemann / Prog. Polym. Sci. 27 (2002) 1473–15721552

the maxima of the electroluminescence is larger than in the photoluminescence (85 nm instead of
45 nm). The curves of PPE-4C1 (430 nm), PPE-2C18 (440 nm), PPE-Py16 (480 nm) and PPE-S (515 nm)
are displayed. The values of the position of the electroluminescence maxima are summarized in
Table 15. Further it is found that the positions of the maxima of the double-chain containing complexes
do not depend on the chain length; they are between 440 and 450 nm. PPE-2C14 is an exception. Its
maximum in the electroluminescence spectra is found at 480 nm. This possibly results from the parallel
alignment of the polymeric chains in the plane of the lamellae, which leads to an increase in the
conjugation lengths of the polymeric backbone. Despite this exception it can be concluded that the
optical properties of the complexes are largely independent of the length of the alkyl chains, but they
depend on the nature of the ionic head group to a great extent. Tentatively this shift of the fluorescence
maxima can be interpreted as resulting from the polarizability of the ionic head group. Within the HSAB
concept the ammonium group is the hardest and least polarizable; it is followed by the pyridinium group
and the sulfonium group, which is the softest and most polarizable group. Therefore, under the condition
that the type of the mesomorphous structure is the same, it is concluded that the electroluminescence
spectra shift to higher wavelengths when the counter ions become more polarizable. The counter ions
seem to influence the effective conjugation length of the polymeric backbone: hard counter ions result in
its increase, whereas soft counter ions result in its decrease.
From a material science point of view, it is interesting that the emission properties of a conjugated
polymer can be shifted simply by exchanging the counter ions. It is conceivable that red, green and blue
LEDs could be produced by using one conjugated polymer; only the counter ions have to be changed.
Appropriate candidates for this may be cationic and anionic derivatives of poly( p-phenylenes) [48,129,
130] Current–voltage diagrams of the LEDs from the PPE complexes are recorded in order to determine
the voltage where the LEDs start emitting light (turn-on point). It is found that the turn-on points of
LEDs from all the complexes are around 6 V when the thickness of the active layer is 140 ^ 20 nm. A
typical current–voltage curve is shown in Fig. 70. This finding is surprising because it is normally
300 400 500 600 700
515480440
430
Inte
nsity
[a.u
.]
Wavelength [nm]Fig. 69. Electroluminescence spectra of single-layer LEDs of PPE-4C2, (solid line), PPE-2C18 (dashed line), PPE-Py16 (dotted
line) and PPE-S (dash-dotted line). The emission maxima are indicated by arrows. Reprinted with permission from Langmuir
2001;17:5098 q American Chemical Society [151].
A.F. Thunemann / Prog. Polym. Sci. 27 (2002) 1473–1572 1553

expected that the turn-on point also depends on the nature of the counter ion. It is known that the turn-on
point of similarly prepared LEDs using the pristine polymer with covalently bound side groups, poly(2-
ethylhexyloxycarbonyl-1,4-phenyleneethynylene), is around 21 V with an emission maximum at
557 nm [131]. The much lower turn-on point of the complexes compared with the covalent analogue
polymer is probably due to the highly ionic character of the complexes. Normally such low turn-on
points need the support of an additional charge transport layer [102] which, concerning the complexes, is
obviously built in.
In conclusion, it has been demonstrated that the optical properties of single-layer LEDs of PPE
complexes depend on the nature of the counter ions. The maximum of the electroluminescence can by
shifted from 430 nm, when using hard counter ions, to 515 nm when using soft counter ions. It is
suggested that it is, in principle, possible to produce single-layer LEDs which cover the entire visible
spectrum by using only one polymer. The turn-on points of the LEDs are around 6 V for layer
thicknesses of 140 nm. The complexes of PPE with amphiphilic counter ions are either smectic A or
smectic B at room temperature, with repeat units of 2.38–4.27 nm, while the complexes with
non-amphiphilic counter ions are amorphous. The correlation lengths of the lamellar structures vary
between 10 and 170 nm.
4. Columnar discotic complexes
There is currently much interest in polycyclic aromatic materials which show strong p–p interactions
and form columnar mesophases [132–136]. Apart from the beauty of their structures, potential
applications such as vectorial charge transport layers in xerography, electrophotography and molecular
electronic devices are under discussion. It has been observed, e.g. that peri-condensed hexabenzocor-
onenes show diode-like current–voltage signals for single molecules [137] and a rapid charge transport
along self-assembled columns with high carrier mobilities. For an oriented layer with a thickness of
0 2 4 6 8 10 12 14 16 18 20
0
20
40
60
turn-on point
Cur
rent
[mA
]
Voltage [V]Fig. 70. Current–voltage curve of single-layer LED with PPE-2C14 as the active layer. The layer thickness is 140 nm. Reprinted
with permission from Langmuir 2001;17:5098 q American Chemical Society [151].
A.F. Thunemann / Prog. Polym. Sci. 27 (2002) 1473–15721554

1 mm and an applied potential of 1 V the drift time of charges across such a layer is calculated to be less
than 1 ms [138]. The one-dimensional nature of the charge transport makes these molecular structures
promising as nanowires in molecular electronic devices. Section 4.1 reports on a hexa-peri-
hexabenzocoronene, functionalized with a carboxylic acid group, which is complexed with a
hydrophobically modified polyethyleneimine.
In comparison to the non-complexed discotic material the complex is found to be more elastic over a wide
range of temperatures. The intra-columnar ordering of the complex, which is an essential characteristic for a
one-dimensional conductivity, is better than in the hexa-peri-hexabenzocoronene. Further, an important
general property of mesophases formed by polyelectrolyte–surfactant complexes compared with typical
liquid crystalline phases is the absence or reduction of sharp dislocations in their optical textures [12,72].
This indicates the presence of smoother domain boundaries in their nanostructures than those present in
their surfactant liquid crystalline phases. It is expected that highly extended columns in a polymer
complex of an amphiphilic hexabenzocoronene could be useful molecular nanowires. Section 4.2 reports
on a complex which is formed by an alkylated, peri-condensed hexabenzocoronene, functionalized by a
carboxylic acid group, and an amino-functionalized polysiloxane.
4.1. Polyethyleneimine hexa-peri-hexabenzocoronene [139]
In this section, the phase behavior and mechanical properties of a hexabenzocoronene (HBC) which is
functionalized by a carboxylic acid group and that of its complex with hydrophobic modified
polyethyleneimine (PEIC22–HBC) will be described. The structures of the compounds are shown in
Fig. 71.
4.1.1. Nanostructures
Analogously to polyelectrolyte–surfactant complexes of the previous sections, HBC is treated as an
surfactant and the PEIC22 as a polyelectrolyte. Due to the insolubility of HBC in water, its complexation
with PEIC22 is carried out in chloroform using an equimolar amount of HBC with respect to amino and
carboxylate functions. The resulting complex HBCC22-PEI is solvent-cast as films and analyzed by
IR-spectroscopy, DSC, X-ray scattering and dynamic-mechanical measurements. A comparison of the
IR-spectra of HBC and HBCC22-PEI shows that the carboxylic acid vibration found for HBC at
1710 cm21 is absent for HBCC22-PEI. Instead of the sharp carboxylic acid band in the spectrum of HBC
a broad diffuse band between 1500 and 1760 cm21 is present in HBCC22-PEI resulting from ionic
carboxylate-ammonium structures. In both spectra the CyC stretch vibration at 1610 cm21 and the CH2
bending vibrations at 1466 and 1456 cm21 are identical. From this it is concluded that, within the
experimental error, all of the carboxylic acid functions of HBC form acid–base pairs with the amino
functions of PEIC22, resulting in a stoichiometric PEIC22–HBC complex.
In the wide-angle X-ray diagram of PEIC22 at 20 8C, sharp reflections are found at a scattering vector
of s ¼ 2:39 and 2.63 nm21. This is attributed to a side-chain crystallinity of PEIC22, in which the
docosylic chains crystallize. For determination of the lattice parameters, the data are compared with that
found for orthorhombic polyethylene [140] with lattice constants of a ¼ 0:7417 nm; b ¼ 0:4945 nm and
c ¼ 0:2547 nm: Assuming the same lattice for PEIC22, the indexing of the upper reflections is (110) and
(200) giving lattice constants a ¼ 0:76 nm and b ¼ 0:50 nm: In the unit cell the alkyl chains are oriented
perpendicular to the a–b plane and the average area per chain is 0.19 nm2, which is slightly larger than
that for polyethylene (0.183 nm2). Neither HBC nor the complex PEIC22–HBC shows sharp reflections
A.F. Thunemann / Prog. Polym. Sci. 27 (2002) 1473–1572 1555

in the wide-angle region of the scattering curves, proving the absence of crystallinity in the structures.
The absence of crystallinity in PEIC22–HBC is also indicative of a stoichiometric complex.
The DSC curve of PEIC22 shows a melting peak at 59 8C with an enthalpy of 73 J/g. Under the usual
assumptions made for the calculation of crystallinity [141], the amount of crystalline side-chains of
PEIC22 is determined to be in the range 40–50%. In the DSC trace of HBC an endothermic transition is
found at 93 8C for heating and at 62 8C for cooling. For PEIC22–HBC an endothermic transition is
found at 70 8C for heating and at 52 8C upon cooling. The different values found for the hysteresis, 18 8C
PEIC22–HBC and 31 8C HBC, may be interpreted as a consequence of a faster relaxation to an
equilibrium state of PEIC22–HBC. Considering the absence of crystalline reflections in the X-ray
diagrams of HBC and PEIC22–HBC, the exothermic transitions can be assigned to liquid crystalline
phase transitions. This assumption is proven by optical polarization microscopy and by small-angle
X-ray scattering.
Both compounds show strong birefringence when observed between crossed polarizers and a texture
change at transition temperatures found by DSC. Unfortunately, the textures do not allow an
unambiguous determination of the liquid crystalline phases. Therefore, small-angle X-ray scattering
diagrams are recorded at 20 and 110 8C. As shown in Fig. 72, at 20 8C seven reflections are found in the
small-angle scattering curve of HBC. This pattern is interpreted as a columnar structure with a two-
dimensional centered superstructure (Fig. 71). The columns are aligned parallel, where the aromatic
cores of HBC form stacks and are tilted with respect to the column axis. The indices of the reflections
and the observed and calculated reflex positions are given in the literature [139]. On the basis of these
∆T
CH2)10
C12H25
C12H25
H25C12
H25C12 C12H25
COO
(
(
N
CH2)21
CH3
CH2 CH2
H
0.16N
H
H
CH2 CH2 0.84
(PEIC22-HBC)
Fig. 71. The molecular structure of an ionically bound complex (PEIC22–HBC) formed by a hydrophobic modified
polyethyleneimine (PEIC22) and a hexa-peri-hexabenzocoronene (HBC). PEIC22 and HBC are not drawn. Sixteen percent of
the amino functions of PEIC22 are alkylated by n-decoys chains, HBC is functionalized by a carboxylic acid function which
serves as an anchor group. The sketch on the right illustrates the columnar mesophases formed by HBC and PEIC22–HBC. For
clarity only the aromatic cores of HBC are drawn. At room temperature a rectangular centered lattice is found for both. The
aromatic cores are tilted with respect to the column axis. At higher temperatures the columns are oriented in a hexagonal
columnar mesophase. Reprinted with permission form J Mater Chem 1999; 9:1055 q The Royal Society of Chemistry [139].
A.F. Thunemann / Prog. Polym. Sci. 27 (2002) 1473–15721556
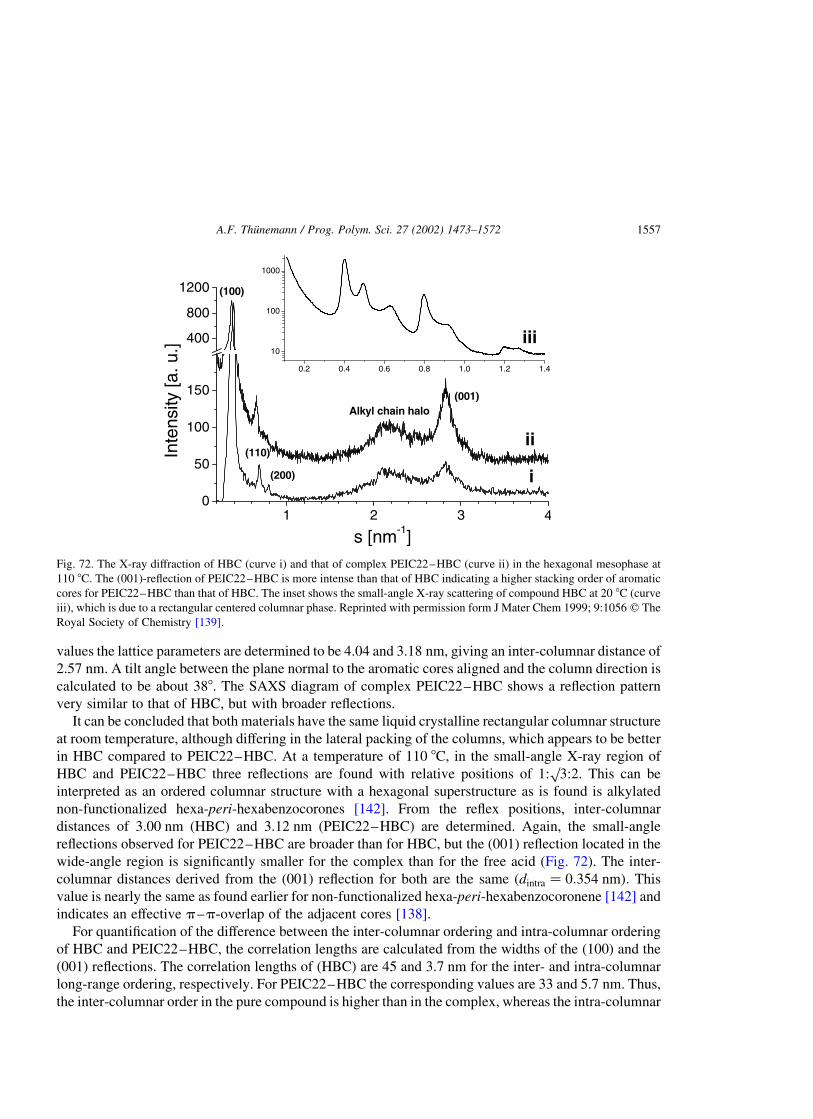
values the lattice parameters are determined to be 4.04 and 3.18 nm, giving an inter-columnar distance of
2.57 nm. A tilt angle between the plane normal to the aromatic cores aligned and the column direction is
calculated to be about 388. The SAXS diagram of complex PEIC22–HBC shows a reflection pattern
very similar to that of HBC, but with broader reflections.
It can be concluded that both materials have the same liquid crystalline rectangular columnar structure
at room temperature, although differing in the lateral packing of the columns, which appears to be better
in HBC compared to PEIC22–HBC. At a temperature of 110 8C, in the small-angle X-ray region of
HBC and PEIC22–HBC three reflections are found with relative positions of 1:p
3:2. This can be
interpreted as an ordered columnar structure with a hexagonal superstructure as is found is alkylated
non-functionalized hexa-peri-hexabenzocorones [142]. From the reflex positions, inter-columnar
distances of 3.00 nm (HBC) and 3.12 nm (PEIC22–HBC) are determined. Again, the small-angle
reflections observed for PEIC22–HBC are broader than for HBC, but the (001) reflection located in the
wide-angle region is significantly smaller for the complex than for the free acid (Fig. 72). The inter-
columnar distances derived from the (001) reflection for both are the same ðdintra ¼ 0:354 nmÞ: This
value is nearly the same as found earlier for non-functionalized hexa-peri-hexabenzocoronene [142] and
indicates an effective p–p-overlap of the adjacent cores [138].
For quantification of the difference between the inter-columnar ordering and intra-columnar ordering
of HBC and PEIC22–HBC, the correlation lengths are calculated from the widths of the (100) and the
(001) reflections. The correlation lengths of (HBC) are 45 and 3.7 nm for the inter- and intra-columnar
long-range ordering, respectively. For PEIC22–HBC the corresponding values are 33 and 5.7 nm. Thus,
the inter-columnar order in the pure compound is higher than in the complex, whereas the intra-columnar
1 2 30
50
100
150
400
800
1200
iii
i
ii
(200)
(110)
(100)
Alkyl chain halo(001)
Inte
nsity
[a.u
.]
s [nm-1]
0.2 0.4 0.6 0.8 1.0 1.2 1.4
10
100
1000
4
Fig. 72. The X-ray diffraction of HBC (curve i) and that of complex PEIC22–HBC (curve ii) in the hexagonal mesophase at
110 8C. The (001)-reflection of PEIC22–HBC is more intense than that of HBC indicating a higher stacking order of aromatic
cores for PEIC22–HBC than that of HBC. The inset shows the small-angle X-ray scattering of compound HBC at 20 8C (curve
iii), which is due to a rectangular centered columnar phase. Reprinted with permission form J Mater Chem 1999; 9:1056 q The
Royal Society of Chemistry [139].
A.F. Thunemann / Prog. Polym. Sci. 27 (2002) 1473–1572 1557

long-range order of the pure substance is lower than in the complex. For a desired rapid charge transport
along the columns, the p–p-overlaps and the intra-columnar long-range ordering are essential
properties. Since the p–p-overlap of HBC and PEIC22–HBC are equal, but the intra-columnar long-
range order of PEIC22–HBC is better, a higher charge transport may be expected for PEIC22–HBC
than for HBC.
4.1.2. Mechanical properties
In addition to the control of the mesomorphic structure, the mechanical properties play a key role in
estimating the potential of HBC and HBC-PEI as promising materials. It is known for many
polyelectrolyte–surfactant complexes that the mechanical properties are significantly improved by the
polymeric compound [143]. Hence such an improvement for the complexation of HBC can also be
expected.
The shear modulus G of films, prepared by solvent casting of HBC and PEIC22–HBC, is determined
by temperature-dependent dynamic-mechanical measurements. It is found for the pure substance and the
complex that the shear modulus of the rectangular columnar phase is one order of magnitude higher than
that of the hexagonal columnar phase. Below the phase transition, values of G in the range between 1 and
10 MPa are measured for HBC and PEIC22–HBC. Above the phase transition, G is about 0.1 MPa. The
different behavior of loss-angle d as shown in Fig. 73 is different. It can be seen that d increases from 5 to
408 in the range from 20 to 130 8C for HBC, whereas d increases only from 10 to 208 in the same
temperature range for PEIC22–HBC. This means that HBC is more elastic at room temperature and
viscous at higher temperatures. On the other hand, PEIC22–HBC shows an approximately constant
elasticity over the whole temperature range. This may be explained by considering PEIC22 as a kind of
cross-linker, which forms a flexible three-dimensional network bound ionically to HBC.
In conclusion it is found that the carboxylic acid functionalized hexabenzocoronene HBC forms two
columnar liquid crystalline structures. At room temperature a rectangularly centered symmetry is found,
20 40 60 80 100 120 1400
10
20
30
40
loss
angl
e[d
egre
e]
Temperature [ ˚C]Fig. 73. Temperature dependent loss-angle determined by dynamic-mechanical measurements of (b) (squares) and of (c)
(circles). The shear rate is 0.1 s21. Reprinted with permission form J Mater Chem 1999; 9:1056 q The Royal Society of
Chemistry [139].
A.F. Thunemann / Prog. Polym. Sci. 27 (2002) 1473–15721558

which changes to a hexagonal ordered columnar structure at temperatures higher than 93 8C. In addition
the complexation of HBC in chloroform with a hydrophobic modified polyethyleneimine gives a
stoichiometric complex similar to solid waterborne polyelectrolyte–surfactant complexes. For the
stoichiometric complex of PEIC22 and HBC resulting in PEIC22–HBC, the same columnar liquid
crystalline phases are present, but with a lower phase-transition temperature (70 vs. 93 8C) and a lower
hysteresis (18 vs. 31 8C), observed for the phase-transition temperature between heating and cooling.
Furthermore, the intra-columnar order of the complex is higher than that of the non-complexed
specimen, whereas the inter-columnar order is lower. From the temperature dependence of the loss-
angle, it is concluded that the elasticity of HBC can be improved by complexation, probably without the
danger of reducing its high carrier mobilities.
4.2. Polysiloxane hexa-peri-hexabenzocoronene [144]
This section reports on a complex which is formed by HBC and an amino-functionalized
polysiloxane. The complexation of the aminoethylaminopropyl functionalized polysiloxane PDMA with
the hexa-peri-hexabenzocoronene HBC to complex PDMS-HBC is schematically shown in Fig. 74 and
has been monitored by IR-spectroscopy. A strong carboxylic acid vibration band at 1710 cm21 is present
in the sum of the FTIR spectra of PDMS and HBC, while it is absent in the spectrum of PDMS-HBC. The
other vibrations of both spectra are identical and identified as the CyC stretch vibrations around
PDMS-HBC
m(
n
H3C Si O
CH3
CH3
Si O
CH3
CH3
Si
CH3
CH2)3
O
N CH2CH2NH2
Si
CH3
CH3
CH3
H
H
(
C12H25
C12H25
C12H25 C12H25
C12H25
CH2)10
COO n = 0.936
m = 0.064
Fig. 74. The molecular structure of an ionically bound complex PDMS–HBC formed by an aminoethylaminopropyl
functionalized polysiloxane (PDMS) and a hexabenzocoronene (HBC). PDMS and HBC are not drawn. HBC is functionalized
by a carboxylic acid function which serves as an anchor group. Reprinted with permission form J Mater Chem 2000;10(6):1326
q The Royal Society of Chemistry [144].
A.F. Thunemann / Prog. Polym. Sci. 27 (2002) 1473–1572 1559

1600 cm21, the CH2 symmetric (scissors) and the CH3 asymmetric deformation vibrations are located at
1460 cm21. Further, the CH3 symmetric (umbrella) deformation is at 1260 cm21. From this it is
concluded that, within the experimental error, all of the carboxylic acid functions of HBC form acid–
base pairs with the amino functions of PDMS in the complex.
4.2.1. Nanostructures
ten Brinke et al. [145] have reported on lamellar structures of comb copolymer-like systems obtained
by hydrogen bonding between polymers containing basic moieties and surfactants. Their complexes are
similar to PDMS-HBC with respect to their molecular interactions. In the previous section, it is shown
that the HBC form columnar polymer complexes, which contain about 9% (w/w) of a hydrophobically
modified polyethyleneimine [139]. Here, the polymer content of PDMS-HBC is much higher (46% (w/
w)). Therefore, new columnar morphologies of PDMS-HBC, compared to those of the earlier complex,
should be expected. Temperature-dependent small-angle X-ray diffraction has been used to investigate
its supramolecular ordering. As expected, a number of reflections are present in the scattering curves
(Figs. 75 and 76), but it is surprising that more and sharper reflections are found at 120 8C (Fig. 76) than
at 20 8C (Fig. 75). Obviously a hexagonal columnar phase, which is typical for hexa-peri-
hexabenzocoronene compounds [146], can be excluded.
The most simple models which explain the reflection positions and their relative intensities are two-
dimensional oblique lattices of columnar phases: Col1 which is stable at room temperature and Col2which is stable at higher temperatures. For the lattice constants a ¼ b ¼ 5:0 nm and g ¼ 1128 for Col1are calculated and a ¼ b ¼ 5:5 nm and g ¼ 1088 for Col2. The areas of the unit cells are 23.2 nm2 (Col1)
and 28.8 nm2 (Col2). It is striking that the scattering intensity of the reflections at lower scattering
0.2 0.4 0.6 0.8 1.0
10
100
1000
10000
Inte
nsity
[arb
.uni
ts]
s [nm-1]Fig. 75. Small-angle X-ray scattering of compound PDMS–HBC in the Col1 phase at 20 8C (solid line). The dashed line is a
calculated scattering curve of the columnar phase, which corresponds to the calculated density profile of the inset with four
columns per unit cell. The cell parameters are a ¼ b ¼ 5:0 nm and g ¼ 1128: The discs have a tilt angle of about 458 in relation
to the column axis. Reprinted with permission form J Mater Chem 2000;10(6):1326 q The Royal Society of Chemistry [144].
A.F. Thunemann / Prog. Polym. Sci. 27 (2002) 1473–15721560

vectors (around 0.2 nm21) is lower than that of the group of reflections around 0.4 nm21. This is
explained by an arrangement of four columns per unit cell, which group around the center of the unit cell
(see insets of Figs. 75 and 76: The corresponding analytical scattering curves are shown as dashed lines).
Lists of the measured and calculated reflex positions and Miller indices are given in the literature [144].
The normals of the aromatic planes within Col1 are tilted with respect to the column axes. The tilt angle
is about 458 which gives an axis ratio of 1:0.7 for the in-plane projection. Within the Col2 phase the
normals of the column axis are aligned parallel to the column axis. It has been observed, for the complex
of HBC with a polyethyleneimine, that the normals of the aromatic cores are tilted at lower temperatures
but are parallel at higher temperatures (Section 4.1.1).
Explanations for the reduced symmetry of Col1 and Col2 compared to the expected hexagonal and
rectangular structures may be packing constraints, because the carboxylic acid function is linked
ionically to the polysiloxane and it reduces the molecular symmetry from D6h to C2v: Further the
alkylated chains and the siloxane chains are not miscible and therefore, together with the aromatic cores,
the complex contains three incompatible elements, which lead to micro-segregation. The situation may
be considered to be similar to that of triblock copolymers where the formation of mesomorphous
structures is controlled by the relative incompatibilities of the three polymeric components of the block
copolymers [147]. It is surprising that, from the widths of the reflex positions, the supramolecular order
of Col2 is better than in Col1. From the width of the most intensive reflection (index 200), the in-plane
correlation length of Col1 is about 50 nm (20 8C) and that of Col2 is about 150 nm (120 8C). The reason
for the better order within the higher temperature phase than in the lower temperature phase may be that
the intra-columnar stacking order of the tilted arrangement is not as good as it is in the non-tilted case. In
order to prove this assumption the molecular order has been investigated using wide-angle X-ray
scattering. It can be seen in Fig. 77 (curve c) that, in addition to two broad reflections at s ¼ 1:32 and
0.2 0.4 0.6 0.8 1.0
1
10
100
1000
Inte
nsity
[arb
.uni
ts]
s [nm-1]Fig. 76. Small-angle X-ray scattering of compound PDMS–HBC in the Col2 phase at 120 8C (solid line). The dashed line is a
calculated scattering curve of the phase, which corresponds to the calculated density profile of the inset with four columns per
unit cell. The cell parameters are a ¼ b ¼ 5:5 nm and g ¼ 1088: The discs are not tilted. Reprinted with permission form J
Mater Chem 2000;10(6):1327 q The Royal Society of Chemistry [144].
A.F. Thunemann / Prog. Polym. Sci. 27 (2002) 1473–1572 1561

2.30 nm21, a relatively sharp reflection is present at s ¼ 2:86 nm21 in the diagram of Col2 at 120 8C
(Bragg distances are 0.76, 0.46 and 0.35 nm). The first reflection is attributed to the short-range order of
the siloxane segments.
For clarity, the wide-angle scattering of the pristine siloxane is shown in Fig. 77 (curve a). It can be
seen there that in the scattering curve of the siloxane only one reflection is present at about the same
position (1.32 nm21) as the first wide-angle reflection of Col1. The reflection at d ¼ 0:46 nm is
attributed to the scattering of the alkyl chains which is typically found in polyelectrolyte–surfactant
complexes with a mesomorphous structure (e.g. the complexes of polystyrenesulfonate with
alkyltrimethylammonium surfactants [100]). The relatively sharp reflection with d ¼ 0:35 nm defines
the intra-columnar distance. This value is the same as that of graphite (0.335 nm) and indicates a strong
p–p overlapping of the adjacent hexa-peri-hexabenzocoronene discs in the Col2 phase, which is
consistent with the supramolecular model derived from the small-angle scattering data. In the wide-
angle diagram of Col1 two broad reflections are found at about the same position (1.35, 2.33 nm21) and
with the same width as for Col2 (Fig. 77, curve b). Therefore, Col1 and Col2 are very similar in the
molecular order of their siloxane and alkyl chains, which is only of short-range. But in contrast to Col2only a weak reflection is present in the region around 3 nm21 which is characteristic for an intra-
columnar ordering. Therefore, it is concluded that the intra-columnar order within Col1 is much weaker
than within Col2. From a curve fitting of Lorentzian profiles onto the scattering curves (not shown), the
intra-columnar correlation length of Col1 is 2 nm, whereas that of Col2 is 8 nm. This agrees with the
structure model of Col1 with tilted discs (Fig. 75 inset) which shows a lower p–p-overlapping than
within the columns of Col2.
In order to confirm the proposed model of extended columns, the structure is visualized by electron
microscopy [144, page 1328]. Patterns of dark and bright stripes are found in samples prepared in thin
sections. The average distance of equal stripes is about 2.3 nm. The bright lines are attributed to columns
of hexabenzocoronene and the dark ones to their surrounding matrix of polysiloxane, which has a higher
electron density. The cut along the columns is explained as a result of the fact that these are the directions
1.0 1.5 2.0 2.5 3.0 3.5 4.00
500
1000
1500
2000
alkyl chain halosiloxane chain halo (001)
(c)
(b)
(a)Inte
nsity
[arb
.uni
ts]
s [nm-1]Fig. 77. Wide-angle X-ray scattering of the polysiloxane (curve a), the Col1 phase at 20 8C (curve b) and the Col2 phase at
120 8C (curve c). Reprinted with permission form J Mater Chem 2000;10(6):1327 q The Royal Society of Chemistry [144].
A.F. Thunemann / Prog. Polym. Sci. 27 (2002) 1473–15721562

with the lowest mechanical strength and that these are preferred because the siloxane matrix remains soft
even at lower temperatures. Surprisingly, as a consequence of the complexation, the patterns are almost
free of dislocations. And from the length of the stripes the average column height is estimated to be at
least 200 nm. This is more than 100 times the column diameter (1.4 nm). Probably, their height is
significantly larger. This remarkable height of defect-free columns results from the polysiloxane which
prevents the columns from breaking off. In combination with the rapid charge transport of such materials
[138] this seems to be very promising for electronic devices such as graphitic nanowires. Their
electronic properties can, in principle, be modified by different substituents or by intercalation of low
molecular weight molecules. Knowledge of graphite and carbon fiber intercalation compounds [148] can
be used for the modification of the electrical properties of these quasi-graphitic nanowires. According to
current knowledge, the complex of PDMS-HBC is capable of forming the highest known intra-columnar
order of discotic mesophases reported to date. Very high correlation lengths of two-dimensional lattices
in hexagonal columnar phases, greater than 400 nm, have already been described [149].
4.2.2. Thermal and mechanical properties
The thermal and the mechanical properties of PDMS-HBC are investigated by DSC and dynamic
mechanical analysis. Typical DSC traces for heating and cooling scans, measured with a heating rate of
10 K/min, are given in Fig. 78. An exothermic transition with a maximum at 85 8C is found upon heating
to have a width of 16 8C (lower temperature onset at 76 8C, higher temperature onset at 92 8C). After
cooling the transition is found to be at a maximum at 57 8C and at a width of 16 8C (left onset at 46 8C,
higher temperature onset at 62 8C). The large hysteresis of the transition at a width of 30 8C indicates that
the bulky aromatic cores are involved in the transition, their reorientation is known to show slow kinetics
[139].
This transition is assigned to the order–order transition from Col1 to Col2, which is similar to that
reported on in the previous section on a complex of HBC with a hydrophobically modified
-30 0 30 60 90 120
-0.6
-0.4
-0.2
0.0
0.2
0.4
0.6
cooling
heating
Hea
tFlo
w[m
W/m
g]
Temperature [˚C]Fig. 78. DSC traces of complex PDMS–HBC while heating and cooling. The exothermic transition at 85 8C in the heating scan
and the endothermic transition at 57 8C indicate a reversible order–order transition form a column phase Col1 to a column phase
Col2. Reprinted with permission form J Mater Chem 2000;10(6):1328 q The Royal Society of Chemistry [144].
A.F. Thunemann / Prog. Polym. Sci. 27 (2002) 1473–1572 1563
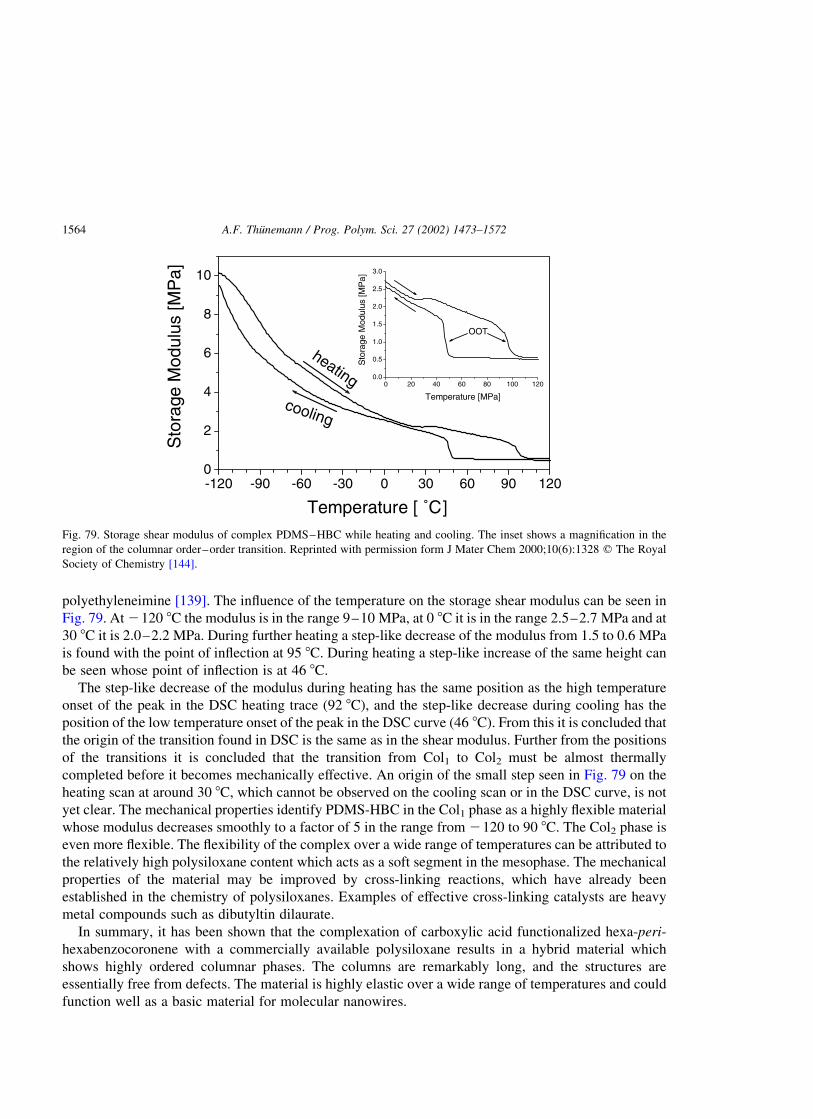
polyethyleneimine [139]. The influence of the temperature on the storage shear modulus can be seen in
Fig. 79. At 2120 8C the modulus is in the range 9–10 MPa, at 0 8C it is in the range 2.5–2.7 MPa and at
30 8C it is 2.0–2.2 MPa. During further heating a step-like decrease of the modulus from 1.5 to 0.6 MPa
is found with the point of inflection at 95 8C. During heating a step-like increase of the same height can
be seen whose point of inflection is at 46 8C.
The step-like decrease of the modulus during heating has the same position as the high temperature
onset of the peak in the DSC heating trace (92 8C), and the step-like decrease during cooling has the
position of the low temperature onset of the peak in the DSC curve (46 8C). From this it is concluded that
the origin of the transition found in DSC is the same as in the shear modulus. Further from the positions
of the transitions it is concluded that the transition from Col1 to Col2 must be almost thermally
completed before it becomes mechanically effective. An origin of the small step seen in Fig. 79 on the
heating scan at around 30 8C, which cannot be observed on the cooling scan or in the DSC curve, is not
yet clear. The mechanical properties identify PDMS-HBC in the Col1 phase as a highly flexible material
whose modulus decreases smoothly to a factor of 5 in the range from 2120 to 90 8C. The Col2 phase is
even more flexible. The flexibility of the complex over a wide range of temperatures can be attributed to
the relatively high polysiloxane content which acts as a soft segment in the mesophase. The mechanical
properties of the material may be improved by cross-linking reactions, which have already been
established in the chemistry of polysiloxanes. Examples of effective cross-linking catalysts are heavy
metal compounds such as dibutyltin dilaurate.
In summary, it has been shown that the complexation of carboxylic acid functionalized hexa-peri-
hexabenzocoronene with a commercially available polysiloxane results in a hybrid material which
shows highly ordered columnar phases. The columns are remarkably long, and the structures are
essentially free from defects. The material is highly elastic over a wide range of temperatures and could
function well as a basic material for molecular nanowires.
-120 -90 -60 -30 0 30 60 90 1200
2
4
6
8
10
cooling
heating
Sto
rage
Mod
ulus
[MP
a]
Temperature [ ˚C]
0 20 40 60 80 100 1200.0
0.5
1.0
1.5
2.0
2.5
3.0
OOT
Temperature [MPa]
Sto
rage
Mod
ulus
[MP
a]
Fig. 79. Storage shear modulus of complex PDMS–HBC while heating and cooling. The inset shows a magnification in the
region of the columnar order–order transition. Reprinted with permission form J Mater Chem 2000;10(6):1328 q The Royal
Society of Chemistry [144].
A.F. Thunemann / Prog. Polym. Sci. 27 (2002) 1473–15721564
5. Summary and outlook
It has been shown in this review that polyelectrolytes and surfactants can be used as versatile building
blocks for the design of functionalized polyelectrolyte–surfactant complexes with a great variability of
nanostructures. Useful surfactants are fluorinated surfactants and functionalized disk-shaped molecules.
The nanostructures of these complexes in their forms as bulk material, ultra-thin films on surfaces, and
nanoparticles are the result of the self-assembly of the complexes.
The use of fluorinated surfactants makes possible the design of complexes with different lamellar
morphologies including flat, undulated and perforated lamellar structures with repeat units well below
10 nm. The perforation density within the lamellae can be controlled by the charge density of the
polyelectrolyte. When the charge density increases, then the perforation density too increases. The
polyelectrolyte–fluorinated surfactant complexes (PEFA) are capable of forming surfaces of low and
ultra-low surface energies. Critical surface tensions as low as 6 mN/m are typical values for some of
these complexes. Surfaces of these complexes show outstanding oil-repellent properties, which are
independent of their thickness. In contact with water, the surfaces of PEFA complexes show a reversible
surface reconstruction resulting in an increase of the surface energies to values of about 30 mN/m. Thin
and ultra-thin films of PEFA complexes of high homogeneity can be formed in a single-step procedure.
Their thickness ranges from about 370 down to 5.7 nm. These films are built from macroscopically
oriented stacks of alternating ionic and non-ionic layers and their wetting behavior is almost independent
of their thickness. Surface energies of complex films can be tuned in the range 9–19 mN/m by varying
the length of the fluorinated moieties.
PEFAs with discotic columnar nanostructures can be produced by the complexation of long-chain
fluorinated surfactants. Diazosulfonate functionalized polymers can be used to prepare super-strongly
segregated lamellar nanostructures and ultra-low energy surfaces forming PEFA complexes. Thin films
of these complexes may be useful as possible information storage systems if the pulse of a laser beam
can switch the surface energy.
Nanoparticle systems of PEFAs have been designed for the preparation of waterborne PEFA surfaces.
It has been demonstrated that PEFAs show internal nanostructures not only in their form as bulk
materials, but also that nanoparticles of the PEFAs themselves, with sizes around 300 nm, contain
internal lamellar smectic A-like structures with repeat units around 3 nm. A comparison of silicon
surfactant containing complexes with the PEFA complexes revealed that both are capable of forming
ordered nanostructures, but PEFAs are superior in their wetting properties. After changing the polymeric
backbone from carbon to siloxane, it is possible to use their self-assembling properties to form a stable
surface in a salt-solution that is both highly oil- and water-repellent.
For future developments such polysiloxane–fluorinated surfactant complexes and PEFAs may be
prove useful in forming non-toxic anti-fouling and biocompatible surfaces that actively stabilize the
secondary structure of blood proteins. Furthermore, nanoparticles of PEFA are shown to be able to
dissolve amyloid plaques in animal cell tissues [150]. This opens a wide area of possible applications of
PEFAs and polysiloxane–fluorinated surfactant complexes for medical, biological and pharmacological
applications. In this context, it is worthwhile to mention that many of the self-assembled PEFA
nanostructures resemble the structures of natural membranes. This analogy to biological systems is
important for possible future applications. In the direct neighborhood of highly ionic segments,
perfluorinated chains could play a key role in the development of attractive applications of PEFA
complexes for life science purposes.
A.F. Thunemann / Prog. Polym. Sci. 27 (2002) 1473–1572 1565

In the third part of this review, the use of polyelectrolytes with conjugated backbones of the poly( p-
phenylene) and poly(phenyleneethynylene) type result in highly optically active complexes. As for
PEFAs, the self-assembly of the complexes results in ordered nanostructures of the lamellar and of the
columnar type. The nanostructures of the optically active complexes are formed in a single-step in both
the bulk materials as well as in thin films. This is an advantage, from the material science point of view,
when thinking about the use of new materials in optoelectronic devices such as LEDs. In contrast to the
optically active complexes created here, other ordered nanostructures with optical activities, such as
Langmuir–Blodgett films, have to be prepared in multi-step procedures. The Langmuir–Blodgett
technique does, indeed, allow for a high control of the structure formation at every step of the layer
deposition. It is, however, a time-consuming process that reduces the attractivity of Langmuir–Blodgett
films for the development of optoelectronic devices. The same holds for other layer-by-layer deposition
techniques. Therefore, the possibility of deposing strongly and super-strongly segregated multi-layers of
optically active compounds in a single step procedure in a way that semiconductor and isolator layers are
separated on a nanometer scale seems to be a very attractive feature for the development of smart optical
materials.
The fourth part of this review has shown that it is possible to produce columnar discotic complexes of
carboxylic acid functionalized hexa-peri-hexabenzocoronenes. The hexa-peri-hexabenzocoronene
complexes of a hydrophobically modified polyethyleneimine and an amino functionalized polysiloxane
are thermotropic liquid crystals. In comparison to the non-complexed hexa-peri-hexabenzocoronene, it
has been seen that the height of the columns are greatly increased and also that the mechanical properties
can be improved by the complexation. These columnar complexes could be used as organic nanowires.
Acknowledgments
It is my great pleasure to thank the director of the Max Planck Institute of Colloids and Interfaces,
Markus Antonietti. His sound advice and our frequent discussions are of outstanding importance for this
work.
My research would not have been possible without the generous financial support of the Max Planck
Society, the ‘Deutsche Forschungsgemeinschaft’ (Grants TH633/2-1, Lo418/7-1 and JA555/6-1) and the
Fraunhofer Society. I am deeply indebted to these organizations.
I am also most grateful to all former and present members of the polyelectrolyte–surfactant
complexes research group at the Max Planck Institute of Colloids and Interfaces. I am pleased to
acknowledge the contributions of Antje Wenzel, Susanne Henke, Carmen Remde, Jochen Beyermann,
Dirk Ruppelt and Sascha General. I would also like to extend my thanks to Peter Cowap for carefully
reading, correcting and helping to formulate the English language of the text before publication.
References
[1] Tomalia DA, Wang ZG, Tirrell M. Experimental self-assembly: the many facets of self-assembly. Curr Opin Colloid
Interf Sci 1999;4(1):3–5.
[2] Tredgold RH. Order in thin organic films. Cambridge: Cambridge University Press; 1994.
[3] Ruland W. Private communication.
A.F. Thunemann / Prog. Polym. Sci. 27 (2002) 1473–15721566

[4] Micha MA, Burger C, Antonietti M. Generalized phase diagram for microphase separated systems and its determination
by small-angle scattering. Macromolecules 1998;31(17):5930–3.
[5] Stribeck N, Ruland W. Determination of the interface distribution function of lamellar two-phase systems. J Appl Cryst
1978;11:535–9.
[6] Siemann U, Ruland W. Determination of the width of the domain boundaries in polymer two-phase systems by X-ray
small-angle scattering. Colloid Polym Sci 1982;260:999–1010.
[7] Wolff T, Burger C, Ruland W. Small-angle X-ray scattering study of lamellar microdomains in diblock copolymers in
the weak segregation regime. Macromolecules 1994;27:3301–9.
[8] Ruland W. The evaluation of the small-angle scattering of lamellar two-phase systems by means of interface distribution
functions. Colloid Polym Sci 1977;255:417–27.
[9] Ober CK, Wegner G. Polyelectrolyte–surfactant complexes in the solid state—facile building blocks for self-organizing
materials. Adv Mater 1997;9(1):17–31.
[10] Antonietti M, Burger C, Thunemann A. Polyelectrolyte–surfactant complexes: a new class of highly ordered polymer
materials. TRIP 1997;5:262–7.
[11] Antonietti M, Thunemann A. Polyelectrolyte–lipid complexes as membrane mimetic systems. Curr Opin Colloid Interf
Sci 1996;1:667–71.
[12] Antonietti M, Henke S, Thunemann A. Highly ordered materials with ultra-low surface energies: complexes with
fluorinated surfactants. Adv Mater 1996;8:41–5.
[13] Goddard ED. Polymer–surfactant interaction. Part II. Polymer and surfactant of opposite charge. Colloids Surf 1986;19:
301–29.
[14] Hayakawa K, Kwak JCT. Surfactant–polyelectrolyte interactions. 1. Binding of dodecyltrimethylammonium ions by
sodium dextran sulfate and sodium poly(styrenesulfonate) in aqueous solution in the presence of sodium chloride. J Phys
Chem 1982;86(16):3866–70.
[15] Hayakawa K, Kwak JCT. Study of surfactant–polyelectrolyte interactions. 2. Effect of multivalent counterions on the
binding of dodecyltrimethylammonium ions by sodium dextran sulfate and sodium poly(styrenesulfonate) in aqueous
solution. J Phys Chem 1983;87(3):506–9.
[16] Semenov AN, Nyrkova IA, Khokhlov AR. Polymers with strongly interacting groups—theory for nonspherical
multiplets. Macromolecules 1995;28(22):7491–500.
[17] Thunemann AF. Nano-structured materials with low surface energies formed by polyelectrolytes and fluorinated
amphiphiles (PEFA). Polym Int 2000;49:636–44.
[18] Lochhaas KH, Thunemann AF, Antonietti M. Polyelectrolyte–surfactant complexes with fluorinated surfactants: a new
type of material for coatings. JOCCA—Surf Coatings Int 1999;82(9):451–5.
[19] Li D, Neumann AW. Contact angles on hydrophobic solid surfaces and their interpretation. J Colloid Interf Sci 1992;
148(1):190–200.
[20] Kwok DY, Neumann AW. Contact angle measurement and contact angle interpretation. Adv Colloid Interf Sci 1999;
81(3):167–249.
[21] Thunemann AF, Lochhaas KH. Self-assembly of perfluorodecanoic acid with cationic copolymers—ultra-low energy
surfaces and mesomorphous structures. Langmuir 1998;14(17):4898–903.
[22] Thunemann AF, Lieske A, Paulke BR. Low surface energy coatings from waterborne nano-dispersions of polymer
complexes. Adv Mater 1999;11(4):321–4.
[23] Information supplied by the manufacturer, BASF. Specialty chemicals. Ludwigshafen, Germany.
[24] Information supplied by the manufacturer, Hoechst AG, Frankfurt, Germany.
[25] Thunemann AF, Beyermann J, Ferber C, Lowen H. Immobilization of retinoic acid by polyamino acids: lamellar-
structured nanoparticles. Langmuir 2000;16(2):850–7.
[26] Hare EF, Shafring EG, Zisman WA. Properties of films of adsorbed fluorinated acids. J Colloid Sci 1954;58:236–9.
[27] Girifalco LA, Good RJ. A theory for the estimation of surface and interfacial energies. I. Derivation and application to
interfacial tension. J Phys Chem 1957;61:904–10.
[28] Fowkes FM. J Phys Chem 1962;66:382.
[29] Fowkes FM. Contact angle, wettability and adhesion. Adv Chem Ser, Am Chem Soc 1964;43:108.
[30] Wang J, Ober CK. Self-organizing materials with low surface energy—the synthesis and solid-state properties of
semifluorinated side-chain ionenes. Macromolecules 1997;30(24):7560–7.
A.F. Thunemann / Prog. Polym. Sci. 27 (2002) 1473–1572 1567

[31] Yasuda H, Okuno T, Sawa Y, Yasuda T. Surface configuration change observed for Teflon–PFA on immersion in water.
Langmuir 1995;11(8):3255–60.
[32] Thunemann AF, Lochhaas KH. Surface and solid-state properties of a fluorinated polyelectrolyte–surfactant complex.
Langmuir 1999;15(4):4867–74.
[33] Neinhuis C, Barthlott W. Characterization and distribution of water-repellent, self-cleaning plant surfaces. Ann Bot
1997;79(6):667–77.
[34] Barthlott W, Neinhuis C. Purity of the sacred lotus, or escape from contamination in biological surfaces. Planta 1997;
202(1):1–8.
[35] Onda T, Shibuichi S, Satoh N, Tsujii K. Super-water-repellent fractal surfaces. Langmuir 1996;12(9):2125–7.
[36] Thunemann AF, Lochhaas KH. Colloidal complexes of perfluorooctadecanoic acid with cationic copolymers. Langmuir
1999;15(2):6724–7.
[37] Thunemann AF, Schnablegger H. Monodisperse disk-shaped micelles of perfluorooctadecanoic acid. Langmuir 1999;
15(16):5426–8.
[38] Wagner R, Richter L, Wu Y, Weißmuller J, Kleewein A, Hengge E. Silicon-modified carbohydrate surfactants. VII.
Impact of different silicon substructures on the wetting behaviour of carbohydrate surfactants on low-energy surfaces—
distance decay of donor–acceptor forces. Appl Organomet Chem 1998;12(4):265–76.
[39] Hoffmann H. From micellar solutions to liquid crystalline phases. Ber Bunsenges Phys Chem 1984;88:1078–92.
[40] Holmes MC, Reynolds DJ, Boden N. Concentration–temperature dependence of the size and shape of the micelles in the
cesium pentadecafluoroacetadecanoate/water system. J Phys Chem 1987;91:5257–62.
[41] Dombroski JP, Edwards PJB, Jolley KW, Boden N. Phase diagram of the tetramethylammonium heptadecafluorononoate
(TMAHFN)D2O system as determined by H-2 and N-14 NMR. Liquid Cryst 1995;18(1):51–60.
[42] Herbst L, Hoffman H, Kalus J, Reizlein K, Schmelzer U, Ibel K. Small angle neutron scattering on nematic lyotropic
liquid crystals. Ber Bunsenges Phys Chem 1985;89:1050–64.
[43] Thunemann AF, Kubowicz S, Pietsch U. Ultrathin solid polyelectrolyte–surfactant complex films: structure and wetting.
Langmuir 2000;16(23):8562–7.
[44] Overberger CG, Menges G, Kroschwitz JI, 2nd ed. Encyclopedia of polymer science and engineering, vol. 1. New York:
Wiley; 1985. p. 689.
[45] Augsburg A, Grundke K, Poschel K, Jacobasch HJ, Neumann AW. Determination of contact angles and solid surface
tensions of poly(4-x-styrene) films. Acta Polym 1998;49(8):417–26.
[46] Dessipri E, Tirrell DA, Atkins EDT. Fluorinated poly(alpha, L-glutamate)s. Macromolecules 1996;29(1):3545–
751.
[47] Seperati CA. Physical constants of fluorpolymers, 3rd ed. New York: Wiley; 1996.
[48] Thunemann AF, Ruppelt D, Blaul J. Rigid-rod complex of a cationic poly( p-phenylene) and a fluorinated amphiphile.
Macromolecules 2000;33(6):2124–8.
[49] Chen HL, Hsiao MS. Self-assembled mesomorphic complexes of branched poly(ethyleneimine) and dodecylbenzene-
sulfonic acid. Macromolecules 1999;32(9):2967–73.
[50] Hwang MJ, Kim K. Poly(ethyleneimine) as a subphase stabilizer of stearic acid monolayers at the air water interface:
surface pressure–area isotherm and infrared spectroscopy study. Langmuir 1999;15(10):3563–9.
[51] Holy V, Pietsch U, Baumbach T. Springer tracts in modern physics. High-resolution X-ray scattering from thin films and
multilayers, vol. 149. Berlin: Springer; 1999.
[52] Parrat L. Surface studies of solid surfaces by reflections of X-rays. Phys Rev 1954;95:359.
[53] Thunemann AF. Complexes of polyethyleneimine with perfluorinated carboxylic acids: wettability of lamellar structured
mesophases. Langmuir 2000;16(2):824–8.
[54] Schulman F, Zisman WA. The spreading of liquids on low-energy surfaces. V. Perfluorodecanoic monolayers. J Colloid
Sci 1952;7:465–81.
[55] Hopken J, Moller M. Low surface energy polystyrene. Macromolecules 1992;25(5):1461–7.
[56] Sheiko S, Lermann E, Moller M. Self-dewetting of perfluoroalkyl methacrylate films on glass. Langmuir 1996;12(16):
4015–24.
[57] Fox HW, Zisman WA. The spreading of liquids on low energy surfaces. I. Polytetrafluorethylene. J Colloid Sci 1950;5:
514–31.
[58] Bunn CW, Howells ER. Structures of molecules and crystals of fluorocarbons. Nature 1954;174:549–51.
A.F. Thunemann / Prog. Polym. Sci. 27 (2002) 1473–15721568

[59] Antonietti A, Kublickas R, Nuyken O, Voit B. Polyelectrolyte–surfactant complexes containing photolabile
diazosulfonate chromophores. Macromol Rapid Commun 1997;18(4):287–94.
[60] Thunemann AF, Schnoller U, Nuyken O, Voit B. Self-assembled complexes of diazosulfonate polymers with low surface
energies. Macromolecules 1999;32(22):7414–21.
[61] Stasko A, Erentova K, Rapta P, Nuyken O, Voit B. Investigation of the decomposition of compounds containing azo
groups by EPR spectroscopy. Magn Reson Chem 1998;36(1):13–34.
[62] Grazulevicius JV, Soutar I, Swanson L. Photophysics of carbazole-containing systems. 3. Fluorescence of carbazole-
containing oligoethers in dilute solution. Macromolecules 1998;31(15):4820–7.
[63] Thunemann AF, Schnoller U, Nuyken O, Voit B. Diazosulfonate polymer complexes: structure and wettability.
Macromolecules 2000;33(15):5665–71.
[64] Klug HP, Alexander LE. X-ray diffraction procedures for polycrystalline and amorphous materials. New York: Wiley;
1974. p. 487.
[65] Pan FM, Lin YL, Horng SR. Decomposition of perfluorpolyethers during XPS measurements. Appl Surf Sci 1991;47:
9–16.
[66] Thunemann AF, Lochhaas KH. Self-assembly of solid polyelectrolyte–silicon–surfactant complexes. Langmuir 1998;
14(21):6220–5.
[67] Owen MJ. The surface activity of silicones: a short review. Ind Engng Chem Prod Res Dev 1980;19:97–103.
[68] Fink HF. Silicone surfactants. Part IV. Silicone surfactants as paint additives. Tenside Surfactants Deterg 1991;28:
306–12.
[69] Dams R. Fluortenside fur farben und coatings. Tenside Surfactants Deterg 1993;30:326–7.
[70] Schmidt G. Silicone surfactants. Silicone surfactants. Part III. Organomodified polydimethylsiloxanes as surface active
ingredients in textile and fibre industry. Tenside Surfactants Deterg 1990;27(5):324–8.
[71] Gradzielski M, Hoffmann H, Robisch P, Ulbricht W, Gruning B. The aggregation behaviour of silicone surfactants in
aqueous solutions. Tenside Surfactants Deterg 1990;27(6):366–79.
[72] Antonietti M, Kaul A, Thunemann A. Complexation of lecithin with cationic polyelectrolytes—plastic membranes as
models for the structure of the cell membrane. Langmuir 1995;11(7):2633–8.
[73] Thunemann A. Immobilization of retinoic acid by cationic polyelectrolytes. Langmuir 1997;13(23):6040–6.
[74] Klein KD, Schaefer D, Lersch P. Anionische silicontenside. Tenside Surfactants Deterg 1994;31:115–9.
[75] Falbe J, Regitz M. Rompp lexikon chemie. Stuttgart: Thieme; 1995.
[76] Antonietti M, Wenzel A, Thunemann AF. The egg-carton phase—a new morphology of complexes of polyelectrolytes
with natural lipid mixtures. Langmuir 1996;12(8):2111–4.
[77] Thunemann AF, Kublickas RH. Low surface energy polysiloxane complexes. J Mater Chem 2001;11(2):381–4.
[78] Roitman JN, Pittman AG, Ward WH. Fabric oil repellency as related to the critical surface tension and stiffness of
coating material. Textile Res J 1974;44:500–11.
[79] Patents: EP 0,472,215,A2; EP 0,380,972,A2; EP 0,567,969,A1; EP 0,757,081,A2; EP 0,745,604,A2; US 5,321,083; EP
0,744,443,A2; EP 0,690,088,A2; DE 40,22,443,A1.
[80] Swain GW, Nelson WG, Preedeekanit S. The influence of biofouling adhesion and biotic disturbance on the development
of fouling communities on non-toxic surfaces. Biofouling 1998;12(1):257–69.
[81] Watermann B, Berger HD, Sonnichsen H, Willemsen P. Performance and effectiveness of non-stick coatings in seawater.
Biofouling 1997;11(2):101–18.
[82] Richtlinie 98/8/EG des Europaischen Parlaments und des Rates vom 16. Februar 1998 uber das Inverkehrbringen von
Biozidprodukten.
[83] Lindner E. A low surface free energy approach in the control of marine biofouling. Biofouling 1992;6(2):
193–204.
[84] Fox HW, Zisman WA. The spreading of liquids on low energy surfaces. II. Modified polytetrafluoroethylene polymers.
J Colloid Sci 1950;7:109.
[85] Wacker-Chemie GmbH, Burghausen, Germany.
[86] Thomas RR, Anton DR, Graham WF, Darmon MJ, Sauer BB, Stika KM, Swartzfager DB. Preparation and surface
properties of acrylic polymers containing fluorinated monomers. Macromolecules 1997;30(10):2883–90.
[87] Thunemann AF, Ruppelt D, Schnablegger H, Blaul J. Rigid-rod complex of a cationic poly( p-phenylene) and a
fluorinated amphiphile. Macromolecules 2000;33(6):2124–8.
A.F. Thunemann / Prog. Polym. Sci. 27 (2002) 1473–1572 1569

[88] Neher D. Substituted rigid rod-like polymers—building blocks for photonic devices. Adv Mater 1995;7(8):691–702.
[89] Graupner W, Grem G, Meghdadi F, Paar CH, Leising G, Scherf U, Mullen K, Fischer W, Stelzer F. Electroluminescence
with conjugated polymers and oligomers. Mol Cryst Liq Cryst 1994;256:549–54.
[90] Leising G, Tasch S, Graupner W. Handbook of conducting polymers, 2nd ed. New York: Marcel Decker; 1997. p. 847.
[91] Cimrova V, Schmidt W, Rulkens R, Schulze M, Meyer W, Neher D. Adv Mater 1996;8(7):585–8.
[92] Piaggi A, Lanzani G, Bongiovanni G, Mura A, Graupner W, Meghdadi F, Leising G. Emission properties of para-
hexaphenyl polycrystalline films. Phys Rev B 1997;56(16):10133–7.
[93] Graupner W, Meghdadi F, Leising G, Lanzani G, Nisoli M, De Silvestri S, Fischer W, Stelzer F. Photoexcitation in para-
hexaphenyl. Phys Rev B 1997;56(16):10128–32. and references therein.
[94] Guha S, Graupner W, Resel R, Chandrasekhar M, Chandrasekhar HR, Glaser R, Leising G. Planarity of para-
hexaphenyl. Phys Rev Lett 1999;82(18):3625–8.
[95] Liu TB, Rulkens R, Wegner G, Chu B. Laser light scattering study of a rigid-rod polyelectrolyte. Macromolecules 1998;
31(18):6119–28.
[96] Petekidis G, Vlassopoulos D, Fytas G, Rulkens R, Wegner G. Diffusion dynamics of hairy-rod polymers in concentrated
solutions. Macromolecules 1998;31(18):6129–38.
[97] Petekidis G, Vlassopoulos D, Fytas G, Rulkens R, Wegner G, Fleischer G. Orientation dynamics and correlations in
hairy-rod polymers—concentrated regime. Macromolecules 1998;31(18):6139–47.
[98] Brunner S, Caseri WR, Suter UW, Hahner G, Brovelli D, Spencer ND, Vinckier A, Rau IU, Galda P, Rehan M.
Preparation and characterization of ultrathin layers of substituted oligo- and poly( p-phenylene)s and mixed layers with
octadecanethiol on gold and copper. Langmuir 1999;15(19):6333–42.
[99] Rulkens R, Wegner G, Thurn-Albrecht T. Cylindrical micelles of wormlike polyelectrolytes. Langmuir 1999;15(12):
4022–5.
[100] Antonietti M, Conrad J, Thunemann A. Polyelectrolyte–surfactant complexes: a new type of solid, mesomorphous
material. Macromolecules 1994;27:6007–11.
[101] Thunemann AF, Ruppelt D. Layered nanoarchitecture of a fluorescent polyelectrolyte complex. Langmuir 2000;16(7):
3221–6.
[102] Kraft A, Grimsdale AC, Holmes AB. Electroluminescent conjugated polymers—seeing polymers in a new light. Angew
Chem Int Ed 1998;37(4):402–28.
[103] Hide F, Diaz-Garcia MA, Schwartz BJ, Heeger AJ. New developments in the photonic application of conjugated
polymers. Acc Chem Res 1997;30(10):430–6.
[104] Pei QB, Yu G, Zhang C, Yang Y, Heeger AJ. Semiconducting polymers—a new class of solid-state laser materials.
Science 1995;269:1086–8.
[105] Halkyard CE, Rampey ME, Kloppenburg L, Studer-Martinez SL, Bunz UHF. Evidence of aggregate formation for 2,5-
dialkylpoly( p-phenyleneethynylenes) in solution and thin films. Macromolecules 1998;31(25):8655–9.
[106] Hager H, Heitz W. Synthesis of poly(phenyleneethynylene) without diine defects. Macromol Chem Phys 1998;199(9):
1821–6.
[107] Schnablegger H, Antonietti M, Goltner C, Hartmann J, Colfen H, Samori P, Rabe JP, Hager H, Heitz WJ. Morphological
characterization of the molecular superstructure of polyphenylene ethynylene derivatives. Colloid Interf Sci 1999;
212(1):24–32.
[108] Hosemann R, Bagchi SN. Direct analysis of diffraction by matter. Amsterdam: North-Holland; 1962.
[109] Klug HP, Alexander LE. X-ray diffraction procedures for polycrystalline and amorphous materials, 2nd ed. New York:
Wiley-Interscience; 1974.
[110] Ruland W. Fourier transform methods for random-layer line profiles. Acta Crystallogr 1967;22:615–23.
[111] Ruland W, Tompa H. The effect of preferred orientation on the intensity distribution of (hk ) interferences. Acta
Crystallogr 1968;24:93–9.
[112] Von Berlepsch H, Burger C, Dautzenberg H. Polyelectrolyte-mediated undulation of surfactant bilayers. Phys Rev E
1998;58(6):7549–52.
[113] Goetz R, Helfrich WJ. The Egg-carton theory of a periodic superstructure of some lipid membranes. Phys II Fr 1996;
6(2):215–23.
[114] Muller M, Schick M. Structure and nucleation of pores in polymeric bilayers—a Monte Carlo simulation. J Chem Phys
1996;105(18):8282–92.
A.F. Thunemann / Prog. Polym. Sci. 27 (2002) 1473–15721570

[115] Goetz R, Gompper G, Lipowsky R. Mobility and elasticity of self-assembled membranes. Phys Rev Lett 1999;82(1):
221–4.
[116] Reiter G, Sharma A, Casoli A, David MO, Khanna R, Auroy P. Thin film instability induced by long-range forces.
Langmuir 1999;15(7):2551–8.
[117] Vandenbrouck F, Valignat MP, Cazabat AM. Thin nematic films: metastability and spinodal dewetting. Phys Rev Lett
1999;82(13):2693–6.
[118] Kloppenburg L, Jones D, Claridge JB, Loye HC, Bunz UHF. Poly( p-phenyleneethynylene)s are thermotropic liquid
crystalline. Macromolecules 1999;32(13):4460–3.
[119] Thunemann AF. Nanostructured dihexadecyldimethylammonium–poly(1,4-phenylene–ethinylene–carboxylate): an
ionic complex with blue electroluminescence. Adv Mater 1999;11(2):127–30.
[120] Bradly D. Electroluminescent polymers: materials, physics and device engineering. Curr Opin Solid State Mater Sci
1996;1:789–97.
[121] Segura JL. The chemistry of electroluminescent organic materials. Acta Polym 1998;49(7):319–44.
[122] Grell M, Bradley DDC. Polarized luminescence from oriented molecular materials. Adv Mater 1999;11(11):
895–905.
[123] Kalinowski D. Electroluminescence in organics. J Phys D—Appl Phys 1999;32(24):179–249.
[124] Zhang XJ, Jenekhe SA. Electroluminescence of multicomponent conjugated polymers. 1. Roles of polymer/polymer
interfaces in emission enhancement and voltage-tunable multicolor emission in semiconducting polymer/polymer
heterojunctions. Macromolecules 2000;33(6):2069–82.
[125] Heeger AJ, Diaz-Garcia MA. Semiconducting polymers as materials for photonic devices. Curr Opin Solid State Mater
Sci 1998;3(1):16–22.
[126] Ho PKH, Kim JS, Burroughes JH, Becker H, Li SFY, Brown TM, Cacialli F, Friend RH. Molecular-scale interface
engineering for polymer light-emitting diodes. Nature 2000;404(6777):481–4.
[127] Watanabe J, Ono H, Uematsu I, Abe A. Thermotropic polypeptides. 2. Molecular packing and thermotropic behavior of
poly(L-glutamates) with long n-alkyl side chains. Macromolecules 1985;18:2141–8.
[128] Thunemann AF, Beyermann J, Ferber C, Lowen H. Immobilization of retinoic acid by polyamino acids: lamellar-
structured nanoparticles. Langmuir 2000;16(2):850–7.
[129] Rulkens R, Wegner G, Thurn-Albrecht T. Cylindrical micelles of wormlike polyelectrolytes. Langmuir 1999;15(12):
4022–5.
[130] Baur JW, Kim S, Balada PB, Reynolds JR, Rubner MF. Thin-film light-emitting devices based on sequentially adsorbed
multilayers of water-soluble poly( p-phenylene)s. Adv Mater 1998;10(17):1452–5.
[131] Hager H. PD Thesis (ISBN 3-932149-52-1). Marburg, Germany; 1996. p. 38.
[132] Moore JS. Molecular architecture and supramolecular chemistry. Curr Opin Solid State Mater Sci 1996;1(6):777–88.
[133] Brown SP, Schnell I, Brand JD, Mullen K, Spiess HW. An investigation of pi–pi packing in a columnar
hexabenzocoronene by fast magic-angle spinning and double-quantum H-1 solid-state NMR spectroscopy. J Am Chem
Soc 1999;121(28):6712–8.
[134] Boden N, Bushby RJ, Clements J, Luo R. Characterization of the cationic species formed in p-doped discotic liquid
crystals. J Mater Chem 1995;5(10):1741–8.
[135] Arikainen EO, Boden N, Bushby RJ, Clements J, Movaghar B, Wood A. Effects of side-chain length on the charge
transport properties of discotic liquid crystals and their implications for the transport mechanism. J Mater Chem 1995;
5(12):2161–5.
[136] Iyer VS, Wehmeier M, Brand JD, Keegstra MA, Mullen K. From hexa-peri-hexabenzocoronene to superacenes. Angew
Chem Int Ed 1997;36(15):1604–7.
[137] Stabel A, Herwig P, Mullen K, Rabe JP. Diodelike current–voltage curves for a single molecule—tunneling
spectroscopy with submolecular resolution on an alkylated, peri-condensed hexabenzocoronene. Angew Chem Int Ed
1995;34(15):1609–11.
[138] van de Craats AM, Warman JM, Mullen K, Geerts Y, Brand JD. Rapid charge transport along self-assembling graphitic
nanowires. Adv Mater 1998;10(1):36.
[139] Thunemann AF, Ruppelt D, Ito S, Mullen K. Supramolecular architecture of a functionalized hexabenzocoronene and its
complex with polyethyleneimine. J Mater Chem 1999;9(5):1055–7.
[140] Brandrup J, Immergut EH, 3rd ed. Polymer handbook, vol. V/16. New York: Wiley; 1989.
A.F. Thunemann / Prog. Polym. Sci. 27 (2002) 1473–1572 1571

[141] Ponomarenko EA, Waddon AJ, Tirell DA, MacKnight WJ. Structure and properties of stoichiometric complexes formed
by sodium poly(alpha, L-glutamate) and oppositely charged surfactants. Langmuir 1996;12(9):2169–72.
[142] Herwig P, Kayser CW, Mullen K, Spiess HW. Columnar mesophases of alkylated hexa-peri-hexabenzocoronenes with
remarkably large phase widths. Adv Mater 1996;8(6):510–2.
[143] Antonietti M, Neese M, Blum G, Kremer F. Dielectric and mechanic relaxation in polyelectrolyte-supported bilayer
stacks—a model for the dynamics of membranes. Langmuir 1996;12(18):4436–41.
[144] Thunemann AF, Ruppelt D, Burger C, Mullen K. Long-range ordered columns of a hexabenzo[bc,ef,hi,kl,no,
qr ]coronene–polysiloxane complex: towards molecular nanowires. J Mater Chem 2000;10(6):1325–9.
[145] Ikkala O, Ruokolainen J, Torkkeli M, Tanner J, Serimaa R, ten Brinke G. Ordering in self-organizing comb copolymer-
like systems obtained by hydrogen bonding between charged or noncharged polymers and amphiphiles. Colloids Surf
A—Physicochem Engng Aspects 1999;147(1–2):241–8.
[146] Fechtenkotter A, Saalwachter K, Harbison MA, Mullen K, Spiess HW. Highly ordered columnar structures from hexa-
peri-hexabenzocoronenes—synthesis, X-ray diffraction, and solid-state heteronuclear multiple-quantum NMR
investigations. Angew Chem Int Ed Engl 1999;38(20):3039–42.
[147] Krappe U, Stadler R, Voigtmartin I. Chiral assembly in amorphous ABC triblock copolymers—formation of a helical
morphology in polystyrene-block-polybutadiene-block-poly(methylmethacrylate) block copolymers. Macromolecules
1995;28:4558–61.
[148] Ruland W. Carbon fibers. Adv Mater 1990;2(10):528–36.
[149] Fontes E, Heiney PA, Ohba M, Haseltine JN, Smith AB. Molecular disorder in columnar-phase discotic liquid-crystal
strands. Phys Rev Ser A 1988;37:1329–34.
[150] German Patent Application DE 10061573,2.
[151] Thunemann AF, Ruppelt D. Electroluminescent polyelectrolyte surfactant complexes. Langmuir 2001;17(16):5098–
102.
[152] Zhou SQ, Chu B. Assembled materials: Polyelectrolyte-surfactant complexes. Advanced Materials 2002;12(8):545–56.
A.F. Thunemann / Prog. Polym. Sci. 27 (2002) 1473–15721572