polyolefins - fpa8).pdf · polyolefins “here and around ... prod. int. light naphtha west europe...
TRANSCRIPT

FPA 10-07FPA 10-07SingaporeSingapore ShanghaiShanghai HoustonHouston New YorkNew York LondonLondon DüsseldorfDüsseldorf DubaiDubai
Polyolefins “Here and Around the World”
Polyolefins Polyolefins ““Here and Around the WorldHere and Around the World””
Nick VafiadisNick VafiadisBusiness Director Business Director ––
[email protected]@cmaiglobal.com
Flexible Packaging Flexible Packaging AssociationAssociation
October 3, 2007October 3, 2007

FPA 10-07FPA 10-07
WHAT HAPPENS OVER THERE…
MATTERS HERE!
WHAT HAPPENS OVER THERE…
MATTERS HERE!

FPA 10-07FPA 10-07
AgendaAgendaAgenda
•Energy •Ethylene•Polyethylene•Propylene•Polypropylene
•Energy •Ethylene•Polyethylene•Propylene•Polypropylene

FPA 10-07FPA 10-07
World GDP Growth Rates(Constant 2004 U.S. Dollars)
0.0
0.5
1.0
1.5
2.0
2.5
3.0
3.5
4.0
4.5
5.0
88 90 92 94 96 98 00 02 04 06 08 10 12
Percent (%)
Most Likely ScenarioAlternate Scenario
Forecast

FPA 10-07FPA 10-07
U.S. GDP Growth - Annualized RatesOffsetting Factors (70%)
U.S. GDP Growth - Annualized RatesOffsetting Factors (70%)
%% QtrQtr--11 QtrQtr--22 QtrQtr--33 QtrQtr--44 Year Year (1)(1)
20022002 2.72.7 2.22.2 2.42.4 0.20.2 1.61.620032003 1.21.2 3.53.5 7.57.5 2.72.7 2.52.520042004 3.93.9 4.04.0 3.13.1 2.62.6 3.93.920052005 3.43.4 3.33.3 4.24.2 1.81.8 3.23.2
(1) Change in average GDP for the year(1) Change in average GDP for the year
20062006 4.84.8 2.42.4 1.11.1 2.12.1 2.92.9
Updated: September 2007Updated: September 2007
20072007 0.60.6 3.83.8 1.91.9 2.02.0 1.91.920082008 2.32.3 2.62.6 2.92.9 3.13.1 2.52.5

FPA 10-07FPA 10-07
WTI Crude Oil PricesWTI Crude Oil Prices
Source: Purvin & Gertz
U.S. Dollars Per BarrelsU.S. Dollars Per Barrels
0
10
20
30
40
50
60
70
80
2001 2002 2003 2004 2005 2006 2007 2008 2009 2010 2011
66.0066.00ForecastForecast
57.3057.30

FPA 10-07FPA 10-07
U.S. Burner Tip Natural Gas PricesU.S. Burner Tip Natural Gas Prices
Source: Purvin & Gertz
Dollars Per MMbtuDollars Per MMbtu
0
1
2
3
4
5
6
7
8
9
2001 2002 2003 2004 2005 2006 2007 2008 2009 2010 2011
7.007.007.607.60
ForecastForecast

FPA 10-07FPA 10-07
North America Energy Price Trends(Constant 2007 Dollars)
00
22
44
66
88
1010
1212
9090 9191 9292 9393 9494 9595 9696 9797 9898 9999 0000 0101 0202 0303 0404 0505 0606 0707 0808 0909 1010 1111
Dollars Per Million BtuDollars Per Million Btu
00
22
44
66
88
1010
1212
1414Crude/Gas RatioCrude/Gas Ratio
ForecastForecast
Crude (WTI)Crude (WTI) Crude / Gas RatioCrude / Gas RatioNatural GasNatural Gas
Arbitrage OpportunitiesArbitrage Opportunities……

FPA 10-07FPA 10-07
Ethane Delta Over Fuel Value(U.S. Gulf Coast)
Ethane Fuel Value Purity Ethane Ethane Price Delta Above Fuel
-20
0
20
40
60
80
100
120
1998 1999 2000 2001 2002 2003 2004 2005 2006 2007 2008
Cents Per Gallon
-20
0
20
40
60
80
100
120Cents Per Gallon
Fuel Value ofPurity Ethane
Purity Ethane,Cents Per Gallon,
Mont Belvieu, Texas
Delta Between Ethane Price and Fuel Value, Cents Per Gallon
Forecast
FPA 10-07FPA 10-07
EthyleneEthylene

FPA 10-07FPA 10-07
2006 Production = 110.2 Million Metric Tons2006 Production = 110.2 Million Metric Tons
World Ethylene Supply/Demand Profile
World Ethylene Supply/Demand Profile
Production by Feedstock Demand by End-Use
EDC12%
Ethylene Oxide
14%
PE59%
Others8% EBZ
7%
Others2%
Butane4%
Gas Oil5%
Propane7%Ethane
28%
Naphtha54%

FPA 10-07FPA 10-07
Global Ethylene Cash CostsGlobal Ethylene Cash CostsAnnual Comparison BasisAnnual Comparison BasisUnit-by-Unit Cost CurveUnit-by-Unit Cost Curve
50
250
450
650
850
1050
1250
0 20 40 60 80 100 120 140
Dollars Per Metric Ton
Average U.S. Feedstock Basis
Cumulative Ethylene Capacity (Million Tons)Total Cash Cost Middle EastNorth America
Northeast Asia
Southeast AsiaWest Europe
20052006
(NAM – MDE) = $525 / MT
FPA 10-07FPA 10-07
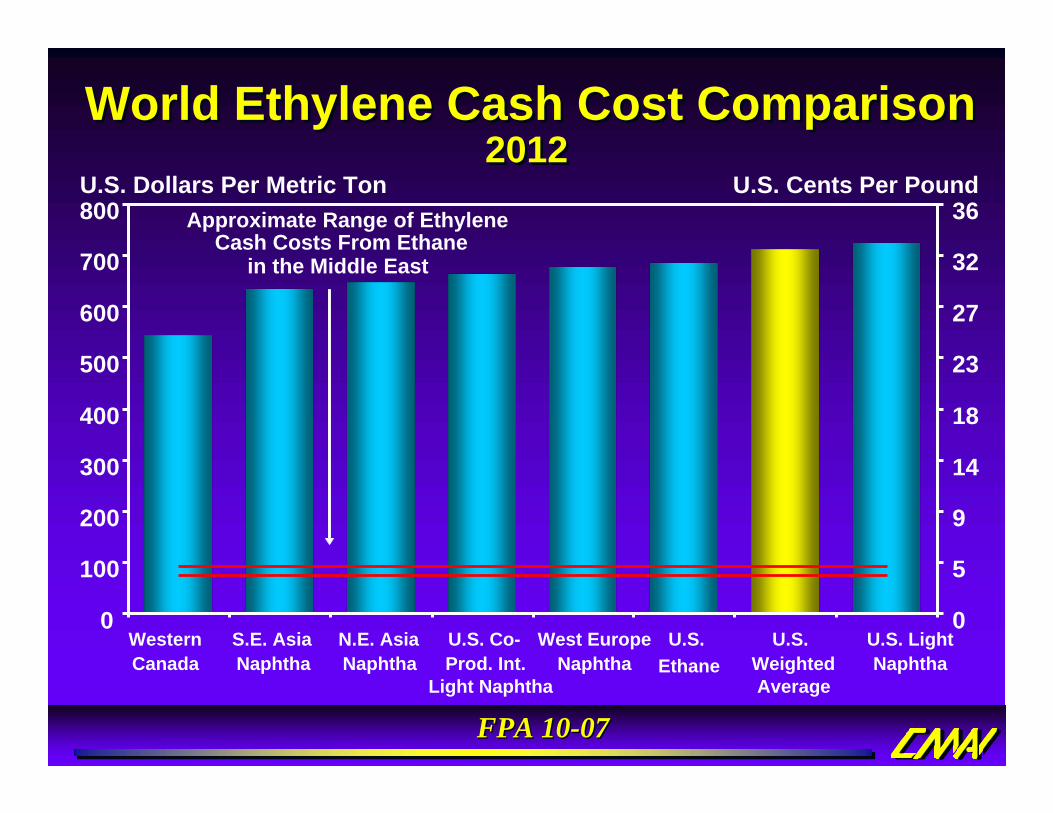
WesternCanada
S.E. AsiaNaphtha
N.E. AsiaNaphtha
U.S. Co-Prod. Int.
Light Naphtha
West EuropeNaphtha
U.S. Ethane
U.S.WeightedAverage
U.S. LightNaphtha
0
100
200
300
400
500
600
700
800
0
5
9
14
18
23
27
32
36U.S. Dollars Per Metric Ton U.S. Cents Per Pound
Approximate Range of EthyleneCash Costs From Ethane
in the Middle East
World Ethylene Cash Cost ComparisonWorld Ethylene Cash Cost Comparison2012 2012

FPA 10-07FPA 10-07
Global Ethylene Capacity GrowthGlobal Ethylene Capacity GrowthGlobal Ethylene Capacity Growth( -000- Tons )( -000- Tons )
America'sAmerica's 40,39340,393 40,76140,761 368368EuropeEurope 30,97030,970 31,85431,854 884884
Major RegionMajor Region2007 2007
CapacityCapacity2012 2012
Capacity Capacity '07 to '12 '07 to '12
Delta Delta
Middle East / Africa Middle East / Africa 16,83316,833 35,97835,978 19,14519,145Asia PacificAsia Pacific 37,94037,940 52,09752,097 14,15714,157
World TotalWorld Total 126,136126,136 160,690160,690 34,55434,554

FPA 10-07FPA 10-07
Ethylene Equivalent Trade Surplus From Middle East
Ethylene Equivalent Trade Surplus From Middle East
0
5
10
15
20
25
30
00 01 02 03 04 05 06 07 08 09 10 11 12
Middle East Net Equivalent Exports
Million Metric Tons
Asia/Pacific Net Equivalent Imports

FPA 10-07FPA 10-07
Vinyls Styrenics Polyethylene GlycolOthers Ethylene Net Trade
-1
0
1
2
3
4
5
02 03 04 05 06 07 08 09 10 11 12
Million Metric Tons
Net ExportsNet Exports
Net ImportsNet Imports
North AmericaNorth AmericaEthylene Net Equivalent TradeEthylene Net Equivalent Trade

FPA 10-07FPA 10-07
U.S. Large Buyer Contract Price WEP Contract Price SEA CFR Spot Price
200300400500600700800900
1,0001,1001,2001,300
90 91 92 93 94 95 96 97 98 99 00 01 02 03 04 05 06 07 08 09 10 11 12 13 14 15
Dollars Per Metric Ton
Global Annual Ethylene PricesGlobal Annual Ethylene Prices(Constant 2007 Dollars)(Constant 2007 Dollars)
Forecast

FPA 10-07FPA 10-07
Wtd. Average Cash Margin Average Acquisition PriceAverage Spot Price
05
101520253035404550
92 93 94 95 96 97 98 99 00 01 02 03 04 05 06 07 08 09 10 11 12
Cents Per Pound
01102203304405506607708809901,100
ForecastDollars Per Metric Ton
U.S. Ethylene Market Annual EconomicsU.S. Ethylene Market Annual EconomicsLarge Buyer Contract Cash MarginsLarge Buyer Contract Cash Margins
ReRe--Investment RangeInvestment Range

FPA 10-07FPA 10-07
PolyethylenePolyethylene

FPA 10-07FPA 10-07
-29-152287287-164Inventory change MM LBS . YTD 2007
94.294.694.892.4Avg. Op. Rate- YTD 072.42.43.03.02.92.9--0.50.5Total SalesTotal Sales
30.630.685.685.612.712.7--3.53.5Exports (est.)Exports (est.)--3.13.1--6.06.0--0.10.1--0.30.3Domestic SalesDomestic Sales1.51.51.51.54.14.1--2.72.7Total SupplyTotal Supply
--51.051.0--71.271.2--13.313.3--50.650.6ImportsImports2.52.53.13.14.44.4--2.02.0ProductionProduction
Total PETotal PEHDPEHDPELLDPELLDPELDPELDPEU.S. and Canada, Percent Change YTD August 2007 Vs. 2006U.S. and Canada, Percent Change YTD August 2007 Vs. 2006
PE: Strong YTD...PE: Strong YTD...PE: Strong YTD...

FPA 10-07FPA 10-07
Film & Sheet50%
Injection Molding13%
Pipe & Extrusion7%
Extrusion Coating3%
Raffia1%Fiber
1%Rotomolding1%Wire & Cable
2%
Blow Molding12%
Other10%
Consumption = 68.3 Million Metric TonsConsumption = 68.3 Million Metric Tons*Excluding Exports
WorldWorld2007 Total PE Consumption by End Use2007 Total PE Consumption by End Use

FPA 10-07FPA 10-07
Million Metric Tons% AAGR 2007-12
World Total PE Demand Growth By RegionWorld Total PE Demand Growth By Region
0 5 10 15 20 25 30
20072012
9.9%
5.7%
8.3%
5.6%
6.7%4.5%
7.9%
3.2%5.3%
2.0%
2007 Total Demand = 68.3 Million Metric Tons2007 Total Demand = 68.3 Million Metric Tons
ISCISCSEASEANEANEAMDEMDEAFRAFRCISCIS
CEPCEPWEPWEPSAMSAMNAMNAM
World AAGR % 2007World AAGR % 2007--2012 = 5.1%2012 = 5.1%

FPA 10-07FPA 10-07
Other
Rotomolding
Wire & Cable
Blow Molding
Extrusion Coating
Pipe & Extrusion
Injection Molding
Film & Sheet
0 1 2 3 4 5 6 7
20072012
1.8%
2.8%
3.4%
3.1%
1.5%
2.8%
1.5%
1.4%
Million Metric Tons
2007 Domestic Demand = 14.5 Million Metric Tons2007 Domestic Demand = 14.5 Million Metric Tons
% AAGR 2007-12
U.S./Canada PE Demand by IndustryU.S./Canada PE Demand by Industry

FPA 10-07FPA 10-07
High Energy Prices Hit NAMHigh Energy Prices Hit NAM
0
200
400
600
800
1,000
1,200
1992 1994 1996 1998 2000 2002 2004 2006 2008 2010 2012
Dollars Per Metric Ton
NAM Ethane NAM Light Naphtha
Middle East PE Cash Cost Range

FPA 10-07FPA 10-07
NAM HDPE Total Cash Costs WEP HDPE Total Cash CostSEA HDPE Total Cash Costs
1000
1200
1400
1600
1800
Jan-06
Apr-06
Jul-06
Oct-06
Jan-07
Apr-07
Jul-07
Oct-07
Jan-08
Apr-08
Jul-08
Oct-08
Global Monthly HDPE Blow Molding Cash Costs, Dollars Per Ton
NAM: Low Cash CostNAM: Low Cash Cost

FPA 10-07FPA 10-07
N. America S. AmericaW. Europe C. Europe/CIS & Baltic StatesAfrica/M. East Asia/Pacific
0
1
2
3
4
5
6
7
2007 2008 2009 2010 2011 2012
Million Metric Tons
World PolyethyleneWorld PolyethyleneNet Capacity AdditionsNet Capacity Additions

FPA 10-07FPA 10-07
0123456789
10
2007 2008 2009 2010 2011 20120102030405060708090100
World Middle East ME % of Total
Volume, Million Metric TonsVolume, Million Metric Tons
MDE = 46% of World Expansions 07MDE = 46% of World Expansions 07--1212
World Capacity, PercentWorld Capacity, Percent
Nearly Half of “New” PE Capacity To be Built in the Middle East
Nearly Half of “New” PE Capacity To be Built in the Middle East

FPA 10-07FPA 10-07
NPC-Iran SABIC Qatar PetroleumNat'l Chev/Phil Tasnee Petrochemical
SIPCHEM
Sumitomo Chem. Saudi Aramco Japanese MEGUAE Government Other
Sabic & NPC Leaders In New CapacitySabicSabic & NPC Leaders In New Capacity& NPC Leaders In New Capacity
0.0
0.51.0
1.52.0
2.5
3.03.5
4.0
2007 2008 2009 2010 2011 2012
ME Total PE Capacity Increases by Company, Million Metric TonsME Total PE Capacity Increases by Company, Million Metric Tons

FPA 10-07FPA 10-07
LDPE Expansions in MDE2007-2011
LDPE Expansions in MDELDPE Expansions in MDE20072007--20112011
Q1 2011250Umm Said, QAQAPCOQ4 2009350Al Jubail, SAKayanQ1 2009250Rabigh, SAPetro-Rabigh
Q3 2011500Al Jubail, SASIPCHEM
2007300Bandar Imam, IRAmir Kabir PCTimingCapacity (kt)LocationCompany
2,350 2,350 Total LDPE Net Capacity IncreaseTotal LDPE Net Capacity Increase
Q3 2008400Al Jubail, SATasnee/SaharaQ4 2007300Bandar Assaluyeh, IRArya Sasol PC

FPA 10-07FPA 10-07
LLDPE Expansions in MDE2007-2011
LLDPE Expansions in MDELLDPE Expansions in MDE20072007--20112011
TimingCapacity (kt)LocationCompany
2,1252,125Total LLDPE Net Capacity IncreaseTotal LLDPE Net Capacity Increase
Q2 2009500Mesaieed, QAQatofinQ1 2009350Rabigh, SAPetro-RabighQ4 2008400Al Jubail, SASHARQQ3 2008500Yanbu, SAYansabQ3 2008225Shuaiba, KWTKOCQ3 2007150Bandar Assaluyeh, IRJam PC

FPA 10-07FPA 10-07
Q1 2009300Bandar AssaluyehMehr PC
Q3 2010300Ilam, IRIlam PC
5,5155,515Total HDPE Net Capacity Increase Total HDPE Net Capacity Increase Q3 2011350Al Jubail, SAQ3 2011350Al Jubail, SANat'l Chev/PhilQ3 2011400Al Jubail, SASIPCHEMQ3 2010540Abu Dhabi, Ruwais, AEBorouge
Q4 2009400Al Jubail, SAKayanQ2 2009400Mesaieed, QAQ-Chem II
Q1 2009300Rabigh, SAPetro-RabighQ4 2008400Al Jubail, SASHARQQ3 2008400Yanbu, SAYansabQ3 2008225Shuaiba, KWTKOCQ3 2008400Al Jubail, SATasnee/SaharaQ4 2007150Bandar Assaluyeh, IRQ4 2007300Bandar Assaluyeh, IRJam PCQ4 2007300Bandar Assaluyeh, IRArya Sasol PCTimingCapacity (kt)LocationCompany
HDPE Expansions in MDE2007-2011
HDPE Expansions in MDEHDPE Expansions in MDE20072007--20112011

FPA 10-07FPA 10-07
U.S. vs. Saudi Supplied HDPE Resins to US2007
U.S. vs. Saudi Supplied HDPE Resins to US2007
Note: Integrated producersNote: Integrated producers
Saudi Cost AdvantageSaudi Cost Advantage
Total Mfg & Delivered CostsTotal Mfg & Delivered Costs
3. Domestic Logistics3. Domestic Logistics
2. Import Logistics/Duties2. Import Logistics/Duties
1. Manufacturing Cash Costs1. Manufacturing Cash Costs
Saudi Saudi ProducerProducer
U.S. U.S. ProducerProducer$ 840/MT$ 840/MT $ 305/MT$ 305/MT
$ 265/MT$ 265/MT--------
$ 75/MT$ 75/MT$ 75/MT$ 75/MT
$ 915/MT$ 915/MT $ 645/MT$ 645/MT
29.5%29.5%

FPA 10-07FPA 10-07
New Capacity in China (2006-2007)New Capacity in China (2006-2007)
Startup scheduled for Dec 06Startup scheduled for Dec 06End/06End/06150150Lanzhou, GansuLanzhou, GansuLanzhou PCLanzhou PCChinaChina
Mechanical completion Mechanical completion scheduled for Jul 06scheduled for Jul 06Oct 06Oct 06350350MaomingMaoming, ,
GuangdongGuangdongMaomingMaoming PCPCChinaChina
Plant installation completed Plant installation completed in Oct 05 but startup in Oct 05 but startup postponed to Apr 06postponed to Apr 06
Apr 06Apr 06300300Jilin, JilinJilin, JilinJilin PCJilin PCChinaChinaHDPEHDPE
Started up in Feb 06Started up in Feb 06Feb 06Feb 06200200Huizhou, Huizhou, GuangdongGuangdong
CNOOC & Shell CNOOC & Shell PCPCChinaChina
Startup scheduled for Dec 06Startup scheduled for Dec 06End/06End/06150150Lanzhou, GansuLanzhou, GansuLanzhou PCLanzhou PCChinaChinaLLDPELLDPE
Mechanical completion in Mechanical completion in Feb/Mar 07Feb/Mar 07Apr 07Apr 07250250MaomingMaoming, ,
GuangdongGuangdongMaomingMaoming PCPCChinaChina
Startup scheduled for Dec 06Startup scheduled for Dec 06End/06End/06200200Lanzhou, GansuLanzhou, GansuLanzhou PCLanzhou PCChinaChinaLDPELDPE
Started up in Apr 06Started up in Apr 06Apr 06Apr 06250250Huizhou, Huizhou, GuangdongGuangdong
CNOOC & Shell CNOOC & Shell PCPCChinaChina
RemarksRemarksExpected Expected StartupStartup
New Capacity New Capacity (Thousand (Thousand
Metric Tons)Metric Tons)LocationLocationProducerProducerCountryCountryProductProduct

FPA 10-07FPA 10-07
0.0
0.5
1.0
1.5
2.0
2.5
3.0
3.5
2007 2008 2009 2010 2011 2012SINOPEC CNPC SK Holdings Liaoning HuajinChengdu PC Various Investors Shenhua Group Exxon Mobil Corp.Saudi Aramco Jilin Petrochemica Other
Sinopec & CNPC Leaders in Capacity Expansions in NEASinopec & CNPC Leaders in Sinopec & CNPC Leaders in Capacity Expansions in NEACapacity Expansions in NEA
NEA PE Capacity Increases By Company, Million Metric TonsNEA PE Capacity Increases By Company, Million Metric Tons
FPA 10-07FPA 10-07
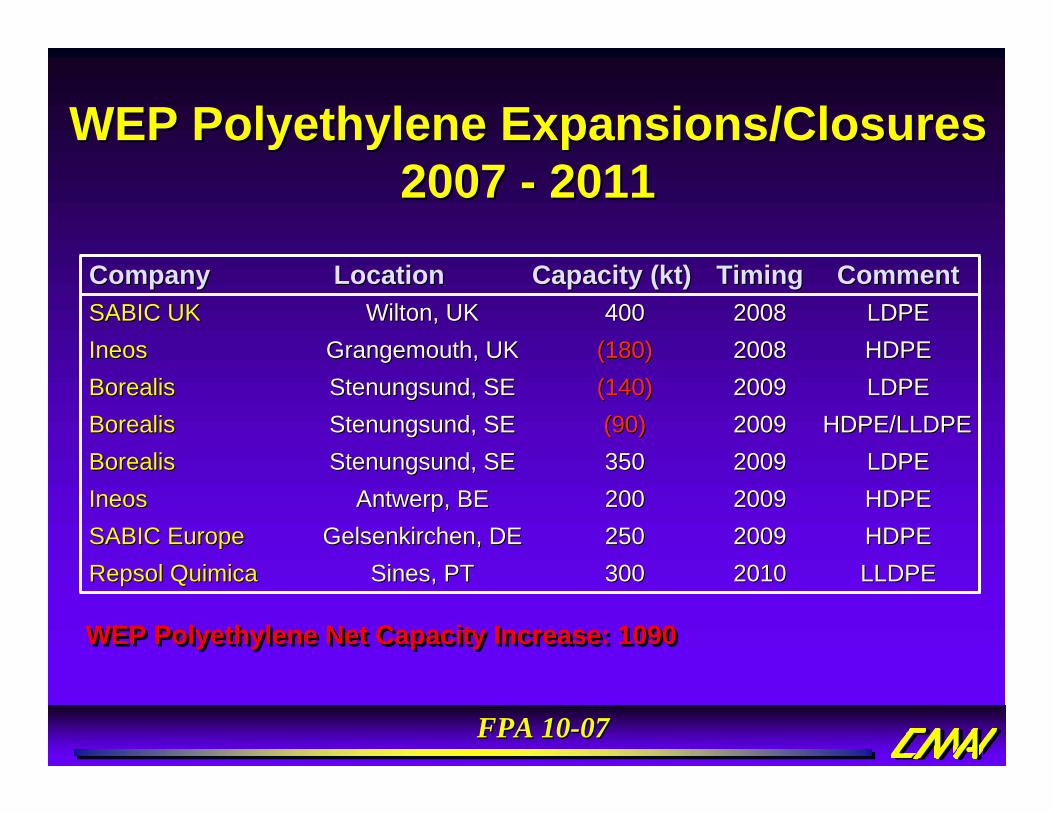
WEP Polyethylene Expansions/ClosuresWEP Polyethylene Expansions/Closures2007 2007 -- 20112011
HDPEHDPE20092009200200Antwerp, BEAntwerp, BEIneosIneosHDPEHDPE20092009250250Gelsenkirchen, DEGelsenkirchen, DESABIC EuropeSABIC EuropeLLDPELLDPE20102010300300Sines, PTSines, PTRepsol Quimica Repsol Quimica
LDPELDPE20092009350350Stenungsund, SEStenungsund, SEBorealisBorealisHDPE/LLDPEHDPE/LLDPE20092009(90)(90)Stenungsund, SEStenungsund, SEBorealisBorealis
HDPEHDPE20082008(180)(180)Grangemouth, UKGrangemouth, UKIneosIneosLDPELDPE20092009(140)(140)Stenungsund, SEStenungsund, SEBorealisBorealis
20082008TimingTiming
LDPELDPECommentComment
400400Wilton, UKWilton, UKSABIC UKSABIC UKCapacity (kt)Capacity (kt)LocationLocationCompanyCompany
WEP Polyethylene Net Capacity Increase: 1090WEP Polyethylene Net Capacity Increase: 1090

FPA 10-07FPA 10-07
Degradables, Bio-Polymers & PLADegradables, BioDegradables, Bio--Polymers & PLAPolymers & PLA•• Global consumptionGlobal consumption of bioof bio--degradable pkg. totaled over degradable pkg. totaled over
40 thousand metric tons40 thousand metric tons last yearlast year•• ProjectionProjection -- approach 120 thousand metric tons by 2011 approach 120 thousand metric tons by 2011 •• Europe leads consumptionEurope leads consumption at almost 20 thousand metric at almost 20 thousand metric
tons, North America consumed around 15 thousand tons, North America consumed around 15 thousand metric tons in 2006metric tons in 2006
•• PLAPLA represents about 40% of the global market todayrepresents about 40% of the global market today
40 Kta40 Kta
120 Kta120 Kta
20062006 20112011

FPA 10-07FPA 10-07
•• PLA (polylactic acid) represents over 40% of the PLA (polylactic acid) represents over 40% of the ““nonnon--petroleum basedpetroleum based”” polymer market todaypolymer market today
•• Projection Projection -- PLA consumption could exceed 100 PLA consumption could exceed 100 thousand metric tons by 2011thousand metric tons by 2011
Degradables, Bio-Polymers & PLADegradables, BioDegradables, Bio--Polymers & PLAPolymers & PLA

FPA 10-07FPA 10-07
Top Global Polyethylene Producers/MarketersTop Global Polyethylene Producers/Marketers(Based on Estimate of Marketed Capacity)(Based on Estimate of Marketed Capacity)
20022002CapacityCapacity % Capacity% Capacity--000000-- MTMT ShareShare
ExxonMobilExxonMobil 70257025 11.3311.33Dow ChemicalDow Chemical 69586958 11.2211.22Chevron PhillipsChevron Phillips 27602760 4.454.45EquistarEquistar 26082608 4.214.21BasellBasell 23302330 3.763.76BorealisBorealis 23162316 3.733.73BP ChemicalBP Chemical 18831883 3.043.04SinopecSinopec 18531853 2.992.99ATOFINA ATOFINA 17451745 2.812.81SABICSABIC 17081708 2.752.75TotalTotal 3118631186 50.2950.29
Total CapacityTotal Capacity 6567465674
20122012
CapacityCapacity % Capacity% Capacity--000000-- MTMT ShareShare
Dow ChemicalDow Chemical 84658465 8.328.32ExxonMobilExxonMobil 82658265 8.128.12SABICSABIC 67886788 6.676.67SinopecSinopec 67356735 6.626.62China China -- NPCNPC 45854585 4.514.51Chevron PhillipsChevron Phillips 43534353 4.284.28NPC NPC -- IranIran 36753675 3.613.61IneosIneos 32863286 3.233.23BorealisBorealis 31983198 3.143.14LyondellLyondell 25362536 2.492.49TotalTotal 5188651886 51.0151.01
Total CapacityTotal Capacity 101726101726

FPA 10-07FPA 10-07
North America PE ProducersYear End 2007 Capacities
North America PE ProducersYear End 2007 Capacities
DowExx
onMobil
Lyondell
(Bas
ell)
Chevro
n Phillips
Nova C
hemica
lWes
tlake
Formosa
Ineos
PEMEXTotal
PCFlin
t Hills
Du PontPetr
omontAT Plas
tics
0.00.51.01.52.02.53.03.54.04.5
LLDPELDPEHDPE
Million Metric TonsNote: CPChem/Ineos JV capacity split to partners
Imperial Oil included with ExxonMobil

FPA 10-07FPA 10-07
ChinaChina MexicoMexico Latin AmericaLatin AmericaRest of AsiaRest of Asia EuropeEurope Africa Mid EastAfrica Mid EastForecast ExportsForecast Exports Forecast ImportsForecast Imports Net TradeNet Trade
Record First Half PE ExportsRecord First Half PE ExportsRecord First Half PE Exports
--200200
00
200200
400400
600600
800800
10001000
20052005 Q2 Q2 Q3 Q3 Q4 Q4 20062006 Q2 Q2 Q3 Q3 Q4 Q4 20072007 Q2 Q2 Q3 Q3 Q4 Q4
ExportsExports
ImportsImports
U.S. and Canada PE Trade, Thousand Metric TonsU.S. and Canada PE Trade, Thousand Metric Tons

FPA 10-07FPA 10-07
00
1010
2020
3030
4040
5050
6060
7070
1Q/011Q/01 4Q/014Q/01 3Q/023Q/02 2Q/032Q/03 1Q/041Q/04 4Q/044Q/04 3Q/053Q/05 2Q/062Q/06 1Q/071Q/0700
1010
2020
3030
4040
5050
6060
7070
8080
9090
100100Billion UnitsBillion Units PercentPercent
China Share of TotalChina Share of Total WorldWorld ChinaChina
U.S. Bag Imports CollapseU.S. Bag Imports Collapse

FPA 10-07FPA 10-07
0
20
40
60
80
100
120
02 03 04 05 06 07 08 09 10 11 1240
50
60
70
80
90
100
Demand 5.1* Capacity 5.2* Operating Rate
Million Metric Tons Operating Rate, Percent
* %AAGR 2007-12
PE Global Operating RatesPE Global Operating Rates

FPA 10-07FPA 10-07
Production -0.6* Demand 1.9* Capacity -0.3* Operating Rate
0
1
2
3
4
5
6
7
8
02 03 04 05 06 07 08 09 10 11 1260
65
70
75
80
85
90
95
100Million Metric Tons Operating Rate, Percent
* %AAGR 2007-12
LLDPE Supply/Demand BalanceLLDPE Supply/Demand BalanceNorth AmericaNorth America

FPA 10-07FPA 10-07
Cash MarginCash Margin LLDPE Discounted PriceLLDPE Discounted Price Cash CostsCash CostsNote: Contract price is discountedNote: Contract price is discounted
--101000
10102020303040405050606070708080
JanJan--0505
AprApr--0505
JulJul--0505
OctOct--0505
JanJan--0606
AprApr--0606
JulJul--0606
OctOct--0606
JanJan--0707
AprApr--0707
JulJul--0707
OctOct--0707
JanJan--0808
AprApr--0808
JulJul--0808
OctOct--0808
Cents Per PoundCents Per Pound
ForecastForecast
~~
NAM LLDPE Butene Film Price Vs. Cash CostNAM LLDPE Butene Film Price Vs. Cash Cost

FPA 10-07FPA 10-07
HDPE Margin Ethylene Cash Margin HDPE Discounted Price
NAM PE Chain Margins (Annual)NAM PE Chain Margins (Annual)
-10
0
10
20
30
40
50
60
70
95 96 97 98 99 00 01 02 03 04 05 06 07 08 09 10 11 12 13 14 15
Cents Per PoundCents Per Pound

FPA 10-07FPA 10-07
Polyethylene Take-AwayPolyethylene TakePolyethylene Take--AwayAway
• Currently: NAM highly competitive PE exporter
• NAM domestic demand improving; Exports keeping NAM operating rates high.
• Export opportunities will remain attractive through mid-2008
• Excess capacity increases peak 2009-2010 period; operating rates expected to suffer
•• Currently: NAM highly competitive PE Currently: NAM highly competitive PE exporterexporter
•• NAM domestic demand improving; Exports NAM domestic demand improving; Exports keeping NAM operating rates high.keeping NAM operating rates high.
•• Export opportunities will remain attractive Export opportunities will remain attractive through midthrough mid--20082008
•• Excess capacity increases peak 2009Excess capacity increases peak 2009--2010 period; operating rates expected to 2010 period; operating rates expected to suffersuffer

FPA 10-07FPA 10-07
Polyethylene Take-AwayPolyethylene TakePolyethylene Take--AwayAway
• Saudi Arabia & Iran lead capacity increases in ME; NPC & Sabic = major impact on global markets
• Asian Market cannot take all ME exports –other global markets will be affected
• Resin prices near peak levels during forecast period
• Bio-Polymers small market today but becoming increasingly significant
•• Saudi Arabia & Iran lead capacity Saudi Arabia & Iran lead capacity increases in ME; NPC & increases in ME; NPC & SabicSabic = major = major impact on global marketsimpact on global markets
•• Asian Market cannot take all ME exports Asian Market cannot take all ME exports ––other global markets will be affectedother global markets will be affected
•• Resin prices near peak levels during Resin prices near peak levels during forecast periodforecast period
•• BioBio--Polymers small market today but Polymers small market today but becoming increasingly significantbecoming increasingly significant

FPA 10-07FPA 10-07
PropylenePropylenePropylene

FPA 10-07FPA 10-07
Propylene Key IssuesPropylene Key IssuesPropylene Key Issues
• Generally a by-product of making ethylene and gasoline
• Propylene use growing faster than ethylene use and gasoline consumption
• On purpose propylene more important• Supply sources vary from region to
region• P/E ratio rising
•• Generally a byGenerally a by--product of making product of making ethylene and gasolineethylene and gasoline
•• Propylene use growing faster than Propylene use growing faster than ethylene use and gasoline consumptionethylene use and gasoline consumption
•• On purpose propylene more importantOn purpose propylene more important•• Supply sources vary from region to Supply sources vary from region to
regionregion•• P/E ratio risingP/E ratio rising

FPA 10-07FPA 10-07
North AmericaNorth America2006 PG/CG Propylene Supply/Demand2006 PG/CG Propylene Supply/Demand
StmStm. Crackers. Crackers49%49%
OthersOthers3%3%
FCC/SplittersFCC/Splitters48%48%
OthersOthers6%6% AcryloAcrylo--
nitrilenitrile10%10%
CumeneCumene1%1%
Acrylic Acrylic AcidAcid6%6%
OxoOxo AlcAlc..6%6%
Propylene Propylene OxideOxide12%12%
PPPP59%59%
Production by SourceProduction by Source Demand by EndDemand by End--UseUse
Domestic Demand = 16 Million Metric TonsDomestic Demand = 16 Million Metric Tons

FPA 10-07FPA 10-07
Global Propylene Supply TrendsGlobal Propylene Supply TrendsGlobal Propylene Supply Trends
00
1010
2020
3030
4040
5050
6060
7070
8080
9090
100100
9090 9191 9292 9393 9494 9595 9696 9797 9898 9999 0000 0101 0202 0303 0404 0505 0606 0707 0808 0909 1010 1111
Propylene Supply Propylene Supply Million TonsMillion Tons
0.0%0.0%
2.0%2.0%
4.0%4.0%
6.0%6.0%
8.0%8.0%
10.0%10.0%
12.0%12.0%
14.0%14.0%
Alternative Alternative Technologies Technologies
ProportionProportion
Alternative TechnologiesAlternative Technologies
RefineriesRefineries
Steam CrackersSteam Crackers
Alternative TechnologiesAlternative TechnologiesAmountAmount

FPA 10-07FPA 10-07
Propylene to Ethylene Price RatiosPropylene to Ethylene Price RatiosPropylene to Ethylene Price Ratios
0.50.5
0.60.6
0.70.7
0.80.8
0.90.9
1.01.0
1.11.1
1.21.2
1.31.3
9090 9191 9292 9393 9494 9595 9696 9797 9898 9999 0000 0101 0202 0303 0404 0505 0606 0707 0808 0909 1010 1111 1212 1313 1414 1515
RatioRatio
0.50.5
0.60.6
0.70.7
0.80.8
0.90.9
1.01.0
1.11.1
1.21.2
1.31.3RatioRatio
ForecastForecast
Southeast AsiaSoutheast Asia West EuropeWest Europe North AmericaNorth America

FPA 10-07FPA 10-07
NAM Contract PriceNAM Contract Price WEP Contract PriceWEP Contract Price SEA CFR Spot PriceSEA CFR Spot Price
Global Long-Term Propylene PricesGlobal Long-Term Propylene Prices
200200300300
400400500500600600
700700800800900900
1,0001,000
1,1001,1001,2001,200
9090 9191 9292 9393 9494 9595 9696 9797 9898 9999 0000 0101 0202 0303 0404 0505 0606 0707 0808 0909 1010 1111 1212 1313 1414 1515
Dollars Per TonDollars Per Ton
ForecastForecast

FPA 10-07FPA 10-07
!! Tight suppliesTight supplies expected expected through 2008through 2008
!! The Middle EastThe Middle East emerging emerging as a global propylene as a global propylene suppliersupplier
!! Alternative technologiesAlternative technologies for for propylene have come of agepropylene have come of age
!! Propylene pricesPropylene prices impacted impacted by incremental supplies of by incremental supplies of onon--purpose propylenepurpose propylene
Propylene ConclusionPropylene ConclusionPropylene Conclusion

FPA 10-07FPA 10-07
PolypropylenePolypropylene

FPA 10-07FPA 10-07Thousand Metric TonsThousand Metric Tons% AAGR, 07% AAGR, 07--1212
00 500500 10001000 15001500 20002000 25002500 30003000 35003500
OtherOther
Fiber & FilamentFiber & Filament
Film & SheetFilm & Sheet
Blow MoldingBlow Molding
Injection MoldingInjection Molding
2012201220072007
3.3%3.3%
4.8%4.8%
4.1%4.1%
1.5%1.5%
3.1%3.1%
Total Growth Rate = 3.0%Total Growth Rate = 3.0%
North America PP IndustryNorth America PP IndustryDemand 2007-2012Demand 2007-2012

FPA 10-07FPA 10-07
20022002CapacityCapacity ShareShare
CompanyCompany (000's MT)(000's MT) %%BasellBasell 62076207 16.7016.70BP ChemicalBP Chemical 22422242 6.036.03SinopecSinopec 21062106 5.675.67ExxonMobilExxonMobil 17721772 4.774.77ATOFINAATOFINA 17121712 4.614.61BorealisBorealis 14001400 3.773.77Reliance IndustriesReliance Industries 12001200 3.233.23DSMDSM 985985 2.652.65Formosa Plastics Formosa Plastics 980980 2.642.64PetroChinaPetroChina 880880 2.372.37TotalTotal 1948419484 52.4352.43
Total CapacityTotal Capacity 3715937159
Top Global Polypropylene Producers/MarketersTop Global Polypropylene Producers/MarketersTop Global Polypropylene Producers/Marketers(Based on Estimate of Marketed Capacity)(Based on Estimate of Marketed Capacity)(Based on Estimate of Marketed Capacity)
20122012CapacityCapacity ShareShare
CompanyCompany (000's MT)(000's MT) %%BasellBasell 67836783 10.1110.11SinopecSinopec 48494849 7.237.23SABICSABICSABIC 347034703470 5.175.175.17PetroChinaPetroChina 28632863 4.274.27Reliance IndustriesReliance Industries 27802780 4.144.14BorealisBorealis 27452745 4.094.09ExxonMobilExxonMobil 26252625 3.913.91IneosIneos 25952595 3.873.87Total PCTotal PC 25802580 3.853.85Formosa PlasticsFormosa Plastics 20822082 3.103.10TotalTotal 3337233372 49.7549.75
Total CapacityTotal Capacity 6707667076

FPA 10-07FPA 10-07
North America Polypropylene Industry North America Polypropylene Industry 2007 Propylene F/S Integration - Basell Acquires Lyondell2007 Propylene F/S Integration - Basell Acquires Lyondell
(Propylene Consumption Capacity - Billion Lbs)(Propylene Consumption Capacity - Billion Lbs)
0.00.00.50.51.01.01.51.52.02.02.52.53.03.03.53.54.04.04.54.5
Basell
Basell
Ineos
Ineos
ExxonMobil
ExxonMobil
Sunoco (E
psilon)
Sunoco (E
psilon)
Total PC
Total PC
FPC USA
FPC USA
DowDow
Flint H
ills R
esource
s
Flint H
ills R
esource
sPhilli
ps
Phillips S
umika
Sumika
Pinnacle
Polymers
Pinnacle
Polymers
ConocoPhilli
ps
ConocoPhilli
psIndelp
ro
Indelpro
NonNon--Integrated PP ProductionIntegrated PP ProductionIntegrated PP ProductionIntegrated PP Production
66% Integrated Production for Total Industry66% Integrated Production for Total Industry

FPA 10-07FPA 10-07
--11
00
11
22
33
20072007 20082008 20092009 20102010 20112011 20122012
44
55
66
77
N. AmericaN. America S. AmericaS. America W. EuropeW. EuropeC. Europe/CIS & Baltic.C. Europe/CIS & Baltic. Africa/M. EastAfrica/M. East Asia PacificAsia Pacific
World PP Net Capacity Additions, Million Metric TonsWorld PP Net Capacity Additions, Million Metric Tons
Announced PP AdditionsAnnounced PP Additions
FPA 10-07FPA 10-07
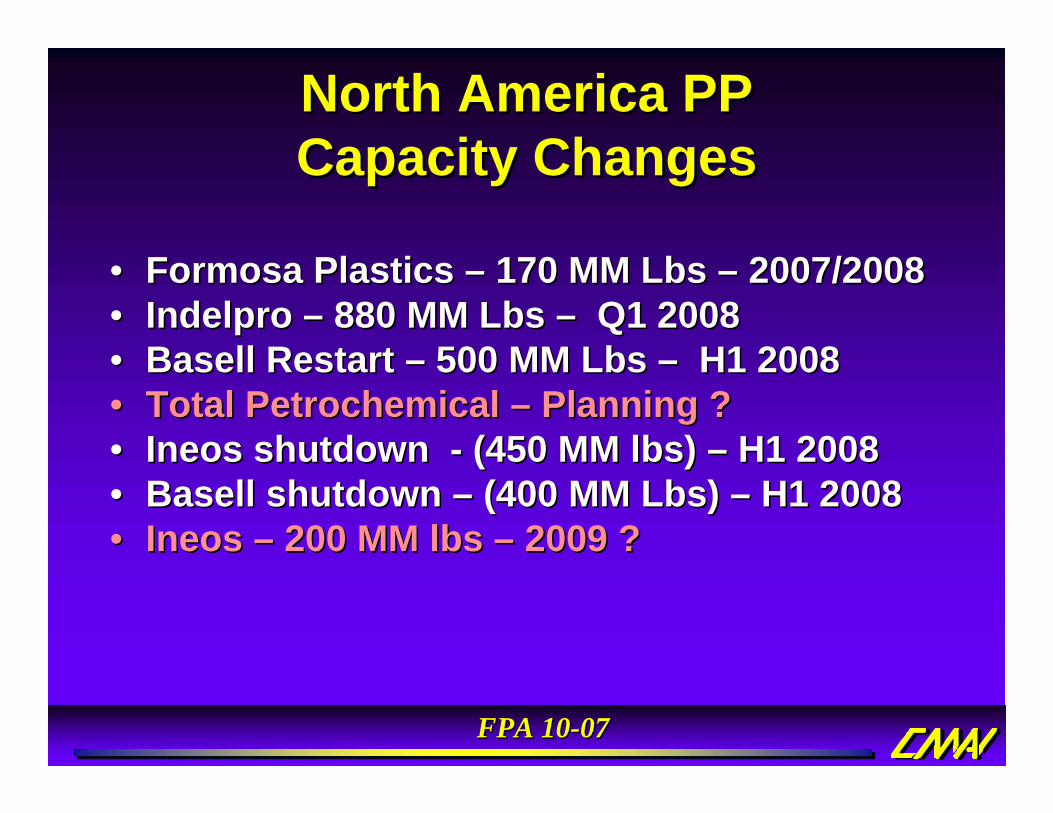
North America PP Capacity ChangesNorth America PP North America PP Capacity ChangesCapacity Changes
•• Formosa Plastics Formosa Plastics –– 170 MM Lbs 170 MM Lbs –– 2007/20082007/2008•• IndelproIndelpro –– 880 MM Lbs 880 MM Lbs –– Q1 2008Q1 2008•• Basell Restart Basell Restart –– 500 MM Lbs 500 MM Lbs –– H1 2008H1 2008•• Total Petrochemical Total Petrochemical –– Planning ?Planning ?•• IneosIneos shutdown shutdown -- (450 MM lbs) (450 MM lbs) –– H1 2008H1 2008•• BasellBasell shutdown shutdown –– (400 MM Lbs) (400 MM Lbs) –– H1 2008H1 2008•• IneosIneos –– 200 MM lbs 200 MM lbs –– 2009 ?2009 ?

FPA 10-07FPA 10-07
00
1010
2020
3030
4040
5050
6060
7070
0202 0303 0404 0505 0606 0707 0808 0909 1010 1111 12126565
7070
7575
8080
8585
9090
9595
100100Million Metric TonsMillion Metric Tons Operating Rate, PercentOperating Rate, Percent
Demand 6.0*Demand 6.0* Capacity 7.2*Capacity 7.2* Operating RateOperating Rate* %AAGR 2007* %AAGR 2007--1212
WorldPP Supply/Demand Balance
WorldWorldPP Supply/Demand BalancePP Supply/Demand Balance

FPA 10-07FPA 10-07
00
22
44
66
88
1010
1212
0202 0303 0404 0505 0606 0707 0808 0909 1010 1111 12127070
7575
8080
8585
9090
9595
100100
Production 0.5*Production 0.5* Demand 3.0*Demand 3.0* Capacity 1.0*Capacity 1.0* Operating RateOperating Rate
Million Metric TonsMillion Metric Tons Operating Rate, PercentOperating Rate, Percent
* %AAGR 2007* %AAGR 2007--1212
North AmericaPolypropylene Supply/Demand Balance
North AmericaNorth AmericaPolypropylene Supply/Demand BalancePolypropylene Supply/Demand Balance

FPA 10-07FPA 10-07Note: PP price represents a nonNote: PP price represents a non--discounted delivered invoice price; contract propylene pricediscounted delivered invoice price; contract propylene price
Contract PropyleneContract Propylene InjInj MldgMldg HomopolymerHomopolymerPP PP -- C3 DifferentialC3 Differential
00
1010
2020
3030
4040
5050
6060
7070
8080
0505 AprApr JulJul OctOct 0606 AprApr JulJul OctOct 0707 AprApr JulJul OctOct 0808 AprApr JulJul OctOct00
220220
440440
660660
880880
11001100
13201320
15401540
17601760Dollars Per Metric TonDollars Per Metric Ton
PEAKPEAKCents Per PoundCents Per Pound
U.S. Polypropylene/Propylene PricingU.S. Polypropylene/Propylene PricingMonthly 2005-2008Monthly 2005-2008

FPA 10-07FPA 10-07
--1010
00
1010
2020
3030
4040
5050
6060
7070
8080
9090 9191 9292 9393 9494 9595 9696 9797 9898 9999 0000 0101 0202 0303 0404 0505 0606 0707 0808 0909 1010 1111 1212
ForecastForecast
Cents Per PoundCents Per Pound
AdjAdj PP DomesticPP Domestic PG Propylene PG Propylene -- C3C3 Cash MarginCash MarginAdjusted PP Price = Estimated Actual Injection Molding HomopolymAdjusted PP Price = Estimated Actual Injection Molding Homopolymer Price; PG Propylene = Contract Benchmark Priceer Price; PG Propylene = Contract Benchmark Price
Margin over FeedstockMargin over Feedstock
PP versus PropylenePP versus Propylene

FPA 10-07FPA 10-07
Polypropylene Key Messages• PP demand will continue to
grow despite high propylene costs
• But.. propylene sourcing issues exist
• North America = reduced investment - expect some consolidation
• Major investments in Asia Pacific and Middle East
• Margin peak likely in 2007-early 2008
• Middle East will become largest net exporter, but not a big player in North America
Polypropylene

FPA 10-07FPA 10-07
And Finally……
• Reports available….• K-Fair presentations