ponza 05 june 2008
DESCRIPTION
Status report on analysis. F. Ambrosino T. Capussela F. Perfetto. Frascati 16 January 2009. Ponza 05 June 2008. Status report on analysis. OLD approach NEW approach. OLD approach NEW approach. Summary of 29/09/2008 meeting. OLD approach. - PowerPoint PPT PresentationTRANSCRIPT

Ponza 05 June 2008
Status report on analysis
F. Ambrosino T. Capussela F. Perfetto
Status report on analysisFrascati 16 January 2009

Ponza 05 June 2008
Summary of 29/09/2008 meeting
Which are the future plans: Understand the slope in the wrong pairing (w.p.) Select the approach in which to give the result
Frascati 16 January 2009
OLD approachNEW approach
OLD approachNEW approach
NEW approachOLD approach
= 0.027 0.004 = 0.036 0.003

Ponza 05 June 2008
In order to understand the presence of the slope in the w.p. fit we have generated MC samples with different values in input. We find:
input MC w.p. fit on MC w.p. fit on data
0 4.94 % (7.42 0.37)%
-0.026 4.93 % (7.02 0.38)%
-0.028 4.92 % (6.94 0.38)%
-0.030 4.92 % (6.89 0.38)%
-0.032 4.92 % (6.92 0.38)%
-0.034 4.92 % (6.86 0.38)%
-0.036 4.92 % (6.76 0.38)%
-0.038 4.91 % (6.79 0.38)%
-0.040 4.91 % (6.82 0.38)%
-0.042 4.90 % (6.71 0.38)%
-0.044 4.90 % (6.69 0.38)%
-0.046 4.90 % (6.62 0.38)%
-0.048 4.90 % (6.57 0.38)%
NEW APPROACH Slope in w.p.
-0.01520.0045
-0.01090.0046
-0.01010.0046
-0.01010.0045
-0.00940.0046
-0.00920.0046
-0.00870.0045
-0.00860.0046
-0.00820.0046
-0.00790.0045
-0.00790.0046
-0.00770.0046
-0.00650.0046
Solution new approach

Ponza 05 June 2008 Status report on analysis
Slope Wrong pairing new approach
=0 =-0.032
=-0.048 =-0.040
Frascati 16 January 2009

Ponza 05 June 2008
OLD APPROACH
input MC w.p. fit on MC w.p. fit on data
0 8.45 % (9.99 0.66)%
-0.026 8.43 % (10.21 0.66)%
-0.028 8.44 % (10.23 0.51)%
-0.030 8.44 % (10.28 0.66)%
-0.032 8.43 % (10.25 0.51)%
-0.034 8.43 % (10.37 0.66)%
-0.036 8.43 % (10.29 0.51)%
-0.038 8.43 % (10.25 0.66)%
-0.040 8.43 % (10.33 0.51)%
-0.042 8.42 % (10.32 0.66)%
-0.044 8.43 % (10.32 0.51)%
-0.046 8.42 % (10.36 0.66)%
-0.048 8.42 % (10.37 0.51)%
Solution old approach
Slope in w.p.
-0.00350.0022
-0.00170.0022
-0.00160.0022
-0.00150.0022
-0.00150.0022
-0.00120.0022
-0.00110.0022
-0.00100.0022
-0.00080.0022
-0.00080.0022
-0.00060.0022
-0.00040.0022
-0.00030.0022
Frascati 16 January 2009

Ponza 05 June 2008 Status report on analysis
Slope Wrong pairing old approach
=0 =-0.032
=-0.048 =-0.040
Frascati 16 January 2009
Ponza 05 June 2008 Status report on analysis
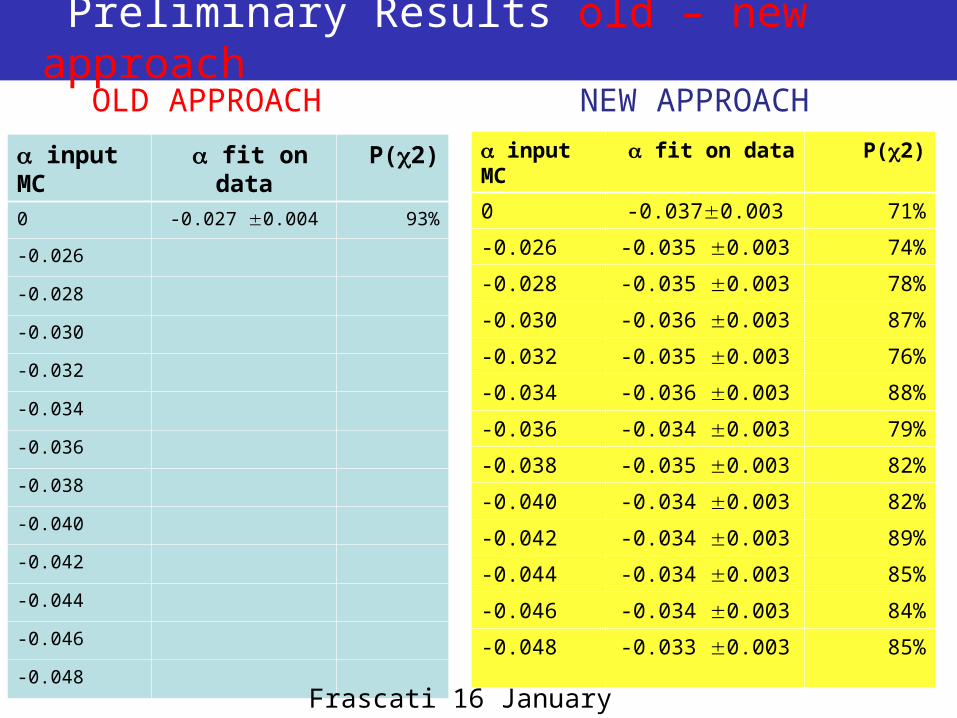
Preliminary Results old – new approach
input MC fit on data P(2)0 -0.027 0.004 93%
-0.026
-0.028
-0.030
-0.032
-0.034
-0.036
-0.038
-0.040
-0.042
-0.044
-0.046
-0.048
input MC fit on data P(2)
0 -0.0370.003 71%
-0.026 -0.035 0.003 74%
-0.028 -0.035 0.003 78%
-0.030 -0.036 0.003 87%
-0.032 -0.035 0.003 76%
-0.034 -0.036 0.003 88%
-0.036 -0.034 0.003 79%
-0.038 -0.035 0.003 82%
-0.040 -0.034 0.003 82%
-0.042 -0.034 0.003 89%
-0.044 -0.034 0.003 85%
-0.046 -0.034 0.003 84%
-0.048 -0.033 0.003 85%
OLD APPROACH NEW APPROACH
Frascati 16 January 2009
Ponza 05 June 2008 Status report on analysis
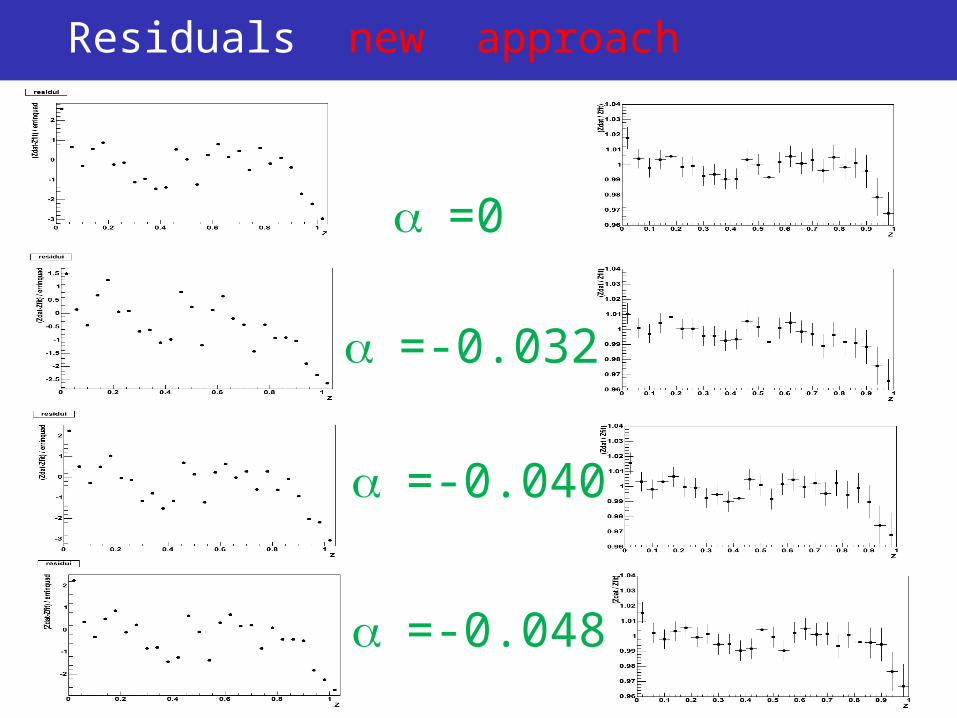
Residuals new approach
=0
=-0.032
=-0.048
=-0.040

Ponza 05 June 2008
Conclusions & Future plans
Frascati 16 January 2009
Which are the future plans:
In the next week, I’ll speak with the referees in order to select the approach in which to give the result Finally to publish!!!! In february, I’ll go in Uppsala to collaborate with Kupsc. “We” want to fit the Dalitz plot of in order to investigate possible cusp effect in
Conclusions: I have understand the presence of the slope in the wrong pairing (w.p.) I am evaluating in the two approaches and for the different samples.

Results
RangeLow
· 103
Medium I
· 103
Medium II
· 103
Medium III
· 103
High
· 103
(0, 1) 30 ± 2 31 ± 2 31 ± 3 25 ± 3 26 ± 4
(0, 0.8) 26 ± 2 28 ± 2 28 ± 3 22 ± 4 22 ± 5
(0, 0.7) 26 ± 3 28 ± 3 27 ± 4 21 ± 4 23 ± 5
(0, 0.6) 30 ± 4 31 ± 4 31 ± 4 24 ± 5 20 ± 6
= 0.027 0.004stat + 0.0040.006 syst
KLOE preliminary arXiv 0707.4137

Dalitz plot analysis of with the KLOE experimentFrascati 19 Luglio 2007
Samples
Pur 84.5% Eff 22 %Pur 92 % Eff 13.6 %
Pur 94.8% Eff 9.2 %
Pur 97.6% Eff 4.3 %
Low purity
High purity
Medium purity III
Medium purity II
Pur 75.4% Eff 30.3 %
Medium purity I 2 < 10
2 > 1.2
2 < 5
2 > 3
2 < 3
2 > 4
2 < 2
2 > 7
No cut on 2 and 2
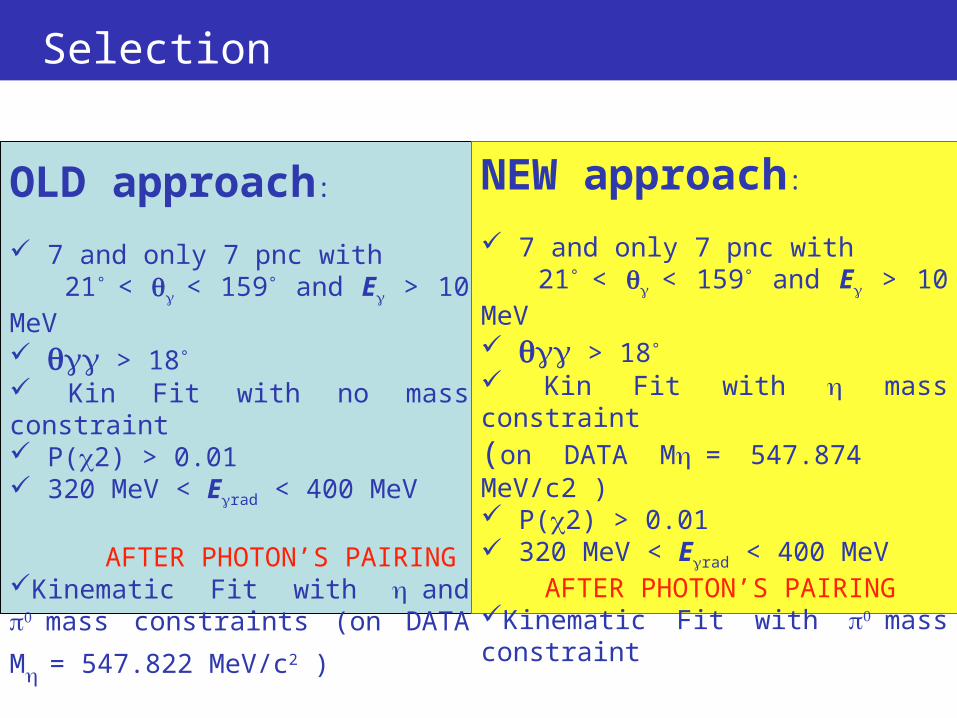
Selection
OLD approach:
7 and only 7 pnc with 21° < < 159° and E > 10 MeV > 18° Kin Fit with no mass constraint P(2) > 0.01 320 MeV < Erad < 400 MeV AFTER PHOTON’S PAIRINGKinematic Fit with and mass
constraints (on DATA M= 547.822
MeV/c2 )
NEW approach:
7 and only 7 pnc with 21° < < 159° and E > 10 MeV > 18° Kin Fit with mass constraint
(on DATA M= 547.874 MeV/c2 ) P(2) > 0.01 320 MeV < Erad < 400 MeV AFTER PHOTON’S PAIRINGKinematic Fit with mass constraint

Status report on analysisPonza 05 June 2008
Purity Old – New
Using the same cuts on min and
Pur 75.4%
Pur 84.5%
Pur 92%
Pur 94.8%
Pur 97.6%
Pur 82.2%
Pur 99%
Pur 97.1%
Pur 95.1%
Pur 89.4%
Low purity
Medium I purity
Medium II purity
Medium III purity
High purity