pooled fund survey fund surve… · § data received after the submission deadline may not be...
TRANSCRIPT

2018
Q3Pooled Fund Survey

Table of Contents
01 INTRODUCTION
02 SUMMARY OF MANDATE MEDIANS AND INDEX RETURNS
04 BALANCED
07 CANADIAN EQUITY
12 CANADIAN EQUITY (CORE)
14 CANADIAN EQUITY (GROWTH)
15 CANADIAN EQUITY (VALUE)
16 CANADIAN EQUITY (INCOME)
17 CANADIAN EQUITY (GARP)
18 CANADIAN EQUITY (QUANTITATIVE)
19 DIVERSIFIED CANADIAN EQUITY
20 CANADIAN SMALL CAP
22 GLOBAL EQUITY
25 US EQUITY
28 US LARGE CAP EQUITY
30 US LARGE/MID CAP EQUITY
31 US SMALL CAP EQUITY
32 NORTH AMERICAN EQUITY
33 NON NORTH AMERICAN EQUITY
36 EMERGING MARKETS
38 CANADIAN BONDS
41 GLOBAL BONDS
42 CORPORATE BONDS
43 HIGH YIELD BONDS
44 LONG DURATION BONDS
46 REAL RETURN BONDS
47 SHORT TERM BONDS
48 MONEY MARKET
50 REAL ESTATE
51 MORTGAGE
52 TARGET DATE 2020
53 TARGET DATE 2025
54 TARGET DATE 2030
55 TARGET DATE 2035
56 TARGET DATE 2040
57 TARGET DATE 2045
58 TARGET DATE 2050
59 TARGET DATE 2055

Introduction
The Pooled Fund Survey, produced by the Risk and Investment Analytics Group at RBC Investor & Treasury Services (RBC I&TS), includes contributions from over 90 asset managers, covering more than 700 unique funds that are available to Canadian institutional investors. Data contained in the survey is reported on the following basis:
§ All returns are shown gross of management fees and in Canadian dollars
§ Rates of return (ROR) are annualized for periods of more than one year
§ Percentile rankings (PR) and median values are calculated based on the data submitted for this quarter's report
§ If no fund data is submitted for specific mandates, the mandates may not be included in the current quarterly report
§ Data received after the submission deadline may not be included in the current quarterly report
§ Pooled fund performance data re-statements submitted after the release of the quarterly survey will be reflected in the next quarterly report
With over 30 years of experience, the Risk and Investment Analytics Group provides one of the industry’s largest and most comprehensive universes of Canadian pension plans from a database of more than 3,000 managed portfolios. Sophisticated applications and data management processes, combined with highly trained employees, offer a broad range of analytical solutions to help clients manage their investment decisions. Our solutions provide clients with:
§ Greater insight into a portfolio's performance and risk profile§ Enhanced investment governance with an objective, third-party perspective§ Operational efficiencies resulting from RBC I&TS’ scale and expertise
About RBC Investor & Treasury Services
RBC Investor & Treasury Services is a specialist provider of asset services, custody, payments and treasury services for financial and other institutional investors worldwide, with over 4,000 employees in 17 countries across North America, Europe, Asia and Australia. We deliver services to safeguard client assets, underpinned by client-centric digital solutions, which continue to be enhanced and evolved in line with our clients’ changing needs. Trusted with $4.2 trillion in client assets under administration, (1) RBC I&TS has been rated by our clients as the #1 global custodian for eight consecutive years(2) and is a financially strong partner with among the highest credit ratings globally.(3)
(1) RBC quarterly results released August 22, 2018(2) Global Custody Survey, Global Investor Group, 2011 to 2018, unweighted(3) Standard & Poor’s (AA-) and Moody’s (Aa2) of Royal Bank of Canada as of August 22, 2018, compared to the top 10 global custodians by client assets under administration
RBC INVESTOR & TREASURY SERVICES | POOLED FUND SURVEY | PER IOD ENDING SEPTEMBER 30, 2018 PAGE 1 OF 59

Period ending September 30, 2018
Medians and indices
1 quarter
ROR - %
1 year 2 years 3 years 4 years 5 years 10 years
ROR - % ROR - % ROR - % ROR - % ROR - % ROR - %
0.57 6.58 6.34 7.38 6.75 8.58 7.74Balanced Median
-0.25 6.32 7.78 9.94 6.05 8.96 7.69Canadian Equity Median
-0.57 5.87 7.52 9.70 4.87 7.80 6.30S&P/TSX Composite Index
-0.59 6.62 7.99 9.53 6.26 9.02 7.04Canadian Equity (Core) Median
-0.03 7.76 9.03 10.37 6.43 9.58 7.88Canadian Equity (Growth) Median
0.00 5.80 8.35 10.88 5.34 7.87 7.74Canadian Equity (Value) Median
1.08 5.20 7.70 10.21 6.16 9.05 8.88Canadian Equity (Income) Median
-0.21 6.12 7.99 9.74 6.23 9.00 7.36Canadian Equity (GARP) Median
-1.48 6.45 6.56 8.61 6.67 9.17 7.99Canadian Equity (Quantitative) Median
0.45 8.10 9.12 10.01 7.10 9.71 7.79Diversified Canadian Equity Median
-1.01 5.37 3.47 9.53 3.60 7.57 9.37Canadian Small Cap Median
-1.15 1.63 2.86 11.69 2.69 5.09 7.11BMO Weighted Blended SmCap Index
2.30 13.54 12.80 12.16 12.83 14.04 11.08Global Equity Median
5.48 21.32 16.86 14.90 15.63 17.71 13.63US Equity Median
5.84 21.87 17.28 15.89 16.72 19.29 14.17S&P 500 (CAD)
6.06 21.17 16.87 15.37 15.93 18.41 13.63US Large Cap Median
4.70 23.57 17.64 14.38 15.29 18.19 13.34US Large/Mid Cap Median
3.45 19.89 17.02 14.02 15.74 16.26 15.24US Small Cap Median
1.78 19.10 16.98 15.70 17.12 16.28 13.31Russell 2000 (CAD)
1.24 13.79 12.94 10.51 10.65 13.04 11.18North American Equity Median
-0.86 6.07 9.79 8.73 9.05 9.97 8.29Non North American Equity Median
-2.74 2.56 9.29 11.49 8.23 9.05 8.15Emerging Markets Median
-0.79 1.80 -0.30 1.95 2.65 3.44 4.77Canadian Bond Median
-0.96 1.66 -0.68 1.60 2.51 3.26 4.44FTSE TMX Cda Universe
-1.87 0.01 0.83 2.72 4.43 5.53 6.71Global Bond Median
-3.33 1.77 -2.92 0.45 3.99 4.90 4.22FTSE WGBI (CAD)
-0.35 2.53 1.39 3.19 3.55 4.22 5.99Corporate Bond Median
-0.46 2.10 0.86 2.65 2.98 3.69 5.54FTSE TMX Canada All Corporate Bond
1.02 3.79 5.67 6.60 5.07 5.83 8.03High Yield Bond Median
1.04 6.38 8.81 9.21 5.28 6.10 7.48FTSE TMX Canada High Yield Bond
-2.42 3.72 -1.24 3.31 4.34 5.72 6.80Long Duration Bond Median
Summary of Mandate Medians and Index Returns
RBC INVESTOR & TREASURY SERVICES | POOLED FUND SURVEY | PER IOD ENDING SEPTEMBER 30, 2018 PAGE 2 OF 59

Summary of Mandate Medians and Index Returns
Period ending September 30, 2018
Medians and indices
1 quarter
ROR - %
1 year 2 years 3 years 4 years 5 years 10 years
ROR - % ROR - % ROR - % ROR - % ROR - % ROR - %
-2.43 3.60 -1.29 3.15 4.22 5.61 6.73FTSE TMX Canada Long Term Overall Bond
-2.19 4.91 -1.41 1.78 2.18 3.62 4.99Real Return Bond Median
-2.21 4.91 -1.44 1.80 2.19 3.64 5.03FTSE TMX Canada Real Return Bond Overall Index
0.12 1.13 0.56 1.21 1.66 2.04 3.22Short Term Bonds Median
0.01 0.82 0.06 0.71 1.29 1.61 2.80FTSE TMX Canada Short Term Overall Bond
0.40 1.36 1.06 0.92 0.93 0.97 1.04Money Market Median
0.31 1.15 0.81 0.69 0.71 0.76 0.84FTSE TMX Canada 91 Day T-Bill
2.20 9.07 8.18 6.75 7.06 7.18 6.81Real Estate Median
0.07 2.22 1.88 1.70 1.53 1.63 1.46Consumer Price Index CAD
0.03 2.71 1.10 2.38 3.04 3.66 4.74Mortgages Median
0.73 2.44 2.66 2.91 3.08 3.48 4.79FTSE TMX Canada Mortgage
0.25 5.21 4.64 6.03 5.77 7.21 6.87Target Date 2020 Median
0.23 6.37 5.72 7.08 6.64 8.31 7.37Target Date 2025 Median
0.57 7.26 6.67 7.70 7.34 9.21 7.87Target Date 2030 Median
0.58 8.41 7.53 8.47 8.02 9.83 8.13Target Date 2035 Median
0.97 8.76 8.33 9.09 8.48 10.34 8.47Target Date 2040 Median
0.78 10.14 9.08 9.89 9.06 10.39 8.60Target Date 2045 Median
1.20 9.74 9.41 9.81 9.10 10.89 8.37Target Date 2050 Median
0.62 9.07 9.34 10.00 8.18 10.20Target Date 2055 Median
RBC INVESTOR & TREASURY SERVICES | POOLED FUND SURVEY | PER IOD ENDING SEPTEMBER 30, 2018 PAGE 3 OF 59
Period ending September 30, 2018 Four year periods ending September 30
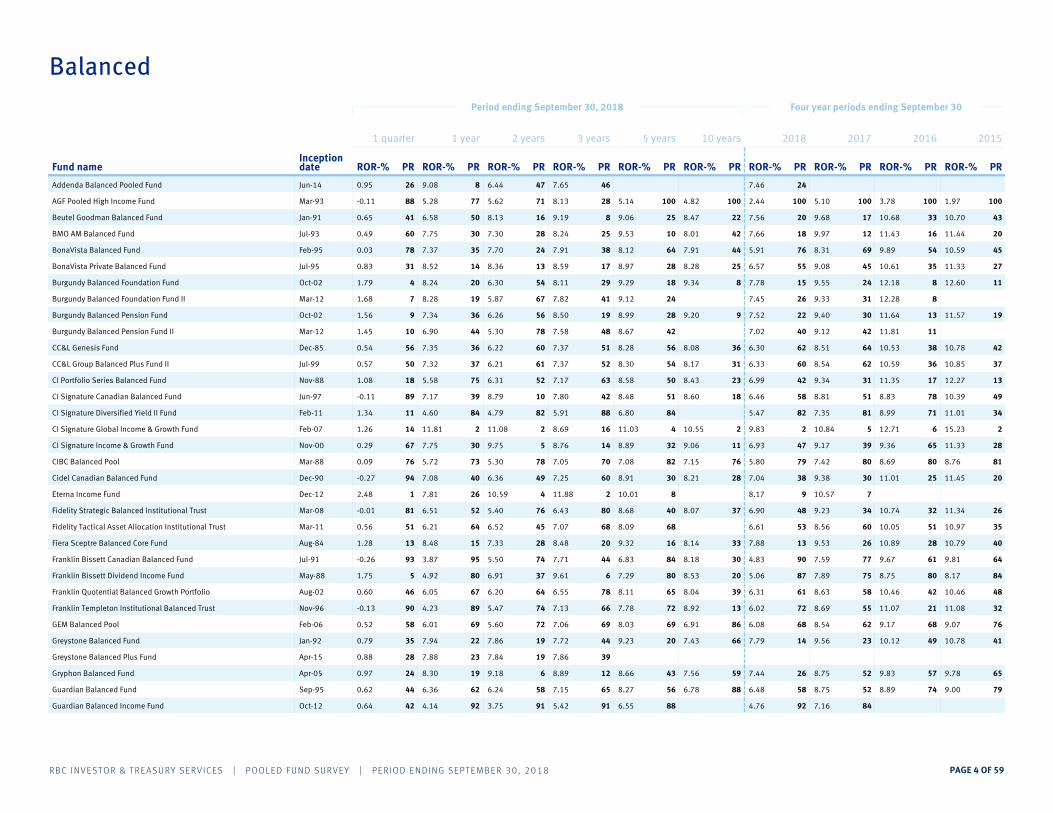
Balanced
Fund nameInceptiondate
1 quarter
ROR-% PR
1 year 2 years 3 years 5 years 10 years 2018 2017 2016 2015
ROR-% PR ROR-% PR ROR-% PR ROR-% PR ROR-% PR ROR-% PR ROR-% PR ROR-% PR ROR-% PR
Jun-14 0.95 9.08 6.44 47 7.65 46 7.46 24Addenda Balanced Pooled Fund 826
Mar-93 -0.11 5.28 5.62 71 8.13 28 5.14 100 4.82 2.44100 100 5.10 100 3.78 100 1.97 100AGF Pooled High Income Fund 7788
Jan-91 0.65 6.58 8.13 16 9.19 8 9.06 25 8.47 7.5622 20 9.68 17 10.68 33 10.70 43Beutel Goodman Balanced Fund 5041
Jul-93 0.49 7.75 7.30 28 8.24 25 9.53 10 8.01 7.6642 18 9.97 12 11.43 16 11.44 20BMO AM Balanced Fund 3060
Feb-95 0.03 7.37 7.70 24 7.91 38 8.12 64 7.91 5.9144 76 8.31 69 9.89 54 10.59 45BonaVista Balanced Fund 3578
Jul-95 0.83 8.52 8.36 13 8.59 17 8.97 28 8.28 6.5725 55 9.08 45 10.61 35 11.33 27BonaVista Private Balanced Fund 1431
Oct-02 1.79 8.24 6.30 54 8.11 29 9.29 18 9.34 7.788 15 9.55 24 12.18 8 12.60 11Burgundy Balanced Foundation Fund 204
Mar-12 1.68 8.28 5.87 67 7.82 41 9.12 24 7.45 26 9.33 31 12.28 8Burgundy Balanced Foundation Fund II 197
Oct-02 1.56 7.34 6.26 56 8.50 19 8.99 28 9.20 7.529 22 9.40 30 11.64 13 11.57 19Burgundy Balanced Pension Fund 369
Mar-12 1.45 6.90 5.30 78 7.58 48 8.67 42 7.02 40 9.12 42 11.81 11Burgundy Balanced Pension Fund II 4410
Dec-85 0.54 7.35 6.22 60 7.37 51 8.28 56 8.08 6.3036 62 8.51 64 10.53 38 10.78 42CC&L Genesis Fund 3656
Jul-99 0.57 7.32 6.21 61 7.37 52 8.30 54 8.17 6.3331 60 8.54 62 10.59 36 10.85 37CC&L Group Balanced Plus Fund II 3750
Nov-88 1.08 5.58 6.31 52 7.17 63 8.58 50 8.43 6.9923 42 9.34 31 11.35 17 12.27 13CI Portfolio Series Balanced Fund 7518
Jun-97 -0.11 7.17 8.79 10 7.80 42 8.48 51 8.60 6.4618 58 8.81 51 8.83 78 10.39 49CI Signature Canadian Balanced Fund 3989
Feb-11 1.34 4.60 4.79 82 5.91 88 6.80 84 5.47 82 7.35 81 8.99 71 11.01 34CI Signature Diversified Yield II Fund 8411
Feb-07 1.26 11.81 11.08 2 8.69 16 11.03 4 10.55 9.832 2 10.84 5 12.71 6 15.23 2CI Signature Global Income & Growth Fund 214
Nov-00 0.29 7.75 9.75 5 8.76 14 8.89 32 9.06 6.9311 47 9.17 39 9.36 65 11.33 28CI Signature Income & Growth Fund 3067
Mar-88 0.09 5.72 5.30 78 7.05 70 7.08 82 7.15 5.8076 79 7.42 80 8.69 80 8.76 81CIBC Balanced Pool 7376
Dec-90 -0.27 7.08 6.36 49 7.25 60 8.91 30 8.21 7.0428 38 9.38 30 11.01 25 11.45 20Cidel Canadian Balanced Fund 4094
Dec-12 2.48 7.81 10.59 4 11.88 2 10.01 8 8.17 9 10.57 7Eterna Income Fund 261
Mar-08 -0.01 6.51 5.40 76 6.43 80 8.68 40 8.07 6.9037 48 9.23 34 10.74 32 11.34 26Fidelity Strategic Balanced Institutional Trust 5281
Mar-11 0.56 6.21 6.52 45 7.07 68 8.09 68 6.61 53 8.56 60 10.05 51 10.97 35Fidelity Tactical Asset Allocation Institutional Trust 6451
Aug-84 1.28 8.48 7.33 28 8.48 20 9.32 16 8.14 7.8833 13 9.53 26 10.89 28 10.79 40Fiera Sceptre Balanced Core Fund 1513
Jul-91 -0.26 3.87 5.50 74 7.71 44 6.83 84 8.18 4.8330 90 7.59 77 9.67 61 9.81 64Franklin Bissett Canadian Balanced Fund 9593
May-88 1.75 4.92 6.91 37 9.61 6 7.29 80 8.53 5.0620 87 7.89 75 8.75 80 8.17 84Franklin Bissett Dividend Income Fund 805
Aug-02 0.60 6.05 6.20 64 6.55 78 8.11 65 8.04 6.3139 61 8.63 58 10.46 42 10.46 48Franklin Quotential Balanced Growth Portfolio 6746
Nov-96 -0.13 4.23 5.47 74 7.13 66 7.78 72 8.92 6.0213 72 8.69 55 11.07 21 11.08 32Franklin Templeton Institutional Balanced Trust 8990
Feb-06 0.52 6.01 5.60 72 7.06 69 8.03 69 6.91 6.0886 68 8.54 62 9.17 68 9.07 76GEM Balanced Pool 6958
Jan-92 0.79 7.94 7.86 19 7.72 44 9.23 20 7.43 7.7966 14 9.56 23 10.12 49 10.78 41Greystone Balanced Fund 2235
Apr-15 0.88 7.88 7.84 19 7.86 39Greystone Balanced Plus Fund 2328
Apr-05 0.97 8.30 9.18 6 8.89 12 8.66 43 7.56 7.4459 26 8.75 52 9.83 57 9.78 65Gryphon Balanced Fund 1924
Sep-95 0.62 6.36 6.24 58 7.15 65 8.27 56 6.78 6.4888 58 8.75 52 8.89 74 9.00 79Guardian Balanced Fund 6244
Oct-12 0.64 4.14 3.75 91 5.42 91 6.55 88 4.76 92 7.16 84Guardian Balanced Income Fund 9242
RBC INVESTOR & TREASURY SERVICES | POOLED FUND SURVEY | PER IOD ENDING SEPTEMBER 30, 2018 PAGE 4 OF 59

Period ending September 30, 2018 Four year periods ending September 30
Balanced
Fund nameInceptiondate
1 quarter
ROR-% PR
1 year 2 years 3 years 5 years 10 years 2018 2017 2016 2015
ROR-% PR ROR-% PR ROR-% PR ROR-% PR ROR-% PR ROR-% PR ROR-% PR ROR-% PR ROR-% PR
Apr-15 0.54 5.19 4.77 82 6.05 86Guardian Managed Income Fund 7855
Apr-15 0.92 7.06 7.10 32 7.93 37Guardian Manged Income & Growth Fund 4127
Jan-85 0.64 7.63 6.68 43 7.33 56 8.25 58 7.60 6.5758 55 8.41 66 9.76 58 10.00 59GWL Canadian Diversified Investment Fund 1 3242
Apr-98 0.77 8.41 7.40 27 7.97 35 9.35 14 8.02 6.9541 45 9.59 20 11.10 20 11.16 31GWL Canadian Equity/Bond Fund 1 1636
Nov-84 -0.56 3.35 2.97 97 4.81 97 5.57 96 5.84 4.3198 96 6.13 96 6.36 96 5.63 96GWL Income Investment Fund 1 9897
Oct-98 1.06 7.81 6.83 40 7.58 48 8.84 34 7.42 7.3567 29 9.10 43 10.20 47 10.31 51Highstreet Balanced Fund 2618
Feb-10 0.70 4.86 4.30 88 5.17 94 6.01 92 4.92 89 6.30 94 7.07 90 7.11 90Highstreet Conservative Balanced Fund 8139
Dec-01 0.27 6.21 6.93 35 8.27 22 8.89 31 7.67 7.1354 32 9.58 21 10.48 41 10.17 56HSBC Canadian Balanced Fund (Institutional Series) 6468
Aug-05 2.12 19.95 18.12 1 16.58 1 16.93 1 15.12 16.441 1 16.19 1 16.68 1 18.37 1HughesLittle Balanced Fund 13
Jan-87 -0.35 6.03 4.38 87 6.10 84 8.11 64 7.52 6.0661 69 8.64 57 10.25 46 10.08 58Industrial Alliance Diversified Fund 6895
Dec-98 -0.09 6.73 5.39 76 6.68 75 8.68 39 7.83 6.1146 66 9.18 36 10.89 28 11.01 34Industrial Alliance Diversified Opportunity Fund 4786
Dec-98 -0.51 4.26 2.69 99 4.05 100 6.49 88 6.56 4.8492 90 7.06 86 7.99 86 8.07 84Industrial Alliance Diversified Security Fund 8896
Jan-88 -0.08 6.39 6.24 58 7.36 54 8.59 47 7.08 7.0580 37 9.15 41 9.79 58 9.91 62Integra Balanced Fund 5986
Jun-87 -0.05 6.36 6.20 64 7.38 50 8.67 42 7.12 7.0678 36 9.26 33 9.92 54 9.93 61Integra Diversified Fund 6284
Jun-92 -1.19 3.96 3.69 91 5.66 89 7.46 76 7.41 5.4168 82 8.35 68 11.07 22 11.37 24Invesco (Growth) 94100
Oct-99 0.82 5.66 7.71 24 7.35 55 9.08 24 8.82 8.0914 10 9.95 12 12.44 7 14.06 6Invesco (Trimark Global Balanced) 7432
Sep-87 2.63 6.41 8.82 9 9.81 4 9.54 10 8.77 7.7115 17 10.34 9 11.77 11 12.10 14Invesco (Trimark Income Growth) 581
Jul-00 0.11 3.63 3.21 95 6.07 85 5.17 99 5.85 2.5398 100 5.56 99 7.64 88 9.53 68J Zechner Associates Inc Balanced Fund 9674
Apr-97 0.61 6.06 5.95 66 7.05 70 8.83 34 8.22 6.9627 44 9.53 26 11.45 16 12.13 14Jarislowsky Fraser Balanced Fund 6645
Dec-03 0.98 8.77 8.47 12 8.00 34 7.43 77 9.55 5.906 78 7.10 86 8.18 82 9.92 62JCIC Balanced Fund 1223
Nov-09 0.74 8.42 11.73 2 10.83 3 8.17 61 7.09 33 8.11 72 5.97 97 6.43 92Kingwest Balanced Portfolio 1638
Jan-01 0.57 6.41 7.80 21 9.13 9 8.62 45 8.13 6.7034 51 9.17 37 10.36 45 10.43 48Leith Wheeler Diversified Pooled Fund 5850
Jul-05 0.99 6.45 9.12 7 9.12 9 9.22 21 8.61 7.5218 22 9.92 13 12.22 8 12.73 10Letko Brosseau RSP Balanced Fund 5622
Sep-00 1.25 6.48 5.72 69 7.20 61 7.25 80 7.18 6.0372 71 7.45 79 9.67 61 9.30 71Lincluden Balanced Fund - Series O 5314
Feb-07 0.55 3.04 3.45 94 5.20 93 5.81 94 6.33 4.5194 95 6.51 91 8.01 85 7.89 87Lincluden Income Plus Pooled Fund 9854
Jul-81 0.01 6.47 6.29 54 6.56 77 7.78 72 6.79 6.1688 65 8.11 72 8.82 78 9.55 67London Life Diversified Fund (LC) 5479
Jun-05 -0.02 5.95 6.34 50 6.12 84 7.60 74 7.05 5.9583 75 8.02 74 9.21 68 10.25 54Manulife Asset Management Diversified Fund 7082
Feb-99 1.04 9.03 7.15 31 8.25 24 10.52 6 10.01 9.024 6 10.90 4 13.76 2 14.50 3Mawer Balanced Pooled Fund 919
Jul-13 1.72 11.58 8.15 15 8.72 15 11.19 2 10.02 2 11.10 3Mawer Global Balanced Fund 26
Jan-88 1.00 8.78 7.02 33 8.06 31 10.33 6 9.93 8.824 6 10.72 6 13.59 3 14.43 4Mawer Tax Effective Balanced Fund 1222
Mar-99 0.23 7.68 6.93 35 7.24 60 8.80 36 7.60 7.2057 31 9.09 44 10.50 39 11.06 32MFS Balanced Fund 3269
Sep-91 0.47 9.15 7.78 22 8.26 23 9.52 11 7.74 8.2250 8 9.61 18 11.03 24 11.26 29MFS Balanced Growth Fund 761
Aug-01 0.18 4.60 4.65 84 6.38 80 8.58 50 7.73 6.8051 49 9.60 19 11.78 11 11.99 16MFS Balanced Value Fund 8472
RBC INVESTOR & TREASURY SERVICES | POOLED FUND SURVEY | PER IOD ENDING SEPTEMBER 30, 2018 PAGE 5 OF 59

Period ending September 30, 2018 Four year periods ending September 30
Balanced
Fund nameInceptiondate
1 quarter
ROR-% PR
1 year 2 years 3 years 5 years 10 years 2018 2017 2016 2015
ROR-% PR ROR-% PR ROR-% PR ROR-% PR ROR-% PR ROR-% PR ROR-% PR ROR-% PR ROR-% PR
Jul-05 -0.19 4.10 2.51 100 3.88 100 5.89 94 5.91 4.7096 93 6.35 94 7.87 87 8.14 84MFS LifePlan Retiree Fund 9291
Aug-00 0.55 7.81 6.57 44 6.88 73 8.73 37 7.50 6.9963 42 8.97 48 10.79 30 11.37 24MFS Responsible Balanced Fund 2653
Sep-95 0.53 9.59 6.91 37 8.06 32 7.84 71 7.07 6.0881 68 7.41 80 8.89 74 8.92 80Montrusco Bolton Balanced Fund 557
Sep-88 -0.04 6.93 6.82 40 8.14 28 9.22 20 7.85 7.4446 27 9.81 16 10.75 31 10.45 48PH&N Balanced Pension Trust 4383
Dec-96 -1.01 1.59 2.87 97 4.96 96 5.20 98 7.18 3.3672 97 6.13 96 8.89 74 9.03 78QV Investors Canadian Balanced Fund 10099
Jul-17 0.88 9.16 7.50 26 7.82 41 9.30 17 7.68 7.6354 19 9.34 31 11.13 19 11.55 19RBC Vision Balanced Fund 728
Feb-92 0.81 6.86 7.94 17 9.00 11 8.60 46 7.76 7.0749 34 9.04 46 9.55 64 9.32 70Scheer Rowlett Balanced Fund 4534
Jul-97 0.07 4.31 4.50 85 6.58 76 8.18 61 7.39 6.0070 73 9.17 40 11.18 18 11.41 22SEAMARK Balanced Pooled Fund 8776
Jun-13 0.34 5.80 5.06 80 6.28 81 7.38 78 7.15 5.9076 78 7.78 76 8.93 72 9.34 70SEI Balanced 50/50 Fund 7266
May-01 0.43 6.59 6.20 63 7.17 62 8.23 59 7.49 6.6664 52 8.65 56 9.90 54 10.30 52SEI Balanced 60/40 Fund 5062
Jun-03 0.11 4.80 6.39 48 8.47 20 6.72 86 6.56 5.3292 84 7.21 83 6.94 92 5.94 95Sionna Balanced Pooled Fund 8274
Dec-09 0.38 4.89 4.15 89 5.49 90 6.12 91 5.29 85 6.43 92 6.75 93 6.60 92Sun Life Financial Granite Retirement Seg Fund 8064
Feb-09 0.82 7.79 6.78 41 8.04 33 9.45 13 7.96 12 9.87 15 11.61 14 11.80 17Sun Life Granite Balanced Segregated Fund 2833
Feb-09 0.19 4.21 3.56 93 5.09 95 6.42 89 5.28 86 6.98 88 8.04 84 8.00 85Sun Life Granite Conservative Segregated Fund 9071
Feb-09 1.23 10.26 8.73 10 9.73 5 11.35 2 9.58 4 11.62 2 13.83 2 14.11 6Sun Life Granite Growth Segregated Fund 415
Feb-09 0.61 6.46 5.65 70 7.00 72 8.41 52 7.04 38 8.90 49 10.44 43 10.60 45Sun Life Granite Moderate Segregated Fund 5546
Apr-92 0.35 6.79 6.32 52 7.34 56 8.09 68 7.03 6.3084 62 8.41 66 9.19 68 9.09 75TD Emerald Balanced Fund Passive 4665
Fund Count 83 83 83 83 79 65 80 76 79 82
Average Return 0.59 6.81 6.57 7.55 8.36 7.89 6.71 8.73 9.89 10.19
5th Percentile 1.75 9.63 9.79 9.70 10.68 9.79 9.18 10.84 13.01 14.21
1st Quartile 0.96 7.82 7.58 8.23 9.06 8.31 7.45 9.54 11.01 11.36
Median 0.57 6.58 6.34 7.38 8.58 7.74 6.75 8.86 10.08 10.35
3rd Quartile 0.10 5.58 5.44 6.66 7.55 7.16 5.94 7.89 8.88 9.10
95th Percentile -0.37 3.83 3.23 5.08 5.73 6.07 4.49 6.23 6.48 5.94
RBC INVESTOR & TREASURY SERVICES | POOLED FUND SURVEY | PER IOD ENDING SEPTEMBER 30, 2018 PAGE 6 OF 59

Period ending September 30, 2018 Four year periods ending September 30
Canadian Equity
Fund nameInceptiondate
1 quarter
ROR-% PR
1 year 2 years 3 years 5 years 10 years 2018 2017 2016 2015
ROR-% PR ROR-% PR ROR-% PR ROR-% PR ROR-% PR ROR-% PR ROR-% PR ROR-% PR ROR-% PR
Oct-06 -0.89 5.37 6.86 71 10.13 46 9.45 29 6.44 6.7380 24 10.49 22 10.70 38 9.12 54Addenda Canadian Equity Pooled Fund 6874
Sep-03 1.08 7.66 10.08 13 12.41 12 11.63 2 10.42 9.196 4 12.65 2 15.01 3 14.37 2Beutel Goodman Canadian Dividend Fund 2516
Jan-91 0.38 7.40 9.86 16 11.51 20 10.12 14 9.58 7.1311 18 10.81 16 12.84 10 12.11 4Beutel Goodman Canadian Equity Fund 2929
Sep-97 -0.66 6.36 8.32 40 9.25 71 7.40 82 6.87 4.8968 71 7.66 85 7.11 96 7.06 83BlackRock Active Canadian Equity Fund 4969
Oct-11 -0.56 7.72 7.91 48 8.89 75 7.55 80 4.85 74 7.51 88 7.89 84BlackRock Canada Alpha Advantage 2262
Jul-93 -0.55 5.93 7.55 56 9.73 55 7.83 70 6.33 4.9085 70 8.31 69 7.80 86 6.59 86BlackRock Canadian Equity Index Class A 5561
Jul-10 -0.78 5.57 8.02 46 9.57 62 8.97 50 6.02 51 9.84 39 9.25 67 8.83 60BMO AM Canadian Core Alpha Fund 6472
Aug-92 -1.49 4.37 7.88 49 9.74 54 8.85 52 6.45 38 10.00 35 10.93 35 9.66 47BMO AM Canadian Equity Fund 7882
Jun-11 -0.82 3.13 6.56 75 9.30 69 10.17 12 7.32 16 12.01 4 12.31 16 11.23 13BMO AM Canadian Smart Alpha Equity Fund (formerly Liability Sensitive Equity Fund) 8873
Feb-95 -0.14 8.08 10.55 7 11.23 23 9.21 40 8.76 5.9222 55 9.49 48 11.13 29 11.35 11BonaVista Canadian Equity Fund 1745
Mar-12 1.09 3.35 5.56 86 9.20 72 6.11 94 2.79 95 6.81 96 9.53 61Burgundy Canadian Large Cap Equity Fund 8616
May-99 1.30 5.46 8.35 40 10.56 31 7.07 84 9.19 4.4216 80 7.47 89 9.14 69 9.77 44Burgundy Focus Canadian Equity Fund 6713
Nov-91 -1.49 5.91 5.78 84 8.59 82 9.20 40 8.05 5.4938 60 10.04 32 12.34 15 11.72 6CC&L Canadian Equity Fund 5682
Dec-12 0.99 5.29 7.13 66 10.15 45 10.27 10 7.07 19 11.56 7CC&L Equity Income & Growth Fund 7019
Dec-91 -1.48 7.14 7.13 66 9.60 61 9.27 36 8.22 6.0533 50 9.80 39 11.45 24 10.79 24CC&L Group Canadian Equity Fund 3482
Dec-01 -1.46 8.40 8.51 36 10.64 30 9.35 32 8.25 6.6331 29 9.59 46 10.53 44 9.80 42CC&L Q Canadian Equity Core Fund 1581
Dec-00 -2.11 10.49 9.13 28 10.90 27 10.13 13 8.85 7.3920 14 10.05 32 12.40 13 11.61 7CC&L Q Canadian Equity Growth Fund 688
Dec-11 -0.36 4.36 4.64 90 7.95 89 9.92 20 6.33 41 11.35 9 16.89 2CI Cambridge All Canadian Equity Fund 7854
Jul-16 -0.78 2.81 3.99 93CI Cambridge Canadian Institutional Equity Fund 9172
Oct-96 1.69 6.90 9.28 25 10.21 42 9.38 31 9.47 7.4512 13 10.01 35 10.71 38 11.00 16CI Signature Dividend Fund 407
Jul-99 0.23 3.84 7.01 68 10.06 48 7.11 84 6.75 4.2972 82 7.94 80 7.80 86 7.17 82CIBC Canadian Equity All Cap Value Pool 8234
Dec-11 -0.38 6.09 8.47 37 11.13 24 6.42 90 4.16 84 6.50 97 6.53 98CIBC Canadian Equity Large Cap Dividend Value Pool 5256
Jul-97 -0.56 5.81 7.47 59 9.62 60 7.75 74 6.28 4.8290 77 8.24 73 7.74 90 6.55 90CIBC Canadian Equity S&P/TSX Index Pool 6163
Apr-96 -3.43 -1.68 -1.35 99 6.62 98 5.57 97 8.81 2.1721 98 7.47 89 10.08 56 6.20 93CIBC Canadian Equity Small Cap Pool 10097
Dec-00 -1.40 2.46 5.26 88 7.09 95 6.65 87 7.21 3.4360 92 7.73 83 9.43 62 9.75 45Cidel Canadian Equity Fund 9280
Dec-98 0.50 2.71 7.09 66 10.15 45 9.13 44 9.25 6.7114 25 10.80 17 12.14 17 11.47 8Cidel Canadian Total Return Equity Pooled Fund 9127
Oct-14 0.64 5.53 6.61 74 9.05 73 3.04 94Dixon Mitchell Canadian Equity Fund 6624
Apr-11 5.49 15.03 11.13 4 13.12 8 9.82 22 7.68 11 8.55 66 11.97 19 13.03 3Dixon Mitchell Small Cap Fund 21
Dec-12 -0.25 8.31 12.02 2 13.69 4 9.53 26 6.70 26 9.84 39Eterna Canadian Equity Fund 1650
Jan-14 -0.06 0.89 8.62 34 12.29 13 10.36 2Eterna Quebec Equity Fund 9542
Jul-02 -0.32 5.25 7.29 62 8.77 78 9.60 24 7.93 6.7841 22 10.71 19 11.33 25 10.53 28Fidelity Canadian Core Equity Institutional Trust 7152
Mar-11 -0.44 7.55 7.96 47 9.24 71 10.86 6 7.37 15 11.70 6 14.83 4 14.45 2Fidelity Canadian Focused Equity Institutional Trust 2758
Jul-12 0.55 4.72 5.54 86 8.08 87 9.78 22 6.50 35 11.08 12 13.81 6Fidelity Canadian Low Volatility Institutional Trust 7426
RBC INVESTOR & TREASURY SERVICES | POOLED FUND SURVEY | PER IOD ENDING SEPTEMBER 30, 2018 PAGE 7 OF 59
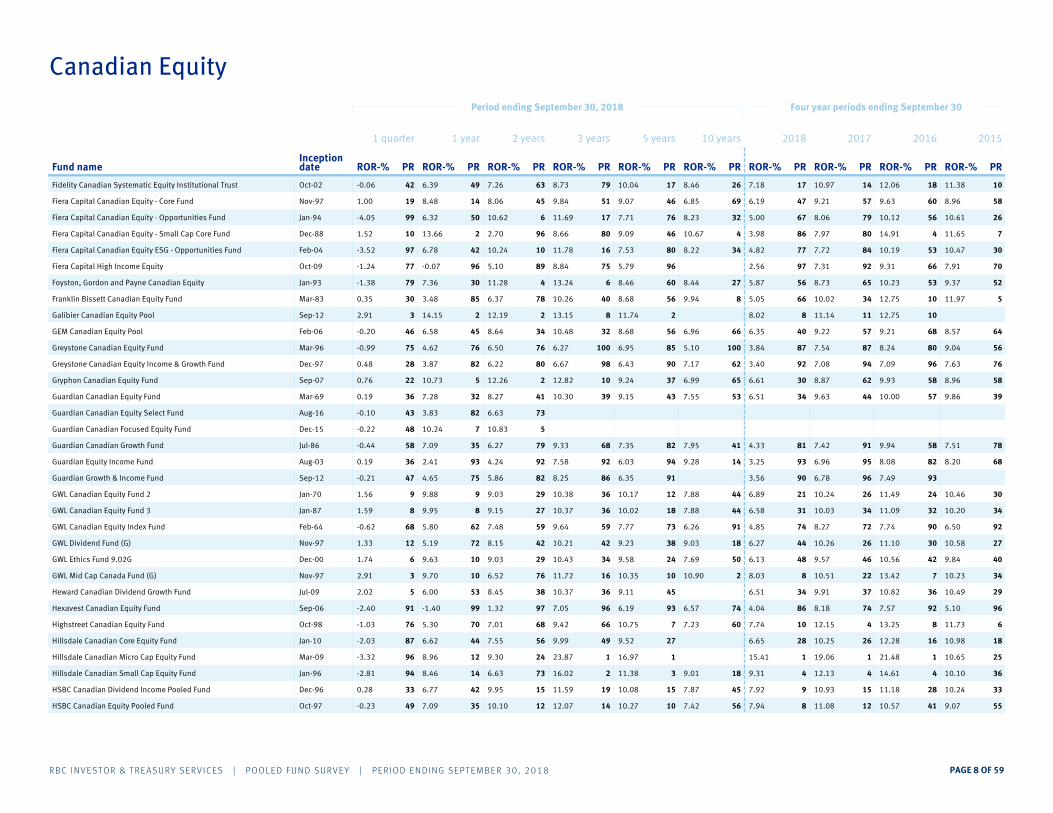
Period ending September 30, 2018 Four year periods ending September 30
Canadian Equity
Fund nameInceptiondate
1 quarter
ROR-% PR
1 year 2 years 3 years 5 years 10 years 2018 2017 2016 2015
ROR-% PR ROR-% PR ROR-% PR ROR-% PR ROR-% PR ROR-% PR ROR-% PR ROR-% PR ROR-% PR
Oct-02 -0.06 6.39 7.26 63 8.73 79 10.04 17 8.46 7.1826 17 10.97 14 12.06 18 11.38 10Fidelity Canadian Systematic Equity Institutional Trust 4942
Nov-97 1.00 8.48 8.06 45 9.84 51 9.07 46 6.85 6.1969 47 9.21 57 9.63 60 8.96 58Fiera Capital Canadian Equity - Core Fund 1419
Jan-94 -4.05 6.32 10.62 6 11.69 17 7.71 76 8.23 5.0032 67 8.06 79 10.12 56 10.61 26Fiera Capital Canadian Equity - Opportunities Fund 5099
Dec-88 1.52 13.66 2.70 96 8.66 80 9.09 46 10.67 3.984 86 7.97 80 14.91 4 11.65 7Fiera Capital Canadian Equity - Small Cap Core Fund 210
Feb-04 -3.52 6.78 10.24 10 11.78 16 7.53 80 8.22 4.8234 77 7.72 84 10.19 53 10.47 30Fiera Capital Canadian Equity ESG - Opportunities Fund 4297
Oct-09 -1.24 -0.07 5.10 89 8.84 75 5.79 96 2.56 97 7.31 92 9.31 66 7.91 70Fiera Capital High Income Equity 9677
Jan-93 -1.38 7.36 11.28 4 13.24 6 8.46 60 8.44 5.8727 56 8.73 65 10.23 53 9.37 52Foyston, Gordon and Payne Canadian Equity 3079
Mar-83 0.35 3.48 6.37 78 10.26 40 8.68 56 9.94 5.058 66 10.02 34 12.75 10 11.97 5Franklin Bissett Canadian Equity Fund 8530
Sep-12 2.91 14.15 12.19 2 13.15 8 11.74 2 8.02 8 11.14 11 12.75 10Galibier Canadian Equity Pool 23
Feb-06 -0.20 6.58 8.64 34 10.48 32 8.68 56 6.96 6.3566 40 9.22 57 9.21 68 8.57 64GEM Canadian Equity Pool 4546
Mar-96 -0.99 4.62 6.50 76 6.27 100 6.95 85 5.10 3.84100 87 7.54 87 8.24 80 9.04 56Greystone Canadian Equity Fund 7675
Dec-97 0.48 3.87 6.22 80 6.67 98 6.43 90 7.17 3.4062 92 7.08 94 7.09 96 7.63 76Greystone Canadian Equity Income & Growth Fund 8228
Sep-07 0.76 10.73 12.26 2 12.82 10 9.24 37 6.99 6.6165 30 8.87 62 9.93 58 8.96 58Gryphon Canadian Equity Fund 522
Mar-69 0.19 7.28 8.27 41 10.30 39 9.15 43 7.55 6.5153 34 9.63 44 10.00 57 9.86 39Guardian Canadian Equity Fund 3236
Aug-16 -0.10 3.83 6.63 73Guardian Canadian Equity Select Fund 8243
Dec-15 -0.22 10.24 10.83 5Guardian Canadian Focused Equity Fund 748
Jul-86 -0.44 7.09 6.27 79 9.33 68 7.35 82 7.95 4.3341 81 7.42 91 9.94 58 7.51 78Guardian Canadian Growth Fund 3558
Aug-03 0.19 2.41 4.24 92 7.58 92 6.03 94 9.28 3.2514 93 6.96 95 8.08 82 8.20 68Guardian Equity Income Fund 9336
Sep-12 -0.21 4.65 5.86 82 8.25 86 6.35 91 3.56 90 6.78 96 7.49 93Guardian Growth & Income Fund 7547
Jan-70 1.56 9.88 9.03 29 10.38 36 10.17 12 7.88 6.8944 21 10.24 26 11.49 24 10.46 30GWL Canadian Equity Fund 2 99
Jan-87 1.59 9.95 9.15 27 10.37 36 10.02 18 7.88 6.5844 31 10.03 34 11.09 32 10.20 34GWL Canadian Equity Fund 3 88
Feb-64 -0.62 5.80 7.48 59 9.64 59 7.77 73 6.26 4.8591 74 8.27 72 7.74 90 6.50 92GWL Canadian Equity Index Fund 6268
Nov-97 1.33 5.19 8.15 42 10.21 42 9.23 38 9.03 6.2718 44 10.26 26 11.10 30 10.58 27GWL Dividend Fund (G) 7212
Dec-00 1.74 9.63 9.03 29 10.43 34 9.58 24 7.69 6.1350 48 9.57 46 10.56 42 9.84 40GWL Ethics Fund 9.02G 106
Nov-97 2.91 9.70 6.52 76 11.72 16 10.35 10 10.90 8.032 8 10.51 22 13.42 7 10.23 34GWL Mid Cap Canada Fund (G) 103
Jul-09 2.02 6.00 8.45 38 10.37 36 9.11 45 6.51 34 9.91 37 10.82 36 10.49 29Heward Canadian Dividend Growth Fund 535
Sep-06 -2.40 -1.40 1.32 97 7.05 96 6.19 93 6.57 4.0474 86 8.18 74 7.57 92 5.10 96Hexavest Canadian Equity Fund 9991
Oct-98 -1.03 5.30 7.01 68 9.42 66 10.75 7 7.23 7.7460 10 12.15 4 13.25 8 11.73 6Highstreet Canadian Equity Fund 7076
Jan-10 -2.03 6.62 7.55 56 9.99 49 9.52 27 6.65 28 10.25 26 12.28 16 10.98 18Hillsdale Canadian Core Equity Fund 4487
Mar-09 -3.32 8.96 9.30 24 23.87 1 16.97 1 15.41 1 19.06 1 21.48 1 10.65 25Hillsdale Canadian Micro Cap Equity Fund 1296
Jan-96 -2.81 8.46 6.63 73 16.02 2 11.38 3 9.01 9.3118 4 12.13 4 14.61 4 10.10 36Hillsdale Canadian Small Cap Equity Fund 1494
Dec-96 0.28 6.77 9.95 15 11.59 19 10.08 15 7.87 7.9245 9 10.93 15 11.18 28 10.24 33HSBC Canadian Dividend Income Pooled Fund 4233
Oct-97 -0.23 7.09 10.10 12 12.07 14 10.27 10 7.42 7.9456 8 11.08 12 10.57 41 9.07 55HSBC Canadian Equity Pooled Fund 3549
RBC INVESTOR & TREASURY SERVICES | POOLED FUND SURVEY | PER IOD ENDING SEPTEMBER 30, 2018 PAGE 8 OF 59

Period ending September 30, 2018 Four year periods ending September 30
Canadian Equity
Fund nameInceptiondate
1 quarter
ROR-% PR
1 year 2 years 3 years 5 years 10 years 2018 2017 2016 2015
ROR-% PR ROR-% PR ROR-% PR ROR-% PR ROR-% PR ROR-% PR ROR-% PR ROR-% PR ROR-% PR
Oct-01 0.46 7.72 9.49 18 10.86 28 9.88 21 8.68 7.0224 20 10.43 24 10.42 50 9.73 46Industrial Alliance Canadian Equity Growth 2228
Dec-69 0.32 7.76 8.16 42 9.74 54 7.73 75 6.03 5.3295 63 7.72 84 8.06 82 7.24 80Industrial Alliance Canadian Equity Value 2031
Dec-97 1.09 7.29 9.21 26 11.62 19 10.07 15 8.72 7.3823 14 10.78 18 10.72 38 9.51 49Industrial Alliance Dividends Fund 3216
Jan-99 -0.89 5.58 7.29 62 9.40 66 9.27 36 6.58 6.5574 32 10.21 27 10.12 56 9.49 50Integra Canadian Value Growth Fund 6474
Apr-00 -4.69 -0.55 -4.36 100 13.20 6 3.22 100 6.19 0.2894 100 4.19 99 3.35 100 -11.11 100J Zechner Associates Inc. Special Equity Fund 97100
Apr-97 0.19 5.89 7.59 54 9.67 58 9.21 40 7.87 6.2346 46 10.05 32 12.01 19 11.32 12Jarislowsky Fraser Canadian Equity Fund 5736
Jun-18 1.49 7.05 7.65 52 9.76 53 9.51 27 6.36 40 10.14 29 12.58 11Jarislowsky Fraser Dividend Growth Fund 3610
Aug-16 -0.21 8.33 10.51 8Jarislowsky, Fraser Small/Mid Cap Equity Fund 1647
Oct-05 0.64 10.98 13.99 1 13.19 6 10.84 6 9.89 10.039 2 10.80 17 10.98 34 10.85 22Kingwest Canadian Equity Portfolio 424
May-03 0.06 14.56 9.77 16 10.96 26 9.08 46 8.33 6.7329 24 7.75 82 10.82 36 11.07 15Landry Canadian Equity Fund 239
Dec-10 0.84 6.05 10.48 8 14.18 3 10.04 17 7.09 19 11.06 12 10.99 34 9.97 37Leith Wheeler Canadian Dividend Fund 5221
May-94 0.34 6.97 10.24 10 13.27 5 9.27 34 8.41 5.6528 58 9.85 38 11.11 30 10.27 32Leith Wheeler Canadian Equity Fund 3830
May-17 0.77 6.53Letko Brosseau Canadian Equity Fund 4622
Jan-13 0.60 4.03 6.99 69 8.98 74 8.89 52 6.45 37 10.15 29Lincluden Stable Income Equity Fund 8025
Jan-80 0.30 6.44 8.10 44 8.37 85 8.66 57 5.91 5.7696 57 9.23 56 8.91 72 8.98 58London Life Canadian Equity Fund (LC) 4832
Jun-05 1.32 5.20 8.12 43 10.25 41 7.52 80 7.74 4.8849 72 8.10 77 8.84 73 7.35 79London Life Dividend Fund (LC) 7212
Dec-10 -2.38 3.68 6.13 81 10.96 26 5.67 96 2.67 96 6.17 98 6.33 98 3.93 98Louisbourg Canadian Equity Fund 8390
Dec-10 -2.23 3.27 5.83 83 10.44 34 6.61 88 4.10 85 7.46 89 8.88 72 7.94 70Louisbourg Dividend Fund 8789
Oct-11 -2.25 21.06 9.84 16 16.74 2 11.07 5 10.30 2 8.70 65 13.43 7Louisbourg Quantitative Canadian Equity Fund 189
Dec-11 -0.32 7.36 9.33 22 10.05 48 10.94 6 8.58 6 11.85 5 11.28 26Manulife AM Canadian Core Equity Pooled Fund 3052
Aug-06 -0.05 7.70 7.61 53 7.92 90 9.35 32 6.89 6.3368 41 9.76 41 11.22 27 11.10 14Manulife AM Canadian Large Cap Growth Pooled 2342
Jan-98 -0.57 5.93 7.56 56 9.71 56 7.83 70 6.32 4.9087 70 8.31 68 7.78 87 6.56 89Manulife AM Canadian S&P/TSX Index 5564
May-05 -0.35 7.31 9.39 20 9.45 65 8.93 51 6.32 6.2287 46 9.33 52 9.33 64 8.84 60Manulife Asset Management Canadian Equity Fund 3154
Dec-90 -0.36 7.24 9.33 23 9.49 64 8.96 50 6.44 6.3180 42 9.40 51 9.31 66 8.74 62Manulife Capped Canadian Equity Fund 3354
Feb-99 1.77 6.90 9.30 24 10.15 45 11.63 2 10.93 8.772 5 12.85 2 15.20 2 16.01 1Mawer Canadian Equity Pooled Fund 406
Jan-81 -0.68 7.49 9.34 22 8.59 82 9.42 30 6.46 6.4378 38 9.91 37 10.57 41 10.90 20MFS Canadian Equity Fund 2770
Jan-94 -0.59 7.75 8.91 30 8.78 77 9.27 34 7.47 6.3055 43 9.65 43 10.46 49 10.85 22MFS Canadian Research Equity Fund 2166
Jan-94 -1.11 3.07 5.82 83 7.14 95 8.01 66 7.69 4.8250 77 9.28 54 10.31 51 10.72 25MFS Low Volatility Canadian Equity Fund 8976
Aug-00 -0.63 7.68 8.79 31 8.49 83 8.97 49 7.28 6.0059 52 9.30 54 10.29 52 11.00 16MFS Responsible Canadian Research Equity Fund 2468
Jan-86 2.55 10.48 10.11 12 10.40 35 7.99 68 7.36 4.1957 83 7.37 91 7.50 93 7.23 80Montrusco Bolton Canadian Equity Fund 64
Sep-02 3.89 7.82 9.42 19 11.33 22 8.02 66 10.00 4.978 68 8.07 78 8.60 76 9.64 47Montrusco Bolton Equity Income Fund 191
Feb-96 -2.67 9.21 -2.92 99 8.42 84 4.14 99 5.86 3.7297 88 2.92 100 10.50 48 6.51 92Montrusco Bolton Quantitative Canadian Equity Fund 1193
Apr-79 0.24 6.95 8.47 38 9.81 52 8.48 60 6.84 5.6470 58 8.87 62 9.35 63 8.75 62Northern Trust Asset Mgmt. Canadian Equity Fund 3834
RBC INVESTOR & TREASURY SERVICES | POOLED FUND SURVEY | PER IOD ENDING SEPTEMBER 30, 2018 PAGE 9 OF 59
Period ending September 30, 2018 Four year periods ending September 30
Canadian Equity
Fund nameInceptiondate
1 quarter
ROR-% PR
1 year 2 years 3 years 5 years 10 years 2018 2017 2016 2015
ROR-% PR ROR-% PR ROR-% PR ROR-% PR ROR-% PR ROR-% PR ROR-% PR ROR-% PR ROR-% PR
Jan-97 0.17 4.51 7.61 53 10.30 38 6.45 90 6.20 3.6793 89 6.94 95 5.62 99 4.30 98Optimum Canadian Equity 7737
Aug-97 -0.01 7.68 7.40 61 9.29 69 7.60 78 6.52 4.6576 79 7.58 86 8.66 75 7.94 70PCJ Canadian Equity Fund 2440
Feb-07 -0.64 5.84 6.31 79 8.25 86 7.82 70 11.37 3.451 91 8.33 68 12.28 16 14.20 2Pembroke Canadian Growth Fund 5968
Jan-12 3.77 3.61 7.96 47 12.22 13 8.16 64 5.34 63 9.33 52 12.46 12Pembroke Dividend Growth Fund 842
Jun-71 -0.54 4.75 6.38 78 9.47 64 8.61 58 7.03 5.2564 64 9.59 46 11.09 32 10.09 36PH&N Canadian Equity Fund 7461
Dec-09 -0.16 6.98 8.73 32 11.21 24 9.46 29 6.52 33 10.09 30 10.51 47 10.02 37PH&N Canadian Equity Value Fund 3845
Apr-12 1.08 5.37 7.70 51 10.54 31 9.21 40 5.95 54 10.18 28 11.82 21PH&N Conservative Equity Income Fund 6816
Jun-77 1.06 5.78 8.49 36 10.82 28 8.72 55 8.09 6.0536 50 9.46 49 10.11 56 9.40 51PH&N Dividend Income Fund 6217
Dec-06 -1.91 1.18 4.67 90 7.57 92 6.71 87 8.03 4.3038 82 8.14 76 11.95 20 11.46 8QV Investors Canadian Equity Fund 9586
Nov-11 -1.86 6.65 8.71 32 9.51 63 8.75 54 6.01 52 9.29 54 10.51 45RBC QUBE 120/20 Canadian Equity Fund 4485
Nov-11 -1.48 6.46 7.78 50 8.61 81 8.11 65 4.89 70 8.53 66 9.34 64RBC QUBE Canadian Equity Fund 4782
Nov-11 -1.39 2.66 5.25 88 7.82 91 10.02 18 6.77 22 11.94 5 12.42 12RBC QUBE Low Volatility Canadian Equity Fund 9279
Jul-07 -0.38 4.38 7.28 62 9.94 50 8.49 60 8.08 5.2736 64 9.54 47 9.68 60 8.82 61RBC Vision Canadian Equity Fund 7856
Jan-92 0.00 5.80 10.50 8 12.59 11 8.22 62 6.34 5.9682 54 8.83 63 7.30 95 6.39 92Scheer Rowlett Canadian Equity Fund 6240
Jul-97 -3.80 -1.52 2.61 96 6.47 99 6.17 93 5.50 2.6999 96 8.18 74 9.76 59 7.77 73SEAMARK Canadian Equity Pooled Fund 10098
Jul-12 1.28 3.15 3.81 94 7.96 88 9.60 24 7.49 12 11.28 9 14.43 5SEAMARK Pooled Low Volatility Equity Fund 8813
Aug-97 -0.53 5.52 6.80 71 8.77 78 8.16 64 6.34 5.5282 60 8.83 63 9.26 67 8.52 64SEI Canadian Equity Fund 6660
Dec-07 -0.26 5.94 9.37 21 11.65 18 7.68 76 7.78 5.3748 62 8.12 76 8.24 80 7.63 76Sionna Canadian All Cap Pooled Fund 5450
Jun-03 0.82 6.80 10.07 14 12.96 9 8.65 58 7.53 6.5654 32 9.11 59 8.62 76 7.01 84Sionna Canadian Equity Pooled Fund 4221
Jul-91 -0.58 5.85 7.50 58 9.67 58 7.79 72 6.30 4.8689 74 8.27 72 7.77 88 6.57 88TD Emerald Canadian Equity Index Fund 5864
Aug-00 -0.57 5.86 7.50 58 9.67 58 7.78 72 6.33 4.8684 74 8.27 72 7.77 89 6.58 88TD Emerald CDN Market Capped Pooled Fund Trust Passive 5864
Sep-09 -0.42 3.64 5.61 86 7.65 92 9.17 42 6.67 27 10.60 21 11.55 23 12.09 4TD Emerald Low Volatility Canadian Equity PFT 8457
Nov-09 -2.56 8.01 3.74 94 7.04 96 8.00 67 5.55 60 8.00 80 11.35 25 11.21 13Triasima Canadian All Capitalization Equity 1892
RBC INVESTOR & TREASURY SERVICES | POOLED FUND SURVEY | PER IOD ENDING SEPTEMBER 30, 2018 PAGE 10 OF 59

Period ending September 30, 2018 Four year periods ending September 30
Canadian Equity
Fund nameInceptiondate
1 quarter
ROR-% PR
1 year 2 years 3 years 5 years 10 years 2018 2017 2016 2015
ROR-% PR ROR-% PR ROR-% PR ROR-% PR ROR-% PR ROR-% PR ROR-% PR ROR-% PR ROR-% PR
Jan-16 -2.01 7.81Triasima Canadian Equity Fund 2086
Jun-07 -3.31 6.07 2.66 96 11.32 22 7.57 79 10.53 6.255 45 7.94 80 13.46 7 10.43 30Triasima Canadian Small Capitalization Equity 5296
Jun-03 -2.71 -0.06 7.08 66 10.23 42 4.91 98 6.47 1.6978 99 6.19 98 6.25 98 5.19 96Wise Capital Management All Cap Canadian Equity Fund 9693
Fund Count 125 125 123 119 117 83 119 108 113 101
Average Return -0.26 6.27 7.58 10.19 8.67 7.77 5.88 9.35 10.31 9.13
5th Percentile 2.16 10.79 10.87 13.29 11.02 10.53 8.88 11.90 14.29 11.91
1st Quartile 0.59 7.66 9.27 11.07 9.56 8.57 6.72 10.33 11.37 10.70
Median -0.25 6.32 7.78 9.94 8.96 7.69 6.05 9.42 10.42 9.49
3rd Quartile -0.97 4.66 6.55 8.87 7.73 6.54 4.84 8.16 8.68 7.65
95th Percentile -3.04 0.83 3.21 7.11 5.93 6.06 2.87 6.93 7.27 5.35
RBC INVESTOR & TREASURY SERVICES | POOLED FUND SURVEY | PER IOD ENDING SEPTEMBER 30, 2018 PAGE 11 OF 59

Period ending September 30, 2018 Four year periods ending September 30
Canadian Equity (Core)
Fund nameInceptiondate
1 quarter
ROR-% PR
1 year 2 years 3 years 5 years 10 years 2018 2017 2016 2015
ROR-% PR ROR-% PR ROR-% PR ROR-% PR ROR-% PR ROR-% PR ROR-% PR ROR-% PR ROR-% PR
Oct-06 -0.89 5.37 6.86 77 10.13 28 9.45 24 6.44 6.7384 19 10.49 23 10.70 24 9.12 50Addenda Canadian Equity Pooled Fund 7368
Sep-97 -0.66 6.36 8.32 38 9.25 62 7.40 80 6.87 4.8954 77 7.66 86 7.11 95 7.06 90BlackRock Active Canadian Equity Fund 5459
Oct-11 -0.56 7.72 7.91 56 8.89 72 7.55 77 4.85 80 7.51 91 7.89 86BlackRock Canada Alpha Advantage 1845
Jul-10 -0.78 5.57 8.02 48 9.57 48 8.97 57 6.02 62 9.84 34 9.25 67 8.83 66BMO AM Canadian Core Alpha Fund 6464
Dec-01 -1.46 8.40 8.51 29 10.64 10 9.35 29 8.25 6.638 33 9.59 45 10.53 33 9.80 36CC&L Q Canadian Equity Core Fund 476
Dec-00 -1.40 2.46 5.26 94 7.09 96 6.65 86 7.21 3.4346 95 7.73 82 9.43 53 9.75 40Cidel Canadian Equity Fund 9474
Dec-98 0.50 2.71 7.09 71 10.15 24 9.13 39 9.25 6.711 23 10.80 14 12.14 5 11.47 6Cidel Canadian Total Return Equity Pooled Fund 919
Jul-02 -0.32 5.25 7.29 67 8.77 81 9.60 15 7.93 6.7815 15 10.71 18 11.33 10 10.53 26Fidelity Canadian Core Equity Institutional Trust 7622
Mar-11 -0.44 7.55 7.96 52 9.24 66 10.86 4 7.37 10 11.70 4 14.83 1 14.45 1Fidelity Canadian Focused Equity Institutional Trust 2736
Nov-97 1.00 8.48 8.06 44 9.84 43 9.07 47 6.85 6.1960 56 9.21 63 9.63 48 8.96 60Fiera Capital Canadian Equity - Core Fund 15
Jul-09 2.02 6.00 8.45 33 10.37 19 9.11 42 6.51 38 9.91 32 10.82 20 10.49 30Heward Canadian Dividend Growth Fund 591
Sep-06 -2.40 -1.40 1.32 100 7.05 100 6.19 95 6.57 4.0470 90 8.18 77 7.57 90 5.10 95Hexavest Canadian Equity Fund 100100
Jan-10 -2.03 6.62 7.55 62 9.99 38 9.52 19 6.65 29 10.25 27 12.28 5 10.98 14Hillsdale Canadian Core Equity Fund 5086
Oct-97 -0.23 7.09 10.10 1 12.07 1 10.27 9 7.42 7.9430 5 11.08 9 10.57 29 9.07 55HSBC Canadian Equity Pooled Fund 4514
Dec-10 -2.38 3.68 6.13 86 10.96 5 5.67 100 2.67 100 6.17 100 6.33 100 3.93 100Louisbourg Canadian Equity Fund 8296
Dec-10 -2.23 3.27 5.83 90 10.44 15 6.61 90 4.10 86 7.46 94 8.88 76 7.94 85Louisbourg Dividend Fund 8691
Dec-11 -0.32 7.36 9.33 10 10.05 34 10.94 1 8.58 1 11.85 1 11.28 14Manulife AM Canadian Core Equity Pooled Fund 3220
May-05 -0.35 7.31 9.39 6 9.45 56 8.93 66 6.32 6.22100 53 9.33 55 9.33 58 8.84 65Manulife Asset Management Canadian Equity Fund 3628
RBC INVESTOR & TREASURY SERVICES | POOLED FUND SURVEY | PER IOD ENDING SEPTEMBER 30, 2018 PAGE 12 OF 59
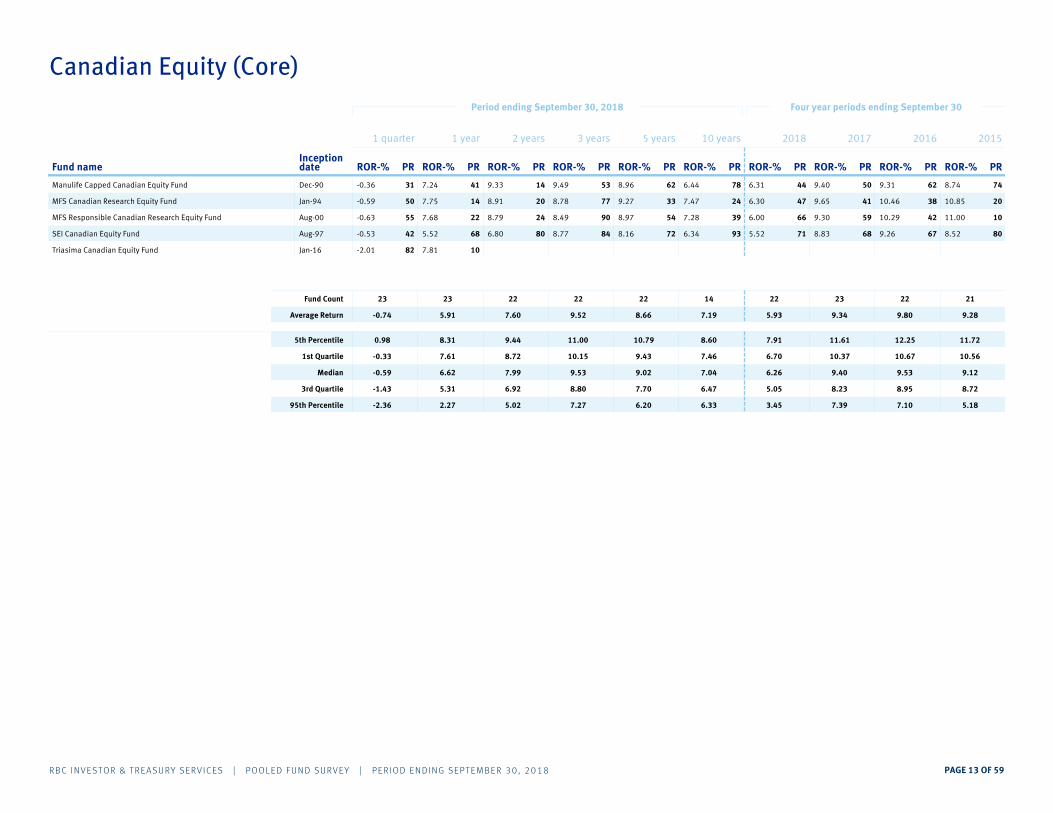
Period ending September 30, 2018 Four year periods ending September 30
Canadian Equity (Core)
Fund nameInceptiondate
1 quarter
ROR-% PR
1 year 2 years 3 years 5 years 10 years 2018 2017 2016 2015
ROR-% PR ROR-% PR ROR-% PR ROR-% PR ROR-% PR ROR-% PR ROR-% PR ROR-% PR ROR-% PR
Dec-90 -0.36 7.24 9.33 14 9.49 53 8.96 62 6.44 6.3178 44 9.40 50 9.31 62 8.74 74Manulife Capped Canadian Equity Fund 4131
Jan-94 -0.59 7.75 8.91 20 8.78 77 9.27 33 7.47 6.3024 47 9.65 41 10.46 38 10.85 20MFS Canadian Research Equity Fund 1450
Aug-00 -0.63 7.68 8.79 24 8.49 90 8.97 54 7.28 6.0039 66 9.30 59 10.29 42 11.00 10MFS Responsible Canadian Research Equity Fund 2255
Aug-97 -0.53 5.52 6.80 80 8.77 84 8.16 72 6.34 5.5293 71 8.83 68 9.26 67 8.52 80SEI Canadian Equity Fund 6842
Jan-16 -2.01 7.81Triasima Canadian Equity Fund 1082
Fund Count 23 23 22 22 22 14 22 23 22 21
Average Return -0.74 5.91 7.60 9.52 8.66 7.19 5.93 9.34 9.80 9.28
5th Percentile 0.98 8.31 9.44 11.00 10.79 8.60 7.91 11.61 12.25 11.72
1st Quartile -0.33 7.61 8.72 10.15 9.43 7.46 6.70 10.37 10.67 10.56
Median -0.59 6.62 7.99 9.53 9.02 7.04 6.26 9.40 9.53 9.12
3rd Quartile -1.43 5.31 6.92 8.80 7.70 6.47 5.05 8.23 8.95 8.72
95th Percentile -2.36 2.27 5.02 7.27 6.20 6.33 3.45 7.39 7.10 5.18
RBC INVESTOR & TREASURY SERVICES | POOLED FUND SURVEY | PER IOD ENDING SEPTEMBER 30, 2018 PAGE 13 OF 59

Period ending September 30, 2018 Four year periods ending September 30
Canadian Equity (Growth)
Fund nameInceptiondate
1 quarter
ROR-% PR
1 year 2 years 3 years 5 years 10 years 2018 2017 2016 2015
ROR-% PR ROR-% PR ROR-% PR ROR-% PR ROR-% PR ROR-% PR ROR-% PR ROR-% PR ROR-% PR
Dec-00 -2.11 10.49 9.13 30 10.90 10 10.13 20 8.85 7.3910 10 10.05 30 12.40 8 11.61 1CC&L Q Canadian Equity Growth Fund 1100
Mar-96 -0.99 4.62 6.50 90 6.27 100 6.95 100 5.10 3.84100 100 7.54 90 8.24 100 9.04 83Greystone Canadian Equity Fund 10082
Jul-86 -0.44 7.09 6.27 100 9.33 60 7.35 90 7.95 4.3330 90 7.42 100 9.94 84 7.51 100Guardian Canadian Growth Fund 9064
Jan-70 1.56 9.88 9.03 40 10.38 40 10.17 10 7.88 6.8940 30 10.24 20 11.49 31 10.46 34GWL Canadian Equity Fund 2 1826
Jan-87 1.59 9.95 9.15 20 10.37 50 10.02 30 7.88 6.5850 40 10.03 40 11.09 46 10.20 50GWL Canadian Equity Fund 3 1019
Dec-00 1.74 9.63 9.03 50 10.43 30 9.58 50 7.69 6.1360 70 9.57 70 10.56 61 9.84 66GWL Ethics Fund 9.02G 3610
Nov-97 2.91 9.70 6.52 80 11.72 1 10.35 1 10.90 8.031 1 10.51 1 13.42 1 10.23 42GWL Mid Cap Canada Fund (G) 281
Oct-01 0.46 7.72 9.49 1 10.86 20 9.88 40 8.68 7.0220 20 10.43 10 10.42 76 9.73 74Industrial Alliance Canadian Equity Growth 5537
Aug-06 -0.05 7.70 7.61 60 7.92 90 9.35 70 6.89 6.3370 60 9.76 60 11.22 39 11.10 9Manulife AM Canadian Large Cap Growth Pooled 6454
Jan-81 -0.68 7.49 9.34 10 8.59 80 9.42 60 6.46 6.4390 50 9.91 50 10.57 54 10.90 17MFS Canadian Equity Fund 8273
Aug-97 -0.01 7.68 7.40 70 9.29 70 7.60 80 6.52 4.6580 80 7.58 80 8.66 93 7.94 92PCJ Canadian Equity Fund 7246
Jan-16 -2.01 7.81Triasima Canadian Equity Fund 4692
Fund Count 12 12 11 11 11 11 11 11 14 13
Average Return 0.16 8.31 8.13 9.64 9.16 7.71 6.15 9.37 10.92 9.94
5th Percentile 2.26 10.19 9.42 11.31 10.26 9.87 7.71 10.47 12.76 11.30
1st Quartile 1.57 9.75 9.14 10.65 10.07 8.31 6.96 10.14 11.85 10.79
Median -0.03 7.76 9.03 10.37 9.58 7.88 6.43 9.91 10.83 10.20
3rd Quartile -0.76 7.63 6.96 8.94 8.47 6.70 5.39 8.58 10.44 9.70
95th Percentile -2.05 5.98 6.39 7.10 7.15 5.78 4.09 7.48 8.51 7.77
RBC INVESTOR & TREASURY SERVICES | POOLED FUND SURVEY | PER IOD ENDING SEPTEMBER 30, 2018 PAGE 14 OF 59

Period ending September 30, 2018 Four year periods ending September 30
Canadian Equity (Value)
Fund nameInceptiondate
1 quarter
ROR-% PR
1 year 2 years 3 years 5 years 10 years 2018 2017 2016 2015
ROR-% PR ROR-% PR ROR-% PR ROR-% PR ROR-% PR ROR-% PR ROR-% PR ROR-% PR ROR-% PR
Jan-91 0.38 7.40 9.86 31 11.51 33 10.12 1 9.58 7.131 1 10.81 1 12.84 1 12.11 1Beutel Goodman Canadian Equity Fund 1320
Feb-95 -0.14 8.08 10.55 7 11.23 40 9.21 20 8.76 5.9215 27 9.49 20 11.13 12 11.35 10BonaVista Canadian Equity Fund 163
Mar-12 1.09 3.35 5.56 93 9.20 86 6.11 93 2.79 93 6.81 93 9.53 42Burgundy Canadian Large Cap Equity Fund 816
May-99 1.30 5.46 8.35 50 10.56 54 7.07 72 9.19 4.428 67 7.47 80 9.14 47 9.77 30Burgundy Focus Canadian Equity Fund 561
Jul-99 0.23 3.84 7.01 74 10.06 73 7.11 68 6.75 4.2970 80 7.94 70 7.80 84 7.17 70CIBC Canadian Equity All Cap Value Pool 7038
Jan-93 -1.38 7.36 11.28 1 13.24 6 8.46 33 8.44 5.8724 33 8.73 52 10.23 36 9.37 35Foyston, Gordon and Payne Canadian Equity 1887
Aug-16 -0.10 3.83 6.63 81Guardian Canadian Equity Select Fund 7456
Dec-69 0.32 7.76 8.16 56 9.74 80 7.73 54 6.03 5.32100 52 7.72 74 8.06 74 7.24 66Industrial Alliance Canadian Equity Value 630
May-94 0.34 6.97 10.24 19 13.27 1 9.27 14 8.41 5.6530 40 9.85 13 11.11 14 10.27 20Leith Wheeler Canadian Equity Fund 3025
Jan-94 -1.11 3.07 5.82 88 7.14 100 8.01 47 7.69 4.8254 60 9.28 33 10.31 32 10.72 15MFS Low Volatility Canadian Equity Fund 8782
Jan-97 0.17 4.51 7.61 63 10.30 60 6.45 87 6.20 3.6792 87 6.94 87 5.62 96 4.30 90Optimum Canadian Equity 6343
Dec-09 -0.16 6.98 8.73 44 11.21 46 9.46 7 6.52 12 10.09 7 10.51 26 10.02 25PH&N Canadian Equity Value Fund 2668
Dec-06 -1.91 1.18 4.67 100 7.57 94 6.71 80 8.03 4.3039 74 8.14 60 11.95 5 11.46 6QV Investors Canadian Equity Fund 9494
Jan-92 0.00 5.80 10.50 12 12.59 20 8.22 40 6.34 5.9685 20 8.83 47 7.30 89 6.39 80Scheer Rowlett Canadian Equity Fund 5050
Dec-07 -0.26 5.94 9.37 37 11.65 28 7.68 60 7.78 5.3746 48 8.12 66 8.24 68 7.63 60Sionna Canadian All Cap Pooled Fund 4474
Jun-03 0.82 6.80 10.07 25 12.96 13 8.65 27 7.53 6.5661 8 9.11 40 8.62 53 7.01 74Sionna Canadian Equity Pooled Fund 3712
Jun-03 -2.71 -0.06 7.08 70 10.23 66 4.91 100 6.47 1.6977 100 6.19 100 6.25 93 5.19 85Wise Capital Management All Cap Canadian Equity Fund 100100
Fund Count 17 17 17 16 16 14 16 16 20 21
Average Return -0.18 5.19 8.32 10.78 7.82 7.66 5.02 8.56 9.15 8.03
5th Percentile 1.13 7.82 10.69 13.25 9.63 9.33 6.70 10.27 12.00 11.51
1st Quartile 0.34 7.01 10.06 11.89 8.79 8.43 5.93 9.46 10.51 10.02
Median 0.00 5.80 8.35 10.88 7.87 7.74 5.34 8.78 8.88 7.81
3rd Quartile -0.32 3.79 6.99 9.98 6.98 6.54 4.30 7.66 8.02 6.97
95th Percentile -2.07 0.93 5.38 7.46 5.81 6.14 2.52 6.66 5.71 3.87
RBC INVESTOR & TREASURY SERVICES | POOLED FUND SURVEY | PER IOD ENDING SEPTEMBER 30, 2018 PAGE 15 OF 59
Period ending September 30, 2018 Four year periods ending September 30
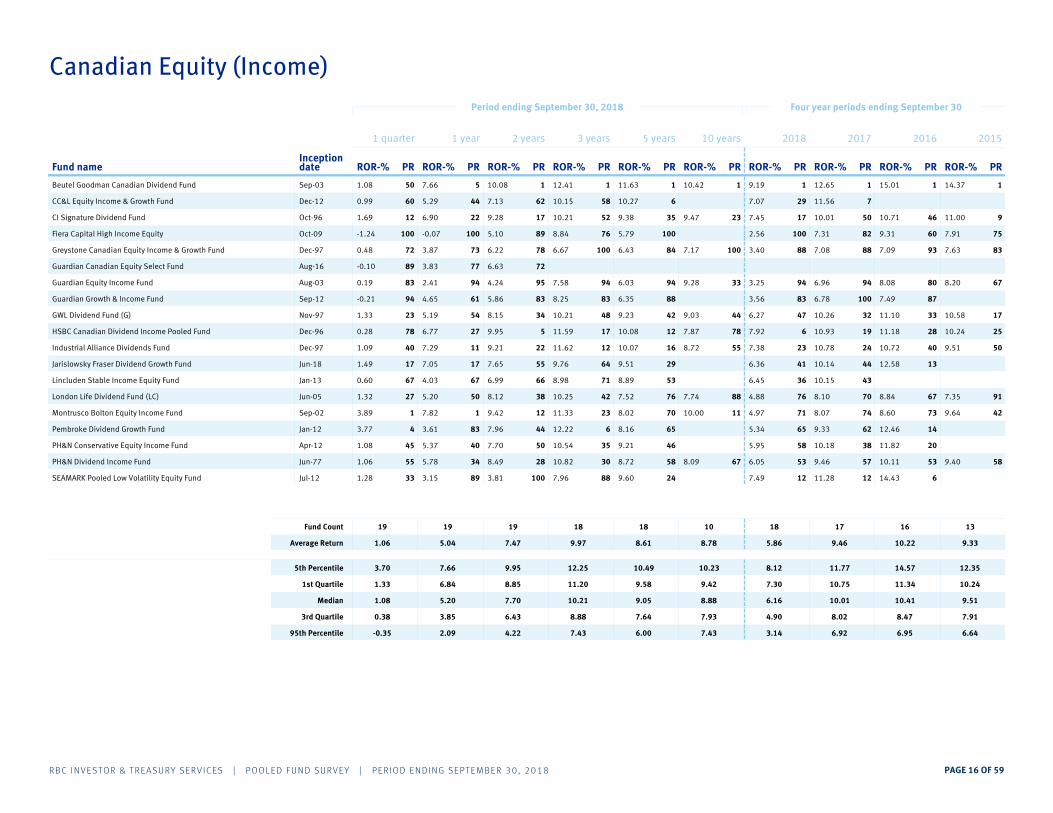
Canadian Equity (Income)
Fund nameInceptiondate
1 quarter
ROR-% PR
1 year 2 years 3 years 5 years 10 years 2018 2017 2016 2015
ROR-% PR ROR-% PR ROR-% PR ROR-% PR ROR-% PR ROR-% PR ROR-% PR ROR-% PR ROR-% PR
Sep-03 1.08 7.66 10.08 1 12.41 1 11.63 1 10.42 9.191 1 12.65 1 15.01 1 14.37 1Beutel Goodman Canadian Dividend Fund 550
Dec-12 0.99 5.29 7.13 62 10.15 58 10.27 6 7.07 29 11.56 7CC&L Equity Income & Growth Fund 4460
Oct-96 1.69 6.90 9.28 17 10.21 52 9.38 35 9.47 7.4523 17 10.01 50 10.71 46 11.00 9CI Signature Dividend Fund 2212
Oct-09 -1.24 -0.07 5.10 89 8.84 76 5.79 100 2.56 100 7.31 82 9.31 60 7.91 75Fiera Capital High Income Equity 100100
Dec-97 0.48 3.87 6.22 78 6.67 100 6.43 84 7.17 3.40100 88 7.08 88 7.09 93 7.63 83Greystone Canadian Equity Income & Growth Fund 7372
Aug-16 -0.10 3.83 6.63 72Guardian Canadian Equity Select Fund 7789
Aug-03 0.19 2.41 4.24 95 7.58 94 6.03 94 9.28 3.2533 94 6.96 94 8.08 80 8.20 67Guardian Equity Income Fund 9483
Sep-12 -0.21 4.65 5.86 83 8.25 83 6.35 88 3.56 83 6.78 100 7.49 87Guardian Growth & Income Fund 6194
Nov-97 1.33 5.19 8.15 34 10.21 48 9.23 42 9.03 6.2744 47 10.26 32 11.10 33 10.58 17GWL Dividend Fund (G) 5423
Dec-96 0.28 6.77 9.95 5 11.59 17 10.08 12 7.87 7.9278 6 10.93 19 11.18 28 10.24 25HSBC Canadian Dividend Income Pooled Fund 2778
Dec-97 1.09 7.29 9.21 22 11.62 12 10.07 16 8.72 7.3855 23 10.78 24 10.72 40 9.51 50Industrial Alliance Dividends Fund 1140
Jun-18 1.49 7.05 7.65 55 9.76 64 9.51 29 6.36 41 10.14 44 12.58 13Jarislowsky Fraser Dividend Growth Fund 1717
Jan-13 0.60 4.03 6.99 66 8.98 71 8.89 53 6.45 36 10.15 43Lincluden Stable Income Equity Fund 6767
Jun-05 1.32 5.20 8.12 38 10.25 42 7.52 76 7.74 4.8888 76 8.10 70 8.84 67 7.35 91London Life Dividend Fund (LC) 5027
Sep-02 3.89 7.82 9.42 12 11.33 23 8.02 70 10.00 4.9711 71 8.07 74 8.60 73 9.64 42Montrusco Bolton Equity Income Fund 11
Jan-12 3.77 3.61 7.96 44 12.22 6 8.16 65 5.34 65 9.33 62 12.46 14Pembroke Dividend Growth Fund 834
Apr-12 1.08 5.37 7.70 50 10.54 35 9.21 46 5.95 58 10.18 38 11.82 20PH&N Conservative Equity Income Fund 4045
Jun-77 1.06 5.78 8.49 28 10.82 30 8.72 58 8.09 6.0567 53 9.46 57 10.11 53 9.40 58PH&N Dividend Income Fund 3455
Jul-12 1.28 3.15 3.81 100 7.96 88 9.60 24 7.49 12 11.28 12 14.43 6SEAMARK Pooled Low Volatility Equity Fund 8933
Fund Count 19 19 19 18 18 10 18 17 16 13
Average Return 1.06 5.04 7.47 9.97 8.61 8.78 5.86 9.46 10.22 9.33
5th Percentile 3.70 7.66 9.95 12.25 10.49 10.23 8.12 11.77 14.57 12.35
1st Quartile 1.33 6.84 8.85 11.20 9.58 9.42 7.30 10.75 11.34 10.24
Median 1.08 5.20 7.70 10.21 9.05 8.88 6.16 10.01 10.41 9.51
3rd Quartile 0.38 3.85 6.43 8.88 7.64 7.93 4.90 8.02 8.47 7.91
95th Percentile -0.35 2.09 4.22 7.43 6.00 7.43 3.14 6.92 6.95 6.64
RBC INVESTOR & TREASURY SERVICES | POOLED FUND SURVEY | PER IOD ENDING SEPTEMBER 30, 2018 PAGE 16 OF 59

Period ending September 30, 2018 Four year periods ending September 30
Canadian Equity (GARP)
Fund nameInceptiondate
1 quarter
ROR-% PR
1 year 2 years 3 years 5 years 10 years 2018 2017 2016 2015
ROR-% PR ROR-% PR ROR-% PR ROR-% PR ROR-% PR ROR-% PR ROR-% PR ROR-% PR ROR-% PR
Aug-92 -1.49 4.37 7.88 53 9.74 50 8.85 54 6.45 31 10.00 41 10.93 54 9.66 65BMO AM Canadian Equity Fund 8084
Nov-91 -1.49 5.91 5.78 84 8.59 82 9.20 40 8.05 5.4925 63 10.04 40 12.34 24 11.72 14CC&L Canadian Equity Fund 5480
Dec-11 -0.36 4.36 4.64 90 7.95 93 9.92 20 6.33 43 11.35 14 16.89 1CI Cambridge All Canadian Equity Fund 8458
Jul-16 -0.78 2.81 3.99 94CI Cambridge Canadian Institutional Equity Fund 9068
Oct-14 0.64 5.53 6.61 74 9.05 75 3.04 94Dixon Mitchell Canadian Equity Fund 6326
Jan-94 -4.05 6.32 10.62 16 11.69 18 7.71 87 8.23 5.0010 75 8.06 86 10.12 70 10.61 36Fiera Capital Canadian Equity - Opportunities Fund 47100
Feb-04 -3.52 6.78 10.24 22 11.78 14 7.53 92 8.22 4.8216 81 7.72 93 10.19 65 10.47 42Fiera Capital Canadian Equity ESG - Opportunities Fund 3190
May-16 0.67 2.73 7.26 63Franklin Bissett Canadian Dividend Fund 9422
Sep-12 2.91 14.15 12.19 4 13.15 1 11.74 1 8.02 7 11.14 20 12.75 18Galibier Canadian Equity Pool 11
Feb-06 -0.20 6.58 8.64 37 10.48 26 8.68 60 6.96 6.3582 38 9.22 66 9.21 89 8.57 86GEM Canadian Equity Pool 3748
Sep-07 0.76 10.73 12.26 1 12.82 6 9.24 28 6.99 6.6175 20 8.87 73 9.93 78 8.96 78Gryphon Canadian Equity Fund 616
Mar-69 0.19 7.28 8.27 42 10.30 37 9.15 46 7.55 6.5142 25 9.63 48 10.00 76 9.86 58Guardian Canadian Equity Fund 2238
Dec-15 -0.22 10.24 10.83 11Guardian Canadian Focused Equity Fund 1552
Oct-98 -1.03 5.30 7.01 68 9.42 68 10.75 13 7.23 7.7458 12 12.15 7 13.25 12 11.73 8Highstreet Canadian Equity Fund 6873
Apr-97 0.19 5.89 7.59 58 9.67 56 9.21 34 7.87 6.2333 50 10.05 34 12.01 30 11.32 21Jarislowsky Fraser Canadian Equity Fund 5742
Jan-80 0.30 6.44 8.10 47 8.37 87 8.66 66 5.91 5.7692 56 9.23 60 8.91 94 8.98 72London Life Canadian Equity Fund (LC) 4232
Feb-99 1.77 6.90 9.30 32 10.15 43 11.63 6 10.93 8.771 1 12.85 1 15.20 6 16.01 1Mawer Canadian Equity Pooled Fund 2710
Jan-86 2.55 10.48 10.11 26 10.40 31 7.99 80 7.36 4.1950 87 7.37 100 7.50 100 7.23 100Montrusco Bolton Canadian Equity Fund 115
Jun-71 -0.54 4.75 6.38 79 9.47 63 8.61 72 7.03 5.2568 69 9.59 52 11.09 48 10.09 50PH&N Canadian Equity Fund 7463
Jul-97 -3.80 -1.52 2.61 100 6.47 100 6.17 100 5.50 2.69100 100 8.18 80 9.76 82 7.77 93SEAMARK Canadian Equity Pooled Fund 10095
Fund Count 20 20 20 17 16 13 17 16 18 15
Average Return -0.37 6.30 8.02 9.97 9.06 7.52 5.84 9.74 11.37 10.27
5th Percentile 2.54 11.12 12.10 12.89 11.66 9.31 8.17 12.33 15.45 13.02
1st Quartile 0.65 6.99 10.15 10.57 9.41 8.05 6.51 10.59 12.26 11.12
Median -0.21 6.12 7.99 9.74 9.00 7.36 6.23 9.61 11.07 10.09
3rd Quartile -1.14 4.65 6.55 9.04 8.45 6.99 5.01 8.70 10.03 8.97
95th Percentile -3.81 2.23 3.87 7.66 7.19 5.75 2.97 7.64 8.69 7.61
RBC INVESTOR & TREASURY SERVICES | POOLED FUND SURVEY | PER IOD ENDING SEPTEMBER 30, 2018 PAGE 17 OF 59

Period ending September 30, 2018 Four year periods ending September 30
Canadian Equity (Quantitative)
Fund nameInceptiondate
1 quarter
ROR-% PR
1 year 2 years 3 years 5 years 10 years 2018 2017 2016 2015
ROR-% PR ROR-% PR ROR-% PR ROR-% PR ROR-% PR ROR-% PR ROR-% PR ROR-% PR ROR-% PR
Jun-11 -0.82 3.13 6.56 50 9.30 37 10.17 26 7.32 25 12.01 30 12.31 44 11.23 60BMO AM Canadian Smart Alpha Equity Fund (formerly Liability Sensitive Equity Fund) 8824
May-07 -0.70 6.45 8.91 13 11.78 13 11.63 1 10.12 8.621 13 12.97 10 14.97 12 13.58 1CC&L Q Equity Extension Fund 5013
Oct-11 -2.25 21.06 9.84 1 16.74 1 11.07 12 10.30 1 8.70 60 13.43 22Louisbourg Quantitative Canadian Equity Fund 175
Feb-96 -2.67 9.21 -2.92 100 8.42 62 4.14 88 5.86 3.72100 88 2.92 90 10.50 76 6.51 100Montrusco Bolton Quantitative Canadian Equity Fund 1387
Nov-11 -1.86 6.65 8.71 24 9.51 26 8.75 62 6.01 62 9.29 50 10.51 68RBC QUBE 120/20 Canadian Equity Fund 2663
Nov-11 -1.48 6.46 7.78 37 8.61 50 8.11 74 4.89 75 8.53 70 9.34 88RBC QUBE Canadian Equity Fund 3850
Nov-11 -1.39 2.66 5.25 74 7.82 76 10.02 37 6.77 38 11.94 30 12.42 34RBC QUBE Low Volatility Canadian Equity Fund 10038
Nov-11 -3.23 3.90 3.68 87 1.67 100 2.74 100 2.94 100 2.45 100 4.48 100RBC QUBE Market Neutral Canadian Equity Fund 64100
Sep-09 -0.42 3.64 5.61 63 7.65 86 9.17 50 6.67 50 10.60 40 11.55 55 12.09 40TD Emerald Low Volatility Canadian Equity PFT 751
Fund Count 9 9 9 9 9 2 9 11 10 6
Average Return -1.65 7.02 5.94 9.05 8.42 7.99 6.36 9.44 12.25 11.30
5th Percentile -0.53 16.32 9.47 14.76 11.41 9.91 9.63 15.25 19.36 13.49
1st Quartile -0.84 6.75 8.68 9.60 10.20 9.06 7.35 12.01 13.17 12.95
Median -1.48 6.45 6.56 8.61 9.17 7.99 6.67 9.29 11.93 11.66
3rd Quartile -2.25 3.63 5.20 7.84 7.98 6.93 4.89 7.66 10.50 11.16
95th Percentile -3.00 2.85 -0.28 4.06 3.30 6.08 3.25 2.68 6.67 7.67
RBC INVESTOR & TREASURY SERVICES | POOLED FUND SURVEY | PER IOD ENDING SEPTEMBER 30, 2018 PAGE 18 OF 59

Period ending September 30, 2018 Four year periods ending September 30
Diversified Canadian Equity
Fund nameInceptiondate
1 quarter
ROR-% PR
1 year 2 years 3 years 5 years 10 years 2018 2017 2016 2015
ROR-% PR ROR-% PR ROR-% PR ROR-% PR ROR-% PR ROR-% PR ROR-% PR ROR-% PR ROR-% PR
May-98 0.61 9.83 14.47 1 13.73 1 12.04 1 10.22 9.791 1 12.60 1 11.76 50 12.35 34CI Signature Canadian Equity Plus Fund 140
Dec-96 0.28 8.21 8.14 60 9.01 80 10.05 40 7.26 7.6180 40 10.51 60 11.88 34 12.19 50Integra Equity Fund 4060
Jan-90 -1.54 4.48 5.72 100 7.34 100 9.36 60 8.80 6.6020 60 10.62 40 14.68 1 15.44 1Invesco (Growth) 100100
Sep-81 4.36 8.00 10.50 20 10.40 40 3.51 100 6.59 0.84100 100 2.42 100 4.28 100 5.60 100Invesco (Trimark Canadian Fund) 601
Aug-97 0.16 9.57 10.11 40 9.62 60 10.66 20 8.22 8.1340 20 10.93 20 12.38 17 13.09 17MFS Canadian Equity Plus Fund 2080
Nov-66 0.66 6.30 7.87 80 10.73 20 9.21 80 7.36 6.2160 80 9.96 80 11.47 66 10.90 82PH&N Canadian Equity Plus Pension Trust 8020
Fund Count 6 6 6 6 6 6 6 6 7 7
Average Return 0.75 7.73 9.47 10.14 9.14 8.08 6.53 9.51 11.03 11.51
5th Percentile 3.43 9.76 13.48 12.98 11.70 9.86 9.37 12.19 13.99 14.73
1st Quartile 0.65 9.23 10.41 10.64 10.50 8.65 8.00 10.85 12.13 12.72
Median 0.45 8.10 9.12 10.01 9.71 7.79 7.10 10.57 11.76 12.19
3rd Quartile 0.19 6.72 7.94 9.16 9.25 7.28 6.30 10.10 11.10 10.95
95th Percentile -1.11 4.93 6.26 7.76 4.94 6.76 2.18 4.30 6.22 7.19
The Diversified Canadian Equity mandate contains funds having a clearly defined Canadian bias. However, these funds tend to be more flexible than traditional Canadian Equity funds in terms of their ability to allocate strategy towards US and/or international holdings.
RBC INVESTOR & TREASURY SERVICES | POOLED FUND SURVEY | PER IOD ENDING SEPTEMBER 30, 2018 PAGE 19 OF 59

Period ending September 30, 2018 Four year periods ending September 30
Canadian Small Cap
Fund nameInceptiondate
1 quarter
ROR-% PR
1 year 2 years 3 years 5 years 10 years 2018 2017 2016 2015
ROR-% PR ROR-% PR ROR-% PR ROR-% PR ROR-% PR ROR-% PR ROR-% PR ROR-% PR ROR-% PR
Feb-95 1.55 0.61 5.99 38 11.94 28 10.29 13 12.17 7.0110 16 12.85 8 12.85 34 8.79 62Beutel Goodman Small Cap Fund 7330
Jan-95 1.73 7.62 5.69 42 7.98 72 9.61 25 13.46 4.215 36 10.12 21 15.94 6 17.48 6BMO AM Small Cap Fund 3123
Apr-05 -3.57 2.15 -0.27 81 6.76 80 6.57 62 11.68 1.9820 72 7.71 60 14.68 24 13.10 21CC&L Canadian Small Cap Fund 6984
Apr-96 -3.43 -1.68 -1.35 92 6.62 84 5.57 70 8.81 2.1780 68 7.47 63 10.08 62 6.20 79CIBC Canadian Equity Small Cap Pool 8481
Dec-86 -1.80 -3.00 -0.57 84 5.25 100 4.46 79 8.39 0.3385 84 6.41 78 10.05 66 10.50 38Cidel Canadian Opportunities Pooled Fund 8861
Apr-11 5.49 15.03 11.13 1 13.12 16 9.82 20 7.68 8 8.55 38 11.97 45 13.03 22Dixon Mitchell Small Cap Fund 14
Dec-88 1.52 13.66 2.70 58 8.66 60 9.09 29 10.67 3.9836 40 7.97 48 14.91 19 11.65 32Fiera Capital Canadian Equity - Small Cap Core Fund 434
Jun-88 1.55 3.92 0.44 77 7.32 76 7.62 46 11.33 2.5230 60 8.57 36 15.26 14 12.42 26Fiera Capital Canadian Equity Small Cap Fund 6228
Feb-02 0.79 5.25 9.61 8 10.87 40 6.88 55 9.37 3.7550 48 7.29 66 9.01 76 10.13 48Foyston Gordon & Payne Small Cap Canadian Equity Fund 5438
Jan-92 -5.43 -6.60 1.02 72 6.49 92 1.99 100 9.04 -1.5170 100 4.26 88 8.85 80 10.17 45Franklin Bissett Small Cap Fund 10096
Jan-07 -3.83 -6.47 -1.00 89 8.96 56 4.07 83 7.70 1.2890 76 6.88 74 11.08 52 5.83 84Greystone Canadian Equity Small Cap Fund 9688
Feb-97 -2.16 3.17 1.90 65 6.58 88 3.09 91 7.20 0.5595 80 3.07 95 4.28 96 5.53 89Guardian Canadian Sml/Mid Cap Fund 6565
Mar-09 -3.32 8.96 9.30 11 23.87 1 16.97 1 15.41 1 19.06 1 21.48 1 10.65 36Hillsdale Canadian Micro Cap Equity Fund 1976
Jan-96 -2.81 8.46 6.63 28 16.02 4 11.38 8 9.01 9.3174 4 12.13 13 14.61 28 10.10 52Hillsdale Canadian Small Cap Equity Fund 2469
May-98 4.88 9.59 3.37 53 5.93 96 2.20 96 9.15 -1.4660 96 0.43 100 7.30 86 9.02 58Invesco (Trimark Canadian Small Cap) 127
Apr-00 -4.69 -0.55 -4.36 100 13.20 12 3.22 88 6.19 0.28100 88 4.19 90 3.35 100 -11.11 100J Zechner Associates Inc. Special Equity Fund 7792
Aug-16 -0.21 8.33 10.51 4Jarislowsky, Fraser Small/Mid Cap Equity Fund 2643
Dec-13 -1.01 -0.98 1.05 70 9.74 48 -0.01 92Lincluden Canadian Small Mid Cap Equity Pooled Fund 8150
Oct-11 -8.70 -6.13 -2.63 96 9.32 52 4.90 75 2.28 64 7.85 56 11.72 48Louisbourg Canadian Small Cap Fund 93100
Jan-88 7.05 12.14 7.91 22 11.58 32 12.97 4 16.05 7.441 12 13.18 6 21.04 1 21.66 1Mawer New Canada Fund 81
Dec-84 2.27 9.15 6.07 35 12.22 24 5.76 67 9.67 3.7945 44 4.93 83 6.37 90 3.99 94Montrusco Bolton Canadian Small Cap Equity Fund 1612
Aug-00 -1.48 4.86 3.47 50 13.38 8 7.91 38 9.34 4.6654 32 8.69 28 12.20 42 6.53 70PCJ Canadian Small Capitalization Fund 5754
Feb-07 -0.64 5.84 6.31 31 8.25 68 7.82 41 11.37 3.4526 52 8.33 43 12.28 39 14.20 16Pembroke Canadian Growth Fund 4246
Dec-96 2.00 6.74 8.15 16 12.47 20 9.87 18 12.13 6.4714 20 10.67 18 15.71 9 16.26 10QV Investors Canadian Small Cap Fund 3516
RBC INVESTOR & TREASURY SERVICES | POOLED FUND SURVEY | PER IOD ENDING SEPTEMBER 30, 2018 PAGE 20 OF 59

Period ending September 30, 2018 Four year periods ending September 30
Canadian Small Cap
Fund nameInceptiondate
1 quarter
ROR-% PR
1 year 2 years 3 years 5 years 10 years 2018 2017 2016 2015
ROR-% PR ROR-% PR ROR-% PR ROR-% PR ROR-% PR ROR-% PR ROR-% PR ROR-% PR ROR-% PR
May-01 1.90 5.37 4.14 46 10.68 44 8.01 34 9.09 4.7065 28 8.68 30 10.39 57 6.51 73SEI Canadian Small Company Equity Fund 5019
Jun-13 -1.69 5.47 8.14 18 8.42 64 6.84 58 3.27 56 7.19 69Sionna Canadian Small Cap Pooled Fund 4658
Jun-07 -3.31 6.07 2.66 60 11.32 36 7.57 50 10.53 6.2540 24 7.94 49 13.46 32 10.43 38Triasima Canadian Small Capitalization Equity 3974
Fund Count 27 27 27 26 25 21 26 24 22 20
Average Return -0.64 4.33 3.93 10.27 7.38 10.11 3.84 8.20 11.43 9.45
5th Percentile 5.30 13.21 10.24 15.36 12.70 13.59 8.90 13.35 16.32 17.90
1st Quartile 1.64 8.40 7.27 12.15 9.57 11.40 5.86 9.05 14.66 12.59
Median -1.01 5.37 3.47 9.53 7.57 9.37 3.60 7.93 11.40 10.11
3rd Quartile -3.31 0.03 0.73 7.48 4.93 9.00 1.46 6.76 9.13 6.43
95th Percentile -5.21 -6.37 -2.25 6.07 2.39 7.15 -1.10 3.17 4.48 2.28
RBC INVESTOR & TREASURY SERVICES | POOLED FUND SURVEY | PER IOD ENDING SEPTEMBER 30, 2018 PAGE 21 OF 59

Period ending September 30, 2018 Four year periods ending September 30
Global Equity
Fund nameInceptiondate
1 quarter
ROR-% PR
1 year 2 years 3 years 5 years 10 years 2018 2017 2016 2015
ROR-% PR ROR-% PR ROR-% PR ROR-% PR ROR-% PR ROR-% PR ROR-% PR ROR-% PR ROR-% PR
Jun-08 0.11 7.86 9.61 86 10.18 84 9.68 96 9.04 7.5893 96 10.15 96 12.04 96 13.26 94Aberdeen Canada-Global Equity Fund 8886
Apr-12 3.40 17.24 11.87 64 11.72 60 13.43 64 12.37 54 12.50 86 17.67 58Addenda Global Equity Pooled Fund 1421
Dec-09 1.24 6.29 9.51 88 10.62 82 13.17 70 10.85 81 14.96 36 17.80 48 18.93 50AGF Global Core Equity Pooled 9474
Apr-00 -6.70 6.79 -1.32 100 6.25 100 -1.85 100 1.95 -6.59100 100 -3.89 100 -2.02 100 -7.81 100AGF Global Resources Class 91100
Dec-07 -0.46 6.23 12.26 59 12.62 38 11.21 94 9.75 11.0188 79 12.49 87 13.74 93 15.51 87Beutel Goodman Global Dividend Fund 9490
Jul-95 1.30 7.06 12.75 52 12.50 41 12.50 80 9.82 11.4185 75 13.90 60 15.59 79 16.75 74Beutel Goodman Global Equity Fund 9071
Jul-05 -1.44 3.72 10.80 78 11.77 58 13.30 67 9.91 11.7882 69 15.83 23 17.33 62 18.39 58Beutel Goodman World Focus Equity Fund 10094
May-05 0.91 5.04 12.38 57 15.08 14 14.18 48 13.45 15.1312 16 16.59 10 20.75 12 17.79 64Black Creek Focus Fund 9782
Sep-12 3.95 11.95 11.27 75 11.78 58 12.53 78 11.29 76 12.67 82 14.89 87BMO AM Global Equity Fund 634
Feb-97 0.63 11.01 11.84 65 9.05 89 12.30 83 9.75 9.5388 92 12.63 84 17.75 52 19.29 44Brandes Canada Global Equity Unit Trust 6884
Feb-08 3.63 14.57 9.60 86 10.78 79 15.36 26 12.80 14.0116 26 15.56 32 21.22 7 21.93 10Burgundy Global (ex Canada) Fund 4011
Jul-05 3.82 10.02 7.42 95 8.75 94 13.13 71 10.74 11.0856 78 13.92 59 19.30 23 20.12 34Burgundy Global Focused Opportunities Fund 766
Mar-93 3.10 12.34 9.92 81 11.37 69 13.50 61 12.56 12.0322 62 13.79 65 18.13 42 19.06 48Burgundy Partners Global Fund 6235
Dec-02 2.04 15.89 15.89 20 15.54 10 16.14 12 13.51 14.9312 18 16.20 15 19.12 26 19.89 37Capital Group Global Equity Fund (class I) 2255
Nov-96 3.35 14.40 14.52 30 13.02 31 14.78 37 12.21 12.8526 48 14.87 38 18.98 31 20.77 21CC&L Q Global Equity Fund 4226
Dec-96 3.37 14.27 14.43 31 12.89 33 14.71 40 12.09 12.8129 50 14.82 40 18.93 32 20.71 22CC&L Q Group Global Equity Fund 4424
Nov-04 1.09 5.78 5.64 97 8.62 95 15.08 30 11.78 16.7334 6 17.53 6 22.98 2 19.32 44CC&L Q Market Neutral Fund 9679
Jul-13 3.66 11.06 11.33 74 11.41 67 12.80 75 11.86 66 13.24 73CI Cambridge Global Dividend Fund 6810
Oct-06 2.69 15.84 16.45 14 13.38 28 13.90 53 12.65 12.6518 52 13.42 70 15.44 83 18.03 61CI Signature Global Equity Fund 2442
Dec-98 -5.68 6.72 3.99 98 12.14 51 1.90 99 3.08 -1.5698 99 0.73 99 0.71 99 -4.38 99CI Signature Global Resource Fund 9199
Dec-11 1.00 16.32 15.90 20 12.61 38 15.16 28 13.77 32 14.87 38 17.69 54CIBC Global Equity Growth Pool 1981
Jan-15 1.57 16.42 14.10 35 12.83 35Cidel Global Equity Pooled Fund 1864
Dec-12 3.20 15.85 12.18 60 12.25 47 15.96 15 14.73 21 15.99 19Eterna Global Equity Focus Fund 2330
Jan-10 3.98 13.54 12.28 59 11.32 71 11.88 89 10.44 84 11.46 94 15.62 78 15.59 86FGP Global Equity Fund Class B 504
Feb-15 1.47 15.07 8.96 92 11.55 63Fidelity Global Low Volatility Institutional Trust 3566
May-06 3.25 15.31 13.41 44 11.03 76 14.11 49 10.69 12.1658 60 13.81 64 17.66 58 20.30 30Fidelity Select Global Equity Institutional Trust 3129
Jun-10 2.31 13.23 12.93 48 11.14 74 13.76 56 11.83 67 13.89 60 16.78 70 18.76 53Fidelity Select Global Plus Institutional Trust 5348
Oct-09 4.55 18.82 17.23 7 15.85 6 17.51 3 16.90 6 17.18 8 20.85 10 21.80 12Fiera Capital Global Equity Fund 92
Feb-08 0.07 19.04 18.32 4 15.08 14 15.46 22 11.71 15.0138 17 14.58 47 15.43 83 17.47 69Franklin Global Growth Corporate Class Fund 886
Feb-06 3.32 10.72 9.28 89 8.98 90 12.88 74 8.43 9.9995 89 13.43 70 15.41 84 16.39 79GEM Global Equity Pool 7027
Feb-04 1.12 10.55 13.85 38 11.42 66 13.38 66 11.52 13.3442 39 14.10 57 17.31 62 18.45 58GIIC Global Fund 7279
Aug-08 2.45 15.02 15.44 23 14.85 15 17.29 5 15.73 16.634 7 17.86 4 22.14 4 22.34 7Global Alpha Global Small Cap Fund 3646
Jan-08 -4.80 3.94 13.57 42 15.35 12 13.41 65 10.21 11.7570 71 15.90 21 17.81 48 15.17 89Greenchip Global Equity Fund 10098
RBC INVESTOR & TREASURY SERVICES | POOLED FUND SURVEY | PER IOD ENDING SEPTEMBER 30, 2018 PAGE 22 OF 59

Period ending September 30, 2018 Four year periods ending September 30
Global Equity
Fund nameInceptiondate
1 quarter
ROR-% PR
1 year 2 years 3 years 5 years 10 years 2018 2017 2016 2015
ROR-% PR ROR-% PR ROR-% PR ROR-% PR ROR-% PR ROR-% PR ROR-% PR ROR-% PR ROR-% PR
Jan-14 3.62 16.99 16.54 13 13.60 22 15.77 13Greystone Global Equity Fund 1512
Jan-11 3.40 14.75 14.80 28 12.72 36 14.73 38 13.50 37 14.73 42 16.91 68 19.15 46Greystone Global Income & Growth Fund 3821
Jul-14 3.15 25.26 22.39 1 17.93 1 20.71 1Guardian Fundamental Global Equity Fund 133
Dec-02 3.05 13.30 16.63 12 13.40 27 15.86 17 9.27 13.7191 33 16.51 11 15.60 78 16.26 82Guardian Global Equity Fund 5238
May-10 2.98 10.00 9.74 83 8.21 97 12.19 86 9.87 91 12.75 80 13.43 94 14.90 90Guardian Global Equity GPS Fund 7639
Jan-11 1.71 9.75 8.71 94 10.00 86 12.73 76 11.06 78 13.49 68 16.29 72 16.49 77Hexavest ACWI Fund 7862
Jun-04 2.30 10.49 8.71 94 10.18 84 13.49 62 10.83 11.7754 70 14.25 55 17.95 44 18.06 61Hexavest World Fund 7250
Mar-12 2.30 13.02 12.59 56 11.71 60 13.13 71 11.69 72 13.15 74 15.28 85Highstreet Global Equity 5649
Dec-13 -1.52 11.66 16.80 11 15.78 6 17.47 4Hillsdale Global Small Cap Equity Fund 6494
Aug-09 1.89 13.34 12.58 56 10.12 85 14.19 48 12.30 57 14.40 52 17.52 60 20.35 28Industrial Alliance Global Equity 5257
Sep-81 2.63 16.54 11.12 76 13.91 19 15.04 31 11.38 13.8444 29 14.67 44 19.07 28 17.88 63Invesco (Trimark Fund) 1744
Jun-07 1.70 8.60 11.79 67 11.99 54 12.01 87 15.67 10.004 89 12.89 79 17.75 52 20.90 18Invesco (Trimark Global Small Cap) 8362
Dec-13 3.05 15.42 13.32 45 12.35 46 12.36 56Jarislowsky Fraser Global Equity (All Country) Fund 2938
Oct-05 3.75 15.52 13.56 42 12.44 43 14.60 42 11.97 13.0131 45 14.37 53 17.68 56 19.82 39Jarislowsky Fraser Global Equity Fund 278
Dec-05 3.18 16.13 15.27 24 12.16 50 14.87 35 11.07 12.8350 50 14.55 48 17.69 54 20.45 24JP Morgan Global Intrepid - Canada Fund 2032
Jan-10 1.76 15.83 16.10 16 14.08 18 17.29 5 15.90 12 17.66 6 20.80 11 21.78 13Landry Global Equity Fund 2459
Sep-10 -2.56 10.92 11.68 69 8.54 96 13.89 53 12.36 56 14.65 45 21.48 6 25.51 2Lazard Global Small Cap Equity Canada Fund 6996
Jul-05 1.99 9.83 12.01 62 11.91 55 12.42 81 10.02 10.0478 88 13.08 76 17.85 46 18.33 59Letko Brosseau RSP International Equity Fund 7856
Jul-98 1.27 14.38 14.82 28 11.44 66 13.55 59 10.61 11.9460 64 13.35 71 15.76 76 18.97 50London Life Global Equity Fund (LC) 4273
Oct-09 3.43 18.32 13.90 37 13.69 21 16.29 10 14.90 19 15.79 24 19.88 18 21.48 15Mawer Global Equity Fund 1020
Oct-07 2.70 17.39 13.52 42 13.34 28 18.17 1 19.39 16.331 10 18.37 1 25.96 1 28.90 1Mawer Global Small Cap Fund 1242
Aug-02 3.21 20.31 16.97 9 15.79 6 16.59 9 11.76 16.3935 10 15.68 29 18.48 36 19.20 45MFS Global Equity Growth Fund 630
Aug-02 2.66 9.64 9.63 85 10.92 77 14.72 40 10.60 13.1162 43 16.02 19 21.08 8 21.82 12MFS Global Equity Value Fund 7943
Jun-96 2.36 15.25 14.37 32 12.41 44 14.50 44 10.42 13.2566 40 14.31 54 17.05 67 18.58 56MFS Global Research Fund 3247
Aug-94 1.24 21.11 17.78 5 15.71 8 16.09 12 13.70 14.8510 20 14.87 38 18.20 40 19.63 41Montrusco Bolton Global Equity Fund 574
Jul-13 2.21 14.99 15.18 25 13.44 26 15.98 14 14.33 24 16.23 14Northern Trust Asset Mgmt. Global Equity Fund 3652
Jan-90 -0.35 8.68 12.72 53 16.52 2 14.45 44 14.56 13.167 41 15.94 20 22.78 3 19.97 36Orbis Global Equity Fund 8288
Dec-00 2.22 21.57 19.40 2 16.56 2 18.82 1 12.65 17.8220 2 18.15 2 19.69 19 20.42 25PH&N Global Equity Fund 352
Dec-06 1.17 14.55 14.31 33 13.06 30 13.98 51 12.21 12.8626 47 13.84 63 17.11 65 17.54 68QV Investors Global Equity Fund 4077
Apr-14 2.24 21.82 19.44 2 16.55 2 17.78 2RBC Global Equity Focus Fund 252
Mar-14 1.19 12.65 15.04 26 12.17 50 11.80 68RBC QUBE All Country World Equity Fund 5976
Jun-13 1.46 13.70 15.81 21 12.58 39 15.72 19 12.84 48 16.22 14RBC QUBE Global Equity Fund 4967
Apr-14 4.21 15.36 10.79 78 11.35 70 13.61 36RBC QUBE Low Volatility All Country World Equity Fund 303
RBC INVESTOR & TREASURY SERVICES | POOLED FUND SURVEY | PER IOD ENDING SEPTEMBER 30, 2018 PAGE 23 OF 59

Period ending September 30, 2018 Four year periods ending September 30
Global Equity
Fund nameInceptiondate
1 quarter
ROR-% PR
1 year 2 years 3 years 5 years 10 years 2018 2017 2016 2015
ROR-% PR ROR-% PR ROR-% PR ROR-% PR ROR-% PR ROR-% PR ROR-% PR ROR-% PR ROR-% PR
Jan-13 3.72 12.84 10.36 80 11.27 72 15.47 22 13.78 32 16.13 17RBC QUBE Low Volatility Global Equity Fund 578
Jul-17 3.49 21.64 17.31 6 13.58 22 15.69 19 11.08 14.2850 24 14.24 55 17.76 51 19.74 40RBC Vision Global Equity Fund 217
Nov-14 1.79 8.79 9.14 90 9.09 88Setanta Gl Dividend Fund 8259
Oct-05 3.61 13.92 13.15 46 13.50 24 15.01 32 11.61 14.0640 26 15.29 34 19.84 18 19.98 36Setanta Global Equity Fund 4712
Jun-15 3.56 15.15 12.74 52 12.88 34Setanta Global SRI Fund 3314
Jun-95 0.87 10.45 11.86 64 12.20 48 12.22 85 9.98 10.5380 83 12.67 82 15.54 80 15.81 84Sprucegrove Global (Pension) Pooled Fund 7383
Jan-15 -0.63 17.39 17.14 8 15.41 11T. Rowe Price Global Growth Equity Pool 1291
Dec-07 1.68 5.72 6.60 96 7.37 99 11.69 90 10.07 9.0374 94 13.23 73 17.10 66 20.25 31TD Emerald Global Dividend Pooled Fund Trust 9662
Aug-99 3.36 15.56 14.14 35 12.47 42 14.91 34 11.20 13.1347 42 14.75 42 18.18 41 19.85 38TD Emerald Global Equity Pooled Fund Trust Passive 2725
May-11 3.51 11.54 9.77 82 10.66 81 13.87 54 11.94 64 14.46 50 17.82 47 17.55 68TD Emerald Low Volatility All World Equity PFT 6516
Dec-09 3.51 13.96 11.58 70 12.02 54 15.42 24 13.65 35 15.78 25 19.51 21 18.80 52TD Emerald Low Volatility Global Equity PFT 4716
Jan-92 1.32 8.15 11.47 72 8.92 92 11.60 91 10.16 8.9671 95 12.47 88 18.48 36 21.17 17Templeton Global Equity Trust 8670
Mar-89 -2.28 8.43 11.79 67 11.51 64 10.17 96 10.56 10.2764 86 10.61 96 14.49 90 12.73 96Templeton Global Smaller Companies Fund 8496
Sep-97 1.47 8.14 11.39 73 8.86 93 11.41 93 10.04 8.8476 96 12.24 91 18.30 38 20.89 18Templeton Global Stock Trust 8666
Nov-12 3.38 12.58 12.82 50 11.83 57 13.59 58 12.13 60 13.84 63Triasima ACWE 6023
Jan-16 5.30 19.29 15.94 18Triasima ACWE Ex-Fossil Fuels Fund 81
Nov-08 -0.48 12.55 16.12 16 14.26 17 17.08 7 15.57 14 18.23 2 23.44 2 24.50 3Wellington MP (Canada) Global Perspectives Equity 6090
Feb-10 1.36 14.17 13.83 38 11.13 74 15.36 26 13.84 29 15.66 30 20.56 14 23.56 4Wellington MP (Luxembourg) Global Opportunities 4570
Jun-09 3.12 13.13 12.80 50 10.76 79 12.49 80 10.65 82 12.33 90 14.57 90 16.31 81Wellington MP (Luxembourg) Global Value 5535
Fund Count 85 85 85 84 72 46 79 71 74 74
Average Return 1.87 13.16 12.89 12.24 13.80 11.18 12.56 14.09 17.41 18.23
5th Percentile 3.89 20.84 17.72 16.05 17.28 15.29 17.10 17.75 21.79 23.07
1st Quartile 3.36 15.72 15.16 13.46 15.39 12.25 14.17 15.78 19.20 20.41
Median 2.30 13.54 12.80 12.16 14.04 11.08 12.83 14.46 17.77 18.95
3rd Quartile 1.22 10.20 11.24 11.08 12.79 10.05 11.36 13.09 15.91 16.71
95th Percentile -1.99 5.99 7.80 8.66 10.68 8.11 8.93 11.04 13.18 13.04
RBC INVESTOR & TREASURY SERVICES | POOLED FUND SURVEY | PER IOD ENDING SEPTEMBER 30, 2018 PAGE 24 OF 59
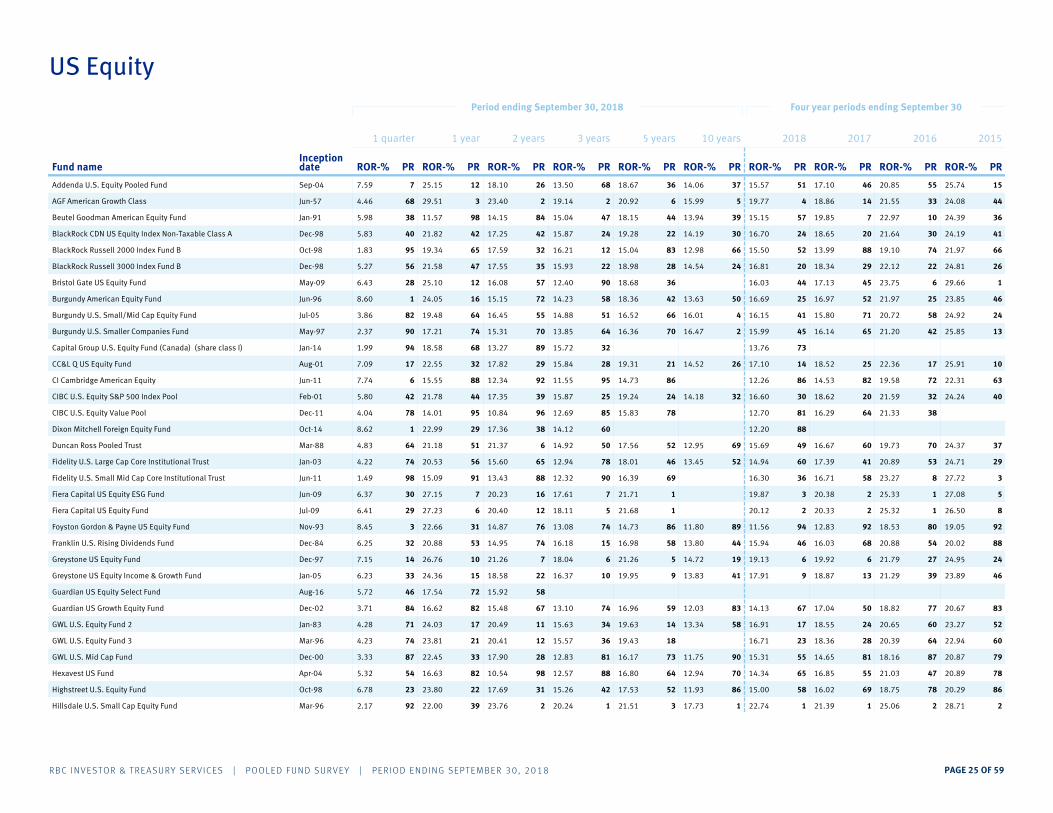
Period ending September 30, 2018 Four year periods ending September 30
US Equity
Fund nameInceptiondate
1 quarter
ROR-% PR
1 year 2 years 3 years 5 years 10 years 2018 2017 2016 2015
ROR-% PR ROR-% PR ROR-% PR ROR-% PR ROR-% PR ROR-% PR ROR-% PR ROR-% PR ROR-% PR
Sep-04 7.59 25.15 18.10 26 13.50 68 18.67 36 14.06 15.5737 51 17.10 46 20.85 55 25.74 15Addenda U.S. Equity Pooled Fund 127
Jun-57 4.46 29.51 23.40 2 19.14 2 20.92 6 15.99 19.775 4 18.86 14 21.55 33 24.08 44AGF American Growth Class 368
Jan-91 5.98 11.57 14.15 84 15.04 47 18.15 44 13.94 15.1539 57 19.85 7 22.97 10 24.39 36Beutel Goodman American Equity Fund 9838
Dec-98 5.83 21.82 17.25 42 15.87 24 19.28 22 14.19 16.7030 24 18.65 20 21.64 30 24.19 41BlackRock CDN US Equity Index Non-Taxable Class A 4240
Oct-98 1.83 19.34 17.59 32 16.21 12 15.04 83 12.98 15.5066 52 13.99 88 19.10 74 21.97 66BlackRock Russell 2000 Index Fund B 6595
Dec-98 5.27 21.58 17.55 35 15.93 22 18.98 28 14.54 16.8124 20 18.34 29 22.12 22 24.81 26BlackRock Russell 3000 Index Fund B 4756
May-09 6.43 25.10 16.08 57 12.40 90 18.68 36 16.03 44 17.13 45 23.75 6 29.66 1Bristol Gate US Equity Fund 1228
Jun-96 8.60 24.05 15.15 72 14.23 58 18.36 42 13.63 16.6950 25 16.97 52 21.97 25 23.85 46Burgundy American Equity Fund 161
Jul-05 3.86 19.48 16.45 55 14.88 51 16.52 66 16.01 16.154 41 15.80 71 20.72 58 24.92 24Burgundy U.S. Small/Mid Cap Equity Fund 6482
May-97 2.37 17.21 15.31 70 13.85 64 16.36 70 16.47 15.992 45 16.14 65 21.20 42 25.85 13Burgundy U.S. Smaller Companies Fund 7490
Jan-14 1.99 18.58 13.27 89 15.72 32 13.76 73Capital Group U.S. Equity Fund (Canada) (share class I) 6894
Aug-01 7.09 22.55 17.82 29 15.84 28 19.31 21 14.52 17.1026 14 18.52 25 22.36 17 25.91 10CC&L Q US Equity Fund 3217
Jun-11 7.74 15.55 12.34 92 11.55 95 14.73 86 12.26 86 14.53 82 19.58 72 22.31 63CI Cambridge American Equity 886
Feb-01 5.80 21.78 17.35 39 15.87 25 19.24 24 14.18 16.6032 30 18.62 20 21.59 32 24.24 40CIBC U.S. Equity S&P 500 Index Pool 4442
Dec-11 4.04 14.01 10.84 96 12.69 85 15.83 78 12.70 81 16.29 64 21.33 38CIBC U.S. Equity Value Pool 9578
Oct-14 8.62 22.99 17.36 38 14.12 60 12.20 88Dixon Mitchell Foreign Equity Fund 291
Mar-88 4.83 21.18 21.37 6 14.92 50 17.56 52 12.95 15.6969 49 16.67 60 19.73 70 24.37 37Duncan Ross Pooled Trust 5164
Jan-03 4.22 20.53 15.60 65 12.94 78 18.01 46 13.45 14.9452 60 17.39 41 20.89 53 24.71 29Fidelity U.S. Large Cap Core Institutional Trust 5674
Jun-11 1.49 15.09 13.43 88 12.32 90 16.39 69 16.30 36 16.71 58 23.27 8 27.72 3Fidelity U.S. Small Mid Cap Core Institutional Trust 9198
Jun-09 6.37 27.15 20.23 16 17.61 7 21.71 1 19.87 3 20.38 2 25.33 1 27.08 5Fiera Capital US Equity ESG Fund 730
Jul-09 6.41 27.23 20.40 12 18.11 5 21.68 1 20.12 2 20.33 2 25.32 1 26.50 8Fiera Capital US Equity Fund 629
Nov-93 8.45 22.66 14.87 76 13.08 74 14.73 86 11.80 11.5689 94 12.83 92 18.53 80 19.05 92Foyston Gordon & Payne US Equity Fund 313
Dec-84 6.25 20.88 14.95 74 16.18 15 16.98 58 13.80 15.9444 46 16.03 68 20.88 54 20.02 88Franklin U.S. Rising Dividends Fund 5332
Dec-97 7.15 26.76 21.26 7 18.04 6 21.26 5 14.72 19.1319 6 19.92 6 21.79 27 24.95 24Greystone US Equity Fund 1014
Jan-05 6.23 24.36 18.58 22 16.37 10 19.95 9 13.83 17.9141 9 18.87 13 21.29 39 23.89 46Greystone US Equity Income & Growth Fund 1533
Aug-16 5.72 17.54 15.92 58Guardian US Equity Select Fund 7246
Dec-02 3.71 16.62 15.48 67 13.10 74 16.96 59 12.03 14.1383 67 17.04 50 18.82 77 20.67 83Guardian US Growth Equity Fund 8284
Jan-83 4.28 24.03 20.49 11 15.63 34 19.63 14 13.34 16.9158 17 18.55 24 20.65 60 23.27 52GWL U.S. Equity Fund 2 1771
Mar-96 4.23 23.81 20.41 12 15.57 36 19.43 18 16.71 23 18.36 28 20.39 64 22.94 60GWL U.S. Equity Fund 3 2174
Dec-00 3.33 22.45 17.90 28 12.83 81 16.17 73 11.75 15.3190 55 14.65 81 18.16 87 20.87 79GWL U.S. Mid Cap Fund 3387
Apr-04 5.32 16.63 10.54 98 12.57 88 16.80 64 12.94 14.3470 65 16.85 55 21.03 47 20.89 78Hexavest US Fund 8254
Oct-98 6.78 23.80 17.69 31 15.26 42 17.53 52 11.93 15.0086 58 16.02 69 18.75 78 20.29 86Highstreet U.S. Equity Fund 2223
Mar-96 2.17 22.00 23.76 2 20.24 1 21.51 3 17.73 22.741 1 21.39 1 25.06 2 28.71 2Hillsdale U.S. Small Cap Equity Fund 3992
RBC INVESTOR & TREASURY SERVICES | POOLED FUND SURVEY | PER IOD ENDING SEPTEMBER 30, 2018 PAGE 25 OF 59

Period ending September 30, 2018 Four year periods ending September 30
US Equity
Fund nameInceptiondate
1 quarter
ROR-% PR
1 year 2 years 3 years 5 years 10 years 2018 2017 2016 2015
ROR-% PR ROR-% PR ROR-% PR ROR-% PR ROR-% PR ROR-% PR ROR-% PR ROR-% PR ROR-% PR
Oct-97 3.89 16.81 13.93 85 13.48 68 16.90 61 12.46 14.0779 70 16.92 54 21.12 45 23.00 59HSBC US Equity Pooled Fund 7882
Jan-07 5.45 17.71 13.53 88 11.14 96 17.17 56 12.81 14.0874 70 17.04 50 20.58 62 25.33 19Industrial Alliance U.S. Equity 7152
Sep-98 5.49 19.94 14.64 78 11.96 93 17.32 55 14.12 14.9135 62 16.68 59 21.37 36 25.18 22Integra US Value Growth Fund 6150
Oct-99 4.54 23.96 21.17 8 15.68 33 19.62 15 15.84 16.637 28 18.55 23 20.98 49 26.63 7Invesco (Trimark US Companies) 1967
Aug-02 4.07 17.05 14.84 76 13.34 71 13.78 91 15.29 12.2412 86 12.98 91 17.08 93 19.68 89Invesco (Trimark US Small Cap) 7578
Nov-98 7.15 19.62 14.38 80 12.98 76 18.00 47 13.67 15.4848 53 17.60 39 21.76 28 25.21 21Jarislowsky Fraser US Equity Fund 6314
Nov-07 6.94 23.16 19.02 20 16.15 16 19.74 11 15.66 16.759 21 18.90 12 22.63 13 25.92 10JP Morgan US Large Cap 130/30 - Canada Fund 2821
Jun-01 0.73 5.76 10.43 99 8.88 100 12.47 100 12.73 9.7376 99 14.21 86 18.27 86 21.71 68Kingwest US Equity Portfolio 100100
Aug-03 4.85 22.26 18.36 23 16.20 13 19.49 17 14.45 17.8027 10 18.81 16 22.97 10 28.36 2Landry US Equity Fund 3663
Sep-01 3.95 13.84 15.36 68 13.63 66 15.62 79 12.15 12.8682 80 16.07 67 18.31 85 20.97 77Leith Wheeler US Equity Fund 9580
Jan-07 7.08 16.66 12.19 93 13.43 70 15.23 82 12.98 13.5066 77 14.87 78 20.74 58 20.80 81Lincluden U.S. Equity Pooled Fund 8018
Jan-88 4.23 23.73 19.68 18 15.14 44 18.47 40 13.31 15.7959 48 17.19 43 18.94 75 23.09 56London Life US Equity Fund (LC) 2374
Nov-01 3.24 22.24 17.59 32 12.61 87 15.84 78 13.37 13.6156 76 14.29 84 17.83 90 21.35 73London Life US Growth Sectors Fund (LC) 3788
Oct-04 2.09 13.20 10.41 100 8.75 100 12.62 98 11.04 8.8296 100 12.47 96 18.56 80 21.38 71London Life US Value Fund (LC) 9793
Dec-10 5.55 18.10 14.31 82 11.90 94 15.96 75 11.71 93 15.43 74 20.05 67 21.43 70Louisbourg US Equity Fund 7048
Jan-98 5.77 21.47 16.88 48 15.48 38 18.84 31 13.79 16.2946 36 18.19 32 21.17 43 23.71 49Manulife AM US Equity Index Pooled 4843
Dec-92 5.13 23.35 16.61 53 15.86 27 18.81 34 13.45 17.5852 12 17.70 38 22.50 15 24.60 32Mawer U.S. Equity Fund 2658
Sep-83 5.33 20.21 17.23 44 15.13 44 18.53 39 13.20 16.5862 30 18.12 33 21.44 35 24.36 38MFS U.S. Equity Core Pension Fund 5954
Dec-85 4.32 26.96 20.26 15 18.33 4 19.68 13 14.61 18.0622 8 17.92 36 21.14 45 23.06 57Montrusco Bolton U.S. Equity Fund 970
Dec-99 6.66 31.42 21.98 5 14.18 60 12.51 99 15.19 12.5313 82 8.23 100 12.18 100 17.69 96Pembroke US Growth Fund 125
Sep-64 6.06 23.51 18.08 26 14.28 57 16.44 67 11.61 13.6192 76 14.73 80 18.04 89 21.33 74PH&N U.S. Equity Fund 2536
Jun-10 4.80 21.79 17.51 36 14.84 52 18.00 48 16.16 40 17.07 48 20.28 65 23.09 56PH&N U.S. Multi-Style All-Cap Equity Fund 4364
Feb-92 7.11 22.27 16.71 52 15.04 47 18.81 34 14.62 16.4121 33 17.96 36 22.20 21 25.83 13Scheer Rowlett & Associates US Equity Fund 3616
Jul-97 6.15 15.25 11.95 94 12.80 82 14.41 88 11.06 12.0196 90 14.20 86 18.36 83 20.58 84SEAMARK US Equity Pooled Fund 9035
Nov-99 4.94 19.04 15.26 71 12.80 82 16.83 63 13.19 14.1662 66 16.28 64 20.57 62 24.66 30SEI U.S. Large Company Equity Fund 6660
Jan-99 7.37 16.29 16.93 47 16.01 20 13.19 94 10.57 11.56100 95 12.43 97 12.87 98 16.32 100SEI US Large Cap Index Fund Hedged 8410
Nov-99 3.56 20.30 15.88 59 13.81 64 16.35 71 12.64 16.2078 39 15.38 74 20.92 51 23.27 52SEI US Small Company Equity Fund 5885
Nov-15 4.93 32.90 26.93 1T. Rowe Price U.S. Large-Cap Core Growth Equity Pool 160
Aug-97 5.74 21.46 16.87 49 15.46 38 18.88 30 13.80 16.3144 35 18.25 30 21.23 40 23.78 48TD Emerald U.S. Market Index Fund 4845
Dec-10 7.46 16.76 17.31 40 16.40 10 13.55 92 11.90 91 12.76 93 13.24 96 16.81 98TD Emerald Hedged U.S. Equity PFT II 789
Aug-97 7.37 16.29 16.85 50 16.10 18 13.17 94 10.71 11.5398 96 12.40 98 12.86 98 16.41 99TD Emerald Hedged U.S. Market Index Pooled Fund 8410
Dec-93 5.82 21.80 17.23 44 15.83 29 19.24 24 14.17 16.6732 26 18.61 20 21.60 31 24.17 42TD Emerald Pooled US Fund Passive 4240
Oct-06 8.27 15.94 15.69 63 15.97 21 14.46 88 11.92 12.4386 83 14.09 88 15.89 94 18.21 95TD Emerald Systematic Alpha Hedged U.S. Equity Pooled Fund 874
RBC INVESTOR & TREASURY SERVICES | POOLED FUND SURVEY | PER IOD ENDING SEPTEMBER 30, 2018 PAGE 26 OF 59

Period ending September 30, 2018 Four year periods ending September 30
US Equity
Fund nameInceptiondate
1 quarter
ROR-% PR
1 year 2 years 3 years 5 years 10 years 2018 2017 2016 2015
ROR-% PR ROR-% PR ROR-% PR ROR-% PR ROR-% PR ROR-% PR ROR-% PR ROR-% PR ROR-% PR
Nov-01 6.63 21.00 15.70 63 15.36 40 20.11 8 15.05 17.1215 14 19.89 6 24.30 4 25.56 18TD Emerald Systematic Alpha U.S. Equity Pooled Fund 5226
Jan-13 6.93 27.26 19.34 19 14.76 53 14.10 69Triasima American All Capitalization Fund 621
Jul-96 1.57 14.97 14.32 82 12.91 79 17.71 50 12.86 14.9372 61 18.40 27 22.59 14 24.82 26UBS (Canada) American Equity Fund 9298
Jun-94 5.47 20.46 15.82 61 14.48 55 19.10 27 14.98 16.9016 18 18.77 17 23.65 6 27.16 5Wellington MP (Luxembourg) US Research Equity Portfolio 5651
Fund Count 70 70 70 68 65 55 68 64 73 74
Average Return 5.30 20.68 16.77 14.60 17.43 13.60 15.24 16.72 20.44 23.11
5th Percentile 8.01 27.51 21.84 18.10 21.17 15.98 19.46 20.01 24.05 27.08
1st Quartile 6.67 23.48 18.15 15.87 19.20 14.53 16.69 18.51 21.95 24.88
Median 5.48 21.32 16.86 14.90 17.71 13.63 15.63 17.04 20.95 23.62
3rd Quartile 4.19 17.07 14.90 13.04 15.99 12.77 13.64 15.25 18.95 21.17
95th Percentile 1.88 13.91 11.37 11.66 13.06 11.12 11.56 12.57 14.73 18.07
RBC INVESTOR & TREASURY SERVICES | POOLED FUND SURVEY | PER IOD ENDING SEPTEMBER 30, 2018 PAGE 27 OF 59

Period ending September 30, 2018 Four year periods ending September 30
US Large Cap
Fund nameInceptiondate
1 quarter
ROR-% PR
1 year 2 years 3 years 5 years 10 years 2018 2017 2016 2015
ROR-% PR ROR-% PR ROR-% PR ROR-% PR ROR-% PR ROR-% PR ROR-% PR ROR-% PR ROR-% PR
Jan-91 5.98 11.57 14.15 92 15.04 68 18.15 56 13.94 15.1532 60 19.85 3 22.97 12 24.39 39Beutel Goodman American Equity Fund 10054
Dec-98 5.83 21.82 17.25 35 15.87 32 19.28 28 14.19 16.7024 24 18.65 28 21.64 36 24.19 47BlackRock CDN US Equity Index Non-Taxable Class A 4058
Jun-96 8.60 24.05 15.15 80 14.23 76 18.36 52 13.63 16.6950 28 16.97 65 21.97 28 23.85 58Burgundy American Equity Fund 121
Jan-03 4.22 20.53 15.60 72 12.94 88 18.01 60 13.45 14.9455 64 17.39 54 20.89 64 24.71 28Fidelity U.S. Large Cap Core Institutional Trust 62100
Nov-93 8.45 22.66 14.87 84 13.08 80 14.73 80 11.80 11.5682 92 12.83 90 18.53 76 19.05 85Foyston Gordon & Payne US Equity Fund 274
Jan-05 6.23 24.36 18.58 19 16.37 8 19.95 4 13.83 17.9137 4 18.87 19 21.29 48 23.89 54Greystone US Equity Income & Growth Fund 839
Apr-04 5.32 16.63 10.54 100 12.57 100 16.80 72 12.94 14.3472 68 16.85 69 21.03 60 20.89 77Hexavest US Fund 8076
Nov-98 7.15 19.62 14.38 89 12.98 84 18.00 64 13.67 15.4846 56 17.60 50 21.76 32 25.21 23Jarislowsky Fraser US Equity Fund 6924
Nov-07 6.94 23.16 19.02 12 16.15 16 19.74 8 15.66 16.751 20 18.90 16 22.63 16 25.92 8JP Morgan US Large Cap 130/30 - Canada Fund 2331
Aug-03 4.85 22.26 18.36 23 16.20 12 19.49 20 14.45 17.8018 12 18.81 23 22.97 8 28.36 4Landry US Equity Fund 3488
Jan-88 4.23 23.73 19.68 8 15.14 56 18.47 48 13.31 15.7959 52 17.19 58 18.94 72 23.09 66London Life US Equity Fund (LC) 1697
Sep-83 5.33 20.21 17.23 40 15.13 60 18.53 44 13.20 16.5864 36 18.12 38 21.44 44 24.36 42MFS U.S. Equity Core Pension Fund 6574
Dec-85 4.32 26.96 20.26 4 18.33 1 19.68 12 14.61 18.0612 1 17.92 46 21.14 56 23.06 68Montrusco Bolton U.S. Equity Fund 493
Sep-64 6.06 23.51 18.08 26 14.28 72 16.44 76 11.61 13.6186 76 14.73 77 18.04 84 21.33 74PH&N U.S. Equity Fund 1950
Nov-12 6.16 20.88 15.85 62 15.40 44 19.42 24 17.87 8 19.06 11RBC QUBE Low Volatility U.S. Equity Fund 5743
Jun-13 5.65 21.17 18.72 16 15.39 48 19.55 16 16.07 48 19.15 8RBC QUBE U.S. Equity Fund 5069
Feb-92 7.11 22.27 16.71 57 15.04 64 18.81 40 14.62 16.4110 40 17.96 43 22.20 24 25.83 11Scheer Rowlett & Associates US Equity Fund 3226
Jul-97 6.15 15.25 11.95 96 12.80 92 14.41 88 11.06 12.0191 84 14.20 82 18.36 80 20.58 80SEAMARK US Equity Pooled Fund 9646
Nov-99 4.94 19.04 15.26 77 12.80 96 16.83 68 13.19 14.1668 72 16.28 73 20.57 68 24.66 30SEI U.S. Large Company Equity Fund 7282
Jan-99 7.37 16.29 16.93 47 16.01 24 13.19 96 10.57 11.56100 96 12.43 97 12.87 96 16.32 100SEI US Large Cap Index Fund Hedged 8816
Nov-15 4.93 32.90 26.93 1T. Rowe Price U.S. Large-Cap Core Growth Equity Pool 184
Aug-97 5.74 21.46 16.87 50 15.46 40 18.88 36 13.80 16.3140 44 18.25 35 21.23 52 23.78 60TD Emerald U.S. Market Index Fund 4665
Dec-10 7.46 16.76 17.31 32 16.40 4 13.55 92 11.90 88 12.76 92 13.24 92 16.81 93TD Emerald Hedged U.S. Equity PFT II 7812
RBC INVESTOR & TREASURY SERVICES | POOLED FUND SURVEY | PER IOD ENDING SEPTEMBER 30, 2018 PAGE 28 OF 59

Period ending September 30, 2018 Four year periods ending September 30
US Large Cap
Fund nameInceptiondate
1 quarter
ROR-% PR
1 year 2 years 3 years 5 years 10 years 2018 2017 2016 2015
ROR-% PR ROR-% PR ROR-% PR ROR-% PR ROR-% PR ROR-% PR ROR-% PR ROR-% PR ROR-% PR
Aug-97 7.37 16.29 16.85 53 16.10 20 13.17 100 10.71 11.5396 100 12.40 100 12.86 100 16.41 97TD Emerald Hedged U.S. Market Index Pooled Fund 8618
Dec-93 5.82 21.80 17.23 42 15.83 36 19.24 32 14.17 16.6726 32 18.61 30 21.60 40 24.17 50TD Emerald Pooled US Fund Passive 4261
Oct-06 8.27 15.94 15.69 68 15.97 28 14.46 84 11.92 12.4378 80 14.09 84 15.89 88 18.21 88TD Emerald Systematic Alpha Hedged U.S. Equity Pooled Fund 927
Nov-01 6.63 21.00 15.70 66 15.36 52 20.11 1 15.05 17.125 16 19.89 1 24.30 1 25.56 19TD Emerald Systematic Alpha U.S. Equity Pooled Fund 5435
Fund Count 27 27 27 26 26 23 26 27 26 27
Average Return 6.19 20.82 16.86 15.03 17.59 13.28 15.21 16.92 20.17 23.13
5th Percentile 8.40 26.18 20.09 16.39 19.90 15.02 17.90 19.64 23.56 27.63
1st Quartile 7.13 22.91 18.22 16.00 19.39 14.18 16.70 18.73 22.14 24.96
Median 6.06 21.17 16.87 15.37 18.41 13.63 15.93 17.60 21.26 24.17
3rd Quartile 5.33 17.90 15.43 14.24 16.53 12.43 13.75 15.51 18.63 21.11
95th Percentile 4.25 15.46 12.61 12.80 13.28 10.76 11.56 12.53 12.96 16.53
RBC INVESTOR & TREASURY SERVICES | POOLED FUND SURVEY | PER IOD ENDING SEPTEMBER 30, 2018 PAGE 29 OF 59

Period ending September 30, 2018 Four year periods ending September 30
US Large/Mid Cap
Fund nameInceptiondate
1 quarter
ROR-% PR
1 year 2 years 3 years 5 years 10 years 2018 2017 2016 2015
ROR-% PR ROR-% PR ROR-% PR ROR-% PR ROR-% PR ROR-% PR ROR-% PR ROR-% PR ROR-% PR
Sep-04 7.59 25.15 18.10 37 13.50 55 18.67 45 14.06 15.5712 46 17.10 56 20.85 46 25.74 16Addenda U.S. Equity Pooled Fund 181
Jun-09 6.37 27.15 20.23 26 17.61 9 21.71 1 19.87 8 20.38 1 25.33 1 27.08 1Fiera Capital US Equity ESG Fund 826
Jul-09 6.41 27.23 20.40 18 18.11 1 21.68 8 20.12 1 20.33 8 25.32 6 26.50 8Fiera Capital US Equity Fund 119
Dec-02 3.71 16.62 15.48 73 13.10 64 16.96 82 12.03 14.1376 82 17.04 63 18.82 70 20.67 92Guardian US Growth Equity Fund 8273
Jan-83 4.28 24.03 20.49 1 15.63 28 19.63 19 13.34 16.9150 28 18.55 19 20.65 54 23.27 54GWL U.S. Equity Fund 2 2856
Mar-96 4.23 23.81 20.41 10 15.57 36 19.43 27 16.71 36 18.36 36 20.39 61 22.94 61GWL U.S. Equity Fund 3 3863
Oct-98 6.78 23.80 17.69 46 15.26 45 17.53 64 11.93 15.0086 55 16.02 82 18.75 76 20.29 100Highstreet U.S. Equity Fund 449
Sep-98 5.49 19.94 14.64 82 11.96 90 17.32 72 14.12 14.911 72 16.68 72 21.37 38 25.18 31Integra US Value Growth Fund 7337
Nov-01 3.24 22.24 17.59 54 12.61 82 15.84 90 13.37 13.6138 90 14.29 91 17.83 93 21.35 76London Life US Growth Sectors Fund (LC) 6382
Oct-04 2.09 13.20 10.41 100 8.75 100 12.62 100 11.04 8.82100 100 12.47 100 18.56 84 21.38 70London Life US Value Fund (LC) 10091
Dec-92 5.13 23.35 16.61 64 15.86 19 18.81 37 13.45 17.5826 19 17.70 45 22.50 22 24.60 39Mawer U.S. Equity Fund 5445
Jul-96 1.57 14.97 14.32 90 12.91 73 17.71 55 12.86 14.9362 64 18.40 28 22.59 16 24.82 36UBS (Canada) American Equity Fund 91100
Fund Count 12 12 12 12 12 9 12 12 14 14
Average Return 4.74 21.79 17.20 14.24 18.16 12.91 15.68 17.28 20.86 23.56
5th Percentile 7.14 27.19 20.45 17.84 21.69 14.10 19.98 20.35 25.32 26.70
1st Quartile 6.38 24.31 20.27 15.68 19.48 13.47 17.08 18.44 22.27 25.48
Median 4.70 23.57 17.64 14.38 18.19 13.34 15.29 17.40 20.75 23.76
3rd Quartile 3.60 19.11 15.27 12.83 17.23 12.06 14.72 16.51 18.77 21.36
95th Percentile 1.85 14.17 12.56 10.52 14.39 11.40 11.46 13.47 17.70 20.54
RBC INVESTOR & TREASURY SERVICES | POOLED FUND SURVEY | PER IOD ENDING SEPTEMBER 30, 2018 PAGE 30 OF 59

Period ending September 30, 2018 Four year periods ending September 30
US Small Cap
Fund nameInceptiondate
1 quarter
ROR-% PR
1 year 2 years 3 years 5 years 10 years 2018 2017 2016 2015
ROR-% PR ROR-% PR ROR-% PR ROR-% PR ROR-% PR ROR-% PR ROR-% PR ROR-% PR ROR-% PR
Oct-98 1.83 19.34 17.59 42 16.21 15 15.04 71 12.98 15.5072 58 13.99 77 19.10 57 21.97 63BlackRock Russell 2000 Index Fund B 70100
Jul-05 3.86 19.48 16.45 57 14.88 29 16.52 16 16.01 16.1528 28 15.80 28 20.72 42 24.92 25Burgundy U.S. Small/Mid Cap Equity Fund 5828
May-97 2.37 17.21 15.31 86 13.85 58 16.36 30 16.47 15.9915 42 16.14 15 21.20 15 25.85 13Burgundy U.S. Smaller Companies Fund 8672
Dec-00 3.33 22.45 17.90 30 12.83 100 16.17 56 11.75 15.31100 70 14.65 71 18.16 71 20.87 75GWL U.S. Mid Cap Fund 1656
Mar-96 2.17 22.00 23.76 1 20.24 1 21.51 1 17.73 22.741 1 21.39 1 25.06 1 28.71 1Hillsdale U.S. Small Cap Equity Fund 2886
Aug-02 4.07 17.05 14.84 100 13.34 86 13.78 86 15.29 12.2444 100 12.98 85 17.08 85 19.68 87Invesco (Trimark US Small Cap) 10015
Dec-99 6.66 31.42 21.98 14 14.18 43 12.51 100 15.19 12.5356 86 8.23 100 12.18 100 17.69 100Pembroke US Growth Fund 11
Nov-99 3.56 20.30 15.88 71 13.81 70 16.35 42 12.64 16.2085 16 15.38 43 20.92 29 23.27 50SEI US Small Company Equity Fund 4343
Fund Count 8 8 8 8 8 8 8 8 8 9
Average Return 3.48 21.16 17.96 14.92 16.03 14.76 15.83 14.96 19.31 22.94
5th Percentile 5.75 28.28 23.14 18.83 19.77 17.28 20.45 19.55 23.71 27.57
1st Quartile 3.92 22.12 18.92 15.21 16.40 16.12 16.16 15.88 20.99 24.90
Median 3.45 19.89 17.02 14.02 16.26 15.24 15.74 15.22 19.91 23.27
3rd Quartile 2.32 18.81 15.74 13.70 14.72 12.90 14.61 14.23 17.89 20.86
95th Percentile 1.95 17.11 15.00 13.01 12.96 12.06 12.34 9.89 13.91 18.49
RBC INVESTOR & TREASURY SERVICES | POOLED FUND SURVEY | PER IOD ENDING SEPTEMBER 30, 2018 PAGE 31 OF 59

Period ending September 30, 2018 Four year periods ending September 30
North American Equity
Fund nameInceptiondate
1 quarter
ROR-% PR
1 year 2 years 3 years 5 years 10 years 2018 2017 2016 2015
ROR-% PR ROR-% PR ROR-% PR ROR-% PR ROR-% PR ROR-% PR ROR-% PR ROR-% PR ROR-% PR
Feb-08 8.22 21.23 17.11 20 9.36 60 15.82 1 16.84 12.641 20 14.51 13 20.39 1 33.83 1BloombergSen Partners Fund 201
Jul-95 0.52 10.39 13.56 40 12.21 20 12.06 74 11.18 10.3750 60 12.48 50 13.83 82 14.74 74Kingwest Avenue Portfolio 8080
Aug-97 1.88 11.13 12.32 60 11.65 40 13.34 26 10.73 10.9474 40 13.90 37 14.08 67 15.78 50Nexus North American Equity Fund 6040
May-05 0.60 16.45 6.97 80 7.45 80 13.04 50 11.75 8.1026 80 12.21 74 18.31 18 19.02 23Patient Capital Special Opportunities Fund 4060
Jan-06 -2.95 0.61 -0.62 100 -1.50 100 0.04 100 7.89 4.17100 100 -0.10 100 -2.09 100 -2.07 100Perennial Equity Portfolio 100100
Jan-13 6.93 27.26 19.34 1 14.76 1 14.10 1Triasima American All Capitalization Fund 120
Fund Count 6 6 6 6 5 5 6 9 7 5
Average Return 2.53 14.51 11.45 8.99 10.86 11.68 10.05 11.72 13.95 15.93
5th Percentile 7.90 25.75 18.78 14.12 15.33 15.82 13.73 14.76 19.76 30.54
1st Quartile 5.67 20.04 16.22 12.07 13.39 11.84 12.21 14.19 18.20 17.67
Median 1.24 13.79 12.94 10.51 13.04 11.18 10.65 12.48 15.06 15.78
3rd Quartile 0.54 10.58 8.31 7.93 11.84 10.68 8.66 12.16 13.96 14.42
95th Percentile -2.09 3.06 1.28 0.74 2.45 8.45 5.15 4.32 2.69 1.29
RBC INVESTOR & TREASURY SERVICES | POOLED FUND SURVEY | PER IOD ENDING SEPTEMBER 30, 2018 PAGE 32 OF 59

Period ending September 30, 2018 Four year periods ending September 30
Non North American Equity
Fund nameInceptiondate
1 quarter
ROR-% PR
1 year 2 years 3 years 5 years 10 years 2018 2017 2016 2015
ROR-% PR ROR-% PR ROR-% PR ROR-% PR ROR-% PR ROR-% PR ROR-% PR ROR-% PR ROR-% PR
Nov-97 -1.32 1.61 8.47 77 7.91 64 9.79 55 5.76 8.9698 52 11.94 36 15.84 25 14.07 82AB Intl Value Equity (Cap-Weighted, Unhedged) 9465
Oct-00 -1.33 8.69 16.65 1 14.34 2 14.44 4 9.33 13.6428 2 15.93 4 16.14 20 15.40 48Acadian Core International Equity Fund 1366
Apr-12 -1.17 6.53 7.77 85 7.67 70 9.63 59 8.94 53 10.42 66 15.34 35Addenda EAFE Equity Pooled Fund 3558
Apr-98 -1.97 8.64 9.75 56 11.17 12 11.32 25 10.11 11.3716 18 12.01 35 16.08 20 15.13 58Baillie Gifford Overseas Fund 1884
Oct-93 -1.25 7.11 12.42 12 10.67 20 8.75 82 6.29 9.3395 46 9.16 96 9.18 100 10.60 98Beutel Goodman International Equity Fund 2961
Sep-08 -0.55 -2.64 7.58 89 8.51 55 10.15 47 13.27 9.621 43 13.60 15 19.11 6 20.47 2Black Creek International Equity Fund 10036
Jul-05 -0.39 6.41 9.91 48 8.11 60 9.51 62 7.64 8.5264 67 10.30 73 13.99 62 14.79 68BlackRock CDN MSCI EAFE Equity Index Class A 3828
Feb-97 -1.38 5.91 12.01 22 9.27 36 11.67 19 9.38 10.3928 28 13.16 19 16.92 11 17.91 8BlackRock International Alpha Tilts Fund B 5470
Jul-96 -0.77 9.06 10.19 43 8.81 46 10.06 49 7.59 8.6069 59 10.31 72 15.72 30 14.87 64Brandes Canada International Equity Unit Trust 1041
Jul-05 -1.08 7.65 5.86 98 9.85 30 13.64 6 12.44 13.182 5 15.19 6 20.71 4 19.30 5Burgundy EAFE Equity Fund 2655
Jan-01 -1.85 8.92 13.50 6 13.46 4 10.65 39 8.36 10.7649 26 11.08 54 13.43 78 12.92 86Capital Group International Equity Fund (class I) 1182
Oct-02 1.37 12.25 11.96 24 8.85 43 11.00 30 10.09 11.6618 14 10.69 60 14.09 58 17.17 15CIBC EAFE Equity Pool 16
Mar-98 -0.38 5.76 9.50 61 7.80 67 9.16 72 7.31 8.2182 76 10.02 77 13.66 72 14.53 77CIBC International Equity Index Pool 5527
Jan-02 -0.37 6.55 12.23 15 10.79 17 11.59 20 10.68 10.1811 33 12.88 23 16.76 14 16.44 24Connon, Clark and Lunn Q International Equity Fund 3426
Dec-12 -5.49 1.40 7.83 84 7.24 82 10.73 36 10.85 24 13.20 18Eterna International Equity Fund 96100
Sep-01 -0.66 6.03 9.23 66 7.09 85 9.00 78 7.58 8.4570 70 9.76 81 14.26 54 15.73 42Fidelity International Growth Institutional Trust 5139
Feb-03 0.59 5.41 8.32 78 5.87 96 8.55 92 6.89 7.3791 88 9.35 94 13.59 74 16.14 31Fidelity Select International Equity Institutional Trust 5813
Mar-09 -0.86 3.57 8.57 74 7.44 76 9.20 70 7.90 80 10.65 60 12.87 88 14.09 82Fidelity Select International Plus Institutional Trust 7850
Jan-10 1.99 11.87 13.51 4 12.67 8 13.06 8 13.23 4 13.36 17 16.35 18 17.79 9Fiera Capital International Equity ESG Fund 22
Jan-10 1.93 11.75 13.50 6 12.56 8 12.84 13 13.08 8 13.11 20 15.96 23 17.47 11Fiera Capital International Equity Fund 33
Nov-93 -0.13 4.47 7.64 88 7.91 64 8.56 91 8.15 7.9056 82 9.61 85 11.86 93 12.14 94Foyston Gordon & Payne International Equity Fund 7023
Dec-09 0.84 11.32 16.33 1 16.11 1 19.65 1 19.96 1 21.83 1 24.27 1 23.23 1Global Alpha Small Cap EAFE Fund 510
Jul-08 -0.53 6.07 11.43 29 10.44 24 12.49 15 9.84 11.3524 18 14.16 11 15.51 33 17.22 13Greystone International Equity Fund 5034
Apr-08 0.54 7.03 11.26 31 8.87 42 10.45 42 9.14 9.8535 39 11.32 44 13.83 66 16.38 25Greystone International Income & Growth Fund 3014
Aug-02 -1.30 8.66 12.40 12 10.34 25 10.92 32 10.04 11.2920 20 11.49 39 14.45 45 14.87 64Gryphon EuroPac Fund 1463
Dec-04 -1.39 4.52 11.20 33 8.95 40 11.29 26 7.42 10.0775 35 13.05 20 13.97 62 15.20 55Guardian International Equity Fund 6870
-1.55 0.59 6.34 94Guardian International Equity Select Fund 9874
Jul-94 -2.34 4.24 9.92 48 8.79 47 9.12 75 8.20 8.5153 68 10.38 70 13.21 85 14.81 66GWL International Equity Fund 13.01JPMF 7490
Jan-94 -2.88 3.21 8.57 74 6.71 89 9.48 64 8.54 7.9047 80 11.10 52 14.35 49 16.97 18GWL International Equity Investment Fund 1 8695
Apr-04 -0.85 3.60 6.02 96 5.84 96 8.60 89 7.36 7.3178 89 9.89 78 13.54 75 14.66 73Hexavest EuroPac Fund 7848
Jan-06 -1.64 3.34 6.12 95 5.30 98 6.46 100 5.51 6.49100 98 7.25 100 9.86 98 11.43 96Highstreet International Equity A Fund 8279
Dec-08 -2.03 7.57 9.79 51 8.13 60 10.71 37 9.78 40 11.51 38 14.99 39 16.08 34Industrial Alliance International Equity 2685
Apr-93 0.99 8.50 9.45 62 7.27 80 9.55 61 7.31 8.7584 56 9.81 79 13.73 70 16.03 36Integra International Equity Fund 229
RBC INVESTOR & TREASURY SERVICES | POOLED FUND SURVEY | PER IOD ENDING SEPTEMBER 30, 2018 PAGE 33 OF 59

Period ending September 30, 2018 Four year periods ending September 30
Non North American Equity
Fund nameInceptiondate
1 quarter
ROR-% PR
1 year 2 years 3 years 5 years 10 years 2018 2017 2016 2015
ROR-% PR ROR-% PR ROR-% PR ROR-% PR ROR-% PR ROR-% PR ROR-% PR ROR-% PR ROR-% PR
Jul-00 -0.82 2.37 7.35 90 7.33 78 10.36 43 9.94 8.5522 64 12.45 28 15.81 26 17.16 16Invesco (Growth) 9043
Oct-99 -3.08 3.30 7.92 82 13.19 5 15.03 2 11.55 13.045 8 18.16 2 22.36 2 20.11 3Invesco (Trimark International Companies) 8496
Apr-95 -0.56 4.45 9.57 59 8.70 51 9.72 57 9.06 8.5538 63 11.08 54 13.21 85 15.27 52Jarislowsky Fraser International Equity Fund 7037
Dec-13 -1.35 5.25 9.12 68 9.32 36 7.82 84Jarislowsky Fraser Intl Equity (AC ex. US) Fund 6168
Mar-82 -2.42 3.44 9.27 65 8.61 53 9.03 78 8.12 8.4058 73 10.47 64 13.33 82 14.58 75JP Morgan Equity International Investment Trust 8092
Apr-95 -0.84 6.08 12.21 16 10.93 14 9.89 52 8.86 9.0540 50 10.86 58 12.19 90 12.51 90Leith Wheeler International Equity Fund 4846
Dec-06 -0.99 2.32 4.06 100 4.59 100 7.93 98 7.02 5.7989 100 9.38 93 14.69 42 15.34 50Lincluden International Equity Pooled Fund 9052
Jul-91 -2.37 4.24 9.77 54 8.76 49 9.15 73 8.07 8.5660 62 10.42 68 13.31 82 14.77 70London Life International Equity Fund (Fleming) 7491
Feb-11 -1.16 3.12 12.18 19 7.68 70 8.16 95 6.86 96 9.46 90 11.65 94 13.66 84Louisbourg EAFE Fund 8758
Nov-87 -1.57 8.45 9.79 50 10.78 18 12.92 11 11.12 12.277 11 14.06 13 16.94 10 18.01 8Mawer International Equity Fund 2276
Jul-99 0.11 8.65 11.93 26 9.15 38 10.77 34 8.85 10.3944 28 11.31 45 14.37 48 15.92 39MFS International Equity Fund 1616
Feb-90 0.00 8.63 10.28 40 7.17 84 9.33 68 8.22 8.6852 57 9.50 88 13.44 78 16.86 19NS Partners International Equity Fund 1820
Dec-00 -1.56 9.69 11.24 32 9.78 31 11.89 17 9.21 11.1932 22 12.45 29 14.29 53 14.51 77PH&N Overseas Equity Fund 875
Feb-92 -0.48 6.28 11.96 24 10.59 22 11.42 23 10.57 10.0013 37 12.75 24 16.66 16 16.34 27Scheer Rowlett EAFE Fund 4232
Aug-97 -0.98 6.34 10.48 36 8.47 56 10.28 45 7.68 9.5163 44 11.29 46 14.14 56 15.13 58SEI EAFE Equity Fund 3952
Dec-03 -1.67 6.86 10.50 36 10.16 27 13.02 9 10.86 11.589 14 14.62 8 19.24 6 19.11 5Setanta EAFE Equity Fund 3280
Sep-04 -3.30 5.23 8.91 70 6.81 88 10.99 30 9.19 10.2333 32 12.48 27 16.91 12 19.08 6Setanta European Equity Fund 6298
Apr-85 -0.83 6.07 12.20 18 10.92 14 9.89 52 8.86 9.0542 50 10.86 58 12.19 90 12.51 90Sprucegrove Canadian International Pooled Fund 4846
Sep-14 1.05 4.89 8.01 81 6.34 93T. Rowe Price International Concentrated Equity Pool 668
RBC INVESTOR & TREASURY SERVICES | POOLED FUND SURVEY | PER IOD ENDING SEPTEMBER 30, 2018 PAGE 34 OF 59

Period ending September 30, 2018 Four year periods ending September 30
Non North American Equity
Fund nameInceptiondate
1 quarter
ROR-% PR
1 year 2 years 3 years 5 years 10 years 2018 2017 2016 2015
ROR-% PR ROR-% PR ROR-% PR ROR-% PR ROR-% PR ROR-% PR ROR-% PR ROR-% PR ROR-% PR
Jun-99 2.69 6.26 12.80 9 9.76 32 7.96 97 6.63 7.2893 90 8.38 98 10.37 97 12.91 86TD Emerald Hedged International Equity Idx Fund Pooled Fund 441
Jul-95 -0.41 6.28 9.76 56 7.94 62 9.38 66 7.60 8.3867 74 10.17 75 13.89 65 14.77 70TD Emerald International Equity Index Fund Passive 4230
Jan-94 -2.17 1.62 8.85 71 6.62 90 8.66 86 7.45 8.0074 78 10.49 63 15.71 30 17.00 18Templeton EAFE Developed Markets Fund 9487
Nov-90 0.05 5.27 10.22 41 7.57 73 8.66 86 7.32 7.0680 94 9.52 88 13.73 70 15.21 54Templeton International Equity Trust 6018
Jul-93 -0.06 5.08 10.17 44 7.48 75 8.78 82 7.31 7.2186 92 9.72 82 14.05 59 15.47 46Templeton International Stock Trust 6421
Fund Count 57 57 57 56 54 46 55 54 58 57
Average Return -0.88 5.89 10.07 8.99 10.47 8.65 9.65 11.66 14.84 15.44
5th Percentile 1.52 11.19 13.50 13.22 13.94 11.49 13.19 15.46 19.75 19.38
1st Quartile -0.30 7.85 11.95 10.35 11.32 9.69 10.80 12.66 15.84 16.39
Median -0.86 6.07 9.79 8.73 9.97 8.29 9.05 11.15 14.34 15.34
3rd Quartile -1.56 4.06 8.54 7.48 9.12 7.43 8.29 10.18 13.55 14.59
95th Percentile -2.87 1.53 6.12 5.93 8.11 6.36 6.99 9.24 11.23 11.87
RBC INVESTOR & TREASURY SERVICES | POOLED FUND SURVEY | PER IOD ENDING SEPTEMBER 30, 2018 PAGE 35 OF 59

Period ending September 30, 2018 Four year periods ending September 30
Emerging Markets
Fund nameInceptiondate
1 quarter
ROR-% PR
1 year 2 years 3 years 5 years 10 years 2018 2017 2016 2015
ROR-% PR ROR-% PR ROR-% PR ROR-% PR ROR-% PR ROR-% PR ROR-% PR ROR-% PR ROR-% PR
Feb-06 -1.39 -3.16 4.31 96 8.63 96 7.34 96 10.42 5.991 92 10.14 78 8.48 58 8.70 16Aberdeen Canada-Emerging Markets Fund 10030
Jun-08 -1.05 6.55 9.00 57 11.32 54 7.84 83 9.37 7.2627 68 8.17 96 5.15 100 4.46 94AGF Emerging Markets Pooled Fund 415
Feb-02 -3.14 2.32 11.19 20 12.96 19 10.29 31 9.90 9.5318 28 12.38 33 9.84 23 9.30 14BlackRock Emerging Markets Opportunities Fund B 5562
Jul-00 -2.83 2.45 9.50 42 11.11 65 8.52 65 7.90 7.3463 64 10.09 79 7.62 64 6.66 68BlackRock MSCI Emerging Markets Fund B 5254
Apr-10 -2.97 -1.20 2.32 100 6.38 100 8.67 61 5.41 100 11.29 57 10.65 13 11.57 10Burgundy Emerging Markets Fund 7859
Jun-13 -1.70 5.31 13.54 1 14.75 4 13.15 4 11.61 4 15.20 1CC&L Q Emerging Markets Equity Fund 1040
Jun-11 -4.76 3.29 11.92 14 11.49 50 8.34 70 7.89 56 9.65 84 7.23 77 7.27 45CI Signature Emerging Markets Fund 4077
Jun-86 -6.28 0.61 9.71 39 10.98 72 7.73 90 7.02 7.1390 80 9.59 86 7.04 81 5.31 85CII Emerging Markets Growth Fund 6793
Apr-09 0.01 -2.55 6.03 84 9.97 81 7.91 79 7.02 84 10.69 69 9.70 27 7.91 30FGP Emerging Markets Equity Fund 927
Dec-07 -5.59 -1.38 4.84 89 8.71 92 8.27 74 6.17 7.26100 72 10.82 66 9.38 32 6.97 60Fidelity Emerging Markets Equity Institutional Trust 8188
Mar-09 -5.11 -1.78 9.29 50 12.65 30 11.18 21 9.44 40 14.68 4 10.73 10 7.92 26Fidelity Select Emerging Markets Equity Institutional Trust 8581
Jun-14 0.42 0.43 6.80 80 11.15 62 7.25 76Guardian Emerging Market Equity Fund 704
Jan-11 -1.67 5.34 9.04 54 8.75 90 7.24 100 5.57 96 7.72 100 5.48 95 5.64 80Hexavest Emerging Markets Fund 838
Oct-10 -6.64 -3.07 7.43 73 11.01 70 9.02 52 7.80 60 12.27 35 8.59 54 7.20 50Integra Emerging Markets Equity Fund 9796
Aug-14 -8.34 -2.30 4.63 92 12.83 23 9.50 32Invesco Select Emerging Markets Equity 89100
Sep-15 -4.52 1.04 7.06 77 9.58 84Jarislowsky Fraser Emerging Markets Fund 6371
Jan-10 -2.82 4.14 10.31 34 13.25 12 10.13 35 9.59 20 11.68 44 8.93 46 6.98 56JP Morgan Emerging Markets Equity - Canada Fund 2252
Feb-11 -0.44 1.20 8.61 65 14.04 8 11.54 14 10.46 12 14.28 9 13.28 2 9.25 14Letko Brosseau Emerging Markets Equity Fund 6011
Jan-17 -2.65 3.97Mawer Emerging Markets Equity Fund 2648
Jan-11 -4.17 4.48 10.93 23 12.73 27 12.09 9 11.14 8 14.08 13 13.60 1 12.76 1NS Partners Emerging Markets 1567
Dec-09 -1.32 3.79 8.27 69 10.53 77 11.39 17 9.76 16 13.38 26 12.98 4 12.45 4RBC Emerging Markets Equity Fund 2926
Jan-95 -2.59 4.16 11.97 12 13.09 16 10.09 38 10.05 9.5510 24 11.63 52 8.64 50 8.47 20Schroder Emerging Market Fund (Canada) 2046
Aug-97 -4.66 -1.04 8.80 62 12.36 35 9.09 48 7.56 8.0373 52 11.78 40 9.32 36 6.65 70SEI Emerging Markets Equity Fund 7574
Nov-99 -1.47 3.32 10.73 30 12.10 39 8.98 56 7.17 8.4382 48 10.44 74 7.58 68 6.37 75SSGA Daily Active Emg Mkt Sec Lending Cmn Trust Fund 3633
RBC INVESTOR & TREASURY SERVICES | POOLED FUND SURVEY | PER IOD ENDING SEPTEMBER 30, 2018 PAGE 36 OF 59

Period ending September 30, 2018 Four year periods ending September 30
Emerging Markets
Fund nameInceptiondate
1 quarter
ROR-% PR
1 year 2 years 3 years 5 years 10 years 2018 2017 2016 2015
ROR-% PR ROR-% PR ROR-% PR ROR-% PR ROR-% PR ROR-% PR ROR-% PR ROR-% PR ROR-% PR
Apr-07 -1.31 3.32 10.80 27 11.18 58 7.80 87 8.36 6.8845 88 8.94 91 5.59 92 6.67 66SSGA Emg Mkts Alpha Select Sec Lending Common Trust Fund 3423
Nov-00 -1.20 2.67 13.34 4 18.01 1 10.50 26 8.54 9.4537 36 12.55 31 7.54 72 3.17 100Templeton Emerging Markets Fund (Canada) 4819
Nov-12 3.38 12.58 12.82 8 11.83 46 13.59 1 12.13 1 13.84 15Triasima ACWE 11
Apr-05 -5.49 2.69 9.39 46 11.92 43 9.81 43 7.94 8.6056 44 11.66 48 9.28 40 7.86 34Wellington MP (Dublin) Emg Markets Equity Portfolio 4686
Fund Count 28 28 27 27 24 12 26 24 23 21
Average Return -2.87 2.04 8.99 11.60 9.60 8.37 8.46 11.61 8.69 7.45
5th Percentile 0.28 6.13 13.18 14.54 12.96 10.21 11.49 14.63 12.66 12.39
1st Quartile -1.32 4.01 10.87 12.78 10.67 9.50 9.55 13.40 9.77 7.97
Median -2.74 2.56 9.29 11.49 9.05 8.15 8.23 11.65 8.64 7.20
3rd Quartile -4.68 -1.07 7.25 10.75 8.18 7.46 7.25 10.37 7.39 6.33
95th Percentile -6.51 -2.89 4.41 8.66 7.41 6.64 5.68 8.30 5.48 4.36
RBC INVESTOR & TREASURY SERVICES | POOLED FUND SURVEY | PER IOD ENDING SEPTEMBER 30, 2018 PAGE 37 OF 59

Period ending September 30, 2018 Four year periods ending September 30
Canadian Bonds
Fund nameInceptiondate
1 quarter
ROR-% PR
1 year 2 years 3 years 5 years 10 years 2018 2017 2016 2015
ROR-% PR ROR-% PR ROR-% PR ROR-% PR ROR-% PR ROR-% PR ROR-% PR ROR-% PR ROR-% PR
Sep-07 -0.41 1.61 0.00 32 2.72 10 4.34 6 6.60 3.322 7 5.03 4 5.52 3 5.92 2AB Core Plus Advanced Bond Fund 7621
Dec-03 -0.70 1.43 -0.38 58 2.29 16 3.81 16 5.44 2.8312 36 4.41 10 4.65 23 4.43 28AB Core Plus Bond Fund 8939
Aug-97 -0.63 2.01 0.18 22 2.17 27 3.45 49 4.39 2.7889 41 3.81 49 4.21 52 3.93 73Addenda Active Duration Bond Pooled Fund 3533
Aug-04 -0.94 2.19 -0.54 68 1.95 51 3.48 46 4.86 2.6742 47 3.80 50 4.37 39 4.24 41Addenda Core Bond Pooled Fund 2281
Mar-93 -0.55 1.83 0.08 28 1.84 60 3.76 22 5.25 2.6518 52 4.25 16 4.70 20 5.20 5AGF Pooled Fixed Income Fund 4627
Dec-93 -0.69 2.23 0.31 18 2.11 33 3.46 47 5.03 2.5628 66 3.78 53 4.16 58 4.07 56Baker Gilmore Bond Fund 1938
Jan-91 -0.79 2.11 -0.30 50 1.97 45 2.68 94 4.34 2.1294 94 2.83 95 3.12 97 2.70 99Beutel Goodman Income Fund 2850
Mar-97 -0.96 1.66 -0.68 86 1.60 83 3.27 74 4.44 2.5180 78 3.67 66 4.11 64 3.92 75BlackRock Canada Universe Bond Index Class A 6889
Oct-89 -0.93 1.79 -0.49 64 1.85 60 3.28 70 4.29 2.5995 62 3.65 72 3.87 89 3.52 93BMO AM Bond Fund 5278
May-91 -0.76 2.04 -0.48 62 1.75 70 3.31 63 4.63 2.6663 48 3.63 80 4.06 75 3.95 71Burgundy Bond Fund 3146
Mar-08 -0.05 2.66 1.50 4 3.39 2 3.83 14 5.53 3.3010 8 4.12 28 4.34 42 4.66 16Burgundy Core Plus Bond Fund 86
Dec-06 -1.35 1.53 -1.21 98 1.57 86 4.60 2 6.13 3.735 2 5.38 1 7.70 1 7.87 1CC&L Universe Bond Alpha Plus Fund 86100
Jan-93 -0.80 1.40 -0.68 88 1.75 70 3.58 38 4.76 2.6752 46 4.13 25 4.84 12 4.75 12CI Signature Canadian Bond Fund 8951
Dec-06 -0.74 1.62 -0.52 65 1.97 45 3.80 18 5.32 2.8715 30 4.35 13 5.19 6 4.97 8CI Signature Canadian Core Bond Fund 7544
Jan-15 -0.73 1.31 -0.56 75 1.97 44CI Signature Core Bond Plus Fund 9242
Dec-15 1.81 6.11 9.39 1CI Signature Preferred Share Pool 11
Dec-11 -0.36 0.78 -0.58 78 0.81 97 2.66 94 1.98 94 3.14 94 3.65 92CIBC Canadian Bond 5 Year Duration Pool 9818
Dec-88 -0.87 1.84 -0.23 46 2.16 28 3.57 40 4.86 2.8542 33 4.01 36 4.34 42 4.13 50CIBC Canadian Bond Active Universe Pool 4667
Feb-96 -0.83 1.81 -0.22 45 2.09 36 3.91 10 5.00 3.0630 15 4.44 9 4.82 13 4.58 20CIBC Canadian Bond Overlay Pool 4958
Oct-94 -0.96 1.73 -0.56 75 1.71 72 3.37 56 4.58 2.6270 56 3.79 52 4.23 50 3.99 68CIBC Canadian Bond Universe Index Pool 6188
Dec-93 -0.90 1.64 -0.91 95 1.43 92 3.10 90 4.54 2.3474 90 3.47 92 4.04 76 4.04 65Cidel Canadian Fixed Income Pooled Fund 7270
Dec-12 -0.92 1.54 -1.02 97 1.45 91 3.24 80 2.46 82 3.67 68Eterna Bond Fund 8574
Oct-06 -0.50 2.44 0.44 16 2.69 10 3.81 16 5.57 3.0910 12 4.16 23 4.41 37 4.57 23Fidelity Canadian Bond Core Plus Institutional Trust 1225
Jul-02 -0.83 2.23 -0.02 36 2.16 28 3.67 30 5.12 2.9023 28 4.03 34 4.37 39 4.43 28Fidelity Canadian Bond Institutional Trust 1960
Jul-98 -1.01 1.78 -0.58 77 1.80 64 3.33 60 4.68 2.5558 68 3.72 60 4.13 63 4.05 62Fiera Capital Active and Strategic Fixed Income - Active Universe Fund 5495
Jan-04 -1.02 1.75 -0.68 88 1.57 86 3.14 90 4.75 2.3554 90 3.49 91 3.90 87 3.94 72Fiera Capital Active and Strategic Fixed Income - Ethical ESG Active Universe Fund 5997
Jan-89 -1.07 1.54 -0.68 87 1.62 80 3.19 86 4.51 2.3378 91 3.61 84 3.95 84 3.80 88Fiera Capital Blended Active Fixed Income Fund 8498
Oct-72 -0.83 2.15 0.11 25 2.21 23 3.73 26 5.04 2.9628 24 4.13 24 4.49 30 4.41 32Fiera Capital Integrated Fixed Income Universe Fund 2463
Nov-06 -0.90 3.14 -0.23 46 2.01 40 3.43 51 5.47 2.7412 44 3.51 90 3.96 82 4.14 50Fiera Capital Tactical Fixed Income Fund 671
Jan-93 -0.62 1.99 -0.01 34 1.77 68 3.31 63 4.66 2.6059 60 3.64 76 4.17 56 4.11 52Foyston, Gordon and Payne Conservative Bond Fund 3732
Aug-86 -0.48 2.87 1.32 6 3.24 3 4.33 6 5.30 3.5316 4 4.69 7 4.67 21 4.50 25Franklin Bissett Core Plus Bond Fund 724
Feb-06 -0.83 1.58 -0.78 93 1.64 76 3.26 78 4.64 2.5361 71 3.68 64 4.16 58 4.05 61GEM Fixed Income Pool 8060
Jul-14 -0.74 2.40 0.62 12 2.46 13 3.05 16Greystone Bond Plus Fund 1344
RBC INVESTOR & TREASURY SERVICES | POOLED FUND SURVEY | PER IOD ENDING SEPTEMBER 30, 2018 PAGE 38 OF 59
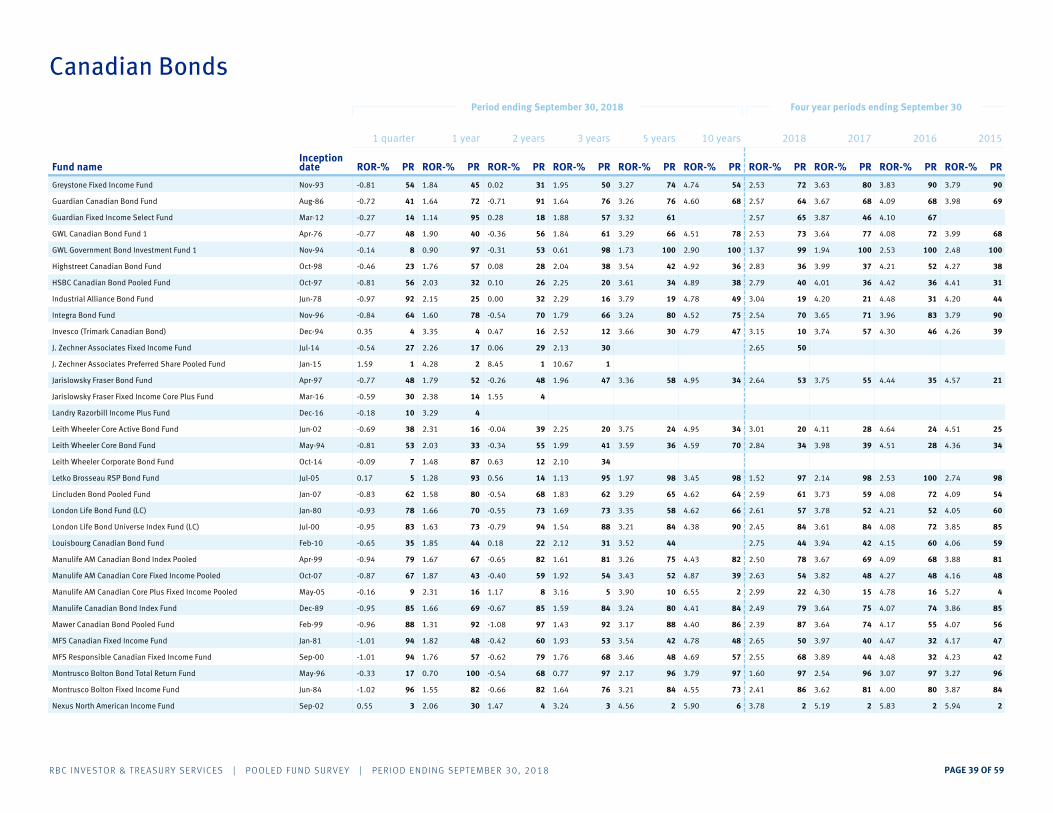
Period ending September 30, 2018 Four year periods ending September 30
Canadian Bonds
Fund nameInceptiondate
1 quarter
ROR-% PR
1 year 2 years 3 years 5 years 10 years 2018 2017 2016 2015
ROR-% PR ROR-% PR ROR-% PR ROR-% PR ROR-% PR ROR-% PR ROR-% PR ROR-% PR ROR-% PR
Nov-93 -0.81 1.84 0.02 31 1.95 50 3.27 74 4.74 2.5354 72 3.63 80 3.83 90 3.79 90Greystone Fixed Income Fund 4554
Aug-86 -0.72 1.64 -0.71 91 1.64 76 3.26 76 4.60 2.5768 64 3.67 68 4.09 68 3.98 69Guardian Canadian Bond Fund 7241
Mar-12 -0.27 1.14 0.28 18 1.88 57 3.32 61 2.57 65 3.87 46 4.10 67Guardian Fixed Income Select Fund 9514
Apr-76 -0.77 1.90 -0.36 56 1.84 61 3.29 66 4.51 2.5378 73 3.64 77 4.08 72 3.99 68GWL Canadian Bond Fund 1 4048
Nov-94 -0.14 0.90 -0.31 53 0.61 98 1.73 100 2.90 1.37100 99 1.94 100 2.53 100 2.48 100GWL Government Bond Investment Fund 1 978
Oct-98 -0.46 1.76 0.08 28 2.04 38 3.54 42 4.92 2.8336 36 3.99 37 4.21 52 4.27 38Highstreet Canadian Bond Fund 5723
Oct-97 -0.81 2.03 0.10 26 2.25 20 3.61 34 4.89 2.7938 40 4.01 36 4.42 36 4.41 31HSBC Canadian Bond Pooled Fund 3256
Jun-78 -0.97 2.15 0.00 32 2.29 16 3.79 19 4.78 3.0449 19 4.20 21 4.48 31 4.20 44Industrial Alliance Bond Fund 2592
Nov-96 -0.84 1.60 -0.54 70 1.79 66 3.24 80 4.52 2.5475 70 3.65 71 3.96 83 3.79 90Integra Bond Fund 7864
Dec-94 0.35 3.35 0.47 16 2.52 12 3.66 30 4.79 3.1547 10 3.74 57 4.30 46 4.26 39Invesco (Trimark Canadian Bond) 44
Jul-14 -0.54 2.26 0.06 29 2.13 30 2.65 50J. Zechner Associates Fixed Income Fund 1727
Jan-15 1.59 4.28 8.45 1 10.67 1J. Zechner Associates Preferred Share Pooled Fund 21
Apr-97 -0.77 1.79 -0.26 48 1.96 47 3.36 58 4.95 2.6434 53 3.75 55 4.44 35 4.57 21Jarislowsky Fraser Bond Fund 5248
Mar-16 -0.59 2.38 1.55 4Jarislowsky Fraser Fixed Income Core Plus Fund 1430
Dec-16 -0.18 3.29Landry Razorbill Income Plus Fund 410
Jun-02 -0.69 2.31 -0.04 39 2.25 20 3.75 24 4.95 3.0134 20 4.11 28 4.64 24 4.51 25Leith Wheeler Core Active Bond Fund 1638
May-94 -0.81 2.03 -0.34 55 1.99 41 3.59 36 4.59 2.8470 34 3.98 39 4.51 28 4.36 34Leith Wheeler Core Bond Fund 3353
Oct-14 -0.09 1.48 0.63 12 2.10 34Leith Wheeler Corporate Bond Fund 877
Jul-05 0.17 1.28 0.56 14 1.13 95 1.97 98 3.45 1.5298 97 2.14 98 2.53 100 2.74 98Letko Brosseau RSP Bond Fund 935
Jan-07 -0.83 1.58 -0.54 68 1.83 62 3.29 65 4.62 2.5964 61 3.73 59 4.08 72 4.09 54Lincluden Bond Pooled Fund 8062
Jan-80 -0.93 1.66 -0.55 73 1.69 73 3.35 58 4.62 2.6166 57 3.78 52 4.21 52 4.05 60London Life Bond Fund (LC) 7078
Jul-00 -0.95 1.63 -0.79 94 1.54 88 3.21 84 4.38 2.4590 84 3.61 84 4.08 72 3.85 85London Life Bond Universe Index Fund (LC) 7383
Feb-10 -0.65 1.85 0.18 22 2.12 31 3.52 44 2.75 44 3.94 42 4.15 60 4.06 59Louisbourg Canadian Bond Fund 4435
Apr-99 -0.94 1.67 -0.65 82 1.61 81 3.26 75 4.43 2.5082 78 3.67 69 4.09 68 3.88 81Manulife AM Canadian Bond Index Pooled 6779
Oct-07 -0.87 1.87 -0.40 59 1.92 54 3.43 52 4.87 2.6339 54 3.82 48 4.27 48 4.16 48Manulife AM Canadian Core Fixed Income Pooled 4367
May-05 -0.16 2.31 1.17 8 3.16 5 3.90 10 6.55 2.992 22 4.30 15 4.78 16 5.27 4Manulife AM Canadian Core Plus Fixed Income Pooled 169
Dec-89 -0.95 1.66 -0.67 85 1.59 84 3.24 80 4.41 2.4984 79 3.64 75 4.07 74 3.86 85Manulife Canadian Bond Index Fund 6985
Feb-99 -0.96 1.31 -1.08 97 1.43 92 3.17 88 4.40 2.3986 87 3.64 74 4.17 55 4.07 56Mawer Canadian Bond Pooled Fund 9288
Jan-81 -1.01 1.82 -0.42 60 1.93 53 3.54 42 4.78 2.6548 50 3.97 40 4.47 32 4.17 47MFS Canadian Fixed Income Fund 4894
Sep-00 -1.01 1.76 -0.62 79 1.76 68 3.46 48 4.69 2.5557 68 3.89 44 4.48 32 4.23 42MFS Responsible Canadian Fixed Income Fund 5794
May-96 -0.33 0.70 -0.54 68 0.77 97 2.17 96 3.79 1.6097 97 2.54 96 3.07 97 3.27 96Montrusco Bolton Bond Total Return Fund 10017
Jun-84 -1.02 1.55 -0.66 82 1.64 76 3.21 84 4.55 2.4173 86 3.62 81 4.00 80 3.87 84Montrusco Bolton Fixed Income Fund 8296
Sep-02 0.55 2.06 1.47 4 3.24 3 4.56 2 5.90 3.786 2 5.19 2 5.83 2 5.94 2Nexus North American Income Fund 303
RBC INVESTOR & TREASURY SERVICES | POOLED FUND SURVEY | PER IOD ENDING SEPTEMBER 30, 2018 PAGE 39 OF 59

Period ending September 30, 2018 Four year periods ending September 30
Canadian Bonds
Fund nameInceptiondate
1 quarter
ROR-% PR
1 year 2 years 3 years 5 years 10 years 2018 2017 2016 2015
ROR-% PR ROR-% PR ROR-% PR ROR-% PR ROR-% PR ROR-% PR ROR-% PR ROR-% PR ROR-% PR
Apr-79 -0.66 1.88 -0.03 38 2.27 18 3.77 21 5.14 3.0521 17 4.25 17 4.53 28 4.49 25Northern Trust Asset Mgmt. Canadian Fixed Income Fund 4135
Jan-90 -0.71 2.16 -0.03 38 2.38 14 4.02 8 4.95 3.2332 9 4.49 8 5.13 7 4.42 29Optimum Universe Canadian Bonds 2440
Dec-05 -0.79 1.73 -0.30 52 2.19 24 3.85 13 5.11 2.9926 22 4.38 11 4.85 11 4.56 23Optimum Universe Quantitative Canadian Bonds 6250
Jan-06 -0.26 0.79 -2.12 100 -1.88 100 1.94 98 4.36 1.1891 100 2.23 98 3.24 96 4.72 13Perennial Fixed Income Portfolio 9813
Dec-70 -0.92 1.79 -0.48 62 1.95 49 3.65 31 5.13 2.8722 30 4.12 27 4.65 22 4.39 33PH&N Bond Fund 5276
Jun-13 -0.95 1.91 0.23 20 2.92 8 4.38 4 3.56 4 5.01 4PH&N Core Plus Bond Fund 4084
Mar-08 -0.90 1.95 -0.26 48 2.25 20 3.87 12 5.22 3.0618 14 4.36 12 4.93 9 4.70 15PH&N Enhanced Total Return Bond Fund 3870
Jul-00 -0.92 1.78 -0.39 58 2.10 35 3.74 24 5.12 2.9424 25 4.24 20 4.79 16 4.58 20PH&N Total Return Bond Fund 5473
Jul-11 -0.21 1.26 0.15 23 1.39 94 2.92 92 2.32 92 3.34 93 3.62 92 4.09 54QV Canadian Bond Fund 9411
Sep-02 -0.92 1.72 -0.54 70 1.89 56 3.58 38 4.86 2.8041 38 4.05 32 4.58 26 4.25 40RBC Vision Bond Fund 6274
Feb-99 -0.44 3.49 0.77 11 2.92 8 4.83 1 6.71 4.001 1 5.16 2 6.36 1 6.47 1Ridgewood Canadian Bond Fund 322
Jan-92 -0.81 2.02 -0.02 35 1.98 42 3.29 66 4.81 2.4745 82 3.61 84 3.91 87 3.71 92Scheer Rowlett Bond Fund 3454
Feb-15 -0.30 2.07 1.03 9 3.06 6Scotia Institutional Canadian Investment Grade Corporate Bond Fund 2915
Jan-10 -0.59 1.54 -0.55 72 1.79 66 3.72 27 3.06 14 4.27 15 4.87 10 4.43 28Scotia Institutional Tactical Bond Fund 8430
Jul-97 -0.39 2.15 -0.11 42 1.89 56 3.37 56 4.62 2.8065 39 3.68 62 3.93 85 4.05 64SEAMARK Canadian Bond Pooled Fund 2620
Aug-97 -0.82 1.73 -0.30 50 1.95 50 3.43 52 4.77 2.6151 58 3.86 47 4.34 43 4.32 36SEI Canadian Fixed Income Fund 6058
Aug-91 -0.97 1.60 -0.76 92 1.50 89 3.18 87 4.34 2.4394 85 3.58 88 4.02 78 3.81 87TD Emerald Canadian Bond Index Fund 7791
May-97 -0.94 1.70 -0.64 81 1.61 82 3.27 71 4.43 2.5181 76 3.67 67 4.10 66 3.90 77TD Emerald Canadian Bond Pooled Fund Trust Passive 6582
Sep-07 -0.57 2.19 -0.09 41 2.19 24 3.59 36 5.90 2.856 32 3.94 42 4.65 23 5.03 7TD Emerald Canadian Core Plus Bond Pooled Fund Trust 2229
Jan-16 -0.32 2.45 1.32 6Triasima Bond Fund 1116
Jul-12 -0.86 2.62 -0.11 42 2.02 39 3.63 32 2.91 27 3.88 45 4.15 59Wellington MP (Canada) Canada Universe Bond Plus 966
Apr-97 -0.96 1.68 -0.66 83 1.62 80 3.28 69 4.40 2.5286 75 3.68 62 4.10 66 3.87 84WindWise Canadian Universe Bond Index Securities Lending Fund 6686
Fund Count 88 88 87 84 78 70 80 76 82 76
Average Return -0.63 1.95 0.04 2.04 3.46 4.86 2.70 3.87 4.32 4.25
5th Percentile 0.11 3.20 1.40 3.14 4.35 6.07 3.47 4.94 5.27 5.19
1st Quartile -0.50 2.15 0.11 2.18 3.74 5.11 2.94 4.13 4.61 4.51
Median -0.79 1.80 -0.30 1.95 3.44 4.77 2.65 3.81 4.22 4.13
3rd Quartile -0.92 1.62 -0.56 1.66 3.26 4.53 2.52 3.64 4.06 3.91
95th Percentile -1.01 1.14 -0.88 1.15 2.44 4.25 1.87 2.91 3.34 3.34
RBC INVESTOR & TREASURY SERVICES | POOLED FUND SURVEY | PER IOD ENDING SEPTEMBER 30, 2018 PAGE 40 OF 59

Period ending September 30, 2018 Four year periods ending September 30
Global Bonds
Fund nameInceptiondate
1 quarter
ROR-% PR
1 year 2 years 3 years 5 years 10 years 2018 2017 2016 2015
ROR-% PR ROR-% PR ROR-% PR ROR-% PR ROR-% PR ROR-% PR ROR-% PR ROR-% PR ROR-% PR
Nov-10 -1.49 -0.04 0.93 1 3.43 13 6.10 42 4.66 42 7.69 34 7.56 40 8.28 1AGF Emerging Markets Bond Fund 6225
May-11 -3.15 0.01 -3.89 100 0.23 88 4.97 57 4.19 57 6.25 60 8.85 1 7.28 47CI Signature Global Bond Fund 50100
Jan-95 -1.87 1.79 0.83 50 2.71 62 6.48 28 7.02 4.851 28 7.68 50 8.78 1 8.23 20GWL International Bond Fund 138
Mar-11 -1.19 -3.74 -0.68 75 3.38 24 3.32 100 2.26 86 5.17 82 4.57 100 4.88 100HSBC Emerging Markets Debt Fund 10013
Jun-13 -2.21 -0.46 0.83 37 3.81 1 6.78 1 5.34 1 8.67 1Legg Mason Brandywine Global Opportunistic Fixed Income Fund 7463
Sep-05 -1.87 1.25 0.84 26 2.72 50 6.48 16 6.99 4.8532 16 7.83 17 8.78 20 8.23 40LM Brandywine Global Fixed Income Investment Grade Fund 2550
Jun-15 -2.39 1.41 -1.84 87 -0.58 100Mawer Global Bond Fund 1376
Jul-91 -0.76 0.85 0.07 63 2.94 38 4.22 72 5.09 3.37100 71 5.07 100 5.91 60 5.40 80RBC Global Bond Fund 371
Jul-88 -2.45 -1.83 0.87 13 2.11 74 3.74 86 6.42 2.1366 100 5.18 68 5.39 80 5.67 60Templeton Global Bond Fund 8786
Fund Count 9 9 9 9 8 4 8 7 6 6
Average Return -1.93 -0.08 -0.23 2.31 5.26 6.38 3.96 6.76 6.83 6.78
5th Percentile -0.93 1.64 0.91 3.66 6.67 7.01 5.17 8.42 8.78 8.27
1st Quartile -1.49 1.24 0.84 3.37 6.48 7.00 4.85 7.76 8.47 8.23
Median -1.87 0.01 0.83 2.72 5.53 6.71 4.43 7.68 6.73 6.95
3rd Quartile -2.39 -0.50 -0.69 2.06 4.10 6.09 3.10 5.17 5.52 5.47
95th Percentile -2.87 -2.98 -3.07 -0.26 3.47 5.29 2.18 5.10 4.77 5.01
RBC INVESTOR & TREASURY SERVICES | POOLED FUND SURVEY | PER IOD ENDING SEPTEMBER 30, 2018 PAGE 41 OF 59

Period ending September 30, 2018 Four year periods ending September 30
Corporate Bonds
Fund nameInceptiondate
1 quarter
ROR-% PR
1 year 2 years 3 years 5 years 10 years 2018 2017 2016 2015
ROR-% PR ROR-% PR ROR-% PR ROR-% PR ROR-% PR ROR-% PR ROR-% PR ROR-% PR ROR-% PR
Oct-06 -0.39 2.27 0.96 74 2.79 88 3.93 79 5.83 3.1460 86 4.35 72 4.69 54 5.16 54Addenda Corporate Core Bond Pooled Fund 6656
Feb-13 -1.48 3.38 1.13 60 3.97 26 5.48 15 4.20 26 6.02 15Addenda Infrastructure Bond Pooled Fund 1595
Oct-99 -0.70 2.36 0.55 94 2.86 84 3.29 100 4.95 2.71100 100 3.53 100 3.49 100 3.05 100Beutel Goodman Corp/Prov Active Bond Fund 6090
Dec-14 -0.20 1.47 2.01 25 4.34 17CI Investment Grade Bond Fund 10030
Jan-02 1.06 3.88 4.97 1 6.40 1 6.39 7 7.92 5.571 7 7.02 7 7.04 14 8.06 18CI Signature Corporate Bond Fund 61
Dec-11 -0.50 2.57 1.94 34 3.42 40 4.47 36 3.75 40 4.95 35 5.35 31CIBC Canadian Bond Corp. Investment Grade Pool 4570
Jun-03 0.16 3.21 2.90 15 3.98 24 5.18 28 7.46 4.2220 14 5.68 28 6.06 23 6.69 27FGP Corporate Plus Bond Fund 2010
Dec-05 -0.55 2.02 1.21 55 3.02 72 4.01 64 6.16 3.3040 73 4.51 64 4.67 61 4.83 82Fiera Capital Corporate Universe Bond Fund 8075
Feb-12 -0.35 2.59 1.46 46 3.09 56 3.94 72 3.23 80 4.28 79 4.37 77Fiera Capital Integrated Credit Fund 4050
May-09 -0.16 2.53 1.97 30 2.98 77 4.14 57 3.38 60 4.55 58 4.54 69 5.04 64Foyston Gordon & Payne Corporate Bond Fund 5025
Dec-06 -0.04 2.47 2.03 20 3.68 33 4.38 43 5.73 3.6180 47 4.87 36 4.78 46 5.03 72Franklin Bissett Corporate Bond Fund 5516
Apr-11 -0.30 2.89 1.80 40 3.19 50 3.93 84 3.36 66 4.19 85 4.27 85 4.51 91Greystone Corporate Bond Fund 3040
Mar-16 -0.40 1.89 0.77 80Jarislowsky Fraser Corporate Bond Fund 8560
Oct-14 -0.09 1.48 0.63 85 2.10 100Leith Wheeler Corporate Bond Fund 9620
Jan-09 0.68 3.07 3.81 10 4.97 11 5.36 21 4.21 20 5.95 21 7.16 8 8.93 9Pembroke Corporate Bond Fund 255
Jun-11 -0.63 2.25 1.02 70 3.05 66 4.22 50 3.50 53 4.71 50 5.06 38 5.19 46PH&N Corporate Bond Trust 7085
Nov-09 -0.24 5.52 4.83 4 5.82 5 8.13 1 6.52 1 8.79 1 10.80 1 12.09 1Ridgewood Canadian Investment Grade Bond Fund 135
Feb-15 -0.30 2.07 1.03 66 3.06 62Scotia Institutional Canadian Investment Grade Corporate Bond Fund 7644
Apr-16 -2.56 3.78 -0.07 100Sun Life Long Term Private Fixed Income Plus Fund 10100
Mar-14 -0.60 2.82 1.39 50 3.38 44 4.07 33Sun Life Private Fixed Income Plus Fund 3480
Aug-10 -0.42 1.76 0.56 90 2.41 95 3.47 93 2.78 94 3.90 93 4.22 92 4.62 90TD Emerald Active Canadian Corporate Bond PFT 9064
Fund Count 21 21 21 19 15 6 16 15 14 12
Average Return -0.38 2.68 1.76 3.61 4.69 6.34 3.85 5.14 5.49 6.11
5th Percentile 0.67 4.04 4.74 5.86 6.91 7.81 5.81 7.55 8.58 9.88
1st Quartile -0.15 3.07 2.01 3.98 5.27 7.13 4.20 5.81 5.87 7.03
Median -0.35 2.53 1.39 3.19 4.22 5.99 3.55 4.71 4.74 5.17
3rd Quartile -0.55 2.08 0.95 3.00 3.94 5.75 3.28 4.32 4.41 4.98
95th Percentile -1.51 1.51 0.49 2.38 3.42 5.15 2.76 3.79 3.96 3.91
RBC INVESTOR & TREASURY SERVICES | POOLED FUND SURVEY | PER IOD ENDING SEPTEMBER 30, 2018 PAGE 42 OF 59

Period ending September 30, 2018 Four year periods ending September 30
High Yield Bonds
Fund nameInceptiondate
1 quarter
ROR-% PR
1 year 2 years 3 years 5 years 10 years 2018 2017 2016 2015
ROR-% PR ROR-% PR ROR-% PR ROR-% PR ROR-% PR ROR-% PR ROR-% PR ROR-% PR ROR-% PR
Aug-05 1.02 3.73 4.63 74 5.98 83 4.69 90 6.95 4.3180 90 4.94 91 4.85 90 5.90 88Burgundy Total Return Bond Fund 5850
Jun-12 0.92 2.39 2.20 100 3.69 100 3.64 100 2.34 100 3.95 100 4.36 100CC&L High Yield Bond Fund Series I 8366
Jan-12 1.86 5.33 7.17 9 8.58 9 7.97 10 7.16 18 8.64 8 8.37 9CI Signature High Yield Bond II Fund 259
Jun-99 1.66 2.68 5.67 50 7.56 26 5.36 64 8.37 4.6220 72 6.05 56 5.67 60 7.01 50Fiera Capital High Yield 6832
Jun-09 0.67 4.49 11.02 1 14.08 1 7.10 26 8.99 1 7.76 16 4.76 92 0.99 100Fulcra Credit Opportunities Fund 4183
Apr-08 1.71 3.79 4.66 68 6.45 59 5.31 72 7.70 4.7060 64 5.69 81 5.54 70 5.82 100Greystone High Yield Bond Fund 5024
Jun-00 0.59 6.16 5.77 42 6.30 74 6.05 45 8.58 4.331 82 6.03 63 6.72 20 7.88 26Guardian High Yield Bond Fund 1791
Oct-99 2.56 2.14 3.47 91 4.88 92 5.06 82 5.33 4.93100 55 5.80 73 5.97 50 6.69 63Invesco (Trimark Global HY) 911
May-15 0.92 2.65 6.11 25 7.52 32Leith Wheeler High Yield Bond Fund (CAD Hedged) 7460
Aug-00 1.10 4.54 6.75 16 8.19 16 6.49 36 8.37 6.1740 36 6.98 36 6.27 30 6.48 75PH&N High Yield Bond Fund 3442
Oct-10 1.73 1.62 4.00 83 6.64 42 5.61 55 5.21 46 6.63 45 6.14 40 7.17 38RBC High Yield Bond Fund 10018
Mar-11 -0.07 7.14 5.86 34 6.39 67 7.21 19 6.22 28 7.23 27 7.33 14 7.63 29Ridgewood Tactical Yield Fund 1100
Sep-13 0.71 7.10 5.39 58 6.60 50 10.44 1 8.92 8 11.30 1 13.53 1 14.69 1SEI US High Yield Bond Fund 876
Fund Count 13 13 13 13 12 6 12 12 11 9
Average Return 1.18 4.14 5.59 7.14 6.24 7.55 5.66 6.69 6.53 8.27
5th Percentile 2.14 7.11 8.71 10.78 9.08 8.53 8.95 9.54 10.65 13.95
1st Quartile 1.71 5.33 6.13 7.60 7.13 8.37 6.45 7.33 6.50 8.05
Median 1.02 3.79 5.67 6.60 5.83 8.03 5.07 6.34 5.97 7.01
3rd Quartile 0.72 2.64 4.59 6.29 5.25 7.14 4.55 5.78 5.28 6.47
95th Percentile 0.33 1.93 2.96 4.40 4.22 5.74 3.42 4.49 4.61 5.85
RBC INVESTOR & TREASURY SERVICES | POOLED FUND SURVEY | PER IOD ENDING SEPTEMBER 30, 2018 PAGE 43 OF 59

Period ending September 30, 2018 Four year periods ending September 30
Long Duration Bonds
Fund nameInceptiondate
1 quarter
ROR-% PR
1 year 2 years 3 years 5 years 10 years 2018 2017 2016 2015
ROR-% PR ROR-% PR ROR-% PR ROR-% PR ROR-% PR ROR-% PR ROR-% PR ROR-% PR ROR-% PR
May-05 -2.24 3.62 -1.54 74 2.82 91 5.26 93 5.88 4.04100 82 5.68 92 5.97 80 5.09 96Addenda Active Duration Govt Long Bond Pooled Fund 6011
May-05 -1.80 4.20 1.44 1 5.02 6 6.43 14 8.56 4.836 13 6.99 11 6.70 18 6.80 8Addenda Corporate Long Bond Pooled Fund 121
May-99 -2.40 3.92 -1.13 32 3.50 31 4.91 96 6.54 3.5680 97 5.15 97 5.17 100 4.45 100Beutel Goodman Long Term Bond Fund 2741
Jul-98 -2.44 3.59 -1.30 59 3.14 73 5.54 70 6.55 4.1878 68 6.03 70 5.96 82 5.32 80BlackRock Canada Long Bond Index Class A 6756
Nov-06 -2.87 3.38 -1.95 83 3.10 79 7.16 10 8.52 5.578 10 8.13 7 10.10 4 9.84 4CC&L Long Bond Alpha Plus Fund 9490
Apr-99 -2.39 3.50 -1.44 71 3.23 60 5.72 49 7.05 4.2838 53 6.29 32 6.64 21 6.06 20CC&L Long Bond Fund 8033
May-16 -2.36 3.32 -1.65 77CI Signature Long Bond Fund 9624
Dec-11 -2.44 3.64 -1.67 78 2.96 88 6.32 16 4.63 18 7.00 11 7.29 14CIBC Canadian Bond 15 Year Duration Pool 5664
Dec-11 -5.55 7.45 -4.44 96 4.56 9 8.83 4 6.76 4 9.18 4 8.10 10CIBC Canadian Bond 30 Year Duration Pool 196
Feb-00 -2.41 3.72 -1.21 44 3.21 63 5.64 60 6.80 4.2548 59 6.12 55 6.15 52 5.59 44CIBC Canadian Bond Long Term Index Pool 5047
Oct-08 -1.96 4.03 -0.34 4 4.02 15 5.79 34 4.44 28 6.24 40 5.97 78 5.62 42Fidelity Canadian Long Bond Core Plus Institutional Trust 213
Jul-06 -2.29 4.02 -0.71 11 3.54 25 5.79 34 7.07 4.4134 38 6.24 38 6.12 57 5.75 37Fidelity Canadian Long Bond Institutional Trust 2215
Jul-10 -2.46 3.53 -1.29 56 3.17 67 5.45 80 4.02 84 5.93 81 5.94 86 5.47 72Fiera Capital Active and Strategic Fixed Income - Active Long Fund 7770
May-07 -2.23 3.62 -0.70 10 3.50 28 5.90 20 7.15 4.4219 32 6.47 16 6.30 40 5.89 24Greystone Long Bond Fund 6010
Aug-04 -2.45 3.79 -1.06 29 3.50 33 5.72 51 6.80 4.3952 43 6.21 45 6.14 55 5.51 56Industrial Alliance Long Term Bond Fund 3867
Apr-13 -2.31 3.74 -0.79 15 3.81 18 5.70 54 4.24 62 6.20 46Jarislowsky Fraser Long Term Bond Fund 4420
Dec-05 -2.18 4.15 -1.03 26 3.36 48 5.78 42 6.85 4.3544 48 6.19 50 6.31 38 5.80 34Leith Wheeler Long Active Bond Fund 146
Jul-04 -2.30 3.78 -1.23 47 3.25 52 5.64 59 6.71 4.2658 57 6.11 56 6.22 45 5.66 40Leith Wheeler Long Bond Fund 4018
Jul-00 -2.39 3.46 -1.20 40 3.08 82 5.33 90 6.50 3.9585 93 5.81 88 5.63 93 5.15 92London Life Long Term Bond Fund (LC) 8538
Oct-07 -2.40 3.73 -1.24 50 3.24 55 5.77 44 7.19 4.4016 41 6.29 30 6.51 28 6.37 16Manulife AM CDN Long Duration Fixed Income Pooled Fund 4744
Feb-98 -2.53 4.06 -1.02 24 3.50 36 5.87 26 7.11 4.3428 50 6.32 26 6.49 30 5.76 36MFS Canadian Long Term Fixed Income Fund 1878
Sep-14 -2.38 3.80 -0.99 21 3.69 21 4.67 16PH&N Enhanced Long Bond Pension Trust 3629
Apr-98 -2.39 3.68 -1.18 36 3.43 42 5.87 28 7.14 4.5024 22 6.42 19 6.53 24 5.85 32PH&N Long Bond Pension Trust 5336
Jul-15 -2.49 3.85 -0.55 6 4.27 12PH&N Long Core Plus Bond Fund 3274
May-03 -2.77 0.91 -4.44 96 0.08 100 4.15 100 5.94 2.6796 100 4.97 100 5.46 96 5.58 48SEI Long Duration Bond Fund 10088
Sep-07 -5.19 6.39 -3.12 91 5.40 4 8.83 6 8.92 6.741 6 9.44 4 8.30 8 6.38 12TD Emerald 20+ Strip Bond Pooled Fund Trust Passive 695
Mar-12 -2.44 3.48 -1.33 67 3.23 58 5.50 77 4.11 78 6.00 74 6.17 49TD Emerald Active Canadian Long Bond Pooled Fund Trust 8261
Jul-10 -2.60 3.41 -2.03 86 2.62 94 5.36 84 4.01 88 5.85 85 6.02 68 5.30 84TD Emerald Canadian Long Government Bond PFT 8983
Sep-97 -2.43 3.60 -1.31 62 3.07 84 5.51 74 6.62 4.1571 75 6.00 77 6.00 73 5.45 76TD Emerald Cdn Long Bond Pooled Fund Trust Passive 6553
May-06 -2.42 3.57 -1.32 65 3.12 76 5.55 68 6.67 4.1762 72 6.05 67 6.10 59 5.53 52TD Emerald CDN LT Bond Broad Market PFT Passive 7250
RBC INVESTOR & TREASURY SERVICES | POOLED FUND SURVEY | PER IOD ENDING SEPTEMBER 30, 2018 PAGE 44 OF 59

Period ending September 30, 2018 Four year periods ending September 30
Long Duration Bonds
Fund nameInceptiondate
1 quarter
ROR-% PR
1 year 2 years 3 years 5 years 10 years 2018 2017 2016 2015
ROR-% PR ROR-% PR ROR-% PR ROR-% PR ROR-% PR ROR-% PR ROR-% PR ROR-% PR ROR-% PR
Jan-10 -8.46 6.91 -7.80 100 6.74 1 13.72 1 9.59 1 15.49 1 15.11 1 11.80 1TD Emerald Long Bond Overlay PFT 3100
Mar-11 -2.52 3.90 -1.19 39 3.47 39 5.89 22 4.49 24 6.39 22 6.38 35 5.50 60TD Emerald Provincial Long Bond PFT 2977
Jul-10 -2.36 4.50 -0.90 18 3.37 46 5.78 40 4.42 34 6.10 58 6.02 66 5.85 28Wellington MP (Canada) Canada Long Bond Plus Portfolio 1026
Oct-06 -2.44 3.57 -1.29 54 3.15 70 5.56 65 6.66 4.1866 66 6.06 63 6.06 62 5.50 64WindWise Canadian Long Term Bond Index Non-Lending Fund 7260
Jul-02 -2.61 3.40 -2.04 88 2.60 96 5.34 88 6.21 4.0091 90 5.83 87 5.99 76 5.28 88WindWise Canadian Long Term Bond Index Non-Lending Fund 9184
Fund Count 35 35 35 34 32 22 33 28 30 26
Average Return -2.74 3.92 -1.57 3.46 6.11 6.97 4.58 6.61 6.72 6.02
5th Percentile -2.11 6.52 -0.48 5.15 8.83 8.58 6.75 8.98 9.29 9.08
1st Quartile -2.36 3.97 -1.03 3.54 5.87 7.13 4.48 6.34 6.53 5.88
Median -2.42 3.72 -1.24 3.31 5.72 6.80 4.34 6.19 6.16 5.56
3rd Quartile -2.51 3.55 -1.59 3.12 5.51 6.57 4.14 6.00 5.99 5.45
95th Percentile -5.25 3.36 -4.41 2.61 5.10 5.97 3.79 5.34 5.54 5.11
RBC INVESTOR & TREASURY SERVICES | POOLED FUND SURVEY | PER IOD ENDING SEPTEMBER 30, 2018 PAGE 45 OF 59

Period ending September 30, 2018 Four year periods ending September 30
Real Return Bonds
Fund nameInceptiondate
1 quarter
ROR-% PR
1 year 2 years 3 years 5 years 10 years 2018 2017 2016 2015
ROR-% PR ROR-% PR ROR-% PR ROR-% PR ROR-% PR ROR-% PR ROR-% PR ROR-% PR ROR-% PR
Jul-98 -2.20 4.91 -1.45 83 1.78 66 3.62 50 5.02 2.161 100 3.30 50 2.18 57 2.70 40BlackRock Canada Real Return Bond Index Class A 66100
Jan-11 -2.11 5.05 -1.33 18 1.90 18 3.65 18 2.25 18 3.31 34 2.22 30 2.72 19Greystone Real Return Bond Fund 1832
Dec-03 -2.20 4.87 -1.45 68 1.78 50 3.61 82 4.98 2.1774 82 3.30 67 2.15 84 2.64 80Manulife Asset Management Real Return Bond Fund 8383
Jun-09 -2.01 5.67 -0.81 1 2.48 1 4.49 1 3.13 1 4.19 1 2.77 14 3.01 1PH&N Inflation-Linked Bond Fund 11
May-03 -2.11 4.72 -1.37 33 1.78 82 3.39 100 4.82 2.18100 50 3.06 100 1.88 100 2.44 100SEI Real Return Bond Fund 10018
Jan-01 -2.19 4.94 -1.41 50 1.81 34 3.65 33 5.02 2.2024 34 3.32 18 2.20 43 2.71 20TD Emerald CDN Real Rtrn Bond Pooled Fund Trust Passive 3450
Apr-03 -2.20 4.91 -1.45 100 1.77 100 3.61 67 4.99 2.1750 68 3.29 82 2.15 72 2.66 60WindWise Canadian Real Return Bond Index Non-Lending Fund 5068
Fund Count 7 7 7 7 7 5 7 7 8 6
Average Return -2.15 5.01 -1.32 1.90 3.72 4.97 2.32 3.40 2.37 2.69
5th Percentile -2.04 5.48 -0.97 2.30 4.24 5.02 2.86 3.93 3.17 2.94
1st Quartile -2.11 5.00 -1.35 1.85 3.65 5.02 2.22 3.32 2.35 2.71
Median -2.19 4.91 -1.41 1.78 3.62 4.99 2.18 3.30 2.19 2.68
3rd Quartile -2.20 4.89 -1.45 1.78 3.61 4.98 2.17 3.29 2.15 2.65
95th Percentile -2.20 4.76 -1.45 1.77 3.45 4.85 2.16 3.13 1.97 2.49
RBC INVESTOR & TREASURY SERVICES | POOLED FUND SURVEY | PER IOD ENDING SEPTEMBER 30, 2018 PAGE 46 OF 59

Period ending September 30, 2018 Four year periods ending September 30
Short Term Bonds
Fund nameInceptiondate
1 quarter
ROR-% PR
1 year 2 years 3 years 5 years 10 years 2018 2017 2016 2015
ROR-% PR ROR-% PR ROR-% PR ROR-% PR ROR-% PR ROR-% PR ROR-% PR ROR-% PR ROR-% PR
Jul-06 0.16 1.08 0.44 66 1.14 69 1.82 85 3.22 1.5850 71 2.01 82 2.44 82 2.40 83Beutel Goodman Short-Term Bond Fund 6424
Jun-13 0.01 0.97 0.21 100 1.01 88 1.84 79 1.48 86 2.06 78CC&L Short Term Bond Fund 8982
May-76 0.17 1.23 0.73 30 1.20 56 2.04 50 2.73 1.66100 50 2.24 59 2.60 59 2.73 41CI Signature Short-Term Bond Fund 3518
Sep-00 0.12 1.12 0.53 58 1.21 50 1.92 71 3.09 1.6180 57 2.12 65 2.52 70 2.50 77Fiera Capital Integrated Fixed Income Short Term Fund 5347
Jun-10 0.20 1.42 0.82 18 1.23 44 1.93 65 1.56 78 2.06 72 2.59 60 2.77 33Foyston, Gordon and Payne Short Term Bonds 2312
Dec-03 0.22 1.91 1.63 1 2.18 1 2.65 1 3.55 2.3520 1 2.83 8 2.98 20 3.01 9Franklin Bissett Canadian Short Term Bond Fund 66
Apr-15 0.13 1.21 0.57 48 1.06 81Greystone Short Bond Fund 4142
Apr-15 0.30 2.31 1.55 5 2.07 6Greystone Short Bond Plus Fund 11
Aug-13 0.12 1.04 0.55 53 1.27 38 2.10 36 1.78 29 2.36 36Guardian Short Duration Bond Fund 7153
Feb-10 0.05 1.01 0.34 94 1.00 93 1.76 92 1.45 92 1.95 86 2.48 80 2.58 67Highstreet Canadian Short Term Bond Fund 7770
Dec-97 0.14 1.45 0.71 36 1.37 31 2.16 28 3.17 1.8870 20 2.34 42 2.72 40 2.71 45Industrial Alliance Short Term Bond Fund 1735
Dec-15 -0.13 1.15 0.38 88Jarislowsky Fraser Short/Mid Bond Fund 4794
Mar-05 -0.05 0.96 0.39 82 1.13 74 2.02 56 3.18 1.5960 65 2.29 50 2.67 50 2.69 55MFS Canadian Short Term Fixed Income Fund 9488
Jan-01 0.11 1.48 0.96 12 1.80 13 2.53 7 3.62 2.1610 7 2.79 14 3.08 1 2.93 13Optimum Short Term Active Bonds 1258
Dec-93 0.03 1.09 0.40 77 1.19 62 2.04 44 3.36 1.6930 43 2.27 56 2.79 30 2.79 23PH&N Short Term Bond & Mortgage Fund 6077
Sep-02 -0.54 0.53 0.78 23 1.57 19 2.17 22 3.86 1.721 36 2.58 22 3.04 10 2.96 11QV Investors Canadian Income Fund 100100
Jun-87 0.06 1.00 0.44 70 0.80 100 1.37 100 2.75 1.0390 100 1.46 100 1.86 100 2.00 100Scheer Rowlett Short Term Bond Fund 8266
Mar-13 0.15 1.25 0.70 40 1.48 25 2.26 15 3.34 1.8840 16 2.51 28 3.05 1 3.22 1SEI Short Term Bond Fund 3029
Fund Count 18 18 18 17 15 11 15 15 11 10
Average Return 0.07 1.23 0.68 1.34 2.04 3.26 1.69 2.31 2.64 2.65
5th Percentile 0.23 1.97 1.56 2.09 2.56 3.74 2.22 2.92 3.04 3.10
1st Quartile 0.16 1.37 0.77 1.47 2.17 3.46 1.83 2.55 2.88 2.78
Median 0.12 1.13 0.56 1.21 2.04 3.22 1.66 2.29 2.67 2.70
3rd Quartile 0.03 1.02 0.41 1.13 1.88 3.13 1.57 2.06 2.50 2.52
95th Percentile -0.20 0.89 0.32 0.96 1.65 2.74 1.32 1.75 2.09 2.12
RBC INVESTOR & TREASURY SERVICES | POOLED FUND SURVEY | PER IOD ENDING SEPTEMBER 30, 2018 PAGE 47 OF 59

Period ending September 30, 2018 Four year periods ending September 30
Money Market
Fund nameInceptiondate
1 quarter
ROR-% PR
1 year 2 years 3 years 5 years 10 years 2018 2017 2016 2015
ROR-% PR ROR-% PR ROR-% PR ROR-% PR ROR-% PR ROR-% PR ROR-% PR ROR-% PR ROR-% PR
Oct-01 0.46 1.53 1.24 18 1.12 18 1.14 12 1.29 1.124 14 1.04 15 1.10 18 1.18 25Addenda Money Market Liquidity Pooled Fund 198
Jan-91 0.43 1.53 1.18 33 1.07 30 1.10 26 1.11 1.0736 32 0.99 33 1.08 24 1.17 32Beutel Goodman Money Market Fund 2226
Sep-97 0.31 1.09 0.79 92 0.67 92 0.72 89 0.81 0.6892 92 0.63 89 0.75 89 0.90 86BlackRock CDN Short Term Index Class A 9389
Oct-89 0.43 1.46 1.22 26 1.09 24 1.09 33 1.14 1.0928 22 0.99 29 1.04 40 1.11 57BMO AM Money Market Fund 3430
Jan-92 0.41 1.43 1.17 36 1.06 36 1.08 36 1.12 1.0632 36 1.00 26 1.07 35 1.16 35CC&L Group Money Market Fund 3740
Jan-94 0.24 0.77 0.53 100 0.46 100 0.53 100 0.75 0.4896 100 0.47 100 0.58 100 0.73 98CC&L Private Client Money Market Portfolio 100100
Sep-90 0.45 1.55 1.23 22 1.09 25 1.11 22 1.27 1.078 26 1.01 22 1.13 11 1.39 3CI Signature Money Market Fund 1518
Jan-89 0.45 1.60 1.25 15 1.12 16 1.12 19 1.16 1.1020 19 1.00 25 1.08 30 1.15 43CIBC Canadian Money Market Pool 816
Dec-89 0.41 1.34 1.04 52 0.91 52 0.93 63 0.97 0.9072 62 0.83 62 0.90 72 0.99 78Fiera Capital Cash In Action Fund 5945
Oct-96 0.43 1.50 1.27 11 1.20 4 1.22 4 1.25 1.2112 3 1.16 1 1.22 3 1.28 11Fiera Short Term Plus Fund 2832
Apr-93 0.39 1.41 1.08 42 0.94 44 0.96 56 1.03 0.9360 48 0.85 56 0.94 61 1.03 67Foyston Gordon & Payne Short Term Investment Fund 4462
Aug-91 0.47 1.67 1.36 1 1.24 1 1.26 1 1.37 1.231 1 1.15 2 1.26 1 1.38 4Franklin Bissett Money Market Fund 11
Jan-98 0.42 1.42 1.08 44 0.91 54 0.95 59 0.96 0.9276 52 0.84 60 0.92 68 1.03 66Greystone Money Market Fund 4138
Mar-09 0.38 1.36 1.02 66 0.89 67 0.91 68 0.88 71 0.80 71 0.89 78 1.00 75Guardian Canadian Short Term Investment Fund 5274
Jan-80 0.39 1.28 0.97 77 0.87 77 0.97 52 1.04 0.9152 60 0.89 48 1.03 43 1.18 22GWL Canadian Money Market Fund 1 7660
Jul-02 0.34 1.17 0.88 82 0.77 82 0.87 81 1.02 0.7864 82 0.79 74 0.93 64 1.09 60Highstreet Money Market Fund 8885
Mar-88 0.40 1.35 1.03 56 0.90 60 0.90 77 0.89 0.8884 67 0.79 78 0.86 82 0.94 82HSBC Canadian Money Market Pooled Fund 5648
Mar-88 0.28 1.18 0.82 88 0.74 85 0.78 85 0.74 0.74100 85 0.68 86 0.80 86 0.84 90Integra Short Term Investment Fund 8693
Jan-08 0.44 1.50 1.19 30 1.07 32 1.09 30 1.04 1.0756 30 0.99 36 1.08 22 1.17 28Jarislowsky Fraser Money Market Fund 2622
May-94 0.39 1.37 1.02 62 0.88 71 0.90 74 0.91 0.8780 76 0.79 80 0.87 81 0.95 82Leith Wheeler Money Market Fund 4855
Dec-88 0.38 1.28 1.00 71 0.90 62 0.98 46 1.05 0.9348 42 0.90 42 1.01 50 1.13 53London Life Money Market Fund (LC) 7674
Mar-10 0.36 1.22 0.83 86 0.70 89 0.70 93 0.68 90 0.57 96 0.64 96 0.73 100Louisbourg Money Market Fund 8281
Jan-95 0.39 1.32 1.00 74 0.88 74 0.91 70 1.00 0.8768 74 0.81 67 0.90 75 1.02 71MFS Canadian Money Market Fund 7052
Jul-86 0.45 1.59 1.28 7 1.15 11 1.14 14 1.15 1.1224 12 1.02 19 1.08 32 1.16 39PH&N Canadian Money Market Fund 1011
Feb-92 0.27 0.99 0.71 96 0.59 96 0.69 96 0.81 0.6288 96 0.62 92 0.71 93 0.83 92Scheer Rowlett Money Market Fund 9696
RBC INVESTOR & TREASURY SERVICES | POOLED FUND SURVEY | PER IOD ENDING SEPTEMBER 30, 2018 PAGE 48 OF 59

Period ending September 30, 2018 Four year periods ending September 30
Money Market
Fund nameInceptiondate
1 quarter
ROR-% PR
1 year 2 years 3 years 5 years 10 years 2018 2017 2016 2015
ROR-% PR ROR-% PR ROR-% PR ROR-% PR ROR-% PR ROR-% PR ROR-% PR ROR-% PR ROR-% PR
Aug-97 0.38 1.33 1.07 48 0.94 48 0.98 42 1.09 0.9240 54 0.89 50 1.00 53 1.13 50SEI Money Market Fund 6377
Jul-91 0.47 1.66 1.29 4 1.17 8 1.18 8 1.20 1.1616 7 1.05 12 1.13 14 1.20 16TD Emerald Canadian Short Term Investment Fund 34
Jun-96 0.38 1.33 1.02 60 0.94 42 0.98 48 1.07 0.9344 46 0.89 46 1.02 46 1.15 46WindWise Canadian Short Term Investment Non-Lending Fund 6674
Fund Count 28 28 28 28 28 26 28 28 29 29
Average Return 0.39 1.36 1.06 0.94 0.97 1.05 0.94 0.87 0.98 1.09
5th Percentile 0.46 1.64 1.29 1.19 1.21 1.28 1.19 1.13 1.19 1.37
1st Quartile 0.43 1.51 1.22 1.09 1.10 1.15 1.08 1.00 1.08 1.18
Median 0.40 1.36 1.06 0.92 0.97 1.04 0.93 0.89 1.01 1.13
3rd Quartile 0.38 1.28 0.99 0.87 0.90 0.96 0.87 0.79 0.90 1.00
95th Percentile 0.27 1.03 0.74 0.62 0.69 0.77 0.64 0.58 0.67 0.77
RBC INVESTOR & TREASURY SERVICES | POOLED FUND SURVEY | PER IOD ENDING SEPTEMBER 30, 2018 PAGE 49 OF 59

Period ending September 30, 2018 Four year periods ending September 30
Real Estate
Fund nameInceptiondate
1 quarter
ROR-% PR
1 year 2 years 3 years 5 years 10 years 2018 2017 2016 2015
ROR-% PR ROR-% PR ROR-% PR ROR-% PR ROR-% PR ROR-% PR ROR-% PR ROR-% PR ROR-% PR
Oct-83 1.88 8.64 8.10 56 7.02 43 6.21 100 6.32 6.4667 60 5.61 100 5.92 100 7.59 100Bentall Kennedy Prime Canadian Property Fund Ltd. 7184
Aug-15 -0.33 8.87 3.28 100 4.98 100CI Signature Real Estate Pooled Fund 57100
Mar-11 4.06 15.97 16.60 1 14.43 1 12.36 1 13.86 1 11.48 1 12.16 1 15.90 1Crestpoint Real Estate Fund 114
Jan-04 2.40 11.20 11.05 15 9.38 16 8.41 20 8.44 8.461 20 7.73 26 7.65 40 9.95 40Greystone Real Estate Fund Inc. 1643
Apr-15 1.91 7.98 8.26 44 6.09 72Greystone Real Estate LP Fund 8672
Jun-80 1.99 7.79 6.68 84 5.91 85 6.30 80 7.30 6.1033 100 5.93 76 7.97 20 11.66 20GWL Canadian Real Estate Fund 1 10058
Feb-11 4.22 11.13 9.95 28 9.14 28 7.88 40 7.66 40 7.08 50 7.57 60 9.67 60Manulife AM Canadian Property Portfolio 281
Dec-82 2.60 9.28 6.80 72 6.49 57 6.48 60 5.58 6.32100 80 5.79 100 6.89 80 7.97 80Manulife Canadian Pooled Real Estate Fund 4429
Fund Count 8 8 8 8 6 4 6 5 6 6
Average Return 2.34 10.11 8.84 7.93 7.94 6.91 8.14 7.62 7.97 10.41
5th Percentile 4.17 14.30 14.66 12.66 11.38 8.27 12.51 10.82 10.86 14.62
1st Quartile 2.97 11.15 10.23 9.20 8.28 7.58 8.26 7.79 7.89 11.23
Median 2.20 9.07 8.18 6.75 7.18 6.81 7.06 7.08 7.61 9.81
3rd Quartile 1.91 8.48 6.77 6.04 6.34 6.13 6.36 5.95 7.06 8.40
95th Percentile 0.44 7.86 4.47 5.31 6.23 5.69 6.16 5.81 6.16 7.69
RBC INVESTOR & TREASURY SERVICES | POOLED FUND SURVEY | PER IOD ENDING SEPTEMBER 30, 2018 PAGE 50 OF 59

Period ending September 30, 2018 Four year periods ending September 30
Mortgage
Fund nameInceptiondate
1 quarter
ROR-% PR
1 year 2 years 3 years 5 years 10 years 2018 2017 2016 2015
ROR-% PR ROR-% PR ROR-% PR ROR-% PR ROR-% PR ROR-% PR ROR-% PR ROR-% PR ROR-% PR
May-07 0.78 3.86 2.91 9 3.63 9 5.01 20 6.84 4.2910 10 5.30 20 5.93 1 6.26 1ACM Commercial Mortgage Fund 81
Sep-92 -0.05 2.81 1.09 55 2.50 45 4.24 40 4.94 3.3340 37 4.60 40 5.10 30 5.03 30ACM Mortgage Fund One 3755
Mar-03 -0.69 2.73 1.06 64 3.45 18 5.91 1 6.39 4.7420 1 6.72 1 6.19 1 6.55 1ACM Mortgage Fund Two 4691
Dec-06 0.46 3.12 2.58 18 2.71 36 3.66 50 4.74 3.1550 45 3.80 50 4.16 50 4.33 50Addenda Commercial Mortgages Pooled Fund 2727
Oct-07 0.58 3.95 3.17 1 3.73 1 4.58 30 5.47 4.2430 18 4.74 30 4.83 40 4.64 40Greystone Mortgage Fund 110
Jul-66 -0.27 1.96 0.62 90 1.69 91 3.19 70 4.45 2.5760 73 3.51 70 4.07 60 4.21 60GWL Canadian Mortgage Fund 1 7382
Nov-04 0.51 1.77 1.72 28 2.08 64 2.27 100 3.13 2.17100 91 2.40 100 2.65 100 2.63 100HSBC Mortgage Pooled Fund 9018
Jan-80 -0.09 1.51 0.65 82 1.35 100 2.46 90 3.61 2.0490 100 2.70 90 3.11 90 3.29 90London Life Mortgage Fund (LC) 10064
May-05 0.12 1.81 1.12 46 1.93 81 2.79 80 3.81 2.3280 82 3.04 80 3.44 80 3.42 80Manulife Canadian Mortgage Fund 8245
Jul-05 -1.09 3.43 0.01 100 2.77 28 5.29 10 7.03 4.121 26 5.76 10 5.89 10 5.87 20PH&N Long Mortgage Pension Trust 18100
Nov-01 0.18 2.66 1.69 36 2.25 55 3.37 60 4.43 2.8970 63 3.54 60 3.96 70 3.91 70PH&N Mortgage Pension Trust 6237
Feb-14 -0.13 2.69 1.02 72 1.97 73 2.94 55Sun Life Canadian Commercial Mortgage Fund 5572
Fund Count 12 12 12 12 11 11 12 11 11 11
Average Return 0.02 2.69 1.47 2.50 3.89 4.99 3.23 4.19 4.46 4.53
5th Percentile 0.67 3.90 3.03 3.68 5.60 6.93 4.50 6.24 5.91 6.25
1st Quartile 0.47 3.19 1.94 2.94 4.79 5.93 4.15 5.02 5.48 5.45
Median 0.03 2.71 1.10 2.38 3.66 4.74 3.04 3.80 4.16 4.33
3rd Quartile -0.16 1.92 0.93 1.96 2.99 4.12 2.51 3.27 3.70 3.66
95th Percentile -0.87 1.66 0.34 1.53 2.37 3.37 2.12 2.55 2.88 2.96
RBC INVESTOR & TREASURY SERVICES | POOLED FUND SURVEY | PER IOD ENDING SEPTEMBER 30, 2018 PAGE 51 OF 59

Period ending September 30, 2018 Four year periods ending September 30
Target Date 2020
Fund nameInceptiondate
1 quarter
ROR-% PR
1 year 2 years 3 years 5 years 10 years 2018 2017 2016 2015
ROR-% PR ROR-% PR ROR-% PR ROR-% PR ROR-% PR ROR-% PR ROR-% PR ROR-% PR ROR-% PR
Mar-07 -0.14 6.96 4.65 48 5.99 52 7.62 31 6.87 5.8654 38 7.79 44 8.83 50 9.83 25BlackRock CDN LifePath 2020 Index Fund 1194
Oct-06 0.21 4.68 3.75 82 5.06 94 6.42 82 6.58 5.0188 82 6.86 87 8.41 69 8.96 66Cadence 2020 7654
Jul-12 0.09 5.59 5.05 24 6.56 12 8.06 12 6.23 20 8.69 1 11.18 1CI LifeCycle 2020 Portfolio 3465
Jun-08 -0.09 5.14 4.64 52 6.24 35 6.95 57 6.88 5.5646 63 7.40 57 8.77 62 8.85 74Continuum 2020 5382
Apr-08 -0.09 6.18 6.07 6 6.72 6 7.93 19 7.68 6.621 12 8.37 19 9.15 44 9.71 34Fidelity ClearPath Institutional 2020 1878
Nov-07 0.20 4.46 4.30 65 5.21 88 6.69 75 7.03 4.9833 92 7.26 74 8.79 57 9.03 59Franklin LifeSmart 2020 Conservative Portfolio 8858
Nov-07 0.49 5.61 5.79 16 6.38 29 7.74 25 7.39 5.8111 44 8.28 26 10.25 7 10.18 1Franklin LifeSmart 2020 Growth Portfolio 3012
Nov-07 0.37 4.99 4.99 29 5.77 59 7.21 50 7.19 5.3722 69 7.78 50 9.56 37 9.67 50Franklin Lifesmart 2020 Moderate Portfolio 6430
Jan-15 0.78 7.22 6.24 1 6.51 17Greystone 2020 Target Date Plus Fund 61
Dec-06 0.00 4.22 3.95 77 5.66 65 6.38 87 6.76 5.0168 87 6.92 82 8.10 86 8.43 90Industrial Alliance Attitude Balanced 2020 9471
Jul-05 -0.10 4.75 4.36 60 5.36 77 7.49 42 6.75 6.1777 24 8.19 37 9.62 31 10.04 16MFS LifePlan Retirement 2020 Fund 7188
Feb-11 -0.29 7.37 3.60 88 6.42 24 8.38 1 6.78 1 8.63 6 9.74 24 10.15 8PH&N LifeTime 2020 Fund 1100
Mar-12 0.56 6.17 5.80 12 7.10 1 8.11 7 6.66 7 8.60 12 10.02 12Sun Life Financial Granite 2020 Aggressive Seg Fund 226
Mar-12 0.35 4.99 4.20 70 5.58 70 6.24 92 5.30 74 6.55 93 6.97 93Sun Life Financial Granite 2020 Conservative Seg Fund 6036
Mar-12 0.43 5.27 4.70 40 6.07 46 6.90 68 5.77 50 7.31 68 8.11 76Sun Life Financial Granite 2020 Moderate Seg Fund 4218
Dec-09 0.42 5.27 4.70 36 6.07 42 6.90 64 5.77 56 7.31 64 8.11 80 8.46 84Sun Life Financial Granite 2020 Seg Fund 4622
Jun-05 0.35 1.60 0.38 100 0.89 100 3.01 100 4.64 2.10100 100 3.37 100 3.81 100 5.11 100Sun Life Milestone 2020 Fund 10040
Mar-10 0.28 4.48 3.29 94 5.24 83 7.50 38 5.93 32 8.27 30 9.74 20 9.70 41TD Emerald 2020 Retirement Target Date PFT 8347
Fund Count 18 18 18 18 17 10 17 17 17 13
Average Return 0.21 5.28 4.47 5.71 7.03 6.78 5.58 7.50 8.78 9.09
5th Percentile 0.59 7.24 6.10 6.78 8.16 7.55 6.68 8.64 10.44 10.16
1st Quartile 0.41 6.03 5.04 6.41 7.75 7.15 6.15 8.29 9.73 9.84
Median 0.25 5.21 4.64 6.03 7.21 6.87 5.77 7.78 8.83 9.67
3rd Quartile -0.07 4.70 4.02 5.41 6.69 6.75 5.29 7.23 8.14 8.83
95th Percentile -0.16 3.80 2.83 4.40 5.59 5.52 4.41 5.92 6.34 7.10
RBC INVESTOR & TREASURY SERVICES | POOLED FUND SURVEY | PER IOD ENDING SEPTEMBER 30, 2018 PAGE 52 OF 59

Period ending September 30, 2018 Four year periods ending September 30
Target Date 2025
Fund nameInceptiondate
1 quarter
ROR-% PR
1 year 2 years 3 years 5 years 10 years 2018 2017 2016 2015
ROR-% PR ROR-% PR ROR-% PR ROR-% PR ROR-% PR ROR-% PR ROR-% PR ROR-% PR ROR-% PR
Oct-07 0.03 7.75 5.68 60 6.95 61 8.58 44 7.39 6.7140 42 8.78 44 10.02 44 10.98 25BlackRock CDN LifePath 2025 Index Fund 1692
Oct-06 0.31 5.60 4.93 70 6.00 85 7.34 78 7.15 5.8580 75 7.78 78 9.48 78 10.08 62Cadence 2025 7746
Jul-12 0.47 6.41 6.59 23 7.59 8 8.78 24 6.89 33 9.38 12 11.71 1CI LifeCycle 2025 Portfolio 4631
Jun-08 0.09 5.99 5.70 54 7.19 31 7.74 67 7.36 6.2160 67 8.18 67 9.71 67 9.79 75Continuum 2025 6976
Apr-08 0.09 6.80 6.77 15 7.21 24 8.78 32 8.29 7.061 25 9.28 22 10.51 22 11.26 12Fidelity ClearPath Institutional 2025 3170
Jan-15 0.82 7.68 6.49 30 6.75 69Greystone 2025 Target Date Plus Fund 228
Sep-11 0.13 4.91 4.92 76 6.51 77 7.08 88 5.66 84 7.63 88 8.93 88 9.25 87Industrial Alliance Attitude Balanced 2025 9261
Jul-05 0.14 6.50 6.89 8 7.48 15 9.45 1 7.73 8.2320 1 10.20 1 11.08 11 11.27 1MFS LifePlan Retirement 2025 Fund 3954
Feb-11 -0.95 8.95 4.01 92 7.18 38 9.02 11 7.31 17 9.04 33 10.15 34 10.35 50PH&N LifeTime 2025 Fund 1100
Jul-14 0.96 8.24 7.80 1 8.79 1 8.11 8Sun Life Financial Granite 2025 Aggressive Segregated Fund 81
Jul-14 0.38 5.29 4.39 85 5.88 92 5.57 90Sun Life Financial Granite 2025 Conservative Segregated Fund 8539
Jul-14 0.59 6.32 5.75 40 7.08 48 6.64 58Sun Life Financial Granite 2025 Moderate Segregated Fund 5416
Feb-10 0.59 6.32 5.75 46 7.08 52 8.05 56 6.64 50 8.49 56 9.89 55 10.46 38Sun Life Financial Granite 2025 Seg Fund 6022
Jun-05 0.07 2.35 -0.63 100 1.89 100 4.92 100 6.34 3.46100 100 5.57 100 6.58 100 7.80 100Sun Life Milestone 2025 Fund 10084
Fund Count 14 14 14 14 10 6 13 10 10 9
Average Return 0.27 6.36 5.36 6.68 7.97 7.38 6.49 8.43 9.81 10.14
5th Percentile 0.87 8.49 7.21 8.01 9.25 8.15 8.16 9.83 11.43 11.26
1st Quartile 0.56 7.46 6.56 7.20 8.78 7.64 7.06 9.22 10.42 10.97
Median 0.23 6.37 5.72 7.08 8.31 7.37 6.64 8.63 9.95 10.35
3rd Quartile 0.09 5.70 4.92 6.57 7.44 7.20 5.86 7.88 9.53 9.78
95th Percentile -0.31 4.01 2.39 4.48 5.89 6.55 4.72 6.50 7.64 8.38
RBC INVESTOR & TREASURY SERVICES | POOLED FUND SURVEY | PER IOD ENDING SEPTEMBER 30, 2018 PAGE 53 OF 59

Period ending September 30, 2018 Four year periods ending September 30
Target Date 2030
Fund nameInceptiondate
1 quarter
ROR-% PR
1 year 2 years 3 years 5 years 10 years 2018 2017 2016 2015
ROR-% PR ROR-% PR ROR-% PR ROR-% PR ROR-% PR ROR-% PR ROR-% PR ROR-% PR ROR-% PR
Mar-07 0.17 8.38 6.54 64 7.63 58 9.17 56 7.59 7.2477 56 9.36 50 10.88 50 11.74 32BlackRock CDN LifePath 2030 Index Fund 1888
Oct-06 0.37 6.47 5.97 72 6.85 83 8.05 76 7.61 6.5268 75 8.46 76 10.30 75 10.98 50Cadence 2030 7165
Jul-12 0.63 6.86 7.38 40 8.19 30 9.48 25 7.49 32 10.15 24 12.65 7CI LifeCycle 2030 Portfolio 5947
Jun-08 0.26 6.75 6.63 53 8.06 35 8.41 69 7.75 6.8156 64 8.83 68 10.48 69 10.57 74Continuum 2030 6476
Apr-08 0.23 7.30 7.44 24 7.65 54 9.22 44 8.44 7.4111 38 9.70 38 10.94 44 11.76 26Fidelity ClearPath Institutional 2030 4882
Nov-07 0.76 6.42 6.58 59 6.98 77 8.03 80 8.17 6.2333 93 8.44 80 10.00 81 10.15 83Franklin LifeSmart 2030 Conservative Portfolio 7641
Nov-07 1.12 8.08 8.63 12 8.54 12 9.34 36 8.31 7.3522 44 9.66 43 11.60 37 11.38 42Franklin LifeSmart 2030 Growth Portfolio 246
Nov-07 0.85 7.23 7.54 18 7.74 46 8.67 63 7.98 6.7944 68 9.04 62 10.82 56 10.80 58Franklin LifeSmart 2030 Moderate Portfolio 5228
Jan-15 0.86 7.88 6.71 48 7.13 71Greystone 2030 Target Date Plus Fund 3024
Dec-06 0.28 5.62 5.89 76 7.40 65 7.81 87 7.54 6.3189 86 8.36 87 9.68 87 9.84 92Industrial Alliance Attitude Balanced 2030 9471
Jul-05 0.49 8.76 9.96 1 9.83 6 11.38 1 8.68 10.341 1 12.04 1 12.23 13 12.31 8MFS LifePlan Retirement 2030 Fund 1258
Feb-11 -1.58 10.13 4.43 94 7.76 42 9.34 32 7.67 25 9.14 56 10.59 63 10.59 68PH&N LifeTime 2030 Fund 1100
Mar-12 1.17 9.84 9.27 6 10.07 1 11.26 6 9.53 6 11.62 6 13.76 1Sun Life Financial Granite 2030 Aggressive Seg Fund 61
Mar-12 0.50 6.04 5.21 83 6.56 94 7.53 93 6.32 82 7.90 94 8.94 94Sun Life Financial Granite 2030 Conservative Seg Fund 8254
Mar-12 0.93 7.84 7.43 30 8.53 18 9.68 18 8.11 18 10.15 18 11.89 26Sun Life Financial Granite 2030 Moderate Seg Fund 3616
Dec-09 0.93 7.84 7.43 34 8.53 22 9.68 14 8.11 14 10.15 14 11.89 30 12.61 1Sun Life Financial Granite 2030 Seg Fund 4012
Jun-05 -0.06 4.48 1.10 100 4.13 100 6.68 100 7.42 4.93100 100 7.24 100 8.32 100 9.47 100Sun Life Milestone 2030 Fund 10094
Mar-10 0.78 5.74 5.00 88 6.80 88 9.21 50 7.34 50 10.09 30 11.99 19 12.01 17TD Emerald 2030 Retirement Target Date PFT 8936
Fund Count 18 18 18 18 17 10 17 17 17 13
Average Return 0.48 7.31 6.62 7.69 9.00 7.95 7.32 9.43 11.00 11.09
5th Percentile 1.13 9.87 9.37 9.85 11.29 8.58 9.69 11.71 12.87 12.43
1st Quartile 0.86 8.03 7.44 8.45 9.49 8.28 7.69 10.14 11.90 11.78
Median 0.57 7.26 6.67 7.70 9.21 7.87 7.34 9.36 10.88 10.98
3rd Quartile 0.26 6.43 5.91 7.02 8.08 7.60 6.53 8.48 10.29 10.54
95th Percentile -0.30 5.44 3.90 6.18 7.36 7.47 5.97 7.77 8.81 9.69
RBC INVESTOR & TREASURY SERVICES | POOLED FUND SURVEY | PER IOD ENDING SEPTEMBER 30, 2018 PAGE 54 OF 59

Period ending September 30, 2018 Four year periods ending September 30
Target Date 2035
Fund nameInceptiondate
1 quarter
ROR-% PR
1 year 2 years 3 years 5 years 10 years 2018 2017 2016 2015
ROR-% PR ROR-% PR ROR-% PR ROR-% PR ROR-% PR ROR-% PR ROR-% PR ROR-% PR ROR-% PR
Oct-07 0.29 8.99 7.37 61 8.38 54 9.85 45 7.90 7.83100 55 10.06 45 11.75 44 12.49 37BlackRock CDN LifePath 2035 Index Fund 3884
Oct-06 0.31 7.22 6.75 70 7.63 92 8.54 78 7.96 6.9280 82 8.87 78 10.91 77 11.57 50Cadence 2035 8478
Jul-12 0.71 7.39 7.97 39 8.56 46 9.81 54 7.77 63 10.42 33 13.22 10CI LifeCycle 2035 Portfolio 6946
Jun-08 0.41 7.39 7.45 54 8.81 32 8.99 67 8.08 7.2960 73 9.40 67 11.14 67 11.23 74Continuum 2035 6262
Apr-08 0.45 8.39 8.93 30 8.73 38 10.24 22 9.07 8.2220 38 10.70 22 12.03 34 12.93 24Fidelity ClearPath Institutional 2035 5354
Jan-15 0.98 8.44 7.61 46 7.97 70Greystone 2035 Target Date Plus Fund 4723
Sep-11 0.37 6.08 6.53 84 7.90 77 8.29 89 6.78 90 8.85 88 10.13 89 10.20 100Industrial Alliance Attitude Balanced 2035 10069
Jul-05 0.83 10.34 12.17 1 11.36 1 12.53 1 9.27 11.571 1 13.09 1 12.86 22 12.99 14MFS LifePlan Retirement 2035 Fund 1531
Feb-11 -1.68 10.47 5.35 92 8.35 60 9.91 34 8.22 44 9.77 55 11.41 56 11.46 62PH&N LifeTime 2035 Fund 8100
Jul-14 1.24 10.86 10.06 8 10.72 8 10.27 9Sun Life Financial Granite 2035 Aggressive Segregated Fund 11
Jul-14 0.77 7.36 6.59 77 7.75 85Sun Life Financial Granite 2035 Conservative Segregated Fund 7638
Jul-14 1.17 9.44 8.95 22 9.40 23 8.74 27Sun Life Financial Granite 2035 Moderate Segregated Fund 3010
Dec-09 1.17 9.44 8.95 16 9.75 16 10.97 11 9.33 18 11.35 12 13.31 1 14.11 1Sun Life Financial Granite 2035 Seg Fund 2414
Jun-05 0.08 6.72 3.31 100 6.27 100 8.09 100 8.18 6.1940 100 8.43 100 9.21 100 10.37 88Sun Life Milestone 2035 Fund 9292
Fund Count 14 14 14 14 10 6 12 10 10 9
Average Return 0.51 8.47 7.71 8.68 9.72 8.41 8.26 10.09 11.60 11.93
5th Percentile 1.20 10.61 10.80 10.94 11.83 9.22 10.86 12.31 13.27 13.66
1st Quartile 0.95 9.44 8.95 9.25 10.16 8.85 8.88 10.63 12.65 12.91
Median 0.58 8.41 7.53 8.47 9.83 8.13 8.02 9.92 11.58 11.57
3rd Quartile 0.33 7.37 6.63 7.92 8.65 7.99 7.20 9.00 10.97 11.21
95th Percentile -0.54 6.50 4.64 7.16 8.18 7.91 6.51 8.62 9.63 10.27
RBC INVESTOR & TREASURY SERVICES | POOLED FUND SURVEY | PER IOD ENDING SEPTEMBER 30, 2018 PAGE 55 OF 59

Period ending September 30, 2018 Four year periods ending September 30
Target Date 2040
Fund nameInceptiondate
1 quarter
ROR-% PR
1 year 2 years 3 years 5 years 10 years 2018 2017 2016 2015
ROR-% PR ROR-% PR ROR-% PR ROR-% PR ROR-% PR ROR-% PR ROR-% PR ROR-% PR ROR-% PR
Mar-07 0.42 9.60 8.21 54 9.18 41 10.56 36 8.21 8.4878 44 10.80 38 12.58 44 13.13 33BlackRock CDN LifePath 2040 Index Fund 3582
Oct-06 0.27 7.88 7.40 76 8.41 76 8.93 82 8.20 7.2588 82 9.19 87 11.30 76 11.77 66Cadence 2040 7688
Jul-12 0.79 7.51 8.45 47 8.86 64 10.06 56 8.01 57 10.70 50 13.68 25CI LifeCycle 2040 Portfolio 8259
Jun-08 0.54 8.02 8.21 58 9.50 24 9.53 69 8.38 7.7556 68 9.91 69 11.74 69 11.84 50Continuum 2040 7071
Apr-08 0.61 9.03 9.52 29 9.08 52 10.57 32 9.26 8.4811 50 10.96 32 12.30 56 13.25 26Fidelity ClearPath Institutional 2040 4265
Nov-07 0.92 7.20 7.52 71 7.74 94 8.56 100 8.66 6.7623 100 8.91 100 10.44 93 10.71 92Franklin LifeSmart 2040 Conservative Portfolio 8853
Nov-07 1.23 8.68 9.56 24 9.23 35 9.88 62 8.57 7.8644 63 10.18 62 12.05 62 11.83 58Franklin LifeSmart 2040 Growth Portfolio 5328
Nov-07 1.12 8.05 8.56 42 8.48 71 9.21 75 8.23 7.3268 76 9.50 76 11.24 80 11.25 75Franklin LifeSmart 2040 Moderate Portfolio 6641
Jan-15 1.54 9.89 9.41 34 9.29 30Greystone 2040 Target Date Plus Fund 301
Dec-06 0.46 6.41 6.99 83 8.30 88 8.77 93 8.01 7.24100 86 9.36 81 10.66 88 10.67 100Industrial Alliance Attitude Balanced 2040 10077
Jul-05 1.15 11.38 13.91 1 12.55 1 13.43 1 9.70 12.511 1 13.95 1 13.41 31 13.63 16MFS LifePlan Retirement 2040 Fund 136
Feb-11 -1.39 10.62 6.28 94 8.88 60 10.40 44 8.66 37 10.35 56 12.31 50 12.42 42PH&N LifeTime 2040 Fund 12100
Mar-12 1.27 11.29 10.40 6 11.02 6 12.41 6 10.62 7 12.69 6 15.00 1Sun Life Financial Granite 2040 Aggressive Seg Fund 512
Mar-12 1.01 8.84 8.13 64 9.10 48 10.34 50 8.70 31 10.72 44 12.71 38Sun Life Financial Granite 2040 Conservative Seg Fund 4747
Mar-12 1.24 10.56 9.76 12 10.49 12 11.77 14 10.07 14 12.07 14 14.24 12Sun Life Financial Granite 2040 Moderate Seg Fund 1822
Dec-09 1.24 10.56 9.76 16 10.49 16 11.77 18 10.07 18 12.07 18 14.24 8 15.05 1Sun Life Financial Granite 2040 Seg Fund 2218
Jun-05 0.02 8.48 4.12 100 7.37 100 8.83 88 8.59 6.9734 94 8.91 94 9.90 100 10.82 84Sun Life Milestone 2040 Fund 5994
Mar-10 1.33 7.01 6.74 88 8.35 82 10.79 26 8.72 26 11.75 25 13.78 19 13.73 9TD Emerald 2040 Retirement Target Date PFT 946
Fund Count 18 18 18 18 17 10 17 17 17 13
Average Return 0.77 8.94 8.50 9.24 10.34 8.58 8.56 10.71 12.44 12.32
5th Percentile 1.36 11.30 10.95 11.26 12.61 9.50 11.00 12.94 14.39 14.26
1st Quartile 1.24 10.39 9.55 9.44 10.85 8.64 8.83 11.71 13.67 13.27
Median 0.97 8.76 8.33 9.09 10.34 8.47 8.48 10.70 12.31 11.84
3rd Quartile 0.48 7.91 7.43 8.43 9.21 8.22 7.35 9.52 11.33 11.25
95th Percentile -0.20 6.92 5.94 7.69 8.73 8.10 6.93 8.91 10.33 10.70
RBC INVESTOR & TREASURY SERVICES | POOLED FUND SURVEY | PER IOD ENDING SEPTEMBER 30, 2018 PAGE 56 OF 59

Period ending September 30, 2018 Four year periods ending September 30
Target Date 2045
Fund nameInceptiondate
1 quarter
ROR-% PR
1 year 2 years 3 years 5 years 10 years 2018 2017 2016 2015
ROR-% PR ROR-% PR ROR-% PR ROR-% PR ROR-% PR ROR-% PR ROR-% PR ROR-% PR ROR-% PR
Jul-08 0.54 10.14 8.93 54 9.87 54 11.20 33 8.57 9.0666 50 11.46 32 13.36 44 13.75 26BlackRock CDN LifePath 2045 Index Fund 4770
Oct-06 0.28 8.29 7.92 84 8.98 84 9.26 78 8.36 7.53100 84 9.50 88 11.57 78 11.93 75Cadence 2045 8485
Jul-12 0.89 7.51 8.76 68 9.08 70 10.13 56 8.07 74 10.80 55 13.63 22CI LifeCycle 2045 Portfolio 9246
Jun-08 0.67 8.55 8.88 61 10.09 32 10.00 66 8.63 8.1534 67 10.36 66 12.25 66 12.35 63Continuum 2045 7754
Apr-08 0.61 9.04 9.53 39 9.05 77 10.65 44 9.33 8.441 59 11.06 45 12.55 56 13.57 50Fidelity ClearPath Institutional 2045 6961
Jan-15 1.87 10.60 10.18 16 9.85 60Greystone 2045 Target Date Plus Fund 381
Sep-11 0.51 6.63 7.29 92 8.53 92 8.96 100 7.40 92 9.55 78 10.89 89 10.92 100Industrial Alliance Attitude Balanced 2045 10076
Jan-09 1.33 11.90 11.27 1 10.81 8 12.49 1 11.20 1 12.64 1 13.86 12 14.20 13MFS LifePlan Retirement 2045 Fund 18
Feb-11 -0.97 10.83 8.01 78 9.91 46 11.37 23 9.69 34 11.50 23 13.47 33 13.73 37PH&N LifeTime 2045 Fund 31100
Jul-14 1.29 11.47 10.56 8 11.12 1 10.73 8Sun Life Financial Granite 2045 Aggressive Segregated Fund 816
Jul-14 1.16 10.13 9.23 46 9.97 39 9.56 41Sun Life Financial Granite 2045 Conservative Segregated Fund 5238
Jul-14 1.27 11.03 10.16 30 10.80 22 10.39 24Sun Life Financial Granite 2045 Moderate Segregated Fund 2224
Feb-10 1.27 11.03 10.16 24 10.80 16 12.12 11 10.39 18 12.40 11 14.57 1 15.31 1Sun Life Financial Granite 2045 Seg Fund 1630
Jul-10 0.04 9.26 3.98 100 7.59 100 9.22 88 7.21 100 9.21 100 10.53 100 11.25 88Sun Life Milestone 2045 Fund 6292
Fund Count 14 14 14 14 10 4 13 10 10 9
Average Return 0.77 9.74 8.92 9.75 10.54 8.72 9.06 10.85 12.67 13.00
5th Percentile 1.52 11.62 10.81 10.92 12.32 9.23 10.92 12.53 14.25 14.87
1st Quartile 1.27 10.98 10.16 10.63 11.32 8.80 10.35 11.49 13.59 13.76
Median 0.78 10.14 9.08 9.89 10.39 8.60 9.06 10.93 12.95 13.57
3rd Quartile 0.52 8.67 8.19 9.06 9.45 8.52 8.04 9.75 11.74 11.92
95th Percentile -0.31 7.20 6.13 8.20 9.08 8.39 7.32 9.34 10.69 11.05
RBC INVESTOR & TREASURY SERVICES | POOLED FUND SURVEY | PER IOD ENDING SEPTEMBER 30, 2018 PAGE 57 OF 59
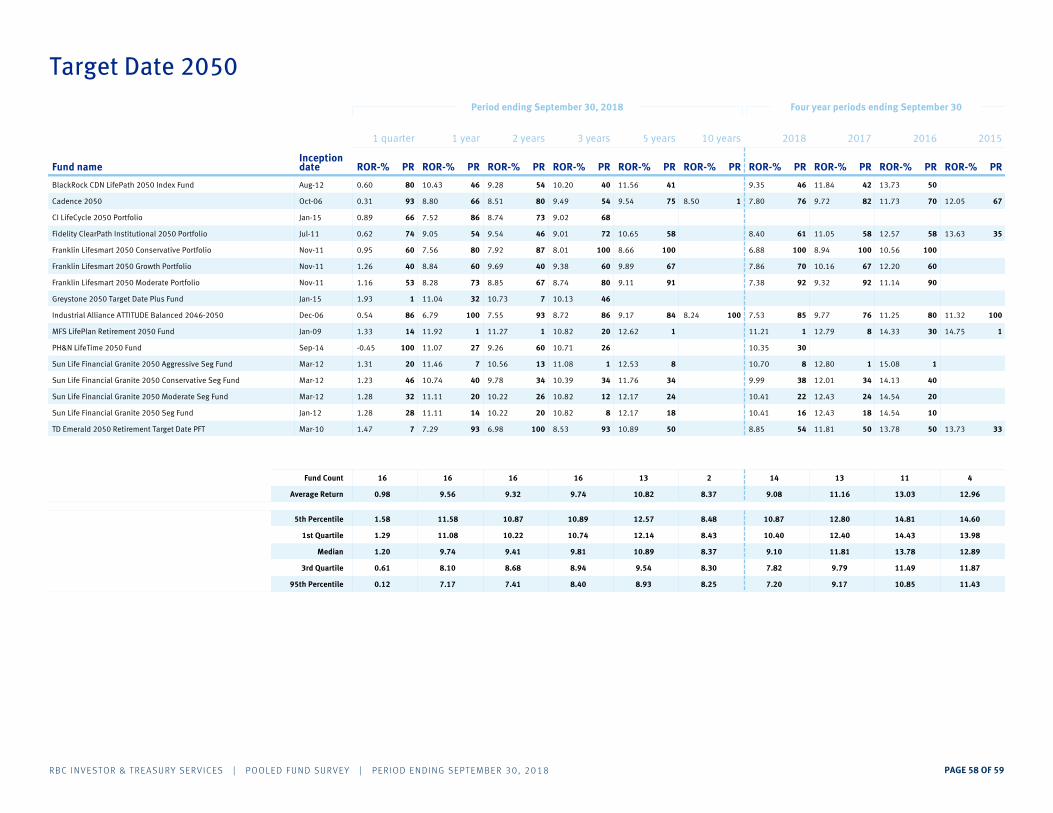
Period ending September 30, 2018 Four year periods ending September 30
Target Date 2050
Fund nameInceptiondate
1 quarter
ROR-% PR
1 year 2 years 3 years 5 years 10 years 2018 2017 2016 2015
ROR-% PR ROR-% PR ROR-% PR ROR-% PR ROR-% PR ROR-% PR ROR-% PR ROR-% PR ROR-% PR
Aug-12 0.60 10.43 9.28 54 10.20 40 11.56 41 9.35 46 11.84 42 13.73 50BlackRock CDN LifePath 2050 Index Fund 4680
Oct-06 0.31 8.80 8.51 80 9.49 54 9.54 75 8.50 7.801 76 9.72 82 11.73 70 12.05 67Cadence 2050 6693
Jan-15 0.89 7.52 8.74 73 9.02 68CI LifeCycle 2050 Portfolio 8666
Jul-11 0.62 9.05 9.54 46 9.01 72 10.65 58 8.40 61 11.05 58 12.57 58 13.63 35Fidelity ClearPath Institutional 2050 Portfolio 5474
Nov-11 0.95 7.56 7.92 87 8.01 100 8.66 100 6.88 100 8.94 100 10.56 100Franklin Lifesmart 2050 Conservative Portfolio 8060
Nov-11 1.26 8.84 9.69 40 9.38 60 9.89 67 7.86 70 10.16 67 12.20 60Franklin Lifesmart 2050 Growth Portfolio 6040
Nov-11 1.16 8.28 8.85 67 8.74 80 9.11 91 7.38 92 9.32 92 11.14 90Franklin Lifesmart 2050 Moderate Portfolio 7353
Jan-15 1.93 11.04 10.73 7 10.13 46Greystone 2050 Target Date Plus Fund 321
Dec-06 0.54 6.79 7.55 93 8.72 86 9.17 84 8.24 7.53100 85 9.77 76 11.25 80 11.32 100Industrial Alliance ATTITUDE Balanced 2046-2050 10086
Jan-09 1.33 11.92 11.27 1 10.82 20 12.62 1 11.21 1 12.79 8 14.33 30 14.75 1MFS LifePlan Retirement 2050 Fund 114
Sep-14 -0.45 11.07 9.26 60 10.71 26 10.35 30PH&N LifeTime 2050 Fund 27100
Mar-12 1.31 11.46 10.56 13 11.08 1 12.53 8 10.70 8 12.80 1 15.08 1Sun Life Financial Granite 2050 Aggressive Seg Fund 720
Mar-12 1.23 10.74 9.78 34 10.39 34 11.76 34 9.99 38 12.01 34 14.13 40Sun Life Financial Granite 2050 Conservative Seg Fund 4046
Mar-12 1.28 11.11 10.22 26 10.82 12 12.17 24 10.41 22 12.43 24 14.54 20Sun Life Financial Granite 2050 Moderate Seg Fund 2032
Jan-12 1.28 11.11 10.22 20 10.82 8 12.17 18 10.41 16 12.43 18 14.54 10Sun Life Financial Granite 2050 Seg Fund 1428
Mar-10 1.47 7.29 6.98 100 8.53 93 10.89 50 8.85 54 11.81 50 13.78 50 13.73 33TD Emerald 2050 Retirement Target Date PFT 937
Fund Count 16 16 16 16 13 2 14 13 11 4
Average Return 0.98 9.56 9.32 9.74 10.82 8.37 9.08 11.16 13.03 12.96
5th Percentile 1.58 11.58 10.87 10.89 12.57 8.48 10.87 12.80 14.81 14.60
1st Quartile 1.29 11.08 10.22 10.74 12.14 8.43 10.40 12.40 14.43 13.98
Median 1.20 9.74 9.41 9.81 10.89 8.37 9.10 11.81 13.78 12.89
3rd Quartile 0.61 8.10 8.68 8.94 9.54 8.30 7.82 9.79 11.49 11.87
95th Percentile 0.12 7.17 7.41 8.40 8.93 8.25 7.20 9.17 10.85 11.43
RBC INVESTOR & TREASURY SERVICES | POOLED FUND SURVEY | PER IOD ENDING SEPTEMBER 30, 2018 PAGE 58 OF 59

Period ending September 30, 2018 Four year periods ending September 30
Target Date 2055
Fund nameInceptiondate
1 quarter
ROR-% PR
1 year 2 years 3 years 5 years 10 years 2018 2017 2016 2015
ROR-% PR ROR-% PR ROR-% PR ROR-% PR ROR-% PR ROR-% PR ROR-% PR ROR-% PR ROR-% PR
Jul-15 0.61 10.49 9.34 50 10.23 20BlackRock CDN LifePath 2055 Index Fund 1666
Nov-12 0.34 8.97 8.82 68 9.80 60 9.74 67 7.97 67 9.94 68Cadence 2055 66100
Oct-15 0.85 7.58 8.74 82CI LifeCycle 2055 Portfolio 8418
Nov-12 0.84 9.36 9.87 17 10.99 1 10.70 1 8.74 1 11.04 32Continuum 2055 3432
Nov-12 0.62 9.07 9.55 34 9.01 80 10.65 32 8.39 33 11.05 1Fidelity ClearPath Institutional 2055 Portfolio 5050
Jan-15 1.94 11.09 10.89 1 10.20 40Greystone 2055 Target Date Plus Fund 11
Sep-11 0.55 6.83 7.62 100 8.76 100 9.25 100 7.55 100 9.86 100 11.43 1 11.52 1Industrial Alliance ATTITUDE Balanced 2051-2055 10083
Fund Count 7 7 7 6 4 4 4
Average Return 0.82 9.06 9.26 9.83 10.09 8.16 10.47
5th Percentile 1.61 10.91 10.58 10.80 10.69 8.68 11.05
1st Quartile 0.84 9.92 9.71 10.23 10.67 8.48 11.04
Median 0.62 9.07 9.34 10.00 10.20 8.18 10.49
3rd Quartile 0.58 8.28 8.78 9.21 9.62 7.86 9.92
95th Percentile 0.40 7.06 7.96 8.83 9.32 7.61 9.87
RBC INVESTOR & TREASURY SERVICES | POOLED FUND SURVEY | PER IOD ENDING SEPTEMBER 30, 2018 PAGE 59 OF 59

The Pooled Fund Survey has been produced by the Risk and Investment Analytics Group at RBC Investor & Treasury Services. For more information on our services, please contact your RBC I&TS representative or visit www.rbcits.com.
rbcits.com
© Royal Bank of Canada 2018. RBC Investor & Treasury Services™is a global brand name and is part of Royal Bank of Canada. RBC Investor & Treasury Services (RBC I&TS) is a specialist provider of asset services,custody,payments and treasury servicesfor financial and other institutional investors
worldwide. RBC I&TS operates primarily through the following companies: Royal Bank of Canada, RBC Investor Services Trust and RBC Investor Services Bank S.A., and their branches and affiliates.
® / ™ Trademarks of Royal Bank of Canada. Used under licence.
The Pooled Fund Survey (the "survey") is proprietary to RBC I&TS and is provided to institutional investors. The survey is not intended for general public distribution and may not be disseminated or distributed in whole or in part to any third parties without the prior written consent of RBC I&TS.
The survey is intended to provide general information only and does not constituteinvestment, legal, tax, or other advice, or any legal obligation or commitment on behalf of RBC I&TS or any of the pooled funds participating in the survey. The survey is not an endorsement or recommendation by RBC
I&TS of any of the pooled funds or investment management companies included in the surveyand is not intended to solicit pooled fund sales. The information and data used in the surveyhave been obtained directly from the pooled funds' respectiveinvestment management companies, and RBC I&TS
makes no representation or guarantee with respect to the accuracy of the data and information contained in the survey.