treasurer’s pooled investment fund treasurer's pooled investment fund is comprised of the...
TRANSCRIPT

COUNTY OF RIVERSIDE TREASURER’S POOLED INVESTMENT FUND IS CURRENTLY RATED: Aaa-bf BY MOODY’S INVESTOR’S SERVICE AND AAA/V1 BY FITCH RATINGS
T h e T r e a s u r e r ' s P o o l e d I n v e s t m e n t F u n d i s c o m p r i s e d o f t h e
C o u n t y , S c h o o l s , S p e c i a l D i s t r i c t s , a n d o t h e r D i s c r e t i o n a r y D e p o s i t o r s .
County of Riverside Treasurer’s Pooled Investment Fund
C a p i t a l M a r k e t s T e a m
Don Kent
Treasurer-Tax Collector
Jon Christensen
Asst. Treasurer-Tax Collector
Giovane Pizano
Investment Manager
Isela Licea
Asst. Investment Manager
The primary objective of the treasurer
shall be to safeguard the principal of
the funds under the
treasurer's control, meet the liquidity
needs of the depositor, and achieve a
return on the funds under his or her
control.
I n v e s t m e n t O b j e c t i v e s
2016 March
Month End Market
Value ($)*
Month End Book
Value ($)
Paper Gain or
Loss ($)
Paper Gain
or Loss (%)
Book
Yield (%)
Yrs to
Maturity
Modified
Duration
March 6,319,190,571.12 6,312,840,233.99 6,350,337.13 0.10 0.65 1.07 1.04
February 6,294,402,626.91 6,289,381,725.26 5,020,901.65 0.08 0.66 1.15 1.12
January 6,691,824,574.61 6,687,643,005.32 4,181,569.29 0.06 0.62 1.10 1.08
December 7,023,488,956.44 7,028,915,490.64 (5,426,534.20) (0.08) 0.55 1.03 1.00
November 5,931,356,029.51 5,933,521,428.90 (2,165,399.39) (0.04) 0.50 1.03 1.01
October 5,880,386,136.39 5,878,933,080.22 1,453,056.17 0.02 0.46 0.98 0.95
A big thud marked the sound of the iceberg as it struck the hull of the Titanic, similar it seems to that resonating through our (global) economy, continuing with the first quarter of the year as indicators at this juncture point to a tough remainder for 2016.
For three years running now, economists have read the tea leaves and forecasted 2% + U.S. GDP growth, only to back track and in-creasingly revise estimates lower. Both 2014 and 2015 had very similar starts and very weak overall GDP numbers. This seems to be be-coming the norm and is hard to make a compel-ling argument of the effects of weather and oth-er esoteric excuses on overall GDP. Moreover, actual growth has fallen by 50% from the 1990’s, so it seems as if we simply remain in a low growth trend for the foreseeable future.
It turns out that other areas of the U.S. econ-omy are having a tough time as well; retail sales unexpectedly declined in March by -0.3% vs. a forecast of 0.1%. Total business sales have fallen again, and the inventory to sales ratio has hit the highest level since the Great Recession. Industrial Production figures have dropped year over year for seven months in a row, without being in a recession.
The decline in factory output has driven a 1.6% reduction in vehicle production which had been a bright spot in the economy, minus the subprime financing. Manufacturing output de-
creased 0.3% in March and durable goods or-ders were down 0.4%, the worst since 2008. Consumer confidence continued to abate, mark-ing its fourth consecutive monthly decline with the April report and concerns have risen about the resilience of consumer spending in the months ahead.
Financial distress in Europe continues, being caused in part by deterioration of the balance sheets of its banks, several of which have loss-es in the billions of euros. Furthermore, recent issues with ongoing terrorism, the endless refu-gee crisis, and, the looming danger of the Grexit (Greece), Brexit (Britain) and Dexit (Denmark) largely due to the aforementioned problems has Europe in real tight spot. The rest of the global economy, along with China and Japan in partic-ular, are slowing significantly and in a real eco-nomic conundrum.
The FED, holding the view that “global devel-opments have increased risk,” ended the March 16th FOMC meeting as expected without any change in monetary policy. This global econom-ic weakness adds to market skepticism about the number of additional FED hikes this year, prolonging the pain to those such as institutional and retail fixed income investors alike seeking higher yields and interest income.
Don Kent Treasurer-Tax Collector
“Thud”

Value ChangeNymex Crude 38.34$ 4.59$
Gold (USD/OZ) 1,232.71$ (6.03)$
Value Change
Dow Jones (DJIA) 17,685.09$ 1,168.59$
S&P 500 Index 2,059.74$ 127.51$
NASDAQ (NDX) 4,869.84$ 311.89$
Fed Move 04/27/2016 06/15/2016
Increase to 0.25% 2.0% 1.7%
Increase to 0.50% 98.0% 82.6%
Increase to 0.75% 0.0% 15.7%
Increase to 1% 0.0% 0.0%
Current Fed Funds Rate: 0-0.25%
Probability for FOMC Dates:
Current Market Data Economic Indicators
Stock Indices
Commodities
Fed Funds Target Rate
COUNTY OF RIVERSIDE TREASURER-TAX COLLECTOR
US Treasury Curve (M/M)
FOMC Meeting Schedule Release % Risk Assessment
27-Jan .25 - 0.5 % Growth
16-Mar .25 - 0.5 % Growth
Release Date Indicator Consensus Actual
03/04/2016 195,000 242,000
03/04/2016 4.9% 4.9%
03/24/2016 -3.0% -2.8%
03/25/2016 0.9% 0.9%
03/29/2016 94.0 96.2
03/03/2016 2.1% 1.6%
03/16/2016 -0.2% -0.2%
03/16/2016 0.2% 0.3%CPI Ex Food and Energy - M/M change: CPI Ex Food and Energy excludes food and energy.
Consumer Price Index - M/M change: The Consumer Price Index is a measure of the average
price level of a fixed basket of goods and services purchased by consumers.
Non-Farm Payrolls M/M change: Counts the number of paid employees working part-time or
full-time in the nation's business and government establishments.Employment Situation: Measures the number of unemployed as a percentage of the labor
Durable Goods Orders - M/M change: Reflects the new orders placed with domestic
manufacturers for immediate and future delivery of factory hard goods.
Real Gross Domestic Product - Q/Q change: The broadest measure of aggregate economic
activity and encompasses every sector of the economy. GDP is the country's most
comprehensive economic scorecard.
Consumer Confidence: Measures consumer attitudes on present economic conditions and
expectations of future conditions. Factory Orders M/M change: Represents the dollar level of new orders for both durable and
nondurable goods.
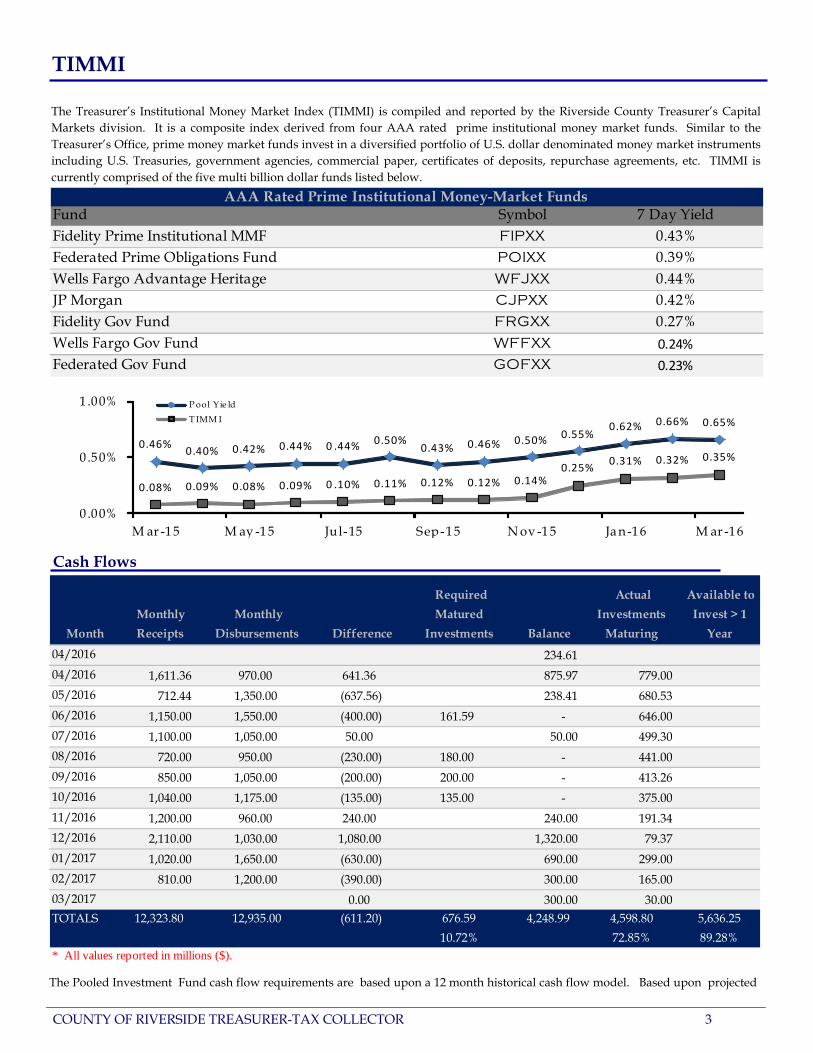
Fund Symbol 7 Day YieldFidelity Prime Institutional MMF FIPXX 0.43%Federated Prime Obligations Fund POIXX 0.39%Wells Fargo Advantage Heritage WFJXX 0.44%JP Morgan CJPXX 0.42%Fidelity Gov Fund FRGXX 0.27%Wells Fargo Gov Fund WFFXX 0.24%
Federated Gov Fund GOFXX 0.23%
AAA Rated Prime Institutional Money-Market Funds
0.46%0.40% 0.42% 0.44% 0 .44% 0.50%
0.43% 0.46% 0.50% 0.55%0.62% 0.66% 0.65%
0.08% 0.09% 0.08% 0.09% 0 .10% 0.11% 0.12% 0.12% 0.14%0.25%
0.31% 0.32% 0.35%
0 .00%
0.50%
1.00%
M ar -15 M ay -15 Jul-15 Sep-15 N ov -1 5 Ja n -16 M ar -16
P ool Yie ld
T IMM I
The Pooled Investment Fund cash flow requirements are based upon a 12 month historical cash flow model. Based upon projected
The Treasurer’s Institutional Money Market Index (TIMMI) is compiled and reported by the Riverside County Treasurer’s Capital Markets division. It is a composite index derived from four AAA rated prime institutional money market funds. Similar to the Treasurer’s Office, prime money market funds invest in a diversified portfolio of U.S. dollar denominated money market instruments including U.S. Treasuries, government agencies, commercial paper, certificates of deposits, repurchase agreements, etc. TIMMI is currently comprised of the five multi billion dollar funds listed below.
TIMMI
COUNTY OF RIVERSIDE TREASURER-TAX COLLECTOR 3
Cash Flows
Month
Monthly
Receipts
Monthly
Disbursements Difference
Required
Matured
Investments Balance
Actual
Investments
Maturing
Available to
Invest > 1
Year
04/2016 234.61
04/2016 1,611.36 970.00 641.36 875.97 779.00
05/2016 712.44 1,350.00 (637.56) 238.41 680.53
06/2016 1,150.00 1,550.00 (400.00) 161.59 - 646.00
07/2016 1,100.00 1,050.00 50.00 50.00 499.30
08/2016 720.00 950.00 (230.00) 180.00 - 441.00
09/2016 850.00 1,050.00 (200.00) 200.00 - 413.26
10/2016 1,040.00 1,175.00 (135.00) 135.00 - 375.00
11/2016 1,200.00 960.00 240.00 240.00 191.34
12/2016 2,110.00 1,030.00 1,080.00 1,320.00 79.37
01/2017 1,020.00 1,650.00 (630.00) 690.00 299.00
02/2017 810.00 1,200.00 (390.00) 300.00 165.00
03/2017 0.00 300.00 30.00TOTALS 12,323.80 12,935.00 (611.20) 676.59 4,248.99 4,598.80 5,636.25
10.72% 72.85% 89.28%* All values reported in millions ($).

Asset Allocation
COUNTY OF RIVERSIDE TREASURER-TAX COL-
490,000.00 100.00% 0.42% .003 .003
165,000.00 100.00% 0.29% .003 .003
335.00 100.00% 1.16% 4.211 4.211
50,000.00 100.16% 0.37% .384 .384
825,000.00 100.27% 0.68% 1.101 1.101
315,000.00 100.15% 0.43% .476 .476
886,751.00 100.05% 1.18% .990 2.824
428,717.00 100.17% 0.40% .326 .326
341,279.00 100.00% 1.07% .578 2.835
702,783.00 100.18% 0.46% .343 .343
382,539.72 100.05% 0.77% .542 1.232
483,500.00 100.18% 0.41% .403 .403
536,506.00 99.90% 0.52% 1.124 1.162
120,000.00 100.21% 0.55% .490 .490
108,850.00 100.09% 0.68% 1.137 1.551
53,800.00 100.01% 0.49% .198 .198
180,165.00 100.00% 0.72% 1.045 1.045
195,000.00 100.12% 0.68% .368 .368
6,319,225.72 100.10% 0.65% .632 1.0646,319,190.57
US TREAS BILLS 49,862.24 49,941.50
FHLB DISC NOTES 700,550.69
382,753.96
FNMA DISC NOTES
886,833.22
FHLMC DISC NOTES
DDA/PASSBK
FNMA BONDS
6,312,840.23
335.00
COMM PAPER
313,875.32
MUNI BONDS
FHLB BONDS
481,814.93
194,314.44
CALTRUST FND 0.68%
LOCAL AGCY OBLIG
US TREAS BONDS
Totals (000's):
54,000.00 54,000.00 54,000.00
181,336.32
53,744.84
428,173.46
YieldScheduled Book
341,315.31 341,311.43
165,000.00
FFCB BONDS
.003
Assets (000's) Scheduled Par
FHLMC BONDS
824,916.44 827,162.20
MMKT
382,558.09
Mkt/ Sch Book
490,000.00 490,000.00
165,000.00
WAL (Yr)
.003100.00%
Mat (Yr)
FMAC DISC NOTES
536,053.31536,608.47
Scheduled Market
887,265.30
314,344.95
FFCB DISC NOTES
335.00
701,838.76
427,447.45
194,552.83
181,336.32
119,483.36 119,735.20
MUNI ZERO CPNS
482,693.05
108,850.00 108,948.47FARMER MAC
53,738.96

Maturity Distribution
COUNTY OF RIVERSIDE TREASURER-TAX COLLECTOR 5
Scheduled Par (000's) 0-1 Mos 1-3 Mos 3-12 Mos 1-2 Yr 2-3 Yr >3 Yr Totals (000's)
MMKT 490,000.00 - - - - - 490,000.00
CALTRUST FND 54,000.00 - - - - - 54,000.00
DDA/PASSBK 165,000.00 - - - - - 165,000.00
LOCAL AGCY OBLIG - - - - - 335.00 335.00
US TREAS BILLS - - 50,000.00 - - - 50,000.00
US TREAS BONDS - 300,000.00 190,000.00 190,000.00 70,000.00 75,000.00 825,000.00
FHLMC DISC NOTES - 25,000.00 290,000.00 - - - 315,000.00
FHLMC BONDS - 115,366.00 124,625.00 50,000.00 174,400.00 422,360.00 886,751.00
FNMA DISC NOTES - 163,000.00 265,717.00 - - - 428,717.00
FNMA BONDS - - 109,604.00 - 60,000.00 171,675.00 341,279.00
FHLB DISC NOTES 25,000.00 240,000.00 437,783.00 - - - 702,783.00
FHLB BONDS - 105,000.00 110,070.00 65,000.00 72,469.72 30,000.00 382,539.72
FFCB DISC NOTES - 57,000.00 426,500.00 - - - 483,500.00
FFCB BONDS 10,000.00 131,296.00 169,000.00 125,900.00 50,310.00 50,000.00 536,506.00
FMAC DISC NOTES 10,000.00 - 110,000.00 - - - 120,000.00
MUNI ZERO CPNS - 15,000.00 50,000.00 8,850.00 10,000.00 25,000.00 108,850.00
FARMER MAC - 30,800.00 23,000.00 - - - 53,800.00
MUNI BONDS - 12,070.00 98,960.00 29,600.00 34,535.00 5,000.00 180,165.00
COMM PAPER 25,000.00 52,000.00 118,000.00 - - - 195,000.00
Totals (000's): 779,000.00 1,246,532.00 2,573,259.00 469,350.00 471,714.72 779,370.00 6,319,225.72
% 12.33% 19.73% 40.72% 7.43% 7.46% 12.33%Cumulative % 12.33% 32.05% 72.77% 80.20% 87.67% 100.00%
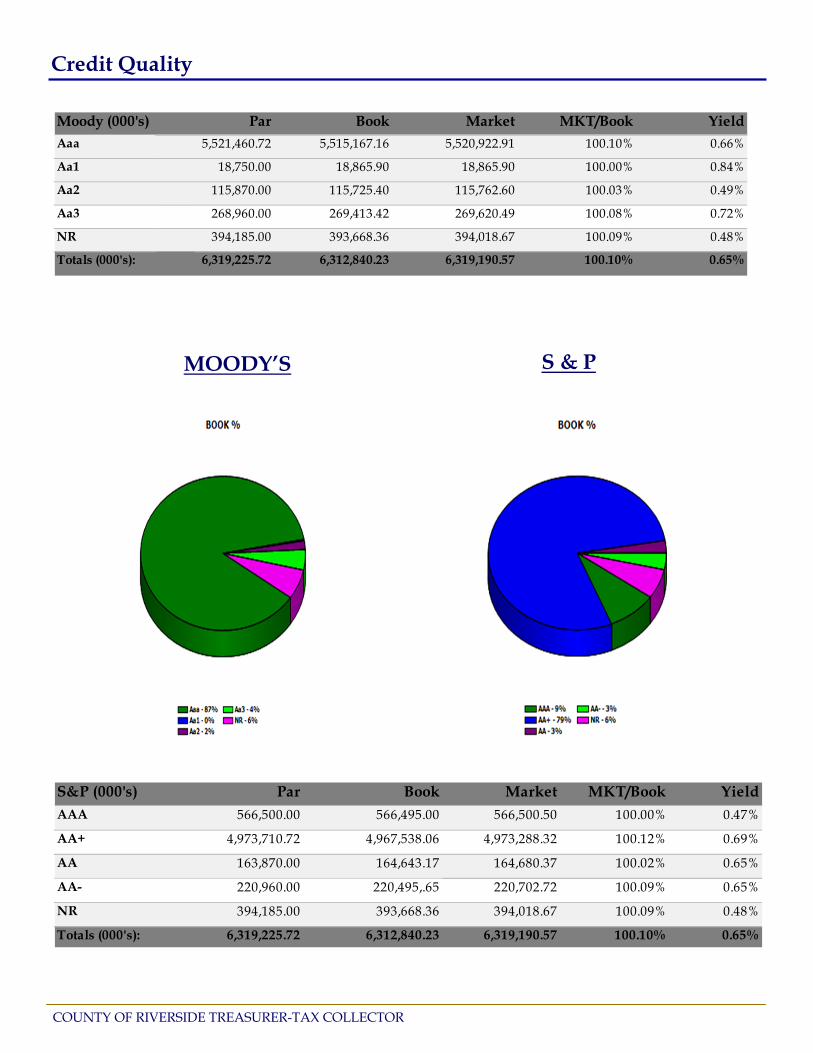
Credit Quality
Book Market5,521,460.72 5,515,167.16 5,520,922.91 100.10%
Aa1 18,750.00 18,865.90 18,865.90 100.00% 0.84%
115,870.00 115,725.40 115,762.60 100.03%
268,960.00 269,413.42 269,620.49 100.08%
394,185.00 393,668.36 394,018.67 100.09%
6,319,225.72 6,312,840.23 6,319,190.57
MKT/Book
Aa3
0.66%
0.49%
YieldAaa
Moody (000's) Par
0.72%
0.48%
Aa2
100.10%Totals (000's):
NR
0.65%
MOODY’S S & P
S&P (000's)AAA 566,500.00 566,495.00
AA+ 4,973,710.72 4,967,538.06
AA 163,870.00 164,643.17
AA- 220,960.00 220,495,.65
NR 394,185.00 393,668.36
Totals (000's): 6,319,225.72 6,312,840.23
394,018.67
220,702.72 100.09%
6,319,190.57 100.10% 0.65%
0.65%
0.48%100.09%
Par Book Market MKT/Book Yield566,500.50
4,973,288.32
100.02%
0.69%
0.47%100.00%
0.65%
100.12%
164,680.37
COUNTY OF RIVERSIDE TREASURER-TAX COLLECTOR
DescriptionMaturity
Date Coupon Par
Value BookValue
MarketPrice
MarketValue
UnrealizedGain/Loss
CALTRUST HERITAGE 04/01/2016 .431 105,000,000.00 105,000,000.00 100.000000 105,000,000.00 0.00FIDELITY PRIME 04/01/2016 .427 115,000,000.00 115,000,000.00 100.000000 115,000,000.00 0.00FEDERATED PRIME 04/01/2016 .439 215,000,000.00 215,000,000.00 100.000000 215,000,000.00 0.00JP MORGAN PRIME 04/01/2016 .413 20,000,000.00 20,000,000.00 100.000000 20,000,000.00 0.00FIDELITY GOV 04/01/2016 .265 25,000,000.00 25,000,000.00 100.000000 25,000,000.00 0.00WELLS FARGO GOV 04/01/2016 .228 5,000,000.00 5,000,000.00 100.000000 5,000,000.00 0.00FEDERATED GOV 04/01/2016 .243 5,000,000.00 5,000,000.00 100.000000 5,000,000.00 0.00
.420 490,000,000.00 490,000,000.00 100.000000 490,000,000.00 0.00
CALTRUST SHT TERM 04/01/2016 .685 54,000,000.00 54,000,000.00 100.000000 54,000,000.00 0.00.685 54,000,000.00 54,000,000.00 100.000000 54,000,000.00 0.00
UB MANAGED RATE 04/01/2016 .290 165,000,000.00 165,000,000.00 100.000000 165,000,000.00 0.00.290 165,000,000.00 165,000,000.00 100.000000 165,000,000.00 0.00
US DIST COURTHOUSE 06/15/2020 1.155 335,000.00 335,000.00 100.000000 335,000.00 0.001.155 335,000.00 335,000.00 100.000000 335,000.00 0.00
U.S. TREASURY BILL 09/15/2016 .373 25,000,000.00 24,923,068.75 99.848000 24,962,000.00 38,931.25U.S. TREASURY BILL 07/21/2016 .365 25,000,000.00 24,939,166.67 99.918000 24,979,500.00 40,333.33
.369 50,000,000.00 49,862,235.42 99.883000 49,941,500.00 79,264.58
U.S. TREASURY BOND 06/30/2017 .750 5,000,000.00 4,971,875.00 100.094000 5,004,700.00 32,825.00U.S. TREASURY BOND 05/15/2016 .250 25,000,000.00 24,971,679.69 99.995000 24,998,750.00 27,070.31U.S. TREASURY BOND 05/15/2017 .875 25,000,000.00 25,077,148.44 100.238000 25,059,500.00 -17,648.44U.S. TREASURY BOND 05/15/2016 .250 25,000,000.00 24,967,773.44 99.995000 24,998,750.00 30,976.56U.S. TREASURY BOND 05/15/2016 .250 25,000,000.00 24,967,773.44 99.995000 24,998,750.00 30,976.56U.S. TREASURY BOND 05/15/2016 .250 25,000,000.00 24,971,679.69 99.995000 24,998,750.00 27,070.31U.S. TREASURY BOND 01/31/2017 .875 25,000,000.00 25,129,882.81 100.223000 25,055,750.00 -74,132.81U.S. TREASURY BOND 05/15/2016 .250 25,000,000.00 24,984,375.00 99.995000 24,998,750.00 14,375.00U.S. TREASURY BOND 05/15/2016 .250 25,000,000.00 24,941,406.25 99.995000 24,998,750.00 57,343.75U.S. TREASURY BOND 05/15/2016 .250 50,000,000.00 49,947,265.63 99.995000 49,997,500.00 50,234.37U.S. TREASURY BOND 06/15/2016 .500 25,000,000.00 25,049,804.69 100.045000 25,011,250.00 -38,554.69U.S. TREASURY BOND 05/15/2016 .250 25,000,000.00 24,994,140.63 99.995000 24,998,750.00 4,609.37U.S. TREASURY BOND 06/30/2016 .500 15,000,000.00 15,026,671.80 100.047000 15,007,050.00 -19,621.80U.S. TREASURY BOND 05/15/2016 .250 25,000,000.00 24,992,187.50 99.995000 24,998,750.00 6,562.50U.S. TREASURY BOND 06/15/2016 .500 25,000,000.00 25,034,179.69 100.045000 25,011,250.00 -22,929.69U.S. TREASURY BOND 08/15/2016 .625 20,000,000.00 20,050,320.00 100.089000 20,017,800.00 -32,520.00U.S. TREASURY BOND 02/15/2017 .625 20,000,000.00 20,008,593.75 100.016000 20,003,200.00 -5,393.75U.S. TREASURY BOND 01/15/2017 .750 25,000,000.00 25,095,703.13 100.121000 25,030,250.00 -65,453.13U.S. TREASURY BOND 10/15/2018 .875 15,000,000.00 14,934,375.00 100.156000 15,023,400.00 89,025.00U.S. TREASURY BOND 09/30/2017 .625 10,000,000.00 9,981,250.00 99.871000 9,987,100.00 5,850.00U.S. TREASURY BOND 02/15/2018 1.000 10,000,000.00 10,017,968.75 100.473000 10,047,300.00 29,331.25U.S. TREASURY BOND 01/15/2018 .875 15,000,000.00 14,996,484.38 100.254000 15,038,100.00 41,615.62U.S. TREASURY BOND 05/15/2018 1.000 15,000,000.00 14,981,835.94 100.469000 15,070,350.00 88,514.06U.S. TREASURY BOND 05/15/2018 1.000 15,000,000.00 14,980,078.13 100.469000 15,070,350.00 90,271.87U.S. TREASURY BOND 01/31/2018 .875 25,000,000.00 24,936,523.44 100.258000 25,064,500.00 127,976.56U.S. TREASURY BOND 01/15/2017 .750 25,000,000.00 25,027,343.75 100.121000 25,030,250.00 2,906.25U.S. TREASURY BOND 11/30/2017 .625 25,000,000.00 24,854,492.19 99.840000 24,960,000.00 105,507.81U.S. TREASURY BOND 05/31/2018 1.000 25,000,000.00 24,945,312.50 100.469000 25,117,250.00 171,937.50U.S. TREASURY BOND 02/15/2017 .625 25,000,000.00 24,978,515.63 100.016000 25,004,000.00 25,484.37U.S TREASURY BOND 01/15/2018 .875 25,000,000.00 24,943,359.38 100.254000 25,063,500.00 120,140.62U.S. TREASURY BOND 11/30/2017 .875 25,000,000.00 24,974,609.38 100.246000 25,061,500.00 86,890.62U.S. TREASURY BOND 07/31/2019 1.625 25,000,000.00 25,192,382.81 102.188000 25,547,000.00 354,617.19U.S. TREASURY BOND 02/15/2017 .625 25,000,000.00 24,964,843.75 100.016000 25,004,000.00 39,156.25U.S. TREASURY BOND 05/31/2019 1.500 25,000,000.00 25,110,351.56 101.789000 25,447,250.00 336,898.44U.S. TREASURY BOND 10/31/2019 1.500 25,000,000.00 25,028,320.31 101.723000 25,430,750.00 402,429.69U.S. TREASURY BOND 02/15/2017 .625 10,000,000.00 10,003,125.00 100.016000 10,001,600.00 -1,525.00U.S. TREASURY BOND 02/28/2018 .750 25,000,000.00 24,882,812.50 100.023000 25,005,750.00 122,937.50
.673 825,000,000.00 824,916,444.98 100.262085 827,162,200.00 2,245,755.02
FHLMC DISC NOTE 06/29/2016 .335 15,000,000.00 14,954,914.58 99.923000 14,988,450.00 33,535.42FHLMC DISC NOTE 08/31/2016 .390 25,000,000.00 24,901,416.67 99.831000 24,957,750.00 56,333.33FHLMC DISC NOTE 07/22/2016 .275 25,000,000.00 24,943,472.22 99.888000 24,972,000.00 28,527.78FHLMC DISC NOTE 10/26/2016 .400 25,000,000.00 24,901,390.00 99.740000 24,935,000.00 33,610.00FHLMC DISC NOTE 10/25/2016 .400 25,000,000.00 24,901,666.67 99.741000 24,935,250.00 33,583.33FHLMC DISC NOTE 10/31/2016 .400 25,000,000.00 24,900,000.00 99.734000 24,933,500.00 33,500.00FHLMC DISC NOTE 09/06/2016 .420 25,000,000.00 24,916,291.67 99.816000 24,954,000.00 37,708.33FHLMC DISC NOTE 09/13/2016 .410 25,000,000.00 24,916,576.39 99.808000 24,952,000.00 35,423.61FHLMC DISC NOTE 09/26/2016 .410 25,000,000.00 24,912,875.00 99.792000 24,948,000.00 35,125.00FHLMC DISC NOTE 10/19/2016 .575 25,000,000.00 24,873,420.14 99.749000 24,937,250.00 63,829.86FHLMC DISC NOTE 05/20/2016 .510 25,000,000.00 24,946,520.83 99.965000 24,991,250.00 44,729.17FHLMC DISC NOTE 10/19/2016 .465 25,000,000.00 24,920,885.42 99.749000 24,937,250.00 16,364.58FHLMC DISC NOTE 01/05/2017 .520 25,000,000.00 24,885,888.89 99.613000 24,903,250.00 17,361.11
.427 315,000,000.00 313,875,318.48 99.792048 314,344,950.00 469,631.52
FHLMC 4Yr 11/01/2016 .625 10,000,000.00 9,991,200.00 100.034000 10,003,400.00 12,200.00FHLMC 4Yr 11/01/2016 .625 4,625,000.00 4,629,301.25 100.034000 4,626,572.50 -2,728.75FHLMC 1Yr 05/13/2016 .500 25,000,000.00 25,055,500.00 100.017000 25,004,250.00 -51,250.00FHLMC 2YrNc1YrE 12/30/2016 .750 25,000,000.00 25,000,000.00 100.429000 25,107,250.00 107,250.00FHLMC 1Yr 05/13/2016 .500 12,500,000.00 12,516,625.00 100.017000 12,502,125.00 -14,500.00FHLMC 1Yr 05/27/2016 .400 9,500,000.00 9,502,185.00 100.010000 9,500,950.00 -1,235.00FHLMC 1Yr 05/13/2016 .500 25,000,000.00 25,031,500.00 100.017000 25,004,250.00 -27,250.00FHLMC 1Yr 05/13/2016 .500 6,059,000.00 6,069,239.71 100.017000 6,060,030.03 -9,209.68FHLMC 1Yr 05/13/2016 .500 27,307,000.00 27,352,602.69 100.017000 27,311,642.19 -40,960.50FHLMC 1Yr 05/13/2016 .500 10,000,000.00 10,017,300.00 100.017000 10,001,700.00 -15,600.00FHLMC 3YrNc3MoB 05/21/2018 1.200 7,550,000.00 7,534,900.00 100.019000 7,551,434.50 16,534.50FHLMC 3YrNc1.5YrE 06/22/2018 1.200 15,000,000.00 14,986,800.00 100.016000 15,002,400.00 15,600.00FHLMC 3YrNc6MoE 06/22/2018 1.250 25,000,000.00 24,993,750.00 100.719000 25,179,750.00 186,000.00FHLMC 1.5Yr 01/27/2017 .500 25,000,000.00 24,973,250.00 99.889000 24,972,250.00 -1,000.00FHLMC 1.5Yr 01/27/2017 .500 15,000,000.00 14,980,119.90 99.889000 14,983,350.00 3,230.10FHLMC 5YrNc3MoB 10/29/2020 1.750 20,000,000.00 20,000,000.00 100.098000 20,019,600.00 19,600.00FHLMC 5YrNc3MoB 10/29/2020 1.550 10,000,000.00 10,000,000.00 100.084000 10,008,400.00 8,400.00FHLMC 5YrNc3MoB 10/29/2020 1.500 10,000,000.00 10,000,000.00 100.084000 10,008,400.00 8,400.00FHLMC 2YrNc6MoB 10/27/2017 .750 10,000,000.00 10,000,000.00 99.876000 9,987,600.00 -12,400.00FHLMC 5YrNc3MoB 10/29/2020 1.600 10,000,000.00 10,000,000.00 100.003000 10,000,300.00 300.00FHLMC 5YrNc3MoB 10/14/2020 1.800 10,000,000.00 10,000,000.00 100.049000 10,004,900.00 4,900.003134G7ZQ7 1.800 4.301 4.542
3134G7V24 .750 1.555 1.5753134G7V73 1.600 4.368 4.584
3134G7U90 1.550 4.374 4.5843134G7U33 1.500 4.381 4.584
3137EADU0 .592 .819 .8273134G7N23 1.750 4.349 4.584
3134G66M0 1.259 2.181 2.2273137EADU0 .570 .819 .827
3134G6WU3 1.268 2.096 2.1403134G7AE1 1.230 2.182 2.227
3137EADQ9 .345 .118 .1183137EADQ9 .330 .118 .118
3137EADQ9 .385 .118 .1183137EADQ9 .345 .118 .118
3137EADQ9 .380 .118 .1183134G5RF4 .380 .156 .156
3137EADQ9 .350 .118 .1183134G5WA9 .750 .745 .751
313397AE1
FHLMC BONDS
3134G3S50 .600 .580 .589.647 .580 .589
.522 .763 .767
.428 .473 .476
313396XB4 .511 .136 .137.466 .550 .553313396L35
313396H48 .411 .488 .490313396L35 .578 .550 .553
.421 .433 .436313396F73 .411 .453 .455
.402 .567 .570313396M75 .402 .584 .586
.276 .309 .310313396M26 .402 .570 .573
.336 .246 .247313396E25 .392 .417 .419
.682 1.085 1.106
912828B74 .594 .868 .879.993 1.896 1.915912828UR9
912828WL0 1.370 3.069 3.167912828F62 1.470 3.455 3.586
912828WW6 1.409 3.227 3.334912828B74 .742 .867 .879
912828H37 .982 1.767 1.795912828M72 .926 1.646 1.668
912828VE7 1.088 2.130 2.167912828B74 .695 .868 .879
912828A91 .655 .784 .795912828UA6 .915 1.650 1.668
912828XA3 1.053 2.086 2.123912828UJ7 .990 1.811 1.838
912828H37 .886 1.768 1.795912828XA3 1.049 2.087 2.123
1.501912828H94 .920 1.849 1.879
Yield To Maturity
ModifiedDuration
Years ToMaturityCUSIP
912828TS9 .723
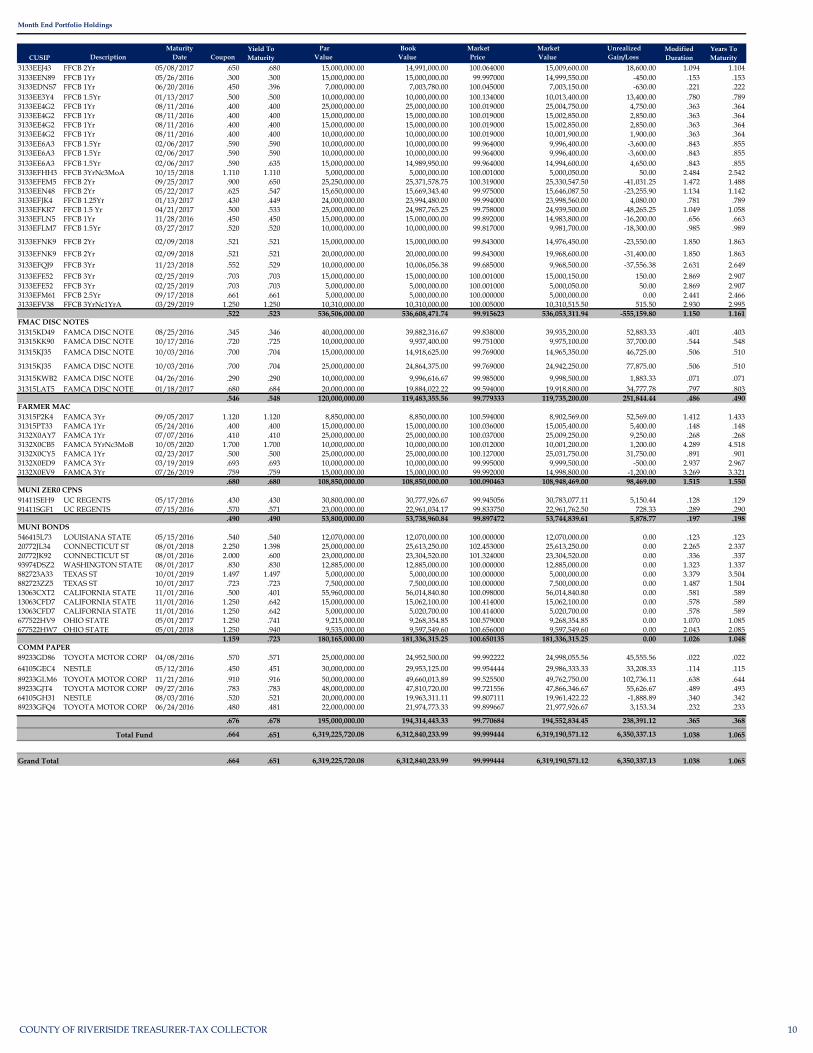
Month End Portfolio Holdings
Fund: 1 POOL FUND
1.490
MMKT
912828A91 .433 .785 .795912828L81 1.025 2.494 2.542
912828VR8 .381 .374 .375912828B74 .596 .868 .879
912828VC1 .281 .123 .123912828VG2 .364 .208 .208
912828VC1 .273 .123 .123912828WQ9 .345 .249 .249
912828VC1 .329 .123 .123912828VG2 .321 .208 .208
912828VC1 .292 .123 .123912828VC1 .418 .123 .123
912828VC1 .324 .123 .123912828SC5 .641 .829 .838
912828VC1 .335 .123 .123912828VC1 .335 .123 .123
912828VC1 .324 .123 .123912828WH9 .752 1.112 1.123
US TREAS BONDS912828TB6 .932 1.239 1.249
.366 .306 .307912796GW3
.370 .382 .383
US TREAS BILLS912796HE2 .374 .458 .460
1.155 2.021 4.211LOCAL AGCY OBLIGLAO
1.155 2.021 4.211
.290 .003 .003CASHDDA/PASSBK
.290 .003 .003
CALTRUST FNDCLTR
.685 .003 .003
.685 .003 .003
.243 .003 .003
.420 .003 .003GOFXX
FRGXX .265 .003 .003WFFXX .228 .003 .003
POIXX .439 .003 .003CJPXX .413 .003 .003
WFJXX .431 .003 .003FIPXX .427 .003 .003
313396YT4
3134G3S50
FHLMC DISC NOTES
313396ZS5
313396L92
313396E82
COUNTY OF RIVERISIDE TREASURER-TAX COLLECTOR 7

DescriptionMaturity
Date Coupon Par
Value BookValue
MarketPrice
MarketValue
UnrealizedGain/Loss
Yield To Maturity
ModifiedDuration
Years ToMaturityCUSIP
Month End Portfolio Holdings
FHLMC 5YrNc3MoB 10/15/2020 1.750 9,000,000.00 9,000,000.00 100.046000 9,004,140.00 4,140.00FHLMC 3YrNc3MoB 10/29/2018 1.250 25,000,000.00 25,000,000.00 100.027000 25,006,750.00 6,750.00FHLMC 5YrNc3MoB 10/29/2020 1.600 15,000,000.00 15,000,000.00 100.003000 15,000,450.00 450.00FHLMC 1.25Yr 01/27/2017 .500 25,000,000.00 25,015,000.00 99.889000 24,972,250.00 -42,750.00FHLMC 3YrNc6MoB 10/29/2018 1.050 5,000,000.00 5,000,000.00 100.012000 5,000,600.00 600.00FHLMC 3YrNc6MoB 10/29/2018 1.050 10,000,000.00 10,000,000.00 100.012000 10,001,200.00 1,200.00FHLMC 2YrNc6MoE 11/16/2017 .750 15,000,000.00 15,000,000.00 99.972000 14,995,800.00 -4,200.00FHLMC 5YrNc6MoB 10/29/2020 1.125 15,000,000.00 15,000,000.00 100.009000 15,001,350.00 1,350.00FHLMC 5YrNc3MoB 11/25/2020 1.600 14,160,000.00 14,160,000.00 100.000000 14,160,000.00 0.00FHLMC 5YrNc3MoB 11/23/2020 1.500 5,000,000.00 5,000,000.00 100.000000 5,000,000.00 0.00FHLMC 3.5YrNc1YrE 06/17/2019 1.500 25,000,000.00 25,000,000.00 100.101000 25,025,250.00 25,250.00FHLMC 2.5YrNc6MoE 06/22/2018 1.250 25,000,000.00 25,000,000.00 100.000000 25,000,000.00 0.00FHLMC 3.5YrNc6MoE 06/28/2019 1.550 25,000,000.00 25,000,000.00 100.124000 25,031,000.00 31,000.00FHLMC 2Yr 12/15/2017 1.000 20,000,000.00 19,979,400.00 100.392000 20,078,400.00 99,000.00FHLMC 3.25YrNc6MoE 03/29/2019 1.410 15,000,000.00 15,000,000.00 100.120000 15,018,000.00 18,000.00FHLMC 4YrNC6MoB 12/30/2019 1.500 15,000,000.00 15,000,000.00 100.113000 15,016,950.00 16,950.00FHLMC 5YrNc3MoB 01/29/2021 2.000 15,000,000.00 15,000,000.00 100.080000 15,012,000.00 12,000.00FHLMC 5YrNc6MoB 01/28/2021 1.750 25,000,000.00 25,000,000.00 100.120000 25,030,000.00 30,000.00FHLMC 4YrNc6MoB 01/29/2020 1.500 16,200,000.00 16,200,000.00 100.160000 16,225,920.00 25,920.00FHLMC 5YrNc3MoB 02/19/2021 1.900 15,000,000.00 15,000,000.00 100.106000 15,015,900.00 15,900.00FHLMC 5YrNc3MoB 02/19/2021 1.900 5,000,000.00 5,000,000.00 100.106000 5,005,300.00 5,300.00FHLMC 5YrNc3MoB 01/29/2021 1.625 20,000,000.00 20,000,000.00 100.028000 20,005,600.00 5,600.00FHLMC 5YrNc6MoB 01/29/2021 1.500 10,000,000.00 10,000,000.00 100.049000 10,004,900.00 4,900.00FHLMC 3YrNc6MoB 02/19/2019 1.000 12,500,000.00 12,500,000.00 100.055000 12,506,875.00 6,875.00FHLMC 3.5YrNc3MoB 08/12/2019 1.500 5,000,000.00 5,000,000.00 100.023000 5,001,150.00 1,150.00FHLMC 4YrNc3MoB 02/26/2020 1.625 5,000,000.00 5,000,000.00 100.019000 5,000,950.00 950.00FHLMC 3.75YrNc6MoB 11/25/2019 1.500 5,000,000.00 5,000,000.00 100.063000 5,003,150.00 3,150.00FHLMC 13MoNc6MoE 03/09/2017 .750 10,000,000.00 10,000,000.00 99.935000 9,993,500.00 -6,500.00FHLMC 13MoNc6MoE 03/09/2017 .750 10,000,000.00 10,000,000.00 99.935000 9,993,500.00 -6,500.00FHLMC 5YrNc3MoB 02/26/2021 1.500 20,000,000.00 20,000,000.00 99.848000 19,969,600.00 -30,400.00FHLMC 1.5YrNc3Mob 08/25/2017 .800 5,000,000.00 5,000,000.00 100.012000 5,000,600.00 600.00FHLMC 5YrNc6MoB 02/26/2021 1.250 10,000,000.00 10,000,000.00 100.000000 10,000,000.00 0.00FHLMC 5YrNc6MoB 02/26/2021 1.250 10,000,000.00 10,000,000.00 100.039000 10,003,900.00 3,900.00FHLMC 3.5YrNc3MoB 11/15/2019 1.490 10,000,000.00 10,000,000.00 99.430000 9,943,000.00 -57,000.00FHLMC 2.5YrNc1YrE 08/24/2018 1.000 5,000,000.00 5,000,000.00 99.974000 4,998,700.00 -1,300.00FHLMC 5YrNc3MoB 03/30/2021 1.600 15,000,000.00 15,000,000.00 100.031000 15,004,650.00 4,650.00FHLMC 3.75YrNc3MoB 11/26/2019 1.470 5,000,000.00 4,994,550.00 100.015000 5,000,750.00 6,200.00FHLMC 3YrNc1YrE 03/29/2019 1.300 9,000,000.00 9,000,000.00 100.257000 9,023,130.00 23,130.00FHLMC 3YrNc1YrE 03/29/2019 1.270 4,000,000.00 4,000,000.00 100.147000 4,005,880.00 5,880.00FHLMC 4YrNc3MoB 03/30/2020 1.350 8,000,000.00 8,000,000.00 100.000000 8,000,000.00 0.00FHLMC 5YrNc6MoB 03/30/2021 1.500 10,000,000.00 10,000,000.00 100.059000 10,005,900.00 5,900.00FHLMC 5YrNc6MoB 03/30/2021 1.500 15,000,000.00 15,000,000.00 100.000000 15,000,000.00 0.00FHLMC 5YrNc3MoB 03/30/2021 1.750 15,000,000.00 15,000,000.00 100.039000 15,005,850.00 5,850.00FHLMC 2.75YrNc3MoB 12/28/2018 1.250 10,500,000.00 10,500,000.00 100.012000 10,501,260.00 1,260.00FHLMC 2.25YrNc6MoB 06/29/2018 1.125 5,850,000.00 5,850,000.00 100.011000 5,850,643.50 643.50
1.189 886,751,000.00 886,833,223.55 100.057999 887,265,302.72 432,079.17
FNMA DISC NOTE 06/13/2016 .340 25,000,000.00 24,926,333.33 99.937000 24,984,250.00 57,916.67FNMA DISC NOTE 06/13/2016 .370 15,000,000.00 14,952,670.83 99.937000 14,990,550.00 37,879.17FNMA DISC NOTE 06/13/2016 .370 25,000,000.00 24,921,118.06 99.937000 24,984,250.00 63,131.94FNMA DISC NOTE 08/15/2016 .400 25,000,000.00 24,905,000.00 99.849000 24,962,250.00 57,250.00FNMA DISC NOTE 08/15/2016 .400 25,000,000.00 24,907,500.00 99.849000 24,962,250.00 54,750.00FNMA DISC NOTE 08/17/2016 .270 25,000,000.00 24,940,937.50 99.847000 24,961,750.00 20,812.50FNMA DISC NOTE 07/18/2016 .250 25,000,000.00 24,950,520.83 99.892000 24,973,000.00 22,479.17FNMA DISC NOTE 09/23/2016 .300 25,000,000.00 24,927,083.33 99.796000 24,949,000.00 21,916.67FNMA DISC NOTE 08/18/2016 .280 25,000,000.00 24,939,916.67 99.846000 24,961,500.00 21,583.33FNMA DISC NOTE 07/18/2016 .265 15,500,000.00 15,469,307.85 99.892000 15,483,260.00 13,952.15FNMA DISC NOTE 07/22/2016 .250 25,000,000.00 24,953,645.83 99.888000 24,972,000.00 18,354.17FNMA DISC NOTE 05/25/2016 .460 25,000,000.00 24,944,736.11 99.961000 24,990,250.00 45,513.89FNMA DISC NOTE 10/11/2016 .660 25,000,000.00 24,862,500.00 99.759000 24,939,750.00 77,250.00FNMA DISC NOTE 10/12/2016 .640 25,000,000.00 24,871,555.56 99.758000 24,939,500.00 67,944.44FNMA DISC NOTE 10/26/2016 .610 25,217,000.00 25,088,386.30 99.740000 25,151,435.80 63,049.50FNMA DISC NOTE 05/25/2016 .390 25,000,000.00 24,962,354.17 99.961000 24,990,250.00 27,895.83FNMA DISC NOTE 06/22/2016 .500 10,000,000.00 9,976,944.44 99.929000 9,992,900.00 15,955.56FNMA DISC NOTE 05/25/2016 .380 25,000,000.00 24,964,638.89 99.961000 24,990,250.00 25,611.11FNMA DISC NOTE 05/23/2016 .380 13,000,000.00 12,982,298.33 99.962000 12,995,060.00 12,761.67
.396 428,717,000.00 427,447,448.03 99.873216 428,173,455.80 726,007.77
FNMA 3.5YrNc6MoB 12/27/2016 .680 12,000,000.00 12,006,600.00 100.092000 12,011,040.00 4,440.00FNMA 3.5YrNc1YrB 11/28/2016 .500 10,000,000.00 9,996,000.00 100.038000 10,003,800.00 7,800.00FNMA 3.5YrNc1YrB 11/28/2016 .500 752,000.00 739,216.00 100.038000 752,285.76 13,069.76FNMA 1Yr 07/05/2016 .375 25,000,000.00 24,991,750.00 99.974000 24,993,500.00 1,750.00FNMA 1.25Yr 09/06/2016 .520 20,255,000.00 20,265,390.82 99.993000 20,253,582.15 -11,808.67FNMA 1.25Yr 08/26/2016 .625 25,000,000.00 25,044,750.00 100.065000 25,016,250.00 -28,500.00FNMA 10.5Mo 07/05/2016 .375 16,597,000.00 16,597,000.00 99.974000 16,592,684.78 -4,315.22FNMA 5YrNc6MoB 10/15/2020 1.500 10,550,000.00 10,550,000.00 100.027000 10,552,848.50 2,848.50FNMA 5YrNc6MoB 10/29/2020 1.500 10,000,000.00 10,000,000.00 100.005000 10,000,500.00 500.00FNMA 5YrNc6MoB 10/29/2020 1.500 15,855,000.00 15,855,000.00 100.017000 15,857,695.35 2,695.35FNMA 3YrNc1YrE 11/28/2018 1.200 5,000,000.00 5,000,000.00 100.000000 5,000,000.00 0.00FNMA 3YrNc1YrE 11/28/2018 1.200 5,000,000.00 5,000,000.00 100.000000 5,000,000.00 0.00FNMA 3YrNc1YrE 11/28/2018 1.200 5,000,000.00 5,000,000.00 100.000000 5,000,000.00 0.00FNMA 3YrNc6MoE 11/27/2018 1.250 15,000,000.00 15,000,000.00 100.065000 15,009,750.00 9,750.00FNMA 5YrNc6MoB 12/10/2020 1.800 15,000,000.00 15,000,000.00 100.000000 15,000,000.00 0.00FNMA 3YrNc5MoE 11/23/2018 1.450 10,000,000.00 9,999,600.00 99.996000 9,999,600.00 0.00FNMA 4YrNc6MoB 04/29/2020 1.500 15,000,000.00 15,000,000.00 100.058000 15,008,700.00 8,700.00FNMA 5YrNc6MoB 01/29/2021 1.500 8,770,000.00 8,770,000.00 100.068000 8,775,963.60 5,963.60FNMA 5YrNc6MoB 02/19/2021 1.500 6,500,000.00 6,500,000.00 100.092000 6,505,980.00 5,980.00FNMA 4YrNc6MoB 02/19/2020 1.350 15,000,000.00 15,000,000.00 100.000000 15,000,000.00 0.00FNMA 5YrNc6MoB 02/26/2021 1.125 15,000,000.00 15,000,000.00 99.859000 14,978,850.00 -21,150.00FNMA 4YrNC6MoB 03/09/2020 1.000 10,000,000.00 10,000,000.00 99.984000 9,998,400.00 -1,600.00FNMA 4YrNc6MoB 03/09/2020 1.300 15,000,000.00 15,000,000.00 100.000000 15,000,000.00 0.00FNMA 4YrNc6MoB 03/30/2020 1.250 10,000,000.00 10,000,000.00 100.000000 10,000,000.00 0.00FNMA 3YrNc6MoB 03/29/2019 1.000 20,000,000.00 20,000,000.00 100.000000 20,000,000.00 0.00FNMA 5YrNc6MoB 03/30/2021 1.375 15,000,000.00 15,000,000.00 100.000000 15,000,000.00 0.00FNMA 3.75YrNc6MoB 12/30/2019 1.510 5,000,000.00 5,000,000.00 100.000000 5,000,000.00 0.00FNMA 3.75YrNc6MoB 12/30/2019 1.510 5,000,000.00 5,000,000.00 100.000000 5,000,000.00 0.00
1.079 341,279,000.00 341,315,306.82 100.009503 341,311,430.14 -3,876.68
FHLB DISC NOTE 06/02/2016 .300 25,000,000.00 24,923,958.33 99.953500 24,988,375.00 64,416.67FHLB DISC NOTE 06/03/2016 .310 25,000,000.00 24,921,423.61 99.952750 24,988,187.50 66,763.89
313384XQ7 .301 .172 .173313384XR5 .311 .175 .175
1.069 2.739 2.835FHLB DISC NOTES
3136G3EM3 1.510 3.632 3.7513136G3EM3 1.510 3.632 3.751
3136G3EE1 1.000 2.943 2.9953136G3DV4 1.375 4.816 5.000
3136G3BX2 1.300 3.825 3.9423136G3EH4 1.250 3.890 4.000
3136G2YT8 1.125 4.752 4.9123136G2ZB6 1.000 3.851 3.942
3136G2X44 1.500 4.684 4.8933136G2XR3 1.350 3.765 3.890
3136G2WL7 1.500 3.917 4.0823136G2W45 1.500 4.629 4.836
3136G2V61 1.800 4.456 4.6993135G0H30 1.451 2.572 2.649
3136G2SX6 1.200 2.598 2.6633136G2TY3 1.250 2.593 2.660
3136G2SX6 1.200 2.598 2.6633136G2SX6 1.200 2.598 2.663
3136G2PM3 1.500 4.381 4.5843136G2QT7 1.500 4.381 4.584
3135G0XP3 .375 .262 .2633135G0YE7
3136G2N94 1.500 4.342 4.545
.479 .434 .4363133EESQ4
.477 .404 .405
3136G1LT4 1.009 .654 .663.405 .262 .2633135G0XP3
3136G14F3 .665 .735 .742FNMA BONDS
3136G1LT4 .512 .655 .663
.397 .324 .325
313588XG5 .381 .150 .151313588XE0 .381 .145 .145
313588XG5 .391 .150 .151313588YL3 .501 .226 .227
313588K46 .643 .530 .534313588M28 .613 .569 .573
313588XG5 .461 .150 .151313588K38 .664 .528 .532
313588ZN8 .266 .298 .299313588ZS7 .250 .309 .310
313588G90 .301 .480 .482313588C52 .281 .382 .384
313588C29313588C45313588ZN8 .250 .298 .299
.401 .374 .375
.271 .380 .381
.371 .202 .203313588YB5313588YB5313588C29 .402 .374 .375
313588YB5 .341 .202 .203.371 .202 .203
1.177 2.722 2.824
3130A7H40 1.250 2.705 2.7453134G8V97 1.125 2.204 2.247
3136G3FV2 1.500 4.800 5.0003134G8S75 1.750 4.768 5.000
3134G8PW3 1.350 3.881 4.0003134G8QQ5 1.500 4.800 5.000
3134G8QE2 1.300 2.927 2.9953134G8QB8 1.270 2.929 2.995
3134G8N70 1.600 4.787 5.0003134G8N62 1.500 3.581 3.658
3134G8LX5 1.490 3.507 3.6273134G8L64 1.000 2.361 2.400
3134G8KU2 1.250 4.736 4.9123134G8L31 1.250 4.736 4.912
3134G8LU1 1.500 4.703 4.9123134G8L49 .800 1.388 1.403
3134G8LG2 .750 .934 .9403134G8LG2 .750 .934 .940
3134G8JQ3 1.625 3.761 3.9103134G8K99 1.500 3.534 3.655
3134G8J26 1.000 2.832 2.8903134G8JW0 1.500 3.262 3.367
3134G8HJ1 1.625 4.613 4.8363134G8HH5 1.500 4.629 4.836
3134G8GX1 1.900 4.633 4.8933134G8GX1 1.900 4.633 4.893
3134G8FD6 1.750 4.594 4.8333134G8GU7 1.500 3.697 3.833
3134G8FH7 1.500 3.620 3.7513134G8F20 2.000 4.565 4.836
3137EADX4 1.051 1.690 1.7103134G8EL9 1.410 2.922 2.995
3134G8DD8 1.250 2.181 2.2273134G8EA3 1.550 3.159 3.244
3134G84E6 1.500 4.447 4.6523134G8DK2 1.500 3.111 3.214
3134G7S77 1.125 4.429 4.5843134G74J7 1.600 4.440 4.658
3134G72T7 1.050 2.542 2.5813134G73L3 .750 1.608 1.630
3137EADU0 .453 .819 .8273134G72T7 1.050 2.542 2.581
3134G7Z20 1.250 2.516 2.5813134G7V73 1.600 4.368 4.584
3134G7ZB0 1.750 4.310 4.545
FNMA DISC NOTES
COUNTY OF RIVERISIDE TREASURER-TAX COLLECTOR 8
DescriptionMaturity
Date Coupon Par
Value BookValue
MarketPrice
MarketValue
UnrealizedGain/Loss
Yield To Maturity
ModifiedDuration
Years ToMaturityCUSIP
Month End Portfolio Holdings
FHLB DISC NOTE 08/05/2016 .400 25,000,000.00 24,898,611.11 99.870500 24,967,625.00 69,013.89FHLB DISC NOTE 07/15/2016 .380 10,000,000.00 9,963,794.44 99.903750 9,990,375.00 26,580.56FHLB DISC NOTE 09/06/2016 .450 25,000,000.00 24,886,562.50 99.820056 24,955,013.89 68,451.39FHLB DISC NOTE 07/06/2016 .390 25,000,000.00 24,918,750.00 99.912000 24,978,000.00 59,250.00FHLB DISC NOTE 08/15/2016 .290 25,000,000.00 24,938,375.00 99.860222 24,965,055.56 26,680.56FHLB DISC NOTE 07/01/2016 .340 25,000,000.00 24,943,097.22 99.916583 24,979,145.83 36,048.61FHLB DISC NOTE 07/15/2016 .340 25,000,000.00 24,939,791.67 99.903750 24,975,937.50 36,145.83FHLB DISC NOTE 07/05/2016 .340 25,000,000.00 24,942,625.00 99.912917 24,978,229.17 35,604.17FHLB DISC NOTE 07/06/2016 .340 25,000,000.00 24,942,388.89 99.912000 24,978,000.00 35,611.11FHLB DISC NOTE 09/13/2016 .480 25,000,000.00 24,898,000.00 99.812083 24,953,020.83 55,020.83FHLB DISC NOTE 10/21/2016 .558 24,783,000.00 24,658,923.91 99.751889 24,721,510.62 62,586.71FHLB DISC NOTE 06/20/2016 .500 25,000,000.00 24,930,902.78 99.940000 24,985,000.00 54,097.22FHLB DISC NOTE 06/21/2016 .560 25,000,000.00 24,923,388.89 99.939250 24,984,812.50 61,423.61FHLB DISC NOTE 06/24/2016 .560 25,000,000.00 24,922,222.22 99.937000 24,984,250.00 62,027.78FHLB DISC NOTE 06/20/2016 .540 25,000,000.00 24,926,500.00 99.940000 24,985,000.00 58,500.00FHLB DISC NOTE 10/03/2016 .620 25,000,000.00 24,870,833.33 99.773889 24,943,472.22 72,638.89FHLB DISC NOTE 05/20/2016 .550 25,000,000.00 24,938,506.94 99.968694 24,992,173.61 53,666.67FHLB DISC NOTE 05/24/2016 .520 18,000,000.00 17,961,780.00 99.966139 17,993,905.00 32,125.00FHLB DISC NOTE 05/20/2016 .490 7,000,000.00 6,986,375.28 99.968694 6,997,808.61 11,433.33FHLB DISC NOTE 06/30/2016 .540 25,000,000.00 24,934,375.00 99.917500 24,979,375.00 45,000.00FHLB DISC NOTE 06/06/2016 .430 20,000,000.00 19,967,033.33 99.950500 19,990,100.00 23,066.67FHLB DISC NOTE 06/22/2016 .420 20,000,000.00 19,964,300.00 99.938500 19,987,700.00 23,400.00FHLB DISC NOTE 08/10/2016 .490 23,000,000.00 22,943,023.89 99.865361 22,969,033.06 26,009.17FHLB DISC NOTE 01/26/2017 .550 25,000,000.00 24,872,048.61 99.583000 24,895,750.00 23,701.39FHLB DISC NOTE 08/31/2016 .505 25,000,000.00 24,936,524.31 99.826889 24,956,722.22 20,197.91FHLB DISC NOTE 01/26/2017 .600 18,000,000.00 17,901,300.00 99.583000 17,924,940.00 23,640.00FHLB DISC NOTE 01/05/2017 .600 7,000,000.00 6,964,066.67 99.613000 6,972,910.00 8,843.33FHLB DISC NOTE 04/29/2016 .295 25,000,000.00 24,989,756.94 99.982111 24,995,527.78 5,770.84FHLB DISC NOTE 01/10/2017 .630 15,000,000.00 14,920,725.00 99.606000 14,940,900.00 20,175.00FHLB DISC NOTE 01/10/2017 .630 15,000,000.00 14,920,725.00 99.606000 14,940,900.00 20,175.00
.459 702,783,000.00 700,550,689.87 99.865642 701,838,755.90 1,288,066.03
FHLB 5YrNC3MoB 05/23/2018 .750 10,000,000.00 10,000,000.00 99.921000 9,992,100.00 -7,900.00FHLB 5YrNc3MoB 06/19/2018 1.000 750,000.00 750,000.00 100.000000 750,000.00 0.00FHLB 5YrNc3MoB 06/19/2018 1.000 750,000.00 750,000.00 100.000000 750,000.00 0.00FHLB 5YrNc3MoB 06/19/2018 1.000 750,000.00 750,000.00 100.000000 750,000.00 0.00FHLB 5YrNc3MoB 06/19/2018 1.000 1,500,000.00 1,500,000.00 100.000000 1,500,000.00 0.00FHLB 5YrNc3MoB 06/20/2018 1.250 3,719,720.08 3,719,720.08 99.754000 3,710,569.57 -9,150.51FHLB 1.25Yr 06/24/2016 .375 25,000,000.00 25,002,650.00 99.999000 24,999,750.00 -2,900.00FHLB 1Yr 05/04/2016 .300 15,000,000.00 14,996,250.00 100.014000 15,002,100.00 5,850.00FHLB 1YrNc7MoE 06/17/2016 .400 15,000,000.00 15,000,000.00 99.997000 14,999,550.00 -450.00FHLB 1Yr 06/17/2016 .350 25,000,000.00 25,000,000.00 100.005000 25,001,250.00 1,250.00FHLB 1Yr 06/17/2016 .350 25,000,000.00 25,000,000.00 100.005000 25,001,250.00 1,250.00FHLB 1Yr 06/30/2016 .320 25,000,000.00 24,985,250.00 100.004000 25,001,000.00 15,750.00FHLB 2YrNc1YrE 07/06/2017 .910 10,000,000.00 10,000,000.00 100.040000 10,004,000.00 4,000.00FHLB 1Yr 07/28/2016 .375 9,700,000.00 9,697,963.00 100.023000 9,702,231.00 4,268.00FHLB 2.5YrNc1YrE 02/26/2018 1.100 15,000,000.00 15,000,000.00 100.041000 15,006,150.00 6,150.00FHLB 3.25YrNc1YrE 11/26/2018 1.300 10,000,000.00 9,996,800.00 100.336000 10,033,600.00 36,800.00FHLB 1YrNc7MoE 09/09/2016 .510 10,000,000.00 10,004,300.00 100.007000 10,000,700.00 -3,600.00FHLB 1YrNc3MoB 11/25/2016 .550 25,000,000.00 25,000,000.00 100.019000 25,004,750.00 4,750.00FHLB 2Yr 12/01/2017 1.020 10,000,000.00 10,000,000.00 100.000000 10,000,000.00 0.00FHLB 1Yr 12/14/2016 .750 15,370,000.00 15,360,624.30 100.168000 15,395,821.60 35,197.30FHLB 3YrNc1YrE 12/28/2018 1.360 15,000,000.00 15,000,000.00 100.329000 15,049,350.00 49,350.00FHLB 3YrNc6MoB 12/28/2018 1.500 10,000,000.00 10,000,000.00 100.121000 10,012,100.00 12,100.00FHLB 5YrNc6MoB 03/30/2020 1.550 10,000,000.00 10,000,000.00 100.126000 10,012,600.00 12,600.00FHLB 4YrNc6MoB 12/30/2019 1.750 10,000,000.00 10,000,000.00 100.108000 10,010,800.00 10,800.00FHLB 3.25YrNc6MoB 04/29/2019 1.550 10,000,000.00 10,000,000.00 100.178000 10,017,800.00 17,800.00FHLB 1YrNc3MoB 02/17/2017 .720 25,000,000.00 25,000,000.00 99.929000 24,982,250.00 -17,750.00FHLB 1.5Yr 05/24/2017 .875 25,000,000.00 25,046,250.00 100.228000 25,057,000.00 10,750.00FHLB 2.5YrNc1YrE 09/28/2018 1.100 5,000,000.00 5,000,000.00 100.179000 5,008,950.00 8,950.00FHLB 2.5YrNc6MoE 09/28/2018 1.125 15,000,000.00 15,000,000.00 100.000000 15,000,000.00 0.00FHLB 1.75YrNc3MoB 12/29/2017 1.000 5,000,000.00 4,998,285.00 99.965700 4,998,285.00 0.00
.772 382,539,720.08 382,558,092.38 100.056004 382,753,957.17 195,864.79
FFCB DISC NOTE 06/08/2016 .360 6,086,000.00 6,067,315.98 99.941000 6,082,409.26 15,093.28FFCB DISC NOTE 07/25/2016 .410 15,000,000.00 14,940,208.50 99.885000 14,982,750.00 42,541.50FFCB DISC NOTE 07/25/2016 .410 25,000,000.00 24,900,631.94 99.885000 24,971,250.00 70,618.06FFCB DISC NOTE 06/06/2016 .370 15,000,000.00 14,954,675.00 99.943000 14,991,450.00 36,775.00FFCB DISC NOTE 06/07/2016 .380 23,914,000.00 23,839,786.89 99.942000 23,900,129.88 60,342.99FFCB DISC NOTE 09/01/2016 .440 25,000,000.00 24,888,472.22 99.822000 24,955,500.00 67,027.78FFCB DISC NOTE 09/01/2016 .440 25,000,000.00 24,889,083.33 99.822000 24,955,500.00 66,416.67FFCB DISC NOTE 09/13/2016 .360 50,000,000.00 49,832,000.00 99.808000 49,904,000.00 72,000.00FFCB DISC NOTE 08/29/2016 .330 25,000,000.00 24,926,895.83 99.833000 24,958,250.00 31,354.17FFCB DISC NOTE 09/12/2016 .340 25,000,000.00 24,921,375.00 99.809000 24,952,250.00 30,875.00FFCB DISC NOTE 07/27/2016 .310 25,000,000.00 24,939,506.94 99.883000 24,970,750.00 31,243.06FFCB DISC NOTE 07/27/2016 .310 25,000,000.00 24,939,506.94 99.883000 24,970,750.00 31,243.06FFCB DISC NOTE 07/29/2016 .310 25,000,000.00 24,939,291.67 99.881000 24,970,250.00 30,958.33FFCB DISC NOTE 09/07/2016 .340 25,000,000.00 24,923,972.22 99.815000 24,953,750.00 29,777.78FFCB DISC NOTE 07/06/2016 .300 9,500,000.00 9,479,654.17 99.904000 9,490,880.00 11,225.83FFCB DISC NOTE 10/13/2016 .460 25,000,000.00 24,890,430.56 99.756000 24,939,000.00 48,569.44FFCB DISC NOTE 07/28/2016 .390 25,000,000.00 24,927,958.33 99.882000 24,970,500.00 42,541.67FFCB DISC NOTE 10/17/2016 .650 10,000,000.00 9,950,166.67 99.751000 9,975,100.00 24,933.33FFCB DISC NOTE 10/17/2016 .650 25,000,000.00 24,877,222.22 99.751000 24,937,750.00 60,527.78FFCB DISC NOTE 10/17/2016 .650 15,000,000.00 14,926,333.33 99.751000 14,962,650.00 36,316.67FFCB DISC NOTE 05/18/2016 .360 12,000,000.00 11,985,840.00 99.966000 11,995,920.00 10,080.00FFCB DISC NOTE 12/23/2016 .550 27,000,000.00 26,874,600.00 99.638000 26,902,260.00 27,660.00
.408 483,500,000.00 481,814,927.74 99.833102 482,693,049.14 878,121.40
FFCB 5Yr 04/20/2016 .502 10,000,000.00 9,995,000.00 100.005000 10,000,500.00 5,500.00FFCB 5Yr 10/10/2019 .512 15,000,000.00 15,000,000.00 99.259000 14,888,850.00 -111,150.00FFCB 5Yr 10/10/2019 .512 25,000,000.00 25,000,000.00 99.259000 24,814,750.00 -185,250.00FFCB 5Yr 10/10/2019 .512 10,000,000.00 9,997,560.00 99.259000 9,925,900.00 -71,660.00FFCB 3YrNcYr1C 05/13/2016 .375 10,000,000.00 10,000,000.00 100.000000 10,000,000.00 0.00FFCB 1Yr 05/13/2016 .400 12,296,000.00 12,303,807.96 100.014000 12,297,721.44 -6,086.52FFCB 1.25Yr 06/27/2016 .500 25,000,000.00 25,000,000.00 99.977000 24,994,250.00 -5,750.00FFCB 1.25Yr 09/16/2016 .450 10,000,000.00 10,000,000.00 99.956000 9,995,600.00 -4,400.00FFCB NOTES 06/24/2016 .350 25,000,000.00 24,996,250.00 100.039000 25,009,750.00 13,500.00FFCB 2Yr 04/21/2017 .600 10,000,000.00 10,000,000.00 99.816000 9,981,600.00 -18,400.00FFCB 1.25Yr 06/24/2016 .350 12,000,000.00 11,996,400.00 100.039000 12,004,680.00 8,280.00FFCB 1.25Yr 06/24/2016 .350 25,000,000.00 24,995,500.00 100.039000 25,009,750.00 14,250.003133EEC40 .366 .232 .233
3133EEZR4 .600 1.048 1.0583133EEC40 .376 .232 .233
3133EEZB9 .450 .462 .4633133EEC40 .363 .232 .233
3133EDSR4 .350 .118 .1183133EEVB3 .500 .240 .241
3133EDXQ0 .519 3.509 3.5293133ECP99 .375 .118 .118
3133EDXQ0 .512 3.510 3.5293133EDXQ0 .512 3.510 3.529
31331KHV5 1.083 .055 .055
.553 .727 .732
.410 .401 .403
313312K90 .653 .544 .548.360 .131 .132
313312ZY9313312K90313312K90 .653 .544 .548
.391 .325 .326
.653 .544 .548
313312ZA1 .301 .265 .266313312K58 .462 .534 .537
313312ZZ6 .311 .328 .329313312E97 .341 .437 .438
313312ZX1 .311 .322 .323313312ZX1 .311 .322 .323
313312D80 .331 .412 .414313312F62 .341 .450 .452
.442 .420 .422313312F70 .361 .453 .455
.381 .185 .186313312E30 .442 .420 .422
.412 .316 .318313312XU9 .371 .183 .184
.361 .188 .189313312ZV5 .412 .316 .318
.769 1.206 1.2323130A7GJ8
1.125 2.450 2.4963130A7GQ21.020 1.724 1.748
.728 1.137 1.1483130A7H57 1.100 2.451 2.4963130A1NN4
3130A6ZW0 1.550 2.975 3.079.720 .873 .8853130A7BY0
3130A6XB8 1.550 3.864 4.0003130A6VT1 1.750 3.599 3.751
3130A6W94 1.360 2.673 2.7453130A6WU7 1.500 2.666 2.745
3130A6V95 1.020 1.643 1.6713130A6VS3 .811 .698 .707
3130A6BD8 .469 .442 .4443130A6R74 .550 .647 .655
3130A66H5 1.100 1.876 1.9103130A67G6 1.310 2.588 2.658
3130A5M30 .910 1.251 1.2663130A64L8 .396 .325 .326
3130A5FQ7 .350 .213 .2143130A5GD5 .375 .249 .249
3130A5FW4 .400 .213 .2143130A5FQ7 .350 .213 .214
3133834R9 .366 .232 .2333130A5AE9 .325 .093 .093
313383CP4 1.000 2.184 2.219313383EP2 1.250 2.175 2.222
313383CP4 1.000 2.184 2.219313383CP4 1.000 2.184 2.219
3133833M1 .750 2.118 2.145FHLB BONDS
313383CP4 1.000 2.184 2.219
.460 .341 .343313385AK2313385AK2 .633 .775 .781
.633 .775 .781
.603 .762 .767313384WE5 .295 .079 .079313397AE1
313384E21 .506 .417 .419.603 .819 .825313385BB1
313384B57 .491 .360 .362313385BB1 .553 .820 .825
313384XU8 .431 .183 .184313384YL7 .421 .226 .227
313384XB0 .491 .136 .137313384YU7 .541 .248 .249
313384XB0 .551 .136 .137313384XF1 .521 .147 .148
313384YJ2 .542 .221 .222313384J34 .623 .506 .510
313384YK9 .562 .223 .225313384YN3 .562 .231 .233
313384L56 .561 .555 .559313384YJ2 .501 .221 .222
313384ZA0 .341 .265 .266313384F79 .482 .452 .455
313384ZK8 .341 .289 .290313384YZ6 .341 .262 .263
313384C23 .291 .374 .375313384YV5 .341 .251 .252
313384E88 .452 .433 .436313384ZA0 .391 .265 .266
313384A82 .402 .346 .348313384ZK8 .381 .289 .290
FFCB DISC NOTES
313312WZ9313312U40
FFCB BONDS
313312XW5
313312ZV5
313312XV7
313312E30
COUNTY OF RIVERISIDE TREASURER-TAX COLLECTOR 9
DescriptionMaturity
Date Coupon Par
Value BookValue
MarketPrice
MarketValue
UnrealizedGain/Loss
Yield To Maturity
ModifiedDuration
Years ToMaturityCUSIP
Month End Portfolio Holdings
FFCB 2Yr 05/08/2017 .650 15,000,000.00 14,991,000.00 100.064000 15,009,600.00 18,600.00FFCB 1Yr 05/26/2016 .300 15,000,000.00 15,000,000.00 99.997000 14,999,550.00 -450.00FFCB 1Yr 06/20/2016 .450 7,000,000.00 7,003,780.00 100.045000 7,003,150.00 -630.00FFCB 1.5Yr 01/13/2017 .500 10,000,000.00 10,000,000.00 100.134000 10,013,400.00 13,400.00FFCB 1Yr 08/11/2016 .400 25,000,000.00 25,000,000.00 100.019000 25,004,750.00 4,750.00FFCB 1Yr 08/11/2016 .400 15,000,000.00 15,000,000.00 100.019000 15,002,850.00 2,850.00FFCB 1Yr 08/11/2016 .400 15,000,000.00 15,000,000.00 100.019000 15,002,850.00 2,850.00FFCB 1Yr 08/11/2016 .400 10,000,000.00 10,000,000.00 100.019000 10,001,900.00 1,900.00FFCB 1.5Yr 02/06/2017 .590 10,000,000.00 10,000,000.00 99.964000 9,996,400.00 -3,600.00FFCB 1.5Yr 02/06/2017 .590 10,000,000.00 10,000,000.00 99.964000 9,996,400.00 -3,600.00FFCB 1.5Yr 02/06/2017 .590 15,000,000.00 14,989,950.00 99.964000 14,994,600.00 4,650.00FFCB 3YrNc3MoA 10/15/2018 1.110 5,000,000.00 5,000,000.00 100.001000 5,000,050.00 50.00FFCB 2Yr 09/25/2017 .900 25,250,000.00 25,371,578.75 100.319000 25,330,547.50 -41,031.25FFCB 2Yr 05/22/2017 .625 15,650,000.00 15,669,343.40 99.975000 15,646,087.50 -23,255.90FFCB 1.25Yr 01/13/2017 .430 24,000,000.00 23,994,480.00 99.994000 23,998,560.00 4,080.00FFCB 1.5 Yr 04/21/2017 .500 25,000,000.00 24,987,765.25 99.758000 24,939,500.00 -48,265.25FFCB 1Yr 11/28/2016 .450 15,000,000.00 15,000,000.00 99.892000 14,983,800.00 -16,200.00FFCB 1.5Yr 03/27/2017 .520 10,000,000.00 10,000,000.00 99.817000 9,981,700.00 -18,300.00
FFCB 2Yr 02/09/2018 .521 15,000,000.00 15,000,000.00 99.843000 14,976,450.00 -23,550.00
FFCB 2Yr 02/09/2018 .521 20,000,000.00 20,000,000.00 99.843000 19,968,600.00 -31,400.00
FFCB 3Yr 11/23/2018 .552 10,000,000.00 10,006,056.38 99.685000 9,968,500.00 -37,556.38
FFCB 3Yr 02/25/2019 .703 15,000,000.00 15,000,000.00 100.001000 15,000,150.00 150.00FFCB 3Yr 02/25/2019 .703 5,000,000.00 5,000,000.00 100.001000 5,000,050.00 50.00FFCB 2.5Yr 09/17/2018 .661 5,000,000.00 5,000,000.00 100.000000 5,000,000.00 0.00FFCB 3YrNc1YrA 03/29/2019 1.250 10,310,000.00 10,310,000.00 100.005000 10,310,515.50 515.50
.522 536,506,000.00 536,608,471.74 99.915623 536,053,311.94 -555,159.80
FAMCA DISC NOTE 08/25/2016 .345 40,000,000.00 39,882,316.67 99.838000 39,935,200.00 52,883.33FAMCA DISC NOTE 10/17/2016 .720 10,000,000.00 9,937,400.00 99.751000 9,975,100.00 37,700.00FAMCA DISC NOTE 10/03/2016 .700 15,000,000.00 14,918,625.00 99.769000 14,965,350.00 46,725.00
FAMCA DISC NOTE 10/03/2016 .700 25,000,000.00 24,864,375.00 99.769000 24,942,250.00 77,875.00
FAMCA DISC NOTE 04/26/2016 .290 10,000,000.00 9,996,616.67 99.985000 9,998,500.00 1,883.33FAMCA DISC NOTE 01/18/2017 .680 20,000,000.00 19,884,022.22 99.594000 19,918,800.00 34,777.78
.546 120,000,000.00 119,483,355.56 99.779333 119,735,200.00 251,844.44
FAMCA 3Yr 09/05/2017 1.120 8,850,000.00 8,850,000.00 100.594000 8,902,569.00 52,569.00FAMCA 1Yr 05/24/2016 .400 15,000,000.00 15,000,000.00 100.036000 15,005,400.00 5,400.00FAMCA 1Yr 07/07/2016 .410 25,000,000.00 25,000,000.00 100.037000 25,009,250.00 9,250.00FAMCA 5YrNc3MoB 10/05/2020 1.700 10,000,000.00 10,000,000.00 100.012000 10,001,200.00 1,200.00FAMCA 1Yr 02/23/2017 .500 25,000,000.00 25,000,000.00 100.127000 25,031,750.00 31,750.00FAMCA 3Yr 03/19/2019 .693 10,000,000.00 10,000,000.00 99.995000 9,999,500.00 -500.00FAMCA 3Yr 07/26/2019 .759 15,000,000.00 15,000,000.00 99.992000 14,998,800.00 -1,200.00
.680 108,850,000.00 108,850,000.00 100.090463 108,948,469.00 98,469.00
UC REGENTS 05/17/2016 .430 30,800,000.00 30,777,926.67 99.945056 30,783,077.11 5,150.44UC REGENTS 07/15/2016 .570 23,000,000.00 22,961,034.17 99.833750 22,961,762.50 728.33
.490 53,800,000.00 53,738,960.84 99.897472 53,744,839.61 5,878.77
LOUISIANA STATE 05/15/2016 .540 12,070,000.00 12,070,000.00 100.000000 12,070,000.00 0.00CONNECTICUT ST 08/01/2018 2.250 25,000,000.00 25,613,250.00 102.453000 25,613,250.00 0.00CONNECTICUT ST 08/01/2016 2.000 23,000,000.00 23,304,520.00 101.324000 23,304,520.00 0.00WASHINGTON STATE 08/01/2017 .830 12,885,000.00 12,885,000.00 100.000000 12,885,000.00 0.00TEXAS ST 10/01/2019 1.497 5,000,000.00 5,000,000.00 100.000000 5,000,000.00 0.00TEXAS ST 10/01/2017 .723 7,500,000.00 7,500,000.00 100.000000 7,500,000.00 0.00CALIFORNIA STATE 11/01/2016 .500 55,960,000.00 56,014,840.80 100.098000 56,014,840.80 0.00CALIFORNIA STATE 11/01/2016 1.250 15,000,000.00 15,062,100.00 100.414000 15,062,100.00 0.00CALIFORNIA STATE 11/01/2016 1.250 5,000,000.00 5,020,700.00 100.414000 5,020,700.00 0.00OHIO STATE 05/01/2017 1.250 9,215,000.00 9,268,354.85 100.579000 9,268,354.85 0.00OHIO STATE 05/01/2018 1.250 9,535,000.00 9,597,549.60 100.656000 9,597,549.60 0.00
1.159 180,165,000.00 181,336,315.25 100.650135 181,336,315.25 0.00
TOYOTA MOTOR CORP 04/08/2016 .570 25,000,000.00 24,952,500.00 99.992222 24,998,055.56 45,555.56
NESTLE 05/12/2016 .450 30,000,000.00 29,953,125.00 99.954444 29,986,333.33 33,208.33TOYOTA MOTOR CORP 11/21/2016 .910 50,000,000.00 49,660,013.89 99.525500 49,762,750.00 102,736.11TOYOTA MOTOR CORP 09/27/2016 .783 48,000,000.00 47,810,720.00 99.721556 47,866,346.67 55,626.67NESTLE 08/03/2016 .520 20,000,000.00 19,963,311.11 99.807111 19,961,422.22 -1,888.89TOYOTA MOTOR CORP 06/24/2016 .480 22,000,000.00 21,974,773.33 99.899667 21,977,926.67 3,153.34
.676 195,000,000.00 194,314,443.33 99.770684 194,552,834.45 238,391.12
.664 6,319,225,720.08 6,312,840,233.99 99.999444 6,319,190,571.12 6,350,337.13
.664 6,319,225,720.08 6,312,840,233.99 99.999444 6,319,190,571.12 6,350,337.13
.916 .638 .644.115
.723 1.026
.571 .022 .022
.451 .114
1.048
677522HV9 .741 1.070 1.085677522HW7 .940 2.043 2.085
13063CFD7 .642 .578 .589.642 .578 .589
.723 1.487 1.504
.401 .581 .589
93974DSZ2 .830 1.323 1.3371.497 3.379 3.504
1.398 2.265 2.337.600 .336 .337
546415L73 .540 .123 .123
20772JK92
91411SGF1 .571 .289 .29091411SEH9
.490 .197 .198
MUNI ZER0 CPNS.430 .128 .129
3132X0EV9 .759 3.269 3.321.680 1.515 1.550
3132X0CY5 .500 .891 .9013132X0ED9 .693 2.937 2.967
3132X0AY7 .410 .268 .2683132X0CB5 1.700 4.289 4.518
31315P2K4 1.120 1.412 1.43331315PT33 .400 .148 .148
.548 .486 .490FARMER MAC
31315KWB2 .290 .071 .07131315LAT5 .684 .797 .803
31315KJ35 .704 .506 .510
31315KJ35 .704 .506 .510
FMAC DISC NOTES.346 .401 .403.725 .544 .548
31315KD4931315KK90
.523 1.150 1.161
3133EFM61 .661 2.441 2.4663133EFV38 1.250 2.930 2.995
3133EFE52 .703 2.869 2.9073133EFE52 .703 2.869 2.907
3133EFNK9 .521 1.850 1.863
3133EFQJ9 .529 2.631 2.649
3133EFLM7 .520 .985 .989
3133EFNK9 .521 1.850 1.863
3133EFKR7 .533 1.049 1.0583133EFLN5 .450 .656 .663
3133EEN48 .547 1.134 1.1423133EFJK4 .449 .781 .789
3133EFHH3 1.110 2.484 2.5423133EFEM5 .650 1.472 1.488
3133EE6A3 .590 .843 .8553133EE6A3 .635 .843 .855
3133EE4G2 .400 .363 .3643133EE6A3 .590 .843 .855
3133EE4G2 .400 .363 .3643133EE4G2 .400 .363 .364
3133EE3Y4 .500 .780 .7893133EE4G2 .400 .363 .364
3133EEN89 .300 .153 .1533133EDNS7 .396 .221 .222
3133EEJ43 .680 1.094 1.104
MUNI BONDS
882723ZZ513063CXT2
COMM PAPER89233GD86
882723A33
20772JL34
13063CFD7
64105GEC4
89233GJT464105GH31 .521 .340 .342
.783 .489 .49389233GLM6
89233GFQ4 .481 .232 .233
.678 .365 .368
Grand Total .651 1.038 1.065
Total Fund .651 1.038 1.065
COUNTY OF RIVERISIDE TREASURER-TAX COLLECTOR 10
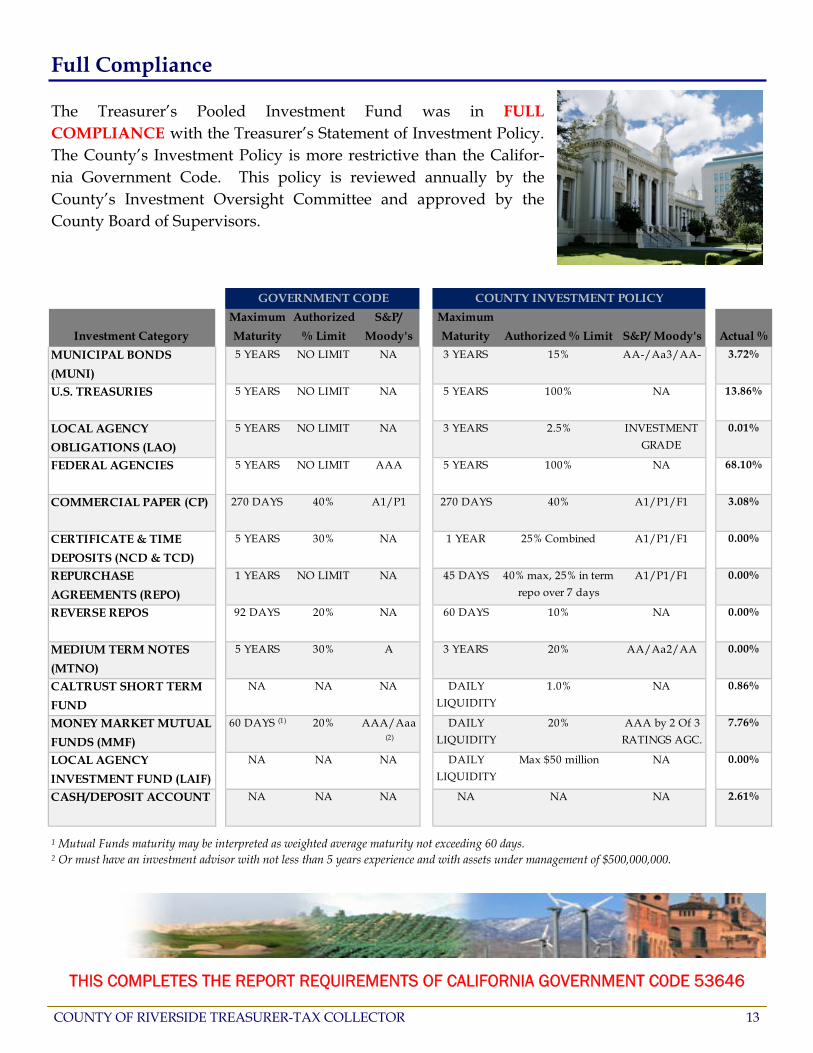
1 Mutual Funds maturity may be interpreted as weighted average maturity not exceeding 60 days. 2 Or must have an investment advisor with not less than 5 years experience and with assets under management of $500,000,000.
THIS COMPLETES THE REPORT REQUIREMENTS OF CALIFORNIA GOVERNMENT C0DE 53646
Investment Category
Maximum
Maturity
Authorized
% Limit
S&P/
Moody's
Maximum
Maturity Authorized % Limit S&P/ Moody's Actual %
MUNICIPAL BONDS
(MUNI)
5 YEARS NO LIMIT NA 3 YEARS 15% AA-/Aa3/AA- 3.72%
U.S. TREASURIES 5 YEARS NO LIMIT NA 5 YEARS 100% NA 13.86%
LOCAL AGENCY
OBLIGATIONS (LAO)
5 YEARS NO LIMIT NA 3 YEARS 2.5% INVESTMENT
GRADE
0.01%
FEDERAL AGENCIES 5 YEARS NO LIMIT AAA 5 YEARS 100% NA 68.10%
COMMERCIAL PAPER (CP) 270 DAYS 40% A1/P1 270 DAYS 40% A1/P1/F1 3.08%
CERTIFICATE & TIME
DEPOSITS (NCD & TCD)
5 YEARS 30% NA 1 YEAR 25% Combined A1/P1/F1 0.00%
REPURCHASE
AGREEMENTS (REPO)
1 YEARS NO LIMIT NA 45 DAYS 40% max, 25% in term
repo over 7 days
A1/P1/F1 0.00%
REVERSE REPOS 92 DAYS 20% NA 60 DAYS 10% NA 0.00%
MEDIUM TERM NOTES
(MTNO)
5 YEARS 30% A 3 YEARS 20% AA/Aa2/AA 0.00%
CALTRUST SHORT TERM
FUND
NA NA NA DAILY
LIQUIDITY
1.0% NA 0.86%
MONEY MARKET MUTUAL
FUNDS (MMF)
60 DAYS (1) 20% AAA/Aaa (2)
DAILY
LIQUIDITY
20% AAA by 2 Of 3
RATINGS AGC.
7.76%
LOCAL AGENCY
INVESTMENT FUND (LAIF)
NA NA NA DAILY
LIQUIDITY
Max $50 million NA 0.00%
CASH/DEPOSIT ACCOUNT NA NA NA NA NA NA 2.61%
GOVERNMENT CODE COUNTY INVESTMENT POLICY
The Treasurer’s Pooled Investment Fund was in FULL COMPLIANCE with the Treasurer’s Statement of Investment Policy. The County’s Investment Policy is more restrictive than the Califor-nia Government Code. This policy is reviewed annually by the County’s Investment Oversight Committee and approved by the County Board of Supervisors.
Full Compliance
COUNTY OF RIVERSIDE TREASURER-TAX COLLECTOR 13

County o f R ive rs ide T r e a s u r e r - T a x C o l l e c t o r
C a p i t a l M a r k e t s
4 0 8 0 L e m o n S t r e e t , 4 t h F l o o r R i v e r s i d e , C A 9 2 5 0 2 - 2 2 0 5
www.treasurer-tax.co.riverside.ca.us
( 9 5 1 ) 9 5 5 - 3 9 7 9