poor quality drugs and global trade: a pilot...
TRANSCRIPT
1
Poor Quality Drugs and Global Trade: A Pilot Study
Roger Bate, AEI
Ginger Zhe Jin, University of Maryland and NBER
Aparna Mathur, AEI
Amir Attaran, University of Ottawa
Abstract
Experts claim that some Indian drug manufacturers cut corners and make substandard drugs for markets
with non-existent, under-developed or emerging regulatory oversight, notably Africa. This paper assesses
the quality of 1470 antibiotic and tuberculosis drug samples in solid oral form (tablet or capsule) that
claim to be made in India and were sold in Africa, India, and five mid-income non-African countries. We
find that 10.9% of those products fail a basic assessment of active pharmaceutical ingredients (API), and
the majority of the failures are substandard (7%) as they contain some correct API but the amount of API
is under-dosed. The distribution of these substandard products is not random: they are more likely to be
found as unregistered products in Africa than in India or non-African countries. Moreover, our finding is
robust for manufacturer-drug fixed effects, and is unlikely to be explained by differences in storage
conditions as the five Indian cities in our sample are on average more likely to have high temperatures,
above 25C or 30C, than the other African or non-African cities. A more likely explanation is that Indian
pharmaceutical firms and/or their export intermediaries differentiate drug quality according to the
destination of consumption.
Keywords: prescription drug, quality, international trade, Africa, India.
JEL: D8, F14, F61, I1, L15.
_____________________________________________________________________________________
Contact Information: Roger Bate: American Enterprise Institute, 1150 17th St NW, Washington DC 20036, 202-828-
6029,[email protected]. Ginger Zhe Jin: 3115 F Tydings Hall, Department of Economics, University of Maryland,
College Park MD 20742, (301) 405-3484, [email protected]. Aparna Mathur: American Enterprise Institute, 1150
17th St NW, Washington DC 20036, 202-828-6026, [email protected]. Amir Attaran: Faculty of Law, Institute of
Population Health, University of Ottawa, 57 Louis Pasteur St, Ottawa, Ontario, K1N 6N5, 613-562-5800,
Acknowledgements: The Legatum Institute funded the collection of medicines and testing and a grant from the
Social Sciences and Humanities Research Council of Canada provided subsequent funding to cover analysis of drug
samples. We would like to thank Jackie Goldman and Anthony Paranzino for excellent research assistance, and
Swaraj Barooah,Vince Suneja, Anna Meyendorff, and participants at the 2014 World Bank workshop "Quality of
Health Services & Products in Low Income Countries” and the 2015 Bates White Life Sciences Symposium for
detailed comments on an earlier draft.
2
I. Introduction
Free trade allows specialization, encourages competition and generally enhances
efficiency. However, when it comes to heavily regulated products such as prescription drugs,
globalization implies a patchwork of uneven regulations. Countries differ greatly in their product
registration process, quality standards, price controls, customs and law enforcement. For a drug
to be produced in country A and exported to country B, legitimate manufacturers have to meet
multiple regulatory targets in both countries, which increases the cost of compliance while
introducing incentives for cheating and even trading falsified or substandard medicines.
In this paper, we examine 1470 samples of antibiotics and tuberculosis (TB) medicines
claiming to be made in India. They were collected from five cities inside India as well as 17 low-
to-middle-income countries outside of India, and tested for basic quality using the Minilab
protocol. We find that a significantly higher fraction of these Indian-made drugs are of poorer
quality if they were purchased from Africa than from India or from Non-African mid-income
countries such as China, Brazil, Turkey, Thailand and Russia. These patterns persist even after
we control for manufacturer-drug fixed effects, suggesting that they are driven by variations
within the same manufacturer as labeled on the package. Moreover, the above pattern is driven
more by non-registered substandard products that contain insufficient active pharmaceutical
ingredient (API) than by falsified drugs that contain zero API.
Pharmaceutical experts anecdotally have observed that some Indian manufacturers sell
inferior medicines to markets where drug regulatory oversight is weak, and better medicines to
markets where oversight is more effective.1 This paper attempts to test whether this perception is
validated by the data. In doing so, there are some challenging factual confounders: isolated
reports2, now several years old, indicate Chinese organized criminals counterfeited Indian drugs;
and even genuine, top quality Indian drugs can degrade with improper handling so as to become
1 On May 13, 2013, Ranbaxy Laboratories Limited, a major Indian drug manufacturer, pleaded guilty with seven
US federal criminal charges on selling adulterated generic drugs, fabricating data, and committing fraud. The
company was reported to have a culture that was “for management to dictate the results it wanted and for those
beneath to bend the process to achieve it.” Dinesh Thakur, the whistle blower, described “how Ranbaxy took its
greatest liberties in markets where regulation was weakest and the risk of discovery was lowest.” (Fortune, May 15,
2013 “Dirty Medicine” by Katherine Eban, accessed at http://fortune.com/2013/05/15/dirty-medicine/ on August 27,
2014). See also Ranbaxy Writ Petition, Supreme Court of India, 2013, accessed
at http://www.scribd.com/doc/160520772/149915683-Ranbaxy-Writ-Petition on August 27, 2014. 2 http://timesofindia.indiatimes.com/business/india-business/Chinese-passing-off-fake-drugs-as-Made-in-
India/articleshow/4633377.cms
3
substandard. Neither of these circumstances is the fault of Indian companies. However, our
findings suggest that the main problem for inferior quality in Africa of Indian products is more
likely in the manufacturing or distribution than in counterfeiting or careless storage at the
purchase city. One likely explanation is that some Indian manufacturers as labeled in our drug
samples and/or their export intermediaries differentially supply poor quality products to African
markets where GDP per capita is low and local regulations are weak. This could be driven by
economic concerns: because demand conditions vary across countries, suppliers may have
incentives to deliver lower-quality products to a low-end market or conduct less quality control
in such a market.
We review the related literature in Section 2 and then describe how we arrive at the above
data patterns in Section 3. Section 4 explores a few potential explanations. While it is often
difficult to pin down the intent of organized crime, we crosschecked our samples with their
product registration status at the destination country, as failure to register a medicine is unlawful
in most countries and prima facie evidence of wrongdoing. We argue that the significant cost of
product registration affects the incentive of quality choice by manufacturers. Section 5 discusses
the implication of our findings for various parties.
II. Literature
Our work is related to two strands of literature: one on drug quality in global markets, the
other on international trade of medicines and other merchandise.
The literature on global drug quality aims to document the extent of quality problems. As
summarized in IOM (2013), industrial databases, international police investigations, case studies,
news reports, and scientific works based on retail drug samples have all pointed to a persistent
and probably growing3 problem of falsified and substandard drugs4. However, existing evidence
3 We are addressing substantive quality problems in medicines that do not help the patient in addressing the disease,
not those that exhibit simply superficial concerns. For example, some medicine could be rejected by health
authorities because tablets (or even just the packaging) may be discolored, when in fact the medicine may work
perfectly well.
4 Most studies focus on a few specific countries or a few specific products, making it difficult to compare across
studies. Due to data, budget and institutional limitations, many studies rely on convenience sampling rather than
probability-based sampling, and draw more samples from formal retail channels (e.g. pharmacy stores) than from
informal channels (e.g. street vendors or bus vendors). One exception is Kaur et al. (2008), who used stratification to
collect 1,080 antimalarial drug samples from Tanzania in 2005 and found a failure rate of 12.2% after testing 301
samples. In another example, Stanton et al. (2012) randomly chose 75 vendors in Ghana and from them collected
101 samples of ergometrine and oxytocin (drugs used to treat postpartum hemorrhage). They found that 89% failed
4
often suffers from reporting bias, a small number of observations, and lack of representative
coverage. As a result, public data are limited in estimating the magnitude of the problem. That
being said, data from the Pharmaceutical Security Institute indicate that poor-quality medicines
were found in 124 countries in 2011, with the problem severer in low- and mid-income countries
than in developed countries (IOM 2013). One potential explanation is that developing countries
often have weak regulatory oversight and lax law enforcement, which attract the manufacture
and trade of poor-quality drugs.
The international trade literature has long been interested in how product quality varies
by origin, destination, and as compared to domestic trade. However, product quality is often
difficult to measure, leading most researchers to rely on price as a proxy for quality (Schott
2004; Hummels and Skiba 2004; Hummels and Klenow 2005; Hallak 2006; Khandelwal 2010;
Baldwin and Harrigan 2011; Johnson 2012; Crozet, Head and Mayer 2012). As detailed in our
earlier studies, price is at best a noisy signal of drug quality in the global market (Bate, Jin and
Mathur 2010) and sometimes can be misleading as counterfeiters mimic legitimate drugs in
packaging and price (Bate, Jin and Mathur 2014).
A strand of the trade literature focuses on medicine, but mostly on patent protection
rather than drug quality. Using the implementation deadline of the World Trade Organizations
Trade-related Intellectual Property Rights (TRIPS), researchers have shown that patent
protection led to faster market launch, higher sales, and increased prices for innovator-branded
drugs (Kyle and Qian 2013; Duggan and Goyal 2012).5 Better patent protection is also found to
encourage drug innovation and patent applications (Arora et al. 2008, Kyle & McGahan 2012)
but may reduce consumer welfare (Chaudhuri, Goldberg and Jia 2006).
Little academic work has looked at the trade of cheaper and potentially poorer-quality
drugs in global markets. Our pilot study aims to address this gap in the literature. In particular,
we focus on generic antibiotics and tuberculosis (TB) medicines that are labeled “made in India.”
In the past two decades, India has grown to be the third largest manufacturing country for
pharmaceuticals, accounting for 13% of the global pharmaceutical production (in value) and
pharmacopeial testing and only 0% of ergometrine and 26% for oxytocin met pharmacopeial specifications. 5 Similar to patent protection, other pharmaceutical regulations may affect the diffusion of new drugs as well. For
example, Cockburn, Lanjouw and Schankerman (2014) show that stringent price control tends to delay new drug
launches in both low- and mid-income countries.

5
22% of international trade in generic medicines (Sharma, Kumar and Sharma 2008; KPMG
2006).6
One primary advantage of Indian-made drugs is that they tend to be low priced (Cameron
et al. 2008). Health Action International’s interactive map shows that Indian generic
ciprofloxacin is the cheapest in the world, often by two orders of magnitude from richer market
innovator versions (HAI 2010). Despite the price advantage, USP (2013) and Stanton et al.
(2014) have published evidence of frequent, often serious quality failures in “made in India”
medicines (purchased in and out of India), which paints a more bleak picture than what the
Indian government admitted in its 2009 report (CDSCO 2009).
We choose to focus on common broad-spectrum antibiotics and specialized tuberculosis
antibiotics in solid oral form (tablets and capsules), partly because these anti-bacterial medicines
are among the most commonly used in developing countries7, and because they are relatively
cheap making it possible to purchase and test a large sample . Inferior versions of antibiotics can
be both fatal to the patient, and promote drug resistance that undermines the future effectiveness
of even good quality medicines. Anti-infectives are also thought to be one of the drug categories
most affected by poor drug quality (IOM 2013).
Not only will inferior medicines harm individual patients, but intermittently effective
medicines containing some but not sufficient anti-bacterial ingredients can also evolve drug
resistance (Bate et al 2013, Binagwaho et al 2013). Experience teaches that drug resistance does
not stay confined, but spreads to other countries. Thus poor quality medicines consumed in poor
countries can evolve resistance that diminishes from treatment outcomes even in rich countries
where good quality medicines predominate.
III. Data Description
6 Thousands of pharmaceutical companies operate in India, some are large and licensed while others are small and
informal (KPMG 2006). According to an Indian government report on the industry (MCFDP 2012), nineteen of the
twenty-one large Indian pharmaceutical manufacturers devoted at least 50% of their net sales to export in 2010-11,
of which eight exported more than 75%.( Based on authors’ calculation from Table 2 of MCFDP (2012), Section
2.9, page 16.)
7 We choose not to include antimalarial drugs because there is so little malaria in some locations that availability of
medicines to treat it is highly limited. We also exclude vaccines such as BCG because it is not deployed routinely in
many of the locations we sampled from.

6
Over 2,500 treatments of ciprofloxacin, erythromycin, isoniazid and rifampicin, were
collected from pharmacies in 22 cities of 18 low- to mid-income countries between 2009 and
2012. The sampling methodology is detailed elsewhere (Bate et al 2014). Briefly, in each target
city, we instructed covert shoppers from the local population to randomly walk into pharmacies
and claim that a family member needed a specific type of drug. To mimic real patients as much
as possible, the covert shoppers did not present a doctor’s prescription and always purchased the
pharmacist-suggested brand. Informal drug vendors (bus vendors, mobile carts, etc.) are
prevalent in some locations, but to be able to compare across all locations, our shoppers only
visited pharmacies with a regular storefront. As a result, our samples are likely to understate the
problem of poor-quality drugs, given the expectation and existing evidence that informal vendors
sell worse drugs (IOM 2013).
All medicines were assessed following the Global Pharma Health Fund (GPHF) e.V.
Minilab® protocol to identify substandard or counterfeit medicines. The key test for our sample
is the semi-quantitative thin-layer chromatography (TLC), which assesses the presence and
concentration of active ingredient in a test sample as compared to the reference standard.8 Given
the size of our sample and funding constraints, TLC is the best test method we can afford.9 It is
important to note that passing the TLC test is a necessary condition for the medicine to work, but
it is far from sufficient. To be sure of the quality of a medicine, one would need to conduct many
tests with more advanced (and expensive) laboratory and clinical methods to detect dissolution
time, impurities, degradation products, provenance and bioequivalence. In that sense, our
estimation of quality is a very basic one, which understates the frequency of quality failures. This
is why we title the paper as a pilot study. Organizations with larger budgets should undertake
more definitive tests to assess how many more, and which types of, products fail more
comprehensive analyses.
All tests were conducted within 60 days after purchase in the Africa Fighting Malaria
Minilab in Cambridge, UK. Following the classification in Bate, Jin and Mathur (2014), a drug
8 The TLC test requires the tested product to have 80-100% of the correct active ingredient, when compared to the
reference standard. The principal spot obtained with the test solution should travel the same distance on a TLC plate
and yield highly similar shapes, colors, intensities, and sizes as the reference standard. The distance that the sample
travels informs of the drug identity; the intensity of the spot informs of the amount of active ingredient (Jähnke et al.
2001). 9 TLC test has strengths and drawbacks as compared to more advanced techniques such as high-performance liquid
chromatography (HPLC) and spectroscopy (IOM 2013). Its main strength is the ability to yield “versatile and
robust” results at a low cost (Kaale et al., 2011).
7
sample is referred to as falsified if it contains zero correct API10, and referred to as substandard if
it contains some correct API but the amount of API is under-dosed (below 80%).
As acknowledged in other studies (Attaran et al 2012), the legal distinction between
falsified and substandard products is one of intention: both sorts of compromised medicines are
not as labeled and violate the relevant technical or regulatory standards, but substandard
medicines are compromised accidentally or negligently, while falsified medicines are
compromised intentionally, with this difference not always being apparent from the content of
the medicine. In other words, legally speaking, falsified products are the product of organized
criminal intent, but substandard medicines could be wrongfully produced by otherwise
legitimate, law-abiding manufacturers. While criminal intent may not always be apparent from a
chemical analysis , this paper distinguishes substandard and falsified drugs by API only.
The API results on ciprofloxacin, isoniazid and rifampicin have been reported in several
peer reviewed papers (Bate, Jin, Mathur 2011; Bate et al. 2013; Bate, Jin, Mathur 2014) but none
of them compares drug quality of the same manufacturer across different purchase countries. The
data on erythromycin are used for the first time in this paper.
Our sample contained medicines from 29 countries of manufacture as stated on the
packaging, among which India is the largest. No other manufacture country has similar presence
in our sample that would facilitate a meaningful, statistical comparison against India. For this
reason, we focus here only on the 1470 products that claim to be “made in India”. The label of
these products reveals 17 unique Indian manufacturers.11 Note that being labeled “made in India”
does not necessarily mean the actual manufacturer is an Indian firm. In eight samples of
ciprofloxacin, we have learned that the products were counterfeits made in or shipped from
China, based on information from the companies in question, who we asked for confirmation.12
In Section 4, we will explore counterfeiting as a potential explanation for our quality test results
and check the robustness of data analysis excluding these eight counterfeiting cases.
Table 1 shows the distribution of drugs by drug type and purchase country. Among the
four drug types, ciprofloxacin and erythromycin are mainstream broad-spectrum antibiotics,
10 Only a few samples have obvious falsified packaging and they all turn out to have zero API. 11 Our IRB commitment prevents us from revealing the identity of individual manufacturers as labeled on the
package. 12 In Bate, Jin and Mathur (2014), we coded these eight cases as manufactured in China, thus the number of India-
made ciprofloxacin is 683 instead of 691 in that paper. We keep these 8 cases here because the analysis sample of
this paper is defined by the label of “made in India” on the package.
8
isoniazid and rifampicin are first-line antibiotics for tuberculosis (TB) mycobacteria. Because
drug availability varies across purchase countries (in part because the targeted disease varies), we
have 691 ciprofloxacin from all 18 purchase countries, 286 erythromycin from 11 countries, 223
isoniazid from 10 countries and 270 rifampicin from 11 countries. Our sample size on
ciprofloxacin is greater than for other drugs in part because the initial rounds of data collection
were more focused on ciprofloxacin and partly because there is more restricted access to TB
medications. Further, some products were not available in markets where we expected them to
be.
Out of the total 1470 “made-in-India” samples, 956 were bought within India, 430 bought
from Africa, and 84 bought from Non-African countries outside of India (including China,
Brazil, Russia, Turkey, Thailand) -- groups that we term Indian domestic, Africa, and Non-
Africa purchases, respectively. For ciprofloxacin, we have data from all three purchase groups.
For the other three drugs, the comparison focuses on Africa versus India domestic. Our
regression methodology uses manufacturer-drug fixed effects to ensure that our comparison of
drug quality within a manufacturer is also within the same drug type. With these controls, the
difference between Africa and India domestic is identified in all drug types, while the difference
between non-Africa and India-domestic is identified in ciprofloxacin only. While our main
results are based on the full sample, later we will provide robustness checks on the subsample of
ciprofloxacin only.
Table 1 summarizes drug quality and price by drug type and purchase country group.
Prices are converted to US dollars by the exchange rate at the time of purchase and deflated to
2010 dollars. As detailed above, quality is measured by conformity to active pharmaceutical
ingredient (API) content in a chromatographic assay. We define a sample as failing the basic
quality test if its API is below 80% of the correct amount (per the label and benchmark authentic
sample), with 0% API deemed falsified. Out of the 1470 samples, 10.9% failed basic quality
tests, 103 (7%) were substandard and 57 (3.9%) were falsified.
Both antibiotics and TB drugs had more substandard than falsified products, which is
consistent with mistake or negligence being more widespread than outright crime. As shown in
Table 1, India domestic drugs are substantially cheaper than drugs purchased out of India,
consistent with the literature (Cameron et al. 2008). However, drugs purchased from Africa are
more likely to fail the TLC test than the same type of drugs in the Indian domestic group. In
9
comparison, drugs from Non-Africa have a greater passing rate than the Indian domestic ones for
ciprofloxacin.
Many studies have shown that product registration is arguably the most important factor
in ensuring drug quality in developing countries, although its practice varies greatly across
countries (Bate et al 2010, Torstensson and Pugatch 2010). Our previous studies also show that
registered and unregistered products differ significantly in both price and quality (Bate, Mathur
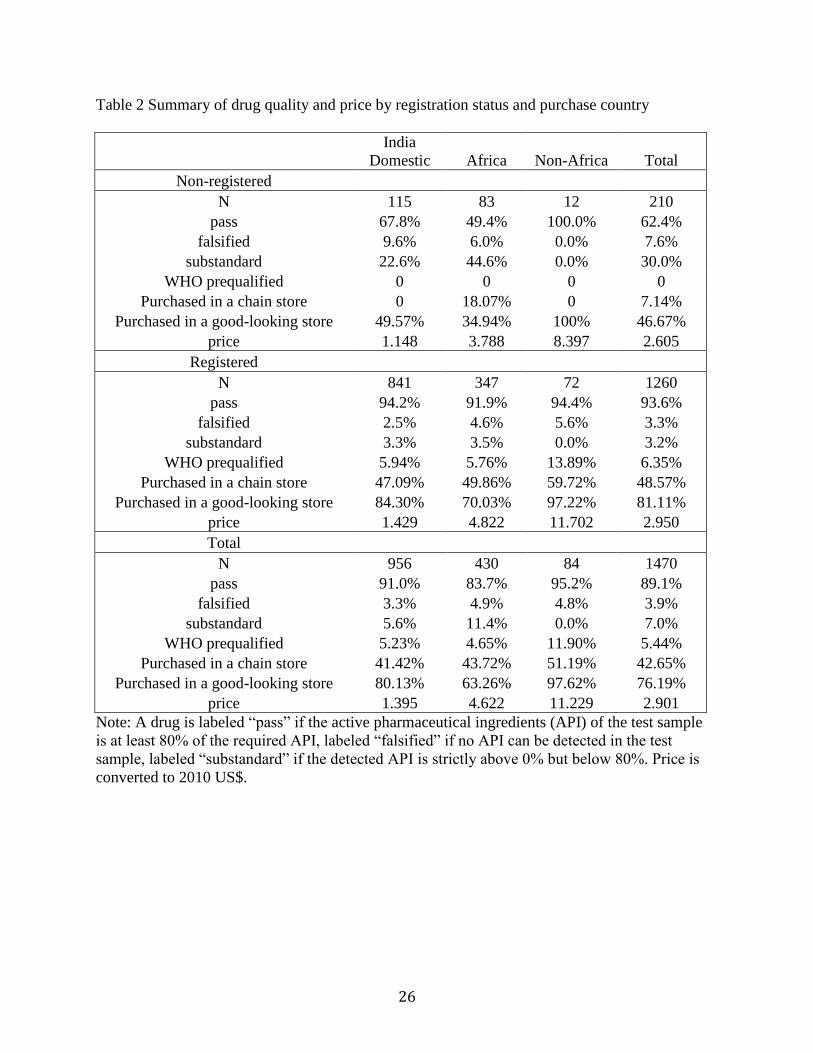
and Jin 2011, 2014). In light of this, Table 2 groups the data by purchase country group and
product registration status. Consistent with previous findings, registered products charge a higher
price and are more likely to pass the TLC test.
Conditional on failing the TLC test, we find that registered products are more likely to be
falsified than to be substandard, which is consistent with legitimate manufacturers following
regulatory guidelines. The correlation between product registration status and purchase country
group is interesting. Among registered products, we observe more falsified drugs than
substandard drugs out of India, for both Africa and Non-Africa. Inside India, the percent of
substandard drugs is slightly higher (3.3%) than falsified drugs (2.5%). Overall, the passing rates
of registered products are similar across the three purchase groups, ranging from 91.9% to
94.4%. However, among non-registered products, the composition of passing, falsified and
substandard drugs is vastly different across country groups. The passing rate in Africa is even
below 50% -- worse than random chance – and the majority of failures are driven by substandard
drugs. The passing rate inside India is also low (67.8%), with substantially more substandard
drugs (22.6%) than falsified drugs (9.6%). Non-African countries are the best (100% pass), but
the number of observations is very small. To summarize, these patterns suggest that the quality
difference by purchase country group is mostly driven by non-registered products and
substandard drugs account for the majority of problems in non-registered products.
In addition to product registration, several studies have demonstrated the role of the
WHO prequalification13 and retail chain status in drug quality (Bate, Jin and Mathur 2014;
Bennett and Yin 2014). Of the 1,470 samples in our data, 80 are prequalified by the WHO and
all of them appear to be registered. All but one of them passed our basic quality test; the one that
failed has zero API and is probably a counterfeit. 42.65% of our sample were purchased from a
13 http://www.who.int/topics/prequalification/en/

10
chain store14 and 76.19% from a store that our covert shoppers subjectively assessed to be clean
and tidy and professionally run. Consistent with the literature, purchases from chain store or
more professional looking stores are more likely to pass our basic quality test. Table 2 further
presents the breakdown of WHO prequalification, chain store purchases, and good-looking store
purchases by product registration and purchase country groups. Not surprisingly, the percentage
of WHO prequalified products and the percentage of products from chains or good-looking
stores are all lower in African countries than in India Domestic or non-Africa.
Could these patterns be driven by Indian manufacturers or their export intermediaries
exporting products of different quality to different countries? Table 3 regresses the dummy of
passing the quality test on drug purchase country groups, with and without manufacturer-drug
fixed effects (drug type fixed effects are included in the regression without manufacturer-drug
fixed effects). We use linear probability model instead of probit in order to facilitate comparison
with and without a large number of manufacturer-drug fixed effects. 15 The error terms are
clustered by drug and purchase country group. Using the full sample, the first column finds
significantly lower quality in Africa than in India domestic, while Non-Africa is statistically
better than India domestic. This negative coefficient on Africa is even more conspicuous after we
control for manufacturer-drug fixed effects in Column 2. With the fixed effects, Non-Africa and
India domestic become statistically similar to each other. In the third and fourth columns, we
redo the regressions for registered drugs only and find no significant difference across the three
country groups. When we focus on non-registered drugs only, quality in Africa is significantly
worse than Indian domestic, and quality in Non-Africa is the best. Again this pattern becomes
even stronger in magnitude when we control for manufacturer-drug fixed effects, suggesting that
they are driven by variations within the manufacturer-drug combination.
Table 4 presents two robustness checks for different subsamples. In the first three
columns, we rerun Table 3 excluding the eight known counterfeits from China. The three
columns are for all observations, registered drugs, and non-registered drugs respectively.
14 A pharmacy was considered to be part of a chain if at least two distinct stores with similar layout and under the
same retail logo were found in at least two different parts of the same city or multiple cities.
15 Some of the 30 manufacturer-drug combinations have less than 10 observations in the cell, and these small cells
may generate incidental parameter problem in probit with fixed effects. That being said, results are robust if we use
probit instead of linear probability model (with the manufacturer-drug fixed effects). The probit results are available
upon request.
11
Columns (4) to (6) repeat the exercise but focus on ciprofloxacin only. Every column controls for
manufacturer-drug fixed effects. Both robustness checks display similar findings as in Table 3:
drugs from Africa are more likely to fail than those from India or non-Africa and the failures are
driven by non-registered products.16
IV. Further Data Analysis and Potential Interpretations
So far, we have discovered two interesting patterns regarding drug quality: first, “made in
India” drugs purchased from Africa are of worse quality than those purchased within India, and
from Non-Africa countries outside of India. This pattern is robust to manufacturer-drug fixed
effects. Second, the above pattern is mostly driven by non-registered substandard products.
This section attempts to use data analysis and economic logic to explain these data
patterns.
IV.1 Why do we observe the worst drug quality in Africa?
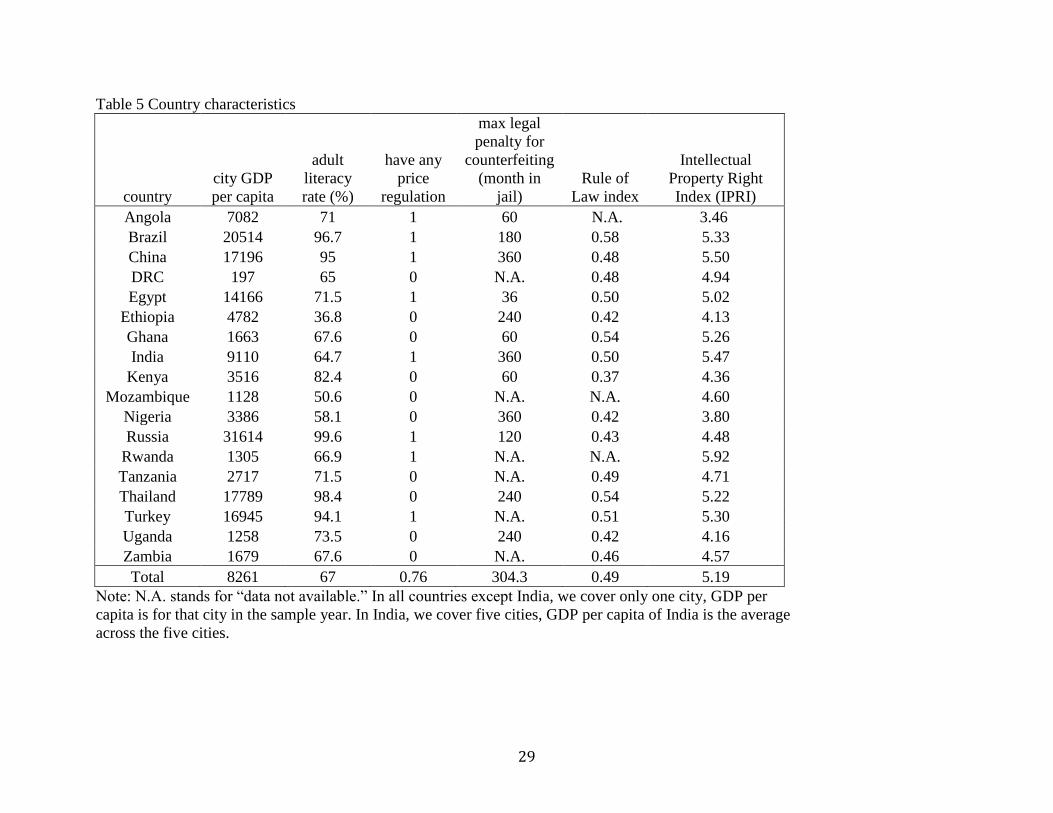
To highlight the differences between Africa, India domestic and Non-Africa, we
collected country/city specific data in six dimensions: GDP per capita, adult literacy, the
presence of any price control, maximum penalty for counterfeiting, Rule of Law (ROL) index,
and International Property Right Index (IPRI).
In particular, the year- and city-specific GDP per capita data (adjusted for PPP) were
constructed for 2009, 2010 and 2012 using city GDP estimates from PricewaterhouseCoopers
(PWC 2009) and city population estimates from the 2009 revision of the UN’s World
Urbanization Prospects Report (UK 2009; UN 2009). The PWC city GDP estimates for 2008
were extended to 2009-2012 using country level GDP growth rates from the International
Monetary Fund (IMF 2009-2012). City population estimates were extended forward to 2012
using the UN report’s 2005–2010 average population growth and its 2015 estimated population
growth figures (UN revisions for 2005-2010). For Accra, Kampala, Kigali, Lubumbashi, Lusaka
and Maputo, city-level data were not available in some years, so we used country-level GDP per
capita data from the IMF World Economic Outlook Database as of July 2014 (IMF 2014).
16 In an unreported table, we further restrict the sample to ciprofloxacin only and exclude the eight known
counterfeits from China. Results are very similar.
12
Male and female adult literacy rates were obtained from country-specific UNESCO data
from 2009 and 2012, compiled from censuses and surveys conducted between 1999 and 2012.
For four countries (Brazil, Egypt, Ethiopia and South Africa) UNESCO did not have 2009
figures. In these cases, we relied on the 2009 UNDP Human Development Report (UNDP 2009),
which compiles country-specific data from censuses and surveys conducted between 1999 and
2007, which are also compiled by UNESCO (UN 2009). The literacy rates of these four
countries are therefore slightly older than the rest. We take the average of female and male
literacy rates as they are highly correlated (correlation coefficient = 0.89).
Price regulations include whether a purchase country issues price ceilings, mandatory
retail prices, and/or price guidance. We hand-collected these regulations from each country’s
most recent government documents. Given the wide variety of price regulations across countries,
a binary variable was defined as equal to one if a country has adopted any price regulation on
pharmaceuticals in the data collection year and zero otherwise. For two observations, we use the
closest later-year data to impute missing values in 2009.
We proxy ex post penalty for counterfeiters by the number of months a person will be
sentenced to prison if he is found guilty for counterfeiting drugs. Minimum and maximum
penalty were hand collected from the latest legal documents we could find in each country. To
accommodate diverse sentencing guidelines, monetary fines are coded as zero months and the
death penalty is coded as 360 months (30 years). We use maximum penalty in the analysis. For
six countries, we could not find any information on maximum penalty, which accounts for 8.3%
of the analysis sample.
Rule of Law index was constructed by the World Justice Project. Based on 100,000
household and expert surveys in 99 countries and jurisdictions, this index describes a nation’s
rule of law status by summarizing 47 indicators along nine themes: constraints on government
powers; absence of corruption; open government; fundamental rights; order and security;
regulatory enforcement; civil justice; criminal justice; and informal justice (WJP 2014). ROL
index was first available in 2010, and has increased its country coverage from 66 countries in
2010 to 99 countries in 2014. If a country was covered by the ROL index since 2010, we use its
2010 ROL index for the data collection years before 2010 and its 2012 ROL index for the sample
year of 2012. If a country was first covered by the ROL index in 2012 or 2014, we use the
closest later-year ROL index to impute its missing value in earlier years. Of the 1470
13
observations, 10.9% have imputed ROL index, another 3.1% have missing values in the ROL
index as ROL never covered 3 countries in our sample.
The IPRI index was constructed by the Property Rights Alliance (PRA), with the help of
74 international organizations and the Hernando de Soto Fellowship Program (PRA 2013). It
measures the intellectual and physical property rights of 131 nations. The IPRI index was first
available in 2007 and updated yearly since then. We use the IPRI index corresponding to the data
collection year. If a country has missing values in a specific year, we use its closest later-year
IPRI index to impute the missing value (2.1% of observations have imputed IPRI index).
Both ROL and IPRI indices provide a large number of indicators by detailed categories.
Because these indicators are highly correlated, we use the overall ROL and IPRI indices.
Countries that have missing values in the ROL index or maximum legal penalty carry a dummy
variable indicating the missing data for the specific variable.
Table 5 summarizes the country/city specific characteristics in our sample. Table 6 shows
their correlations. As expected, GDP per capita is positively correlated with adult literacy, rule of
law, and IPRI index. Richer countries are more likely to have any price regulation, but the
correlation between GDP per capita and maximum penalty for counterfeiting is much weaker.
In Table 7 Column 1, we repeat the basic regression from Table 3 Column 2 (dependent
variable is whether a drug sample passes the TLC test). In Table 7 Column 2 we add product
registration status, WHO prequalification, and what type of store the product was purchased
from.17 Alternatively, on top of Column 1, we include the six country/city characteristics to
detect their influence on drug quality in Column 3. The last column of Table 7 includes all
product and country/city characteristics. Manufacturer-drug fixed effects are always included.
As we expect, whether a product is registered and whether the product was purchased
from a chain or professional-looking store are significantly correlated with passing the basic
quality test, whenever they are included. However, the coefficient of WHO prequalification is
always insignificant, likely because all WHO prequalified products are registered and we have
included product registration in the same regression. More importantly, even after controlling for
17 Note that we exclude price from this regression since price is very correlated with purchase country (given the
large differences in income levels). Hence the price coefficient likely will pick up cross-country differences rather
than the signaling effect of price within a country or country group. Also, price and quality are jointly determined by
suppliers in response to local demand, thus including price on the right hand side will mask the effect of the other
more fundamental differences across purchase country groups.
14
these product characteristics in Column 2, there is still a significant quality difference between
Africa, India domestic and non-Africa, suggesting that product registration, WHO
prequalification and retail store type are not enough to explain away all the quality difference by
purchase country.
As shown in Column 3, when the regression only includes country/city attributes on the
right hand side, both GDP per capita and having any price regulation have a significant
coefficient. While we have expected higher income countries to have better drug quality, the
negative coefficient on price regulation is a surprise. One possible explanation is that price
ceiling may reduce the room to use price as a signal for quality. When we include both product
attributes and country/city attributes in Column 4, the coefficient of GDP per capital remains
positive (with marginal significance) but the coefficient of price regulation becomes
insignificant. In both Columns 3 and 4, the coefficient of Africa is much closer to zero in
magnitude and no longer significant.
Overall, these results suggest that, among all six country/city attributes, GDP per capita
has the biggest statistical power explaining the quality differences across purchase country
groups. In the mean time, product attributes including registration status, always play an
important role in explaining drug quality.
IV.2 Which part of the supply chain is likely responsible for poor drug quality in Africa?
While income, local regulation, and retail network may all contribute to worse drug
quality in Africa, the fight against poor drug quality requires more knowledge about the source
of poor drug quality. Is it because Indian manufacturers cut corners or selectively export their
inferior batches to Africa, or do some criminal counterfeiters pretend to be legitimate
manufacturers? Maybe distributors also do a poor storage job along the supply chain which
affects drug quality? Answering these questions will help improve drug quality, but direct
evidence is extremely hard to get.
Even if the manufacturer label is correct, the manufacturer may prefer to claim a poor
quality sample counterfeit and therefore circumvent its responsibility. Proof of criminal intent is,
of course, a forensic question with many factors, not just product quality. We therefore do the
best we can, and try to use economic logic to infer the most likely party responsible for poor-
15
quality drugs. Readers should note that our negative inferences, while based on the best available
information and transparent assumptions, are not formal criminal accusations.
There are several possibilities regarding the true responsible party behind poor-quality
drugs. In the first possibility, all manufacturer labels are correct but some Indian manufacturers
or their export intermediaries intentionally export inferior products to Africa. This could happen
because African countries are typically poorer, have a less educated population, and do not
function well in regulating drug quality (Seiter 2010). In addition, facing more limits in
economic resources, households in African countries may have a lower willingness to pay for a
given increase in drug quality, even if they know the quality difference perfectly. This will create
an economic incentive for manufacturers (or their export intermediaries) to either supply lower-
quality products to a low-end market or exercise less quality control in such a market. We group
all the above possibilities as intentional quality differentiation by purchase region. The second
possibility is that counterfeiters (wherever they are based), who pretend to be the labeled Indian
manufacturer, produce poorer-quality drugs in Africa because the risk of being caught is lower in
African countries. Thirdly, wholesale distributors obtain the same quality of drugs from India,
but they do a worse job in storing and distributing them within Africa. This could happen either
because the cost of proper storage is too high in Africa or because distributors cut corners
intentionally.
While poor distribution undoubtedly occurs in some settings (Bate 2012), for these drugs,
which are not especially chemically labile, it is virtually impossible to reduce API from 100% to
0%. Hence, poor distribution cannot explain falsified products. Moreover, our previous paper
analyzed a larger dataset of ciprofloxacin samples including those approved by stringent
regulatory authorities (SRA) such as US Food & Drug Administration (Bate, Jin and Mathur
2014). In that paper, we found that SRA-approved ciprofloxacin, if containing any correct API,
always passed the basic quality test regardless whether they were purchased from Africa or
elsewhere.18 This suggests that degradation should not be the main factor driving poor drug
quality in Africa.
To check statistically whether poor storage and degradation may explain our findings, we
collected each city’s average daily high temperature per calendar month from weather-and-
18 As reported in Bate, Jin and Mathur (2014), there are 89 SRA approved ciprofloxacin in our data: 88 of them
passed the basic quality test and one was found to be falsified.
16
climate.com and worldweatheronline.com.19 The four drug types in our sample, all in solid oral
form (tablet or capsule), require storage at room temperatures no higher than 25°C or 30°C.20
Therefore, from the weather data, we count the number of calendar months during which a city
has an average daily high temperature above 30°C, and the number of months between 25°C and
30°C. Both counts are controlled for in the last three columns of Table 4, which repeats the Table
3 regressions with manufacturer-drug fixed effects. These results show that the coefficient of
Africa is still negative after we add the temperature variables, although its statistical significance
reduces slightly from 99% to 95% for the full sample regression and from 95% to 90% for the
subsample of registered drugs or non-registered drugs.
In most cases, the coefficients for the two temperature variables are insignificant from
zero. The only exception is the positive coefficient of months over 30°C in Column (7), which is
against the predication that hotter cities are more likely to have quality problem due to poor
storage condition. This is consistent with the raw correlation between weather and quality
measures: the number of months in a year that have an average high temperature above 30°C is
higher in India (9.44) than in Africa (3.14) or non-Africa (4.43), which is therefore unlikely to
explain why the average drug quality is found higher in India than in Africa. For this reason,
below we focus on the potential identity of manufacturer. It is still possible that although
temperatures may be lower in Africa than India, that storage types (non-climate controlled metal
structures that suffer from high temperatures) are worse in Africa. But we have no evidence for
this. For all of the above reasons, below we focus on the potential identity of manufacturer.
To obtain an intelligent guess of whether the true manufacturer is the labeled Indian firm
or a counterfeiter, we need a few more assumptions. In particular, we assume individual
consumers cannot discern drug quality at the time of purchase, although there is some chance
that sophisticated consumers or third-parties (e.g. government, NGOs, researchers) may discover
poor quality drugs in the future.21 This implies that today’s market demand (q) only depends on
19 Neither website covers all of our 22 cities. We obtain temperature data of 14 cities from weather-and-climate.com
and the data of the other 8 cities from worldweatheronline.com.
20 We consulted fda.gov for the storage requirement of ciprofloxacin, healthcentral.com for isoniazid, drugs.com for
erythromycin and webmd.com for rifampicin. Erythromycin is required to be stored in a tight container no higher
than 25C, the other three no higher than 30C.
21 It should be noted that arguably the most sophisticated NGO in the health sphere, Doctors Without Borders, was
itself a victim of buying falsified HIV medications. So while NGOs may discover a problem, it is invariably after the
fact.

17
observable manufacturer characteristics but it is more valuable to continue the business beyond
today if the quality of today’s product is good. For simplicity, let us assume drug quality can be
good (G, with >80% API), substandard (S, with > 0% and < 80% API), or bad (B, with 0% API),
and denote the value of continuing the business after today as V.
Now consider three types of “Indian” manufacturers that produce drug X in purchase
country A: the first type is a real Indian firm that has registered with the government of A
(referred to as “registered firm”); the second type is a real Indian firm that has not registered in A
(referred to as “unregistered firm”); and the third type is a counterfeiter who may choose to
pretend to be the registered firm or the unregistered firm. Consumers observe the labeled
manufacturer identity and its registration status. All three types of manufacturers may choose to
produce good (G), substandard (S), or bad (B).
For a registered firm, producing G today implies earning a normal profit margin today
((𝑝𝑟 − 𝑐𝐺) ∙ 𝑞𝑟) and keeping a good continuation value (𝑉𝑟) for the future. If the discount rate is
δ, the gain from good quality is 𝜋𝑟,𝐺 = (𝑝𝑟 − 𝑐𝐺) ∙ 𝑞𝑟 + 𝛿 ∙ 𝑉𝑟,𝐺. In comparison, producing S or
B means a higher profit margin today but a lower continuation value in the future. That is, 𝜋𝑟,𝑆 =
(𝑝𝑟 − 𝑐𝑆) ∙ 𝑞𝑟 + 𝛿 ∙ 𝑉𝑟,𝑆 and 𝜋𝑟,𝐵 = (𝑝𝑟 − 𝑐𝐵) ∙ 𝑞𝑟 + 𝛿 ∙ 𝑉𝑟,𝐵 , where 𝑉𝑟,𝐺 > 𝑉𝑟,𝑆 > 𝑉𝑟,𝐵 .
Apparently, a registered firm prefers to produce good quality if the short run cost savings are
smaller than the long run loss in continuation value.
𝜋𝑟,𝐺 > 𝜋𝑟,𝑆 if 𝛿 ∙ (𝑉𝑟𝐺 − 𝑉𝑟𝑆) > (𝑐𝐺 − 𝑐𝑆) ∙ 𝑞𝑟;
𝜋𝑟,𝐺 > 𝜋𝑟,𝐵 if 𝛿 ∙ (𝑉𝑟𝐺 − 𝑉𝑟𝐵) > (𝑐𝐺 − 𝑐𝐵) ∙ 𝑞𝑟 .
Similarly, for an unregistered firm facing the same cost structure, we have
𝜋𝑛𝑟,𝐺 > 𝜋𝑛𝑟,𝑆 if 𝛿 ∙ (𝑉𝑛𝑟,𝐺 − 𝑉𝑛𝑟,𝑆) > (𝑐𝐺 − 𝑐𝐵) ∙ 𝑞𝑛𝑟;
𝜋𝑛𝑟,𝐺 > 𝜋𝑛𝑟,𝐵 if 𝛿 ∙ (𝑉𝑛𝑟,𝐺 − 𝑉𝑛𝑟,𝐵) > (𝑐𝐺 − 𝑐𝐵) ∙ 𝑞𝑛𝑟 .
Because product registration is costly, registered products often enjoy better price on the market
and selling unregistered products is technically illegal, we believe the long run loss of producing
poor quality is greater for registered firms. In other words, under the assumption that (𝑉𝑟𝐺−𝑉𝑟𝑆)
𝑞𝑟>
(𝑉𝑛𝑟,𝐺−𝑉𝑛𝑟,𝑆)
𝑞𝑛𝑟 and
(𝑉𝑟𝐺−𝑉𝑟𝐵)
𝑞𝑟>
(𝑉𝑛𝑟,𝐺−𝑉𝑛𝑟,𝐵)
𝑞𝑛𝑟, registered firms should have more incentives to
produce good quality products than unregistered firms.
The incentives of the counterfeiter are somewhat different. Because most counterfeiters
are fly-by-night, we assume they only care about profit in the near future net of the potential risk
18
of being caught for counterfeiting. Since the penalty for counterfeiting is usually independent of
whether the counterfeits contain any API, this implies that producing zero-API drugs always
generates higher profits than producing drugs with correct API, regardless whom the
counterfeiter pretends.
If counterfeiters will only produce bad quality drugs, the question is whether they should
counterfeit registered products or unregistered products. Recall that registered products imply
higher prices and a larger demand. Let F be the penalty of counterfeiting if caught. Assuming the
chance of being caught is 𝜌𝑟 for counterfeiting a registered product and 𝜌𝑛𝑟 for counterfeiting an
unregistered product, the counterfeiter would prefer to pretend to be a registered firm if (1 −
𝜌𝑟) ∙ (𝑝𝑟 − 𝑐𝐵) ∙ 𝑞𝑟 − 𝜌𝑟 ∙ F > (1 − 𝜌𝑛𝑟) ∙ (𝑝𝑛𝑟 − 𝑐𝐵) ∙ 𝑞𝑛𝑟 − 𝜌𝑛𝑟 ∙ F . In other words, the main
tradeoff for the counterfeiter is the higher profit of counterfeiting registered products versus the
potentially higher risk of being caught if he counterfeits registered products. If the chance of
being caught is the same for counterfeiting registered and unregistered products, the counterfeiter
will prefer to counterfeit registered products.
Above all, we argue that the counterfeiter most likely counterfeits registered products and
produces the worst quality drug, as long as the drug quality is not observable to consumers, the
penalty for counterfeiting is independent of drug quality, and the chance of being caught
counterfeiting is about the same regardless of who the counterfeiter pretends to be. These
arguments are supported by the eight cases of ciprofloxacin that were confirmed to be counterfeit
from China by extra information from cooperate/government officers. All these eight
counterfeits turned out to contain zero correct API and seven of them pretended to be a registered
product. Conversely, the same logic implies that the substandard drugs in our data are unlikely
driven by counterfeiters. If they are not driven by counterfeiters, they should be more likely
driven by unregistered Indian firms than by registered Indian firms, because we know from the
above paragraph that registered firms have already paid the cost of product registration and
therefore should have more incentives to produce good quality drugs than non-registered firms.
Following this logic, we expand our data analysis by product registration status and
detailed quality categories. In the first two columns of Table 8, we first repeat the basic quality
regression (as in Column 2 Table 3, dependent variable = passing the basic quality test) and then
add in the dummy of product registration as well as its interaction with the Africa and Non-
Africa dummies. Manufacturer-drug fixed effects are always included. As we expect, registered

19
products are more likely to pass the TLC test. The coefficient of Africa*product registration is of
similar absolute magnitude but opposite sign to the coefficient of the Africa dummy. This
suggests that drug samples purchased in Africa are similar in basic quality from India domestic,
if the samples are registered in the purchase country. Similar results apply to Non-Africa
countries. In contrast, unregistered products still show significant quality difference between
Africa (worst), India domestic, and Non-Africa countries (best).
In the next four columns of Table 8, we repeat these regressions but redefine the
dependent variable as whether the drug sample is falsified, or whether the drug sample is
substandard. The last two columns of Table 8 switch the dependent variable back to whether a
drug sample passes the basic quality test, but restrict the sample to non-falsified samples only.
Consistent with Table 2, these columns suggest that the biggest quality difference across
purchase country groups concentrate in non-registered substandard products. According to the
logic above, we believe the most likely explanation is that the labeled Indian manufacturers have
produced the substandard products and they are not registered in the African destination. These
results are robust to adding temperature variables or excluding the eight known counterfeit cases
of ciprofloxacin.
V. Discussion
Overall, our sample of “Indian-made” medicines reveals two data patterns: first, drug
quality is inferior among drugs purchased inside African countries compared to those purchased
inside India or middle-income countries elsewhere. Second, unregistered substandard drugs
containing insufficient API are the biggest driver of this quality difference in Africa. These
findings are based on a low-tech API assessment of a limited number of drug samples, and had
we used more advanced analytical methods, more failing drugs would have been detected.
Therefore these are conservative conclusions.
Our sample frame is limited to a few anti-infective drugs, in a few countries, purchased
from only storefront vendors, all of which restrict our ability to link the presence of substandard
and falsified drugs to more detailed country-specific attributes. Furthermore, because our data
were collected at the end of the distribution channel, it is difficult to separate the role of Indian
manufacturers from those in the supply chain to retail pharmacies.
20
That being said, these findings provide suggestive, arguably worrisome evidence that
some Indian drug companies and/or their export intermediaries segment the global medicine
market into portions that are served by different quality medicines. While the notion of “export
grade” marketing is familiar in other sectors such as agriculture, it appears to exist for medicines
also, with Indian manufacturers and/or their export intermediaries likely exporting lower quality
goods to Africa. One possible mechanism that may contribute to this result is quality
differentiation by market demand. If consumers in poorer nations are more willing to accept less
than perfect quality medicines in exchange for lower prices, Indian suppliers may simply be
filling a market gap. Another possible driver is that African regulatory oversight is weaker
(resulting in fewer registered products) as compared to middle-income countries elsewhere and
Indians are more reluctant to sell the worst medicines in India itself, lest they be prosecuted.
There are alternative explanations, though none appear to be as likely. It is known that
some organized criminals from China have counterfeited Indian products destined for Africa,
although after this practice came to light and was denounced several years ago there appear not
to be subsequent news reports of this crime recurring. Poor storage of initially good Indian
products can also lead to degradation, although the environmental conditions favoring
degradation (heat, light, humidity) are not worse, and apparently better, in Africa than India,
where a lower rate of product failure was observed. Neither of these circumstances is the fault of
Indian companies, but neither seems sufficient or likely to explain the data observations either.
Africans are aware of their vulnerability to substandard and falsified medicines. At the time of
this writing, West Africa and East Africa are trying to harmonize and improve their drug
regulation practices.22 Individual countries such as Nigeria and Ghana have banned sales from
some Indian companies, and have pressured the Indian drug regulator. On one occasion, India’s
minister of state for commerce and industry even visited Nigeria and divulged the names of
Indian companies producing fake medicines to boycott (Raufu 2003; Akunyili 2005). Since
India’s government feels that approach is necessary, regional, rather than simply national,
regulatory action in Africa and blacklisting of transgressing Indian manufacturers might drive
better performance from all Indian exporters.
There is also scope for collective security approaches. For example, in the civil aviation
industry, regulators aim enforcement actions not against any single foreign airline that breaches
22 Personal Communication with Andreas Seiter of the World Bank, March 12th 2014.
21
safety standards, but collectively target all the airlines of any foreign country that fails to uphold
certain minimum standards. Under this collective regulatory response, in 2014 all Indian airlines
were downgraded and lost the right to expand their flight operations in the United States—a
development that gave India’s aviation regulator powerful and urgent incentive to raise safety
standards (the US restored their access in 2015).23 Applying this approach to medicines, if drug
regulators from Africa, America and Europe jointly decided to impose tougher quality inspection
practices on Indian-sourced products as a whole, it very likely would eliminate all incentive for
Indian manufacturers or their export intermediaries to export failing medicines.
A softer response to these findings would be simply to increase informational flows to
African doctors and pharmacists about the possible inferior quality of some Indian drugs; even
just naming Indian companies repeatedly found to sell substandard medicines. While many
African doctors anecdotally are already wary of Indian medicines, such an effort might further
drive the African middle classes away from many Indian products.
Lastly, although this paper has focused on Indian produced medicines, India is by no
means the only large exporter of drugs. It is not our intent to single out any one manufacturing
country as being solely or largely responsible for the quality problem. Our data so far has only
allowed us to work on products that are labeled “made in India” and prohibited us from statistical
comparison across manufacturing countries. Further research into the drug quality of Chinese
and other manufacturing countries would be useful to understand how widespread the problem
may be.
23 http://www.thehindu.com/business/us-downgrade-to-hit-all-indian-airlines-capa/article5653620.ece

22
References
Akunyili, Dora (2005) “Counterfeit and Substandard Drugs, Nigeria’s Experience: Implications,
Challenges, Actions and Recommendations,” speech at the World Bank, accessed at
www.siteresources.worldbank.org on August 1, 2014.
Arora, Ashish, Lee Branstetter and Chirantan Chatterjee (2008) “Strong Medicine: Patent Reform and the
Emergence of a Research-Driven Pharmaceutical Industry in India” working paper, accessed at
www.reseaerchgate.net on August 26, 2014.
Attaran, Amir, Donna Barry, Shamnad Basheer, Roger Bate, David Benton, James Chauvin, Laurie
Garrett, Ilona Kickbusch, Jillian Clare Kohler, Kamal Midha, Paul N Newton, Sania Nishtar, Paul
Orhii, and Martin McKee (November 2012) “How to achieve international action on falsified and
substandard medicines.” British Medical Journal 2012: 345. Baldwin, Richard and James Harrigan
(2011) "Zeros, Quality, and Space: Trade Theory and Trade Evidence," American Journal:
Microeconomics, 3(2), pages 60-88.
Bate, Roger (2012) Phake: The Deadly World of Falsified and Substandard Medicines. American
Enterprise Institute Press. Bate, Roger (2013) “Bad Medicine,” Foreign Policy, October 4th 2013.
Bate, Roger, Ginger Zhe Jin, and Aparna Mathur (2011) “Does Price Reveal Poor-Quality Drugs?
Evidence from 17 Countries,” Journal of Health Economics 30 (6): 1150–1163.
Bate, Roger, Lorraine Mooney, Emily Putze, Alexandra McPherson, and Sarah Naoshy (2010) “Drug
Registration: A Necessary but Not Sufficient Condition for Good Quality Drugs: A Preliminary
Analysis of Twelve Countries,” Africa Fighting Malaria Working Paper.
Bate, Roger, Kimberly Hess and Lorraine Mooney (2010) “Medicine Registration and Medicine Quality:
A Preliminary Analysis of Key Cities in Emerging Markets,” Research and Reports in Tropical
Medicine, December 2010, vol 1. Pp 89-93, doi 10.2147/RRTM. S15199.
Bate, Roger, Paul Jensen, Kimberly Hess, Lorraine Mooney, and Julissa Milligan (2013) “Substandard
and falsified anti-tuberculosis drugs: a preliminary field analysis.” The International Journal of
Tuberculosis and Lung Disease, Volume 17, Number 3, 1 March 2013 , pp. 308-311(4).
Bate, Roger, Ginger Zhe Jin and Aparna Mathur (2014) “Falsified or Substandard? Assessing Price and
Non-Price Signals of Drug Quality” forthcoming Journal of Economics & Management Strategy.
Also available as NBER Working Paper #18073.
Bennett, Daniel and Wesley Yin (2014) “The Market for High Quality Medicine: Retail Chain Entry and
Drug Quality in India,” working paper accessed at http://luskin.ucla.edu/wes-yin
Binagwaho, Agnes, Roger Bate, Micahel Gasana, Corine Karema, Yves Mucyo, John Patrick Mwesigye,
Floribert Biziyaremye, Cameron Nutt, Clare Wagner, Paul Jensen, and Amir Attaran (2013)
“Substandard and Falsified Medicines: A View from Rwanda” PLOS Medicine July 02, 2013, doi:
10.1371/journal.pmed.1001476.
Cameron, Alexandra, Margaret Ewen, Dennis Ross-Degnan, D. Ball, and Richard Laing (2008)
“Medicine prices, availability, and affordability in 36 developing and middle-income countries: a
secondary analysis” The Lancet December 1, 2008.
Central Drug Standard Control Organization, Directorate General of Health Services, Ministry of Health
and Family Welfare, Government of India (CDSCO 2009) “Report on Countrywide Survey For
Spurious Drugs”, accessed at http://www.cdsco.nic.in/writereaddata/REPORT_BOOK_13-7-10.pdf
on December 16, 2014.
Chaudhuri, Shubham, PinelopiGoldberg and Panle Jia (2006) “Estimating the Effects of Global Patent
Protection in Pharmaceuticals: A Case Study of Quinolones in India,” American Economic Review,
96(5): 1477-1513.
Cockburn, Iain, Jean Lanjouw and Mark Schankerman (2014) “Global Diffusion of New Drugs: Patent
Policy, Price Controls and Institutions,” abstract accessed at http:/www.tiger-
forum.com/Media/speakers/abstract/ on June 16, 2014.
Crozet, Matthieu; Keith Head and Thierry Mayer (2012) “Quality Sorting and Trade: Firm-level Evidence

23
for French Wine” Review of Economic Studies (2012) 79, 609–644.
Duggan, Mark and Aparajita Goyal (2012) “Pharmaceutical Patents and Prices: A Preliminary Empirical
Assessment Using Data from India” World Bank Policy Research Working Paper #6063.
Hallak, J.-C. (2006), “Product Quality and the Direction of Trade”, Journal of International Economics,
68, 238–265.
Health Action International (HAI 2010): “Being sick and needing medicines is a costly misfortune in
many countries – A one day snapshot of a medicine’s price across 93 countries” published by HAI on
5/1/2010, at http://www.haiweb.org/medicineprices/05012010/Global_briefing_note.pdf.
Hummels, D. and Klenow, P. J. (2005), “The Variety and Quality of a Nation’s Exports”, American
Economic Review, 95, 704–723.
Hummels, D. and Skiba, A. (2004), “Shipping the Good Apples Out? An Empirical Confirmation of the
Alchian-Allen Conjecture”, Journal of Political Economy, 112, 1384–1402.
International Monetary Fund (IMF) (2009-2012) “World Economic Outlook Database.”
Institute of Medicine (IOM) (2013), Countering the Problem of Falsified and Substandard Drugs,
National Academy of Sciences, ISBN 978-0-309-26939-1.
Jähnke, R. W. O., G. Küsters, and K. Fleischer (2001) “Low-cost quality assurance of medicines using the
GPHF-Minilab®,” Drug Information Journal 35:941-945.
Kaale, Eliangiringa, Peter Risha, and Thomas Layloff (2011) “TLC for pharmaceutical analysis in
resource limited countries.” Journal of Chromatography A 1218(19):2732-2736.
Kaur, H., C. Goodman, E. Thompson, K.-A. Thompson, I. Masanja, S. P. Kachur, and S. Abdulla. 2008.
A nationwide survey of the quality of antimalarials in retail outlets in Tanzania. PLoS ONE
3(10):e3403. Kelesidis, Theodore, Iosif Kelesidis, Petros I. Rafailidis and Matthew E. Falagas (2007) “Counterfeit or
Substandard Antimicrobial Drugs: A Review of the Scientific Evidence” Journal of Antimicrobial
Chemotherapy 60: 214-236.
Khandelwal, A. (2010), “The Long and Short (of) Quality Ladders”, Review of Economic Studies, 77,
1450–1476.
KPMG (2006) “The Indian Pharmaceutical Industry: Collaboration for Growth” accessed at
https://www.in.kpmg.com/pdf/Indian%20Pharma%20Outlook.pdf on June 16, 2014.
Kyle, Margaret and Anita McGahan (2012) “Investments in Pharmaceuticals Before and After TRIPS.”
Review of Economics and Statistics, 94 (4): 1157-1172.
Kyle, Margaret and Yi Qian (2013) “Intellectual Property Rights and Access to Innovation: Evidence
from TRIPS” working paper.
McKinsey (2013) “Generating value in generics: Finding the next five years of growth” accessed at
http://www.mckinsey.com/~/media/McKinsey/dotcom/client_service/Pharma%20and%20Medical%2
0Products/PMP%20NEW/PDFs/Generating_value_in_generics_June%202013.ashx on August 29,
2014
Ministry of Chemicals & Fertilizers, Department of Pharmaceuticals (MCFDP), Government of India,
Annual Report, 2011-2012, accessed at http://pharmaceuticals.gov.in/annualreport2012.pdf on June
16, 2014.
Property Rights Alliance (PRA) (2007-2013) International Property Rights Index.
PWC (2009) “Which are the largest city economies in the world and how might this change by 2025?”
PricewaterhouseCoopers UK economic Outlook November 2009.
Raufu, Abiodun (2003) “India agrees to help Nigeria tackle the import of fake drugs,” British Medical
Journal 326:1234.
Seiter, Andreas (2010) “A Practical Approach to Pharmaceutical Policy”, World Bank Press.
Sharma, Prabodh, Sanjeev Kumar, Rakesh Pahwa and Archana Sharma (2008) “Opportunities for Generic
Drugs in India” Internet Scientific Publications, 8 (1) 2008.
Schott, P. K. (2004), “Across-Product Versus Within-Product Specialization in International Trade”,
Quarterly Journal of Economics, 119, 647–678.
Stanton, C., A. Koski, P. Cofie, E. Mirzabagi, B. L. Grady, and S. Brooke. 2012. Uterotonic drug quality:
24
An assessment of the potency of injectable uterotonic drugs purchased by simulated clients in three
districts in Ghana. BMJ Open 2(3):1-7.
Stanton, C; Nand D; Koski A; Mirzabagi E; Brooke S; Grady B; and Mullany LC (2014) “Accessibility
and potency of uterotonic drugs purchased by simulated clients in four districts in India”
BMC Pregnancy Childbirth. 2014 Nov 13;14(1):386. Torstensson, David and Meir Pugatch (2010) “Keeping Medicines Safe – A Study of the Regulations
Guiding the Approval of Medicines in Emerging Markets” Stockholm Network, accessed at
http://www.stockholm-network.org/Publications/5 on June 1, 2014.
United Nations (2010) “World Urbanization Prospects, the 2009 Revision” March 2010.
United Nations (2005-2010) “World Population Perspectives”.
United Nations Development Programme (UNDP) (2009) “Human Development Report 2009.
Overcoming Barriers: Human mobility and development” 2009.
United States Pharmacopeial Convention (USP) (2013) “Post-Market Quality Surveillance Project:
Maternal Healthcare Products (Oxytocin and Ergometrine) on the Ghanaian Market” accessed at
http://www.usp.org/sites/default/files/usp_pdf/EN/PQM/ghana-mch_mqm_report_final-
mar_27_2013_rdct.pdf on August 29, 2014
World Justice Project (2010, 2012, 2014) Rule of Law Index.

25
Table 1 Summary of drug quality and price by drug type and purchase country
India
Domestic Africa Non-Africa Total
ciprofloxacin
N 456 151 84 691*
pass 91.9% 88.1% 95.2% 91.5%
falsified 4.8% 3.3% 4.8% 4.5%
substandard 3.3% 8.6% 0.0% 4.1%
price 1.552 5.745 11.229 3.645
Erythromycin
N 167 119 0 286
pass 87.4% 80.7% . 84.6%
falsified 1.8% 7.6% . 4.2%
substandard 10.8% 11.8% . 11.2%
price 0.749 3.780 . 2.010
Isoniazid
N 166 57 0 223
pass 93.4% 84.2% . 91.0%
falsified 1.8% 8.8% . 3.6%
substandard 4.8% 7.0% . 5.4%
price 1.542 4.122 . 2.202
Rifampicin
N 167 103 0 270
pass 89.8% 80.6% . 86.3%
falsified 2.4% 1.9% . 2.2%
substandard 7.8% 17.5% . 11.5%
price 1.466 4.227 . 2.519
Total
N 956 430 84 1470
pass 91.0% 83.7% 95.2% 89.1%
falsified 3.3% 4.9% 4.8% 3.9%
substandard 5.6% 11.4% 0.0% 7.0%
price 1.395 4.622 11.229 2.901
Note: A drug is labeled “pass” if the active pharmaceutical ingredients (API) of the
test sample is at least 80% of the required API, labeled “falsified” if no API can be
detected in the test sample, labeled “substandard” if the detected API is strictly
above 0% but below 80%. Price is converted to 2010 US$. * As noted in the paper, 8
ciprofloxacin samples were confirmed to be counterfeits from China by extra
information from cooperate/government officers. We keep them in the sample
because they are labeled “Made in India” on the package.
26
Table 2 Summary of drug quality and price by registration status and purchase country
India
Domestic Africa Non-Africa Total
Non-registered
N 115 83 12 210
pass 67.8% 49.4% 100.0% 62.4%
falsified 9.6% 6.0% 0.0% 7.6%
substandard 22.6% 44.6% 0.0% 30.0%
WHO prequalified 0 0 0 0
Purchased in a chain store 0 18.07% 0 7.14%
Purchased in a good-looking store 49.57% 34.94% 100% 46.67%
price 1.148 3.788 8.397 2.605
Registered
N 841 347 72 1260
pass 94.2% 91.9% 94.4% 93.6%
falsified 2.5% 4.6% 5.6% 3.3%
substandard 3.3% 3.5% 0.0% 3.2%
WHO prequalified 5.94% 5.76% 13.89% 6.35%
Purchased in a chain store 47.09% 49.86% 59.72% 48.57%
Purchased in a good-looking store 84.30% 70.03% 97.22% 81.11%
price 1.429 4.822 11.702 2.950
Total
N 956 430 84 1470
pass 91.0% 83.7% 95.2% 89.1%
falsified 3.3% 4.9% 4.8% 3.9%
substandard 5.6% 11.4% 0.0% 7.0%
WHO prequalified 5.23% 4.65% 11.90% 5.44%
Purchased in a chain store 41.42% 43.72% 51.19% 42.65%
Purchased in a good-looking store 80.13% 63.26% 97.62% 76.19%
price 1.395 4.622 11.229 2.901
Note: A drug is labeled “pass” if the active pharmaceutical ingredients (API) of the test sample
is at least 80% of the required API, labeled “falsified” if no API can be detected in the test
sample, labeled “substandard” if the detected API is strictly above 0% but below 80%. Price is
converted to 2010 US$.

27
Table 3 Basic quality regressions
Sample Full Registered only Non-registered only
Dependent Variable Pass Pass Pass Pass Pass Pass
(1) (2) (3) (4) (5) (6)
Africa -0.0650*** -0.0847*** -0.0189 -0.0258 -0.147*** -0.185***
(0.0106) (0.0174) (0.0114) (0.0142) (0.0341) (0.0552)
Non-africa 0.0268*** 0.0123 0.00104 -0.0118 0.193*** 0.272***
(0.007) (0.0090) (0.0075) (0.0066) (0.0123) (0.0531)
Erythromycin -0.0524*** absorbed -0.0327** absorbed -0.253*** absorbed
(0.0084)
(0.0123)
(0.058)
Isoniazid 0.00137 absorbed 0.0166 absorbed -0.267** absorbed
(0.0107)
(0.0111)
(0.0948)
Rifampicin -0.0378** absorbed 0.00681 absorbed -0.331*** absorbed
(0.0126)
(0.0092)
(0.00655)
Constant 0.926*** 0.915*** 0.943*** 0.943*** 0.807*** 0.682***
(0.007) (0.0059) (0.0075) (0.0049) (0.0123) (0.022)
Manufacturer-drug FE No Yes No Yes No Yes
Observations 1,470 1,470 1,260 1,260 210 210
R-squared 0.018 0.119 0.006 0.090 0.154 0.315
Note: Robust standard errors in parentheses. *** p<0.01, ** p<0.05, * p<0.1. Default group is India domestic,
ciprofloxacin. All regressions use linear probability model. Errors are clustered by drug-countrygroup where
countrygroup is defined Africa, Nonafrica and India domestic.

28
Table 4 Robustness checks for basic quality regressions
Sample
Excluding 8 known counterfeits Ciprofloxaxin only Full Sample With Temperature Data
All
Registered
only
Non-
registered
only All
Registered
only
Non-
registered
only All
Registered
only
Non-
registere
d only
Dependent Variable quality quality quality quality quality quality quality quality quality
(1) (2) (3) (4) (5) (6) (7) (8) (9)
Africa -0.0807*** -0.0236 -0.180** -0.0435** 0.0110** -0.101* -0.0653** -0.0354* -0.244*
(0.0196) (0.0155) (0.0559) (0.00590) (0.00217) (0.0309) (0.0213) (0.0155) (0.113)
Non-Africa 0.00786 -0.0155* 0.264*** 0.0243** -0.00214 0.319*** 0.0306** -0.0183 0.212
(0.0115) (0.00809) (0.0559) (0.00512) (0.00437) (0.0263) (0.0126) (0.0146) (0.118)
# of calendar months in a year
with average daily high
temperature at or above 30°C
0.00416** -0.00122 -0.00916
(0.00138) (0.00275) (0.0125)
# of calendar months in a year
with average daily high
temperature between 25°C and
30°C
0.00239 0.000790 -0.00450
(0.00165) (0.00294) (0.0133)
Manufacturer-drug fixed
effects Yes Yes Yes Yes Yes Yes Yes Yes Yes
Observations 1,462 1,253 209 691 581 110 1,470 1,260 210
R-squared 0.112 0.068 0.314 0.082 0.104 0.288 0.120 0.090 0.317
Note: Robust standard errors in parentheses. *** p<0.01, ** p<0.05, * p<0.1. Default group is India domestic, ciprofloxacin. All regressions use linear
probability model. Errors are clustered by drug-countrygroup where countrygroup is defined Africa, Nonafrica and India domestic.
29
Table 5 Country characteristics
country
city GDP
per capita
adult
literacy
rate (%)
have any
price
regulation
max legal
penalty for
counterfeiting
(month in
jail)
Rule of
Law index
Intellectual
Property Right
Index (IPRI)
Angola 7082 71 1 60 N.A. 3.46
Brazil 20514 96.7 1 180 0.58 5.33
China 17196 95 1 360 0.48 5.50
DRC 197 65 0 N.A. 0.48 4.94
Egypt 14166 71.5 1 36 0.50 5.02
Ethiopia 4782 36.8 0 240 0.42 4.13
Ghana 1663 67.6 0 60 0.54 5.26
India 9110 64.7 1 360 0.50 5.47
Kenya 3516 82.4 0 60 0.37 4.36
Mozambique 1128 50.6 0 N.A. N.A. 4.60
Nigeria 3386 58.1 0 360 0.42 3.80
Russia 31614 99.6 1 120 0.43 4.48
Rwanda 1305 66.9 1 N.A. N.A. 5.92
Tanzania 2717 71.5 0 N.A. 0.49 4.71
Thailand 17789 98.4 0 240 0.54 5.22
Turkey 16945 94.1 1 N.A. 0.51 5.30
Uganda 1258 73.5 0 240 0.42 4.16
Zambia 1679 67.6 0 N.A. 0.46 4.57
Total 8261 67 0.76 304.3 0.49 5.19
Note: N.A. stands for “data not available.” In all countries except India, we cover only one city, GDP per
capita is for that city in the sample year. In India, we cover five cities, GDP per capita of India is the average
across the five cities.

30
Table 6 Correlation of country characteristics
city GDP
per capita
adult literacy
rate (%)
have any
price
regulation
max legal
penalty for
counterfeiting
(month in jail)
rule of law
index IPRI index
city GDP per capita 1
adult literacy rate
(%) 0.4341*** 1
have any price
regulation 0.6018*** -0.0482* 1
max legal penalty for
counterfeiting
(month in jail) 0.1160*** -0.3216*** 0.5157*** 1
rule of law index 0.2037*** 0.1478*** 0.3679*** 0.1131*** 1
IPRI index 0.3743*** 0.0416 0.6488*** 0.3944*** 0.6562*** 1
*** p<0.01, ** p<0.05, * p<0.1. Correlations are conditional on non-missing values.

31
Table 7 Why do African countries receive worse-quality drugs?
pass pass pass pass
(1) (2) (3) (4)
Africa -0.0847*** -0.0373** -0.0107 -0.00681
(0.0174) (0.0154) (0.0735) (0.0854)
Non-africa 0.0123 0.0243* -0.0751 -0.106
(0.00902) (0.0106) (0.0550) (0.0644)
Product registered
0.275***
0.287***
(0.0565)
(0.0573)
WHO prequalification
-0.00527
-0.00933
(0.0171)
(0.0192)
Purchased from chain store 0.0682***
0.0707***
(0.0130)
(0.0169)
Purchased from a store that the shopper 0.0909***
0.0873***
assessed good-looking
(0.0212)
(0.0233)
Max Legal Penalty
0.000272 0.000122
(0.000158) (0.000188)
Rule of Law Overall Index
0.180 0.140
(0.271) (0.198)
IPRI Overall Index
0.0291 0.00360
(0.0353) (0.0381)
City GDP per capita (in 1000)
0.0109*** 0.00984*
(0.00246) (0.00499)
Adult Literacy Rate
-0.000310 0.000794
(0.00116) (0.00109)
Have any price regulation
-0.0564** -0.0369
(0.0192) (0.0455)
Manufacturer-drug FE yes yes yes yes
Observations 1,470 1,470 1,470 1,470
R-squared 0.119 0.251 0.124 0.257
Notes: Robust standard errors in parentheses. *** p<0.01, ** p<0.05, * p<0.1. Default group is India domestic. All regressions
use linear probability model. All regressions control for missing-value dummies for Rule of Law index and maximum legal
penalty, as well as imputed-value and/or missing-value dummies for the Rule of Law index, IPRI index, maximum legal penalty,
and price regulation. Errors are clustered by drug-countrygroup where countrygroup is defined Africa, Non-africa and India
domestic.

32
Table 8 Regressions on purchase region and product registration status, by quality categories
Sample Full Full Full Non-falsified
Dependent Variable pass pass falsified falsified substandard substandard pass pass
(1) (2) (3) (4) (5) (6) (7) (8)
Africa -0.0847*** -0.161* 0.0250 -0.0355 0.0597*** 0.196* -0.0636*** -0.191*
(0.0174) (0.0778) (0.0152) (0.0341) (0.0174) (0.102) (0.0173) (0.0954)
Non-Africa 0.0123* 0.330*** 0.0169** -0.104*** -0.0292*** -0.226*** 0.0318*** 0.257***
(0.009) (0.0425) (0.0073) (0.030) (0.0053) (0.0565) (0.0055) (0.0552)
Product registered 0.290***
-0.0692*** -0.221**
0.249***
In purchase country (0.0597)
(0.023) (0.0716)
(0.0694)
Africa * product-registered 0.129
0.0669 -0.196
0.188
in purchase country (0.0788)
(0.0415) (0.133)
(0.105)
Non-Africa * product-registered -0.351***
0.136*** 0.214**
-0.241***
in purchase country (0.0512) (0.0257) (0.0649) (0.0624)
Manufacturer-drug FE Yes Yes Yes Yes Yes Yes Yes Yes
Observations 1,470 1,470 1,470 1,470 1,470 1,470 1,413 1,413
R-squared 0.119 0.237 0.155 0.163 0.098 0.245 0.101 0.259
Notes: Robust standard errors in parentheses. *** p<0.01, ** p<0.05, * p<0.1. Default group is India domestic. All regressions use linear probability model. Errors are
clustered by drug-countrygroup where countrygroup is defined Africa, Nonafrica and India domestic.