consequences of poor data quality on model accuracy - download€¦ · consequences of poor data...
TRANSCRIPT

Copyright © 2012, SAS Institute Inc. All rights reserved. #analytics2012
The Consequences of Poor Data Quality on Model Accuracy
Dr. Gerhard Svolba – SAS AustriaCologne, June 14th, 2012

#analytics2012Copyright © 2012, SAS Institute Inc. All rights reserved.
From this talk you can expect
The analytical viewpoint on data quality
Answers to the questions How much data do I need? How do missing values affect predictive power?
Business case considerations for data quality

#analytics2012Copyright © 2012, SAS Institute Inc. All rights reserved.
These are your options, if you learn that data quality is poor
#analytics2012Copyright © 2012, SAS Institute Inc. All rights reserved.
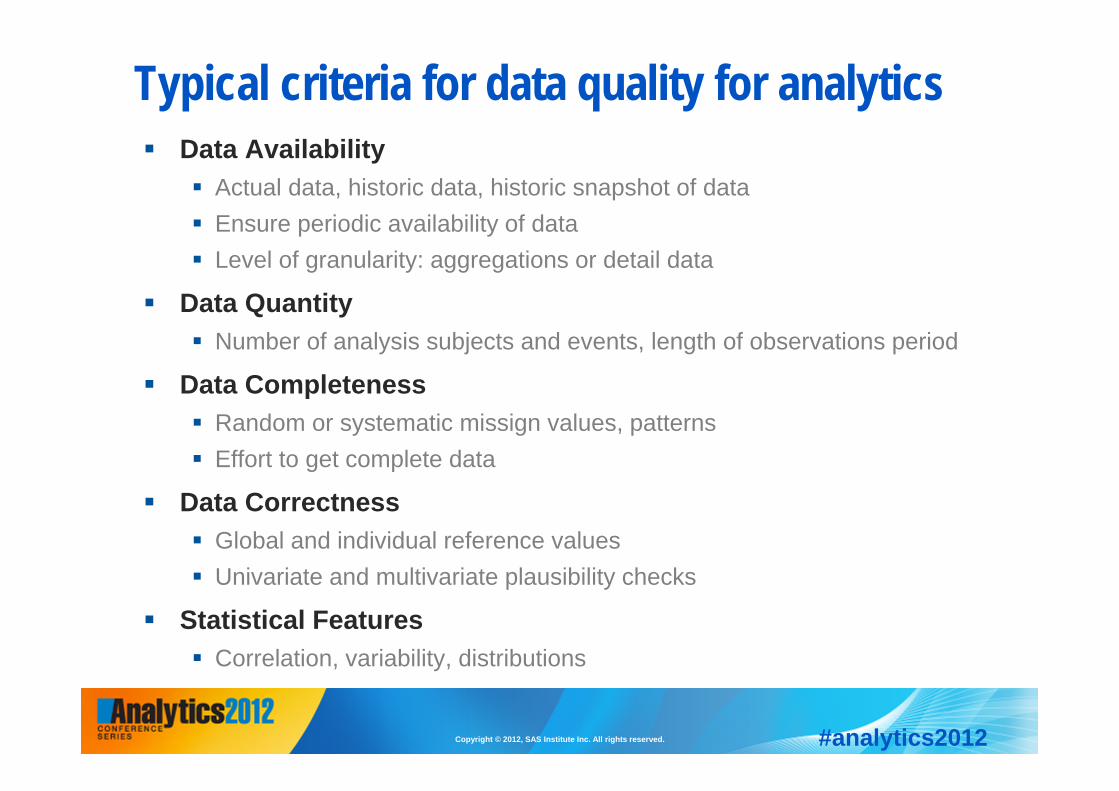
Typical criteria for data quality for analytics Data Availability
Actual data, historic data, historic snapshot of data Ensure periodic availability of data Level of granularity: aggregations or detail data
Data Quantity Number of analysis subjects and events, length of observations period
Data Completeness Random or systematic missign values, patterns Effort to get complete data
Data Correctness Global and individual reference values Univariate and multivariate plausibility checks
Statistical Features Correlation, variability, distributions
#analytics2012Copyright © 2012, SAS Institute Inc. All rights reserved.
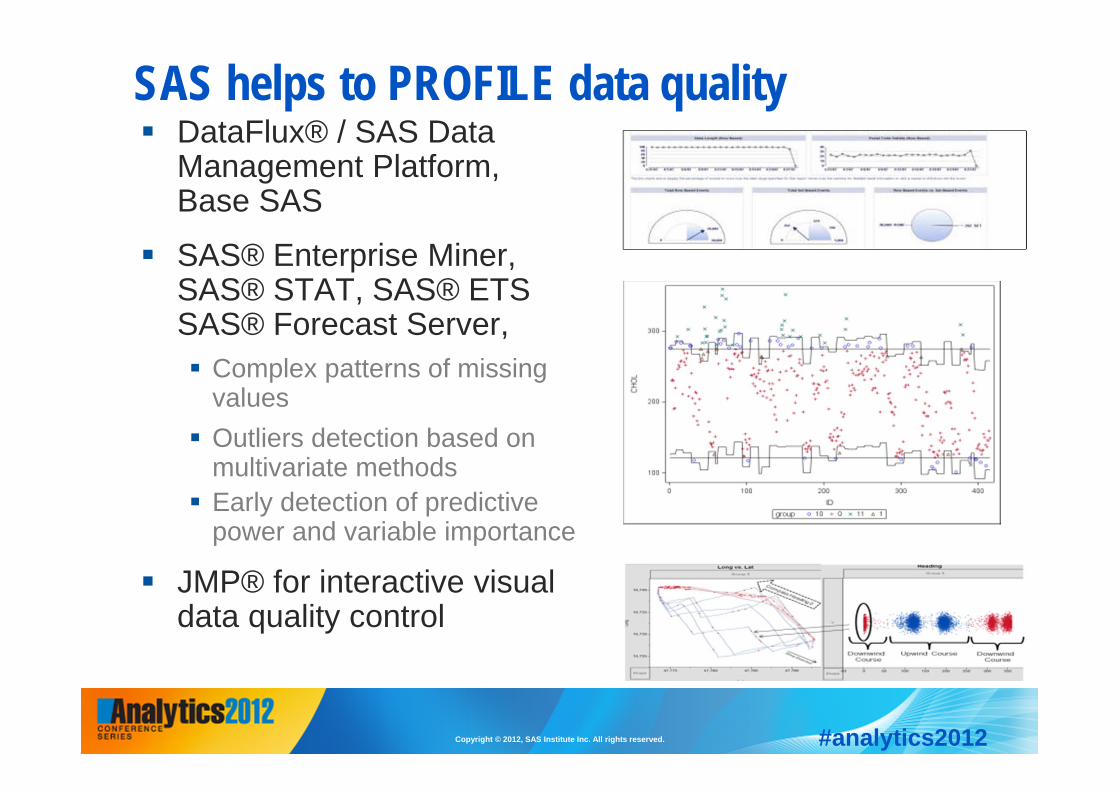
SAS helps to PROFILE data quality DataFlux® / SAS Data
Management Platform,Base SAS
SAS® Enterprise Miner, SAS® STAT, SAS® ETSSAS® Forecast Server, Complex patterns of missing
values Outliers detection based on
multivariate methods Early detection of predictive
power and variable importance
JMP® for interactive visualdata quality control

#analytics2012Copyright © 2012, SAS Institute Inc. All rights reserved.
SAS helps to IMPROVE data quality
Imputation of missing values Calculation of individual replacement values Treat „exceptional“ subgroups and time periods
differently in the model
Similarity measures for standardisation and record matching
Methods for rare events Sample size planning

#analytics2012Copyright © 2012, SAS Institute Inc. All rights reserved.
Consequences of poor data quality
CostTime
DelaysNo Results
TrustRisk of wrong decisionsInsignificance

#analytics2012Copyright © 2012, SAS Institute Inc. All rights reserved.
The consequences of the following effectshave been studied How much data do I need?
Varying the available number of observations and events (SIM_1) Gradually increasing the available length of data history (SIM_3)
How do missing values affect predictive power? Random and systematic missing values (SIM_2)
Other questions / simulations Withholding the set of the most important variables Introducing random and systematic bias in the input and target
variables in predictive modeling Effect of random and systematic missing values and bias in time
series forecasting

#analytics2012Copyright © 2012, SAS Institute Inc. All rights reserved.
Real life data is used for the simulation studies Four real life datasets from different industries with a binary target
variable were used
How to end up with “perfect” data: Variable with > 5 % of missing values drop variable Variable with <= 5 % of missing values filter observations Large number of categories drop variable or group sparse categories to
“OTHERS”
Run multiple model cycles for each data source to retrieve a stablemodel with good predictive power
Freeze the list of variables for the simulations
#analytics2012Copyright © 2012, SAS Institute Inc. All rights reserved.
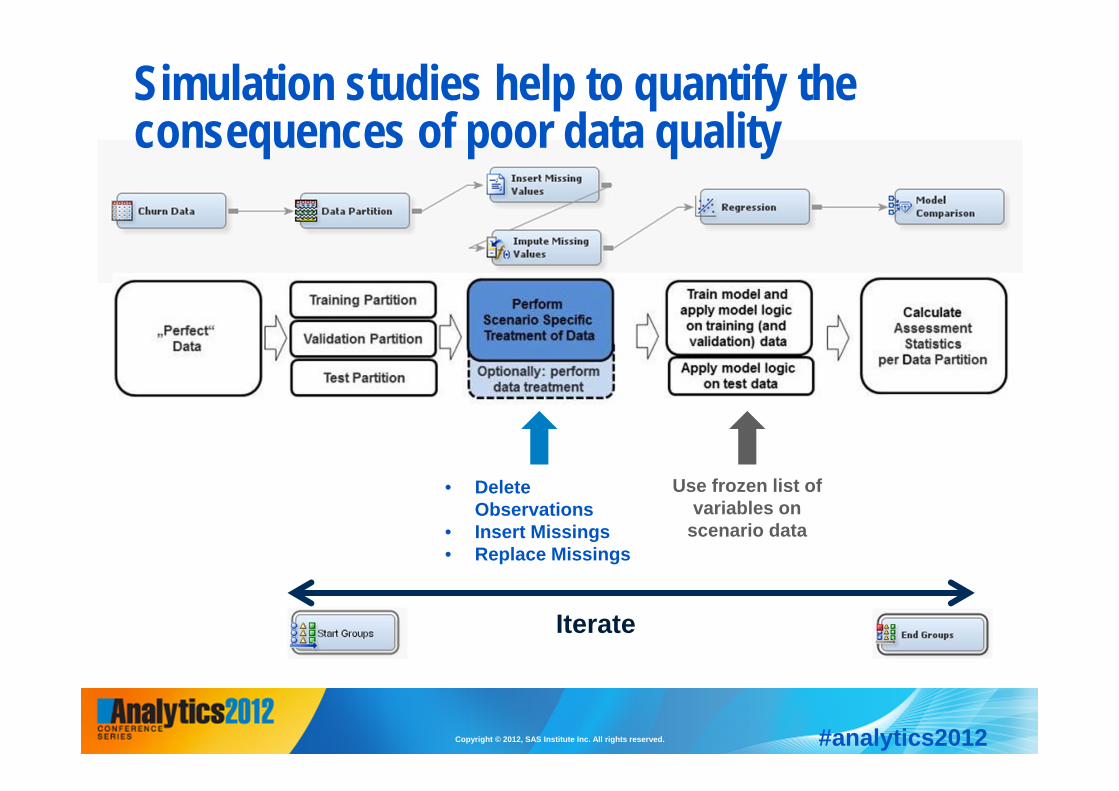
Simulation studies help to quantify the consequences of poor data quality
• Delete Observations
• Insert Missings• Replace Missings
Use frozen list of variables on
scenario data
Iterate

#analytics2012Copyright © 2012, SAS Institute Inc. All rights reserved.
Studying the effect of data quantity in event prediction (SIM_1) Event prediction has many applications: credit scoring,
churn, claim, response failure, fraud, …
Additional observations and events provide increase in % Correct Response rate
But: Linear or non-linear effect How can this effect be quantified? Do also non-events contribute to an increase? Is it worth waiting for more events?

#analytics2012Copyright © 2012, SAS Institute Inc. All rights reserved.
Findings of the data quantity scenarios
Marginal benefits flattens out in the area of 500 to 1000 events
Also non-events provide additional information especially in the area of up to 500 events
Varying the number of events and non-events
#analytics2012Copyright © 2012, SAS Institute Inc. All rights reserved.
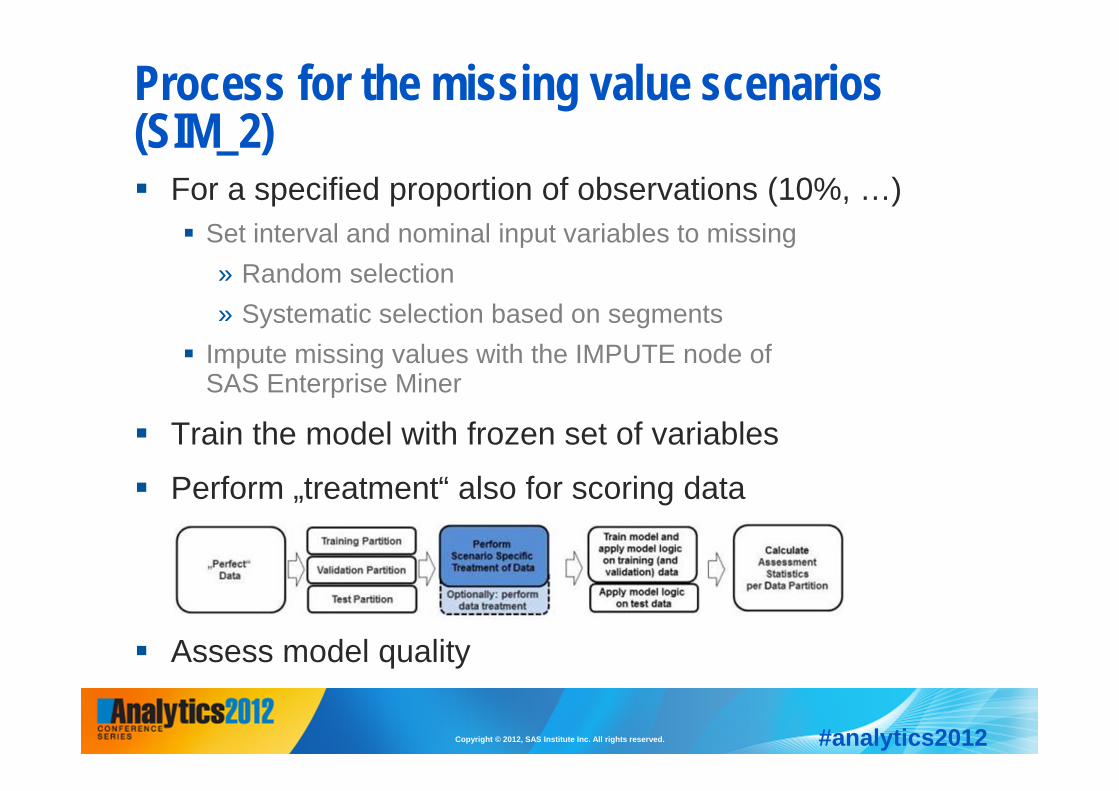
Process for the missing value scenarios (SIM_2) For a specified proportion of observations (10%, …)
Set interval and nominal input variables to missing» Random selection» Systematic selection based on segments
Impute missing values with the IMPUTE node of SAS Enterprise Miner
Train the model with frozen set of variables
Perform „treatment“ also for scoring data
Assess model quality

#analytics2012Copyright © 2012, SAS Institute Inc. All rights reserved.
Findings of the missing value scenarios
Random missing values in training data only have limited effect.
Missing values in the scoring data as well affect much more.
Systematic missing values have a much larger effect.
Things that matter: Not only the proportion of missing
values but especially the type Missings in scoring data
#analytics2012Copyright © 2012, SAS Institute Inc. All rights reserved.
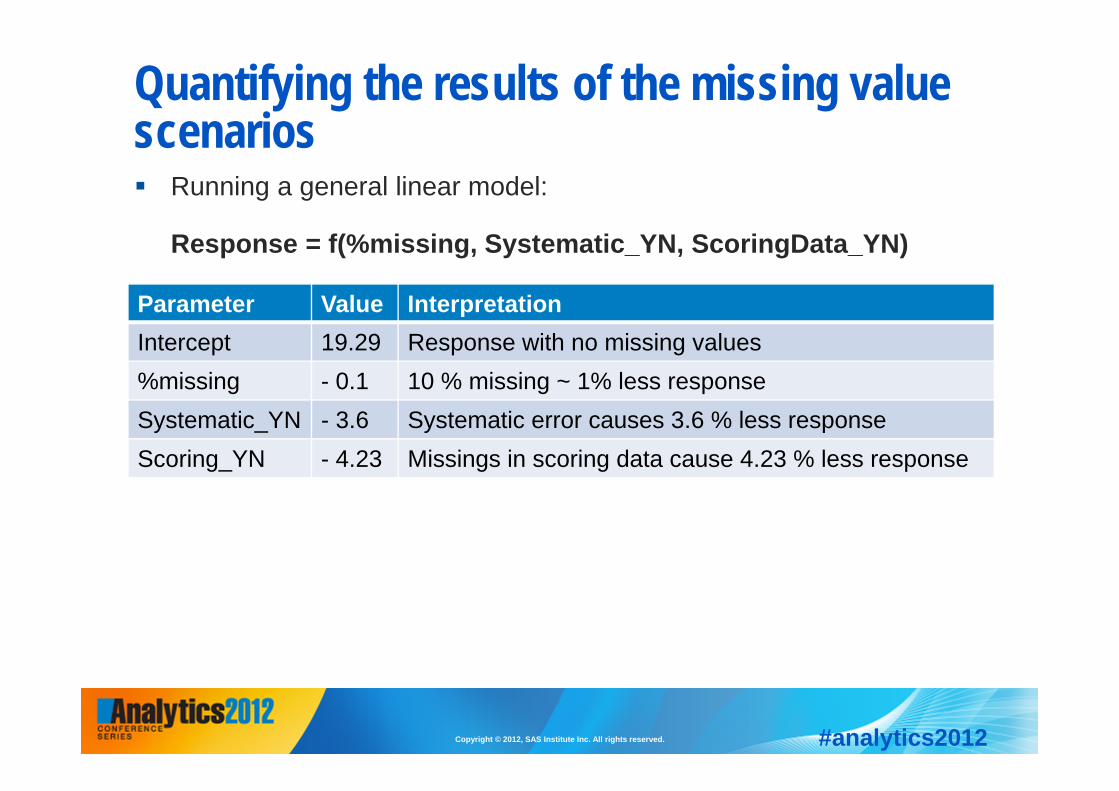
Quantifying the results of the missing value scenarios Running a general linear model:
Response = f(%missing, Systematic_YN, ScoringData_YN)
Parameter Value Interpretation Intercept 19.29 Response with no missing values%missing - 0.1 10 % missing ~ 1% less responseSystematic_YN - 3.6 Systematic error causes 3.6 % less responseScoring_YN - 4.23 Missings in scoring data cause 4.23 % less response
#analytics2012Copyright © 2012, SAS Institute Inc. All rights reserved.
Gradually increasing the available length of data history in time series forecasting Business Questions
Is it possible to start time series analysis if only 18 months ofhistory are available? Do we have to wait for an additional history month? What is the benefit of additional data management effort? What is the best length of data history for time series forecasting?
Methods Simulation environment built with SAS High Performance
Forecasting Restricted to forecasting method „exponential smoothing“ Minimum history for each time series: 48 months Validation based on MAPE calculated on 12 lead months 788 time series on monthly data from different industries

#analytics2012Copyright © 2012, SAS Institute Inc. All rights reserved.
How far should we remember back?
The expected decreasein MAPE with increasinghistory length can beseen.
There is an exponentialdecrease in theadditional value ofadditional months
Larger steps after 12, 24 and 36 months canbe seen.

#analytics2012Copyright © 2012, SAS Institute Inc. All rights reserved.
What is the best length of data history for time series forecasting? Method: for each time
series query how manyhistory months give thesmallest error for thefuture 12 months
Results: Not in all casesit is beneficial to have a long data history.
#analytics2012Copyright © 2012, SAS Institute Inc. All rights reserved.
Final takeaways
Data Quality for Analytics is more More requirements More possibilities
Get into details! Random or systematic bias? Permanent or historic/temporary problem?
Quantity matters! But balance effort and benefit!
SAS helps to Profile, Improve, Assess, Simulate
#analytics2012Copyright © 2012, SAS Institute Inc. All rights reserved.
Data Quality for Analytics Using SASSAS Press, April 2012Dr. Gerhard Svolba – [email protected] – LinkedInhttp://www.sascommunity.org/wiki/Data_Quality_for_Analytics
Analytics has additional requirements on data quality
Analytics contributes methods for better data quality
Simulation studies show the consequences of poor data quality on model quality