consequences of financial reporting quality on corporate ... · consequences of nancial reporting...
TRANSCRIPT
Consequences of financial reporting quality… / Jennifer Martínez-Ferrero 49Estudios de Economía. Vol. 41 - Nº 1, Junio 2014. Págs. 49-88
* I thank the anonymous reviewers and the editor of Estudios de Economía for helpful comments which have considerably improved this research.
** Universidad de Salamanca. Email: [email protected]
Consequences of financial reporting quality on corporate performance. Evidence at the international level*Consecuencias de la calidad de la información financiera en el rendimiento financiero. Evidencia para el ámbito internacional
Jennifer Martínez-Ferrero**
Abstract
This paper examines the consequences of Financial Reporting Quality (FRQ) on Corporate Performance, using three proxies of FRQ: (i) earnings quality; (ii) conservatism; and (iii) accruals quality. Our purpose is to analyze the effect of a good FRQ on financial performance (FP) measured by the market to book ratio. To this end, the proposed hypotheses are tested on an unbalanced sample of 1, 960 international non-financial listed companies from 25 countries and the special administrative region of Hong-Kong for the period 2002-2010. The use of simultaneous equations for the panel data, via the GMM estimator proposed by Arellano and Bond (1991), highlights the positive effect of financial reporting quality (FRQ) on financial performance. This result is robust according to the different measurements of FRQ (earnings quality, accruals quality and account-ing conservatism) and for an aggregated measure for the previous three proxies of FRQ. The empirical evidence shows that this relationship is moderated by the level of corruption perception in the country of origin of the company, the adoption of IFRS, the accounting system used in the country and the influence of the economic cycle.
Key words: Financial Reporting Quality (FRQ); Financial Performance (FP), Accruals Quality (AQ), Earnings Quality (EQ), Accounting Conservatism.
JEL Classification: M41
Resumen
Este trabajo examina las consecuencias de la Calidad de Información Financiera (FRQ) en el desempeño empresarial, con tres alternativas de FRQ: (i) earn-ings quality, (ii) conservadurismo, y (iii) accruals quality. Nuestro objetivo es analizar el efecto de la FRQ en el rendimiento financiero (FP) medido por el valor de mercado. A tal efecto, las hipótesis propuestas son testadas para

Estudios de Economía, Vol. 41 - Nº 150
una muestra de 1.960 empresas internacionales, no financieras de 24 países y una Región Administrativa para el período 2002-2010. El uso de ecuaciones simultáneas para datos de panel, a través del estimador GMM propuesto por Arellano y Bond (1991), pone de manifiesto el efecto positivo de la FRQ sobre el resultado financiero. Este resultado es robusto, de acuerdo con las diferentes medidas de FRQ y para una medida agregada que contemple las tres proxies anteriores. La evidencia empírica obtenida muestra cómo dicha relación se ve moderada por el nivel de percepción de la corrupción en el país de origen de la compañía, la adopción de las IFRS, el sistema contable característico del país y, por último, la influencia del ciclo económico.
Palabras clave: Calidad de la Información Financiera, Rendimiento Financiero, Conservadurismo.
Clasificación JEL: M41
1. Introduction
Due to the markets and business globalization, geographical expansion and the greater demand for information and transparency amonginvestors, stakeholders and society in general, market agents find their toehold in the quality of their financial reporting and their main source of knowledge on company strategy.
For Jonas and Blanchet (2000), financial reporting is not only a final output; the quality of this process depends on each part, including disclosure of the com-pany’s transactions, information about the selection and application of accounting policies and knowledge of the judgments made. Financial information issued by a company has become an essential resource for any market participant, since it provides a reduced amount of information asymmetries between managers, investors, regulatory agencies, society and other stakeholders. Therefore, one of the main questions that arises about the quality of financial reporting is its effect on subsequent performance of a company, i.e. how the market values this higher perceived quality.
According to previous evidence, those companies with better quality of financial information are associated with subsequent higher performance, due to the fact that the market positively assesses those companies which are more committed to the issuance of good information for shareholders and other stake-holders, aiming to reduce or avoid information asymmetries between market participants (García-Lara et al., 2010; Ahmed and Duellmand, 2011; Bushman and Smith, 2001; Bens et al., 2002; Gunny, 2005).
Furthermore, the manager’sdecision and his discretional behaviour have an influence on corporate performance through the strategic management process. Thus, it is necessary to know the manager’s actions, decisions and behaviour, corporate strategy and accounting policies among others, to highlight and de-termine the causes of firm’s company performance.
In view of the above arguments, this paper examines the consequences of Financial Reporting Quality (FRQ) on Corporate Performance, using three prox-ies of FRQ: (i) earnings quality; (ii) accounting conservatism; and (iii) accruals

Consequences of financial reporting quality… / Jennifer Martínez-Ferrero 51
quality. Our first purpose is to analyze the effect of a good FRQ on financial performance (FP) measured by the market to book ratio.
For this, the hypotheses proposed are tested on an unbalanced sample of 1, 960 international non-financial listed companies from 25 countries and an Administrative Region for the period 2002-2010. The use of simultaneous equa-tions for panel data, via the GMM estimator proposed by Arellano and Bond (1991), highlight the positive effect of FRQ on Financial Performance.
On the other hand, companies are economic units operating in contexts formed by institutions that affect their behaviour and impose their expecta-tions on them (Campbell and Lindberg, 1991; Roe, 1991; Campbell, 2007). Assuming this relationship is accepting that companies operating in institution-ally similar contexts adopt homogeneous behaviours (La Porta et al., 1998; Claessens and Fan, 2002). For this reason, owing to the use of an international database, with the subsequent divergence of information and accounting aspects as well as institutional and cultural differences among countries, I analyse the proposed relationship based on a variety of moderating factors. These factors are (i) the perception of corruption in the country of origin of the company; (ii) the adoption or not of the standards established by International Financial Reporting Standards (IFRS), (iii) the accounting system in which the company carries out its activity and finally (iv) the variability of results depending on the economic cycle.
The results show that companies that report financial statements with better information quality (associated to better earnings quality, accounting conserva-tism and better accruals quality) enjoy higher FP, measured by market measures which are more adequate in order to observe if investors are able to identify the CSR entrenchment practices. Along with the rest of market measures, reflect the trust that stakeholders have not only in the company at present, but also in the past and future.
Regarding the moderating factors of such a relationship, the results high-light that the direct relationship between financial reporting quality (FRQ) and financial performance is moderated by the level of corruption perception and the adoption of IFRS in the country of origin of the company, the international accounting system to which it belongs and the economic cycle.
The rest of this paper is structured as follows. In the next section, I clarify the concept of financial reporting quality and summarise the most significant literature on this question, and propose our main hypothesis. I then describe the methodology employed, with full details of the sample examined, the variables included and the empirical model proposed to test the hypothesis. Then, I ex-amine and discuss the results of the analysis. Finally, I highlight the principal conclusions drawn, outline some limitations of this study and suggest possible future lines of research.
2. Theoretical Framework
2.1. Financial Reporting Quality (FRQ)
For Jonas and Blanchet (2000), financial reporting is not only a final output; the quality of this process depends on each of its parts, including disclosure of

Estudios de Economía, Vol. 41 - Nº 152
the company’s transactions, information about the selection and application of accounting policies and knowledge of the judgments made.
In relation to FRQ, let us first note that the goal of financial reporting is to provide useful information for decision making. However, even though compa-nies may generate financial statements in accordance with generally accepted accounting principles, these statements may present differing levels of quality (Choi and Pae, 2011). FRQ can be defined as the faithfulness of the information conveyed by the financial reporting process.
According to the leading authorities on the evaluation of financial reporting (such as the FASB, the SEC or the Jenkins committee), the main characteristics required are relevance, reliability, transparency and clarity (Jonas and Blanchet, 2000; Lu et al., 2011). It has been asserted that high quality accounting information is a valuable means of counteracting information asymmetry (Chen et al., 2011).
FRQ requires companies to voluntarily expand the scope and quality of the information they report, to ensure that market participants are fully informed in order to make well-grounded decisions on investment, credit, etc. This high quality information facilitates greater transparency and this greater transparency reduces the information asymmetries and satisfies investors and stakeholders’ needs.
Numerous advantages of providing high-quality information have been cited: FRQ reduces information risk and liquidity (Lambert et al., 2007), prevents man-agers from using discretionary power for their own benefit and helps them make efficient investment decisions (Chen et al., 2011). Specifically, one of the main benefits of better FRQ is based on the minimisation of asymmetric information problems that arise from conflicting agency (Rajgopal and Venkatachalam, 2011). Companies that report higher quality financial information give to the various markets’ agents better information on it, allowing them to act in the market with better conditions and a higher level of information (Jo and Kim, 2007).
Lambert et al. (2007) obtained empirical evidence that the quality of ac-counting information can influence the cost of capital, both directly, by affecting market participants’ perceptions about the distribution of future cash flows, and indirectly, by affecting real decisions that alter the distribution of future cash flows. Chen et al. (2011) found that FRQ positively affects private firms invest-ment efficiency in emerging markets and that this effect enhances bank financing and decreases incentives to minimise earnings for tax avoidance purposes.
The external indicators of FRQ are: (i) SEC Accounting and Auditing Enforcement Releases (AAERs); (ii) Restatements; and finally, (iii) internal controls. The two last indicators are the most important because they show information about the quality of the financial statements as a whole and not just as earnings. The main consequences of these alternatives are their effect on the cost of capital (market reaction to announcements of restatements and/or AAERs is negative). Francis et al. (2005), supporting this point of view, reported that firms with a higher earning quality have a lower cost of debt.
Among the opportunities to assess FRQ, the most employed proxies of this concept in literature are: (i) earnings quality; (ii) accounting conservatism; and (iii) accruals quality. Illustrating this theory, Dechow et al. (2010) defined three categories of earnings quality proxies, on the grounds that “higher earn-ings quality shows the features of the firm’s earnings process that are relevant to a specific decision made by a specific decision-maker”. These proxies are: properties of earnings, earnings response coefficients and external indicators of FRQ. These authors considered the determinants of earnings quality to be firm

Consequences of financial reporting quality… / Jennifer Martínez-Ferrero 53
characteristics, financial reporting practices, governance and controls, auditors, capital market incentives, external factors and the level of institutional factors in the country of the company. The second measure of FRQ that I consider is the degree of accounting conservatism, which implies a more timely incorporation of economic losses into accounting earnings than of economic gains (Ball et al., 2000). Finally, accruals quality is based on mapping past, current and future cash flow operations with accruals (Garrett et al. 2012).
FRQ has been studied in different areas, and several authors have referred to its advantages, such as its positive effects from the financial point of view, by contributing to reducing information risk and enhancing liquidity (Lambert et al., 2007). On the other hand, information in financial statements is particularly fundamental in debt contracting (Costello and Wittenberg-Moerman, 2011).
In this paper, I focus on the economic and financial benefits of companies with higher levels of FRQ.
2.2. Research Hypothesis: The link between FRQ and Financial Performance
Financial information issued by a company has become an essential resource for any market participant, since it provides a reduced amount of information asymmetries between managers, investors, regulatory agencies, society and other stakeholders. Therefore, one of the main questions that arises about the quality of financial reporting is its effect on subsequent performance of a company, i.e. how the market values this higher perceived quality.
Furthermore, the discretional manager behaviour has an influence on corporate performance through the strategic management process. Thus, it is necessary to know not only the manager’s actions, decisions and behaviour, but also the corporate strategy and accounting policies among others, to highlight the causes of a firm’s performance. According to Lee et al. (2006), corporate performance and growth determine the quality of financial information reported by companies.
In a first approximation of the effect of FRQ on financial results, it is necessary to highlight the work of McDemmott (2011) who shows how higher quality financial statements improve the efficiency of investments in CSR because FRQ mitigates moral hazard problems. This leads to a CSR investment that benefits not only stakeholders but also investors, a key factor that determines future improved performance. Along the same line, Bushman and Smith (2001) document that financial and accounting information influences future economic performance and predict that better FRQ leads to an improvement in the effi-ciency of various investments.
Within a relationship of FRQ and financial performance focused on dif-ferent measures and proxies of FRQ, it is necessary to limit this study to the three universally accepted FRQ measures: earnings quality (EQ), accounting conservatism and accruals quality (AQ).
On the one hand, Earnings Quality is one of the most employed proxies of FRQ in research about this concept. It is necessary to take into account that EQ is negatively associated with earnings management, which is considered to be the inverse of FRQ (Dechow and Dichev, 2002); a higher degree of EM is associated with lower quality of information. Earnings management is used to distort the true performance of firms and analysts serve as external monitors to managers. One of the managers’ incentives to carry out these unethical practices

Estudios de Economía, Vol. 41 - Nº 154
could be increasing financial performance, which can only occur in the short term, due to the fact that in the long term the market penalizes those manipula-tive companies and they enjoy lower corporate performance (Rangan, 1998).
According to earnings management research, earnings releases of analysts reflect the earnings management practices, thus those companies that enjoy better Earnings Quality are associated with better and higher earnings releases (Louis, 2004). This author finds a positive link between EQ and subsequent profitability. This result supports the previous evidence of Rangan (1998) who shows that initially the market overvalues and expects a higher return from companies that manipulate their outcome, but in the long-term their profitability and their corporate performance is reduced by identifying such unethical practices. So, when the market identifies unethical practices, itpenalizes manipulative com-panies with subsequent poor stock price performance. In the same way, Bens et al. (2002) shows that companies with better quality of their earnings (firms that do not practice real earnings management through the reduction of R&D expenses) enjoy higher subsequent profitability.
Meanwhile, Jo and Kim (2007) analyse the link between information disclosure, earnings management (EM) and subsequent performance and obtain evidence of how higher levels of EM are associated with lower disclosure (and therefore a lower quality of the same) and lower future performance. Therefore, when statements reported by the company contain a greater volume of information, the trend towards EM is lower and the performance achieved by the company higher, which is consistent with the argument of Tu (2012), who argues that when information transparency is greater (one of the qualities required for better FRQ), the tendency to manage earnings is lower.
In his research, Gunny (2005) examines the positive effect of EQ on future performance through the analysis of the economic consequences of four types of real earnings management. He finds that EQ affects subsequent return on assets, i.e. operating performance and cash flows, because earnings management affects the future of current income.
In addition, one of the widely explored aspects in previous literature is the effect of FRQ on external financing. In this line, several studies have considered that earnings quality is associated with a decrease of information asymmetries, which affect the cost of capital (Francis et al., 2005, 2008; Bhattacharya et al., 2003). Therefore, companies with better FRQ enjoy lower cost of capital, which may also affect the firm’s performance.
Regarding the degree of accounting conservatism, which implies a more timely incorporation of economic losses into accounting earnings than of economic gains (Ball et al., 2000), some authors such as García-Lara et al. (2010) and Ahmed and Duellmand (2011) obtained empirical evidence of the positive association between accounting conservatism and future profitability because of improvements in investment efficiency.As well as FRQ, accounting conservatism has become an incentive to managers to promote better performing projects that increase future performance since these economic or financial projects are more profitable. Meanwhile, Ahmed and Duellmand (2011) show that conservative companies enjoy better future profitability due to their investment in more efficient projects.
Bushman and Smith (2001) also report that companies with higher FRQ are bound to promote profitable investment decisions and thus, these companies could view increases in their corporate performance. In this line, Rajgopal and Venkatachalam (2011), making used of Dechow and Dichev’s (2002) model to

Consequences of financial reporting quality… / Jennifer Martínez-Ferrero 55
estimate EQ, obtain empirical evidence of the positive link between the changes in FRQ in recent decades and rising idiosyncratic return volatility. This evidence confirms the previous results of Francis et al. (2005), who, making used EQ as an FRQ proxy, show that EQ is linked with expected returns.
Meanwhile, Accruals quality is achieved when the information reported to investors and to the market is credible and free of error and bias, intentional or otherwise (Lu et al., 2012), thus expanding the scope and quality of reported in-formation and ensuring that market participants are fully informed (Hope et al., 2012). Just as with the alternative FRQ measures, I expect that companies that report more credible information, free of error and bias, enjoy better corporate performance, making the market able to identify these companies and positively assess their ethical practices.
In addition, a widely explored aspect in previous literature is the effect of FRQ on external financing. Thus, several researchers have considered that earn-ings quality is associated with a decrease of information asymmetries, which affect the cost of capital (Francis et al., 2005, 2008; Bhattacharya et al., 2003). Therefore, companies with better FRQ enjoy of lower cost of capital, which also may affect the firm’s performance.
In short, throughout the literature several researchers have considered that the FRQ is associated with a decrease of information asymmetries, which affect corporate performance. Our main objective is to determine whether higher cor-porate performance is a consequence of better quality of financial information. Thus, in view of the above arguments, I propose the next hypothesis:
H1: The increase of Corporate Performance is a consequence of higher Financial Reporting Quality.
2.3. Moderating factors in the relationship between FRQ and financial performance
Companies are economic units operating in contexts formed by institutions that affect their behaviour and impose their expectations on them (Campbell and Lindberg, 1991; Roe, 1991; Campbell, 2007). Assuming this relationship is accepting that companies operating in institutionally similar contexts adopt homogeneous behaviours (La Porta et al., 1998; Claessens and Fan, 2002). In this sense, institutional theory must be considered to be a theoretical model that can explain corporate isomorphism.
Organisations operating in countries with a similar institutional structure will adopt homogeneous forms of behaviour (La Porta et al., 1998; Claessens and Fang, 2002; Campbell, 2007). DiMaggio and Powell (1983) name this process ‘isomorphism’ and argue that it enhances firm stability and survival, facilitating political power and institutional legitimacy. These isomorphic practices emanate from the organisation’s decision to resemble others (mimetic isomorphism), to do the professionally correct thing (normative isomorphism) or to comply with the rules applied by external forces (coercive isomorphism) (Perez-Batres et al., 2011).
For this reason, based on institutional theory and non-business aspects that affect behaviour, I analyse a variety of moderating factors for the relationship here analysed. Specifically, owing to the use of an international sample, with the subsequent divergence of information and accounting aspects as well as institutional and cultural differences among countries, I analyse the proposed
Estudios de Economía, Vol. 41 - Nº 156
relationship based on a variety of moderating factors. These include (i) the perception of corruption in the country of origin of the company; (ii) the adop-tion or not of the standards established by IFRS, (iii) the accounting system in which the company carries out its activity and finally (iv) the variability of results depending on the economic cycle.
2.3.1. Level of corruption perception
The present study is based on an analysis of the effect of the quality of finan-cial information reported by companies on financial performance. However, as mentioned previously, we must not forget that businesses carry out their activities within an institutional environment that determines their behaviour in some way.
Specifically, one of the problems that generate higher global debate is the level of corruption perception in each country, which is considered to be a factor, among many, that affect and determine business behaviour. As noted by Transparency International, “Governments should incorporate actions against corruption in all public decisions. Among the priorities are more effective rules on lobbying and political funding, greater transparency in government procurement and public expenditure, and greater accountability of public bodies to the population.“
Specifically, we understand corruption as an abuse of power for self-benefit (Transparency International). It is for this reason that according to the definition of EM (the inverse of FRQ) proposed by Garcia-Osma et al. (2005), which can be defined as “any practice carried out intentionally by company managers, for opportunistic and/or information purposes, to report accounting results that do not correspond to those really achieved”, a similar aspect is found between EM and corruption, since both decisions are based on obtaining self-benefit. For this, I expect a certain link between both.
In this line, it is expected that companies that carry out their activities in environments characterised by a strong corruption perception report financial statements of lower quality, since there are no public or private institutions to ensure greater transparency. Therefore, firms report lower quality information, even when it can influence their financial performance. For those companies that report more quality information and operate in countries with a higher level of corruption perception, financial performance is lower than those operating in more “sanitised countries” of corruption.
In view of above arguments, the following hypothesis is formulated con-sidering that the level of corruption perception in the country of origin of the company exerts a moderating effect on the financial consequences of FRQ.
H2: The level of corruption perception in the country of origin moderates the effect of FRQ on corporate performance.
2.3.2. Adoption of IFRS
IFRS are the accounting rules adopted by the International Accounting Standards Board (IASB), a private institution based in London. They are in-ternational standards or rules in developing accounting activity and pose an accounting manual, since in them accounting is acceptable in the world. These rules are responsible of the development of accounting in a homogenised form and pursuing international accounting harmonisation.
Consequences of financial reporting quality… / Jennifer Martínez-Ferrero 57
For this extensive relationship with the quality of financial and accounting information reported by companies in countries that have adopted such standards, I consider its moderating role in the FRQ-financial performance relationship.
In this line, there are contradictory arguments of the effect of IFRS on FRQ. On one hand, authors such as Ball et al. (2003) argue that IFRS do not necessarily produce high quality accounting information. These authors think that FRQ is determined by political and economic factors and the institutional environment itself not only by a set of rules themselves. In this sense, other macroeconomic factors may affect the issuance of financial and accounting information quality; for example, some countries have introduced a more efficient control mechanism or corporate governance rules (Chen et al., 2010). This argument is supported by the evidence obtained by Van Tendeloo and Vanstraelen (2005), who in their study of the voluntary adoption of IFRS by German companies, obtain evidence of the positive effect of the adoption of these international standards on the level of EM and the lower cash flow from operations, although the effect is reduced when companies are audited by one of the Big 4/5 auditors.
Furthermore, according to Chen et al. (2010), in their analysis of countries belonging to the European Union, a large number of accounting quality indicators improve once they have adopted IFRS. Specifically, following the adoption of these standards, there are fewer tendencies towards EM, a lower magnitude of discretionary accruals and higher AQ. However, they also obtain evidence of a lower degree of conservatism. In the same line, Barth et al. (2008) report better accounting quality after IFRS adoption. It is also necessary to note that based on previous studies, Lantto and Sahlstrom (2009) support the finding that the adoption of IFRS generates positive changes in profitability ratios, explained in part by the increase in revenues in the income statement.
Based on previous arguments, and in order to confirm the effect of IFRS on FRQ given these divergent results, it is expected that companies that conduct business in countries that have adopted IFRS report higher quality information that affects positively their financial results. Therefore,
H3: The adoption of IFRS by the country of origin moderates the effect of FRQ on corporate performance.
2.3.3. Accounting System
As reflected in many cases, the aim of this research is to determine the effect of FRQ on financial performance. However, the reporting requirements and quality control by the regulatory bodies of each of the countries of the companies included in the sample vary. That is why it is necessary to compare companies based on the different regulatory frameworks and enforcement re-quirements for compliance with reporting obligations to the market. To do this, I analyse the different international accounting systems to consider how the regulatory framework to which each country belongs affects the FRQ-financial performance relationship. Despite the adoption of IFRS as accounting stan-dards, each country has rules and procedures to control FRQ, such as major or minor information controls and auditors, among others. In each country, there is a diversity of views and practices of accounting information derived from multiple and varied aspects such as the legal system, the opening to the capital market, cultural factors and pressure from stakeholders and society in general.

Estudios de Economía, Vol. 41 - Nº 158
This generates the existence of different accounting treatments that have to be taken into account in this analysis.
Specifically, one of the aspects widely analysed in the literature is the differ-ence among international accounting systems in terms of legal, cultural, economic and political aspects. The most obvious example of this is the difference between the accounting systems of the US and the UK compared with Europe (Nobes, 1998). Among some of the major differences, capital market orientation in a financial context is one of the most important aspects, regardless of the existence of different regulatory bodies, such as the International Accounting Standards Committee or IASB. For example, the US accounting system is more capital market-oriented than the European or British ones, but increasingly continental accounting systems are opting for greater guidance and rising the importance of capital market-oriented banking.
Following Nobes (1998) and Nair and Frank (1980), based on the characteristics of each country’s accounting system, patterns of behaviour and characteristics, we can distinguish three international accounting systems: (i) US model (ii ) continental model and (iii) British model. Leuz et al. (2003) analyse the different levels of EM through an international sample of countries and recognise that differences in accounting standards may limit the ability of management manipulation. It is therefore necessary to control for the accounting differences between countries that could potentially limit capacity and enhance the quality of financial statements.
The main characteristics of each of them can be summarised as follows, from the studies of Mora et al. (2004), Leuz et al. (2003) and Weimer and Pape (1999):
– US model: Instrumentalist conception of the company oriented to sharehold-ers as the main stakeholders and the presence of a strong capital market as well as dispersed ownership, strong investor rights and legal controls. The tendency towards EM is lower, leading to greater FRQ.
– British model: Although lower than the US, the importance of the capital market is high. There is also higher litigation risk, which is extracted from a higher level of conservatism. As with the previous model, these countries are characterised by dispersed ownership, strong investor rights and legal controls.
– Continental model: Lower capital market participation but with an upward trend. Funding comes largely from financial institutions. Continental European countries show a similar conservatism to the UK, despite the absence of litigation risk and the effect of balance sheet conservatism.
Based on the existence of different accounting systems internationally, it is considered that the FRQ-financial performance relationship may be moderated by such systems depending on the accounting system of the country where the company operates. Therefore, the following hypothesis is formulated:
H4: The accounting system of the country of origin moderates the effect of FRQ on corporate performance.
2.3.4. Economic cycle
Another problem arising from the analysis of FRQ-financial performance is the time period analysed. Since 2008, the deep economic and financial crisis

Consequences of financial reporting quality… / Jennifer Martínez-Ferrero 59
experienced by international markets has generated a wave of economic, financial, cultural, legal and institutional charge. This is why it is necessary to consider the economic cycle to be a moderating factor. From the economic standpoint, the financial and economic crisis has created a deep mistrust in the markets, not only for investors but also for customers, suppliers, financial institutions and society in general.
Within the scope of the study, there is a clear relationship between the level of FRQ and the return obtained by the companies and their economic cycles. It is necessary to note that the FRQ issued by a company varies depending on whether the economic situation is in an expansion phase (higher growth rates of economic productivity) or in a recession stage (reduced levels of economic productivity). As maintained by Klein and Marquardt (2006), firms invest more during periods of greatest macroeconomic productivity. On this basis, companies choose to invest more in ways that improve their financial reporting stages of economic and financial growth.
In this sense, one might expect that firms in the expansion stage have the incentive to promote greater quality in their financial statements and perfor-mance, which in general terms, because of the growth situation, is increasing. By contrast, for companies located in countries within a period of recession or economic downturn, the tendency to improve the quality of financial information is lower, which serves as a detriment to business performance.
Based on these arguments, the variability of the economic cycle is considered to be another factor that moderates the FRQ-financial performance analysis. Therefore, in order to test the moderating effect of the economic cycle, the fol-lowing hypothesis is formulated:
H5: The economic cycle moderates the effect of FRQ on corporate performance.
3. Empirical Research
3.1. Sample
The sample used to test the proposed hypotheses is constituted of 1960 in-ternational listed non-financial companies for the period 2002-2010. The sample is unbalanced, consisting of a total of 14844 observations obtained from 25 countries and an administrative region (USA, United Kingdom, Ireland, Canada, Australia, Germany, Netherlands, Luxemburg, Austria, Denmark, Norway, Finland, Sweden, Switzerland, France, Italy, Spain, Belgium, Portugal, Greece, Japan, China, Singapore, New Zeland, Korea and Hong-Kong, as administrative region). This sample was obtained from the fusion of information available in Thomson One Analytic, for accounting and financial data.
3.2. Measures of Financial Reporting Quality
Taking previous literature into account, I used various measurements of FRQ (Choi and Pae, 2011; Hong and Andersen, 2011; Lu et al, 2011), as there is no universally accepted way of measurement (Dechow et al., 2010). The first mea-surement used is the degree of earnings management using accruals, while the second is the degree of accounting conservatism and the third, accruals quality.

Estudios de Economía, Vol. 41 - Nº 160
3.2.1. Earnings Management (EM) through accruals
EM is considered to be the inverse of FRQ (Dechow and Dichev, 2002); a higher degree of EM is associated with lower quality of information and lower earnings quality (Raman et al., 2012). Thus, the first measurement of FRQ is management discretion over accruals (Choi and Pae, 2011).
The discretionary component of accruals adjustment could be used as a measurement of discretionarymanagement, and therefore of accounting ma-nipulation. As observed by Garcia-Osma et al. (2005), accruals are not all discretionary; hence it is necessary to separate the discretionary component from the non-discretionary one in order to determine the presence and extent of EM. The discretionary accruals adjustment (DAA) is obtained by subtract-ing the non-discretionary accruals adjustment (NDAA) from the total accruals adjustment (TAA). The DAA represents the abnormal accruals that constitute the variable taken as a measure of EM.
In this study, I use the Kothari model (Kothari et al., 2005) to separate the non-discretionary component of accruals from the discretionary one. This model is explained in Appendix 1. To obtain a proxy of FRQ, I employ the absolute value of the DAA estimated by this model because EM may involve either income-increasing or income-decreasing accruals (Warfield et al., 1995; Klein, 2002):
(1) FRQKOTHARI = ABS_DAA_KOTHARI
Here, ABS_DAA_KOTHARI is the absolute value of the DAA calculated by the Kothari model. Thus, the lowest values of FRQKOTHARI represent the lowest level of earning management practices that are associated with the highest FRQ.
3.2.2. Accounting conservatism
The second measure of FRQ that I consider is the degree of accounting con-servatism, which implies a more timely incorporation of economic losses into accounting earnings than of economic gains (Ball et al., 2000). According to Basu (1997), conservative accounting reflects bad news for the company more rapidly than good news because this approach tends to reduce litigation risks (Kothari et al., 1989; Skinner, 1994; Ball et al., 2008). Following Choi and Pae (2011) and García-Lara et al. (2009), I use a variation of the Basu (1997) model proposed by Khan and Watts (2009). These authors employ a two-step procedure.
First, I estimate the following cross-sectional regression for each year:
(2)
α α β β β
δ δ δ δγ γ γ γ
µ µ µ µ ε
( )( )
( )
= + + + + +
+ + + + +
+ + + + +
+ + + + +
−
E
PDR SizeMVE MTB LEV
DR SizeMVE MTB LEV
R SizeMVE MTB LEV
R DR SizeMVE MTB LEV*
it
i tit t it t it t it
it t it t it t it
it t it t it t it
it it t it t it t it t
, 10 0 1 2 3
0 1 2 3
0 1 2 3
0 1 2 3 3

Consequences of financial reporting quality… / Jennifer Martínez-Ferrero 61
where −
E
Pit
i t, 1
is the net income scaled by the lagged market value of equity; Rit
is the annual stock return for the 12 months ending 3 months after the balance sheet date; DRit is a dummy variable that takes the value 1 when Rit < 0 and 0 otherwise; SizeMVEit is the natural logarithm of the market value of equity; MTBit is the market to book ratio; LEVit is the leverage measured by dividing the sum of long term and short term debts by the market value of equity; i represents the companies and t the years.
In the second step, I use a firm-year specific measure of timelines of earnings (C_SCORE), with the coefficient estimates from Equation 3.
(3) C SizeMVE MTB LEVScore t it t it t it0 1 2 3µ µ µ µ= + + +� � � �
An alternative measure has been proposed, taking into account the timelines of reported earnings with respect to bad news, since stakeholders are more in-fluenced by bad news rather than good news. This measure is called B_SCORE and it is calculated as follows:
(4)γ γ γ γ
µ µ µ µ
= + + + +
+ + +
B SizeMVE MTB LEV
SizeMVE MTB LEV
Score t t it t it t it
t it t it t it
0 1 2 3
0 1 2 3
� � � �
� � � �
3.2.3. Accruals Quality
Another measurement of FRQ that has been used in several papers (Choi and Pae, 2011; Hong and Andersen, 2011; Francis et al., 2005) is the accruals quality (AQ). In this paper, AQ is measured through the Ball and Shivakumar model (2006).
The model proposed by Ball and Shivakumar (2006) to obtain another measurement of AQ suggests that nonlinear accrual models that incorporate the timely recognition of losses perform better than linear models. Hence, I add a current-year cash flow dummy and its interaction with cash flow levels into the previous Dechow and Dichev model (2002).
(5)β β β β β β
β β ε∆ = + + + + ∆ + +
+ +− +WC OCF OCF OCF REV PPE
DOCF OCF DOCF*it i t it i t it it
it it it t
0 1 , 1 2 3 , 1 4 5
6 7 7
where the change in working capital accruals from year t-1 to t is: ∆WC = ∆Accounts Receivable + ∆Inventory – ∆Accounts Payable – ∆Taxes Payable + ∆Other Assets; OCF is the operating cash flow; ∆Revenues is the change in revenues; DOCF is an variable indicator for the negative cash flows. It takes the value 1 if there are negative OCF and 0 other wise i indicates the company and t refers to the time period. All the variables (excepted DOCF) are scaled by the total assets.
I use the absolute value of the residuals from this model as a proxy for AQ: the lower the degree of this proxy, the higher the degree of AQ.

Estudios de Economía, Vol. 41 - Nº 162
3.2.4. Aggregated measures of FRQ
In order to obtain robust results, one of the goals of this paper is to gener-ate an aggregate measure of FRQ, called AFRQ. This variable is the sum of the four dummy variables detailed above, and therefore takes values between 0 (absence of quality of information) and 4 (strong level of quality). For this, I create four dummies DEQ, DC_Score, DB_Scoreand DAQ, corresponding to the measures explained.
DEQ takes the value of 1 if a company has a level of FRQKOTHARI under the average for the corresponding sector, year and country, and 0 otherwise. It is necessary to take into account that lower levels of this variable represent a lower tendency towards EM and thus higher FRQ. DC_Score takes the value of 1 if a company has a level of C_SCORE above the average for the corresponding sector, year and country, and 0 otherwise. In the same way, DB_Score takes the value of 1 if a company has a level of B_SCORE above the average for the corresponding sector, year and country, and 0 otherwise. Finally, DAQ takes the value of 1 if a company has a level of BALLSHIVAKUMAR under the average for the corresponding sector, year and country, and 0 otherwise. In the same way as EQ, lower levels of BALLSHIVAKUMAR reflect higher FRQ.
After obtaining the value of the four previous dummies, we proceed to cal-culate AFRQ as the sum of the DEQ, DC_Score, DB_Score and DAQ dummies:
(6) = + + +AFRQ DEQ DC Score DB Score DAQ_ _
3.3. Measures of Financial Performance
Among the numerous means of evaluating the FP, in our present research I employ the Market to Book (MTOB)as the market to book value ratio(Seifert et al., 2003). This variable identifies market measures of FP according toprevi-ous evidence from Hillman and Keim (2001). These authors argue in their study that accounting actions are less successful than market actions due to the fact that they are not able to capture the long-term value of the company, focused on past performance and are subject to the possibility of manager’s manipulation. Moreover, market measures are more adequate in order to observe if investors are able to identify the CSR entrenchment practices. These variables, as the other market measures, reflect the trust that stakeholders have not only in the company at present, but also in the past and future.
3.4. Moderating factors
In order to achieve more robust results that reflect the characteristics of each country from different points of view, I include a set of moderating factors to contemplate the effect of FRQ on financial performance according to different perspectives.
First, to reflect the moderating role of corruption perception in the country of origin of the company, the CORRUPTION variable is created. This vari-able represents the index of corruption perception in the country provided by Transparency International every year. This organisation creates the Corruption

Consequences of financial reporting quality… / Jennifer Martínez-Ferrero 63
Perception Index, which takes values from 0 (highly corrupt) to 10 (absence of corruption perception) in order to measure levels of corruption perception in the public sector of a given country; it is a composite index based on different experts and business surveys. The organisation defines corruption as “the abuse of entrusted power for private gain”.
With respect to the adoption of IFRS by the country of origin of the company, I create a dummy variable (IFRS), which takes the value of 1 if the country of origin of the companies has fully or partially adopted IFRS and 0 otherwise.
Thirdly, and to account for the differences between accounting systems, fol-lowing the classification proposed by Nobes (1989) and Nair and Frank (1980), accounting systems differ between US, continental Europe and British. I define three dummy variables representing these three international accounting systems (US, CONTINENTAL and BRITISH). The countries included in the US model are Canada, the United States and Japan. CONTINENTAL includes Germany, France, Belgium, Italy, Spain, Sweden, Switzerland, Austria, Portugal, Greece, Luxembourg, Denmark, Norway and Finland. Finally, the BRITISH accounting system includes the United Kingdom, Ireland, Australia, the Netherlands, Korea, Singapore, Hong Kong, New Zealand and China.
Finally, in order to consider in the analysis the economic cycle, specifically the effect of the economic and financial crisis in the relationship analysed in this research, the ΔGDP variable is created following the previous research of Klein and Marquardt (2006). This variable includes variation in the GDP of each country to consider the economic cycle as a moderator in the FRQ-financial performance relationship. GDP per capita is GDP divided by midyear popula-tion. GDP at purchaser prices is the sum of gross value added by all resident producers in the economy plus any product taxes and minus any subsidies not included in the value of the products. This is calculated without making deduc-tions for the depreciation of fabricated assets or the depletion and degradation of natural resources. These dates are obtained from the World Bank national accounts data and OECD National Accounts data files.
3.5. Control variables
To avoid biased results, I included several control variables, whose effect on FP, EM and CSR is well established by previous studies. Concretely, in our analysis I defined firm size, leverage, risk, operating liquidity, industry and R&D intensity as following:
· Firm Size (SIZE) Company size is measured by the logarithm of its total assets. It is common
practice to use firm size as a determinant variable of economic and financial performance and as a determinant of FRQ. Larger firms are incentive to show a positive effect on FP (Prior et al., 2008; Surroca et al., 2010). Furthermore, the size of the firm has been used in several research projects about FRQ, but this effect is uncertain.
· Leverage (DEBT) DEBT is the risk of debt or default and it is calculated as the ratio of debt
to equity. Another variable widely used in previous studies is the level of

Estudios de Economía, Vol. 41 - Nº 164
firm leverage (DEBT). It represents the debt or non-compliance risk (Prior et al., 2008; Mahoney et al., 2008). As with size of the firm, no consensus exists regarding the effect of the leverage level on FRQ. However, Tu (2012) found that debt ratios are the major determinants of EM changes.
· Risk (RISK) It represents the level of systematic risk andis measured by the beta of the
market model. According to Waddock and Graves (1997), risk is one of the items that affect FP. Companies with a higher risk have a greater probability and incentive to manipulate the accounting result in order to reduce this percep-tion or the cost of capital, and therefore, lower level of FRQ (Warfield et al., 1995).
· Operating Liquidity (WORKING CAPITAL) WORKING CAPITAL is defined as the difference between current assets and
current liabilities. It reflects liquidity, i.e. a company’s ability to continue the normal development of its activities in the short term. This variable, which is widely associated with the accounting result, allows companies to enjoy a higher liquidity when better financial performance is achieved.
· Industry (INDUSTRY) According to Margolis and Walsh (2003) and Waddock and Graves (1997), in
the analysis of FP is necessary to consider the effect of the industry in which the company operates, due to different characteristics of each economic activ-ity. To represent the company’s sector of activity, Iuse a multinomial variable (INDUSTRY) based on the corresponding COMPUSTAT economic code sector. The companies in the sample belong to the following sectors: basic materials, consumer discretionary and staples, health care, energy, financial activities, industrial activities, information technology, telecommunication services and utilities.
· R&D intensity (R&D INTENSITY) R&D INTENSITY measures the ratio of R&D expenditure to total revenue.
Some studies, like Baber et al. (1991) and Dechow and Sloan (1991) have found that the companies that invest the most in R&D have greater incentives towards EM, in order to achieve their established goals or project targets.
3.6. Model and Analysis Technique
To test the hypotheses proposed, I estimated simultaneous equations for panel data using the estimator proposed by Arellano and Bond (1991). This methodology has been used in several studies, such as De Miguel et al. (2005), to determine the relationships among different control mechanisms in the Spanish corporate governance system.
Using panel data enables companies’ performance in the sample to be as-sessed over time, by analysing observations from several consecutive years for the same companies. In contrast to using time series or cross-sectional data, this methodology makes it possible to detect unobserved heterogeneity or the differ-ences between individuals that are potentially correlated with the explanatory
Consequences of financial reporting quality… / Jennifer Martínez-Ferrero 65
variables (also called individual specific effects), which are invariant over time and directly influence corporate decisions (entrepreneurial capacity, favourable managerial attitude toward corporate transparency, etc.). Moreover, the study is enriched by considering the temporal dimension of data, particularly in periods of great change .Thus, the panel data enables us to control the effects that may affect sustainable practices each year.
Moreover, by using the GMM estimator I can control problems of endo-geneity between the independent and dependent variables by means of lags and thus control unobserved effects in each country. This method provides consistent estimators for the multiple regression models and corroborates the independence of the exogenous variables in the model under study. It does not require the assumption of normality and produces estimates with a higher level of confidence, by using orthogonality conditions or moments to achieve more efficient estimates. The models estimated are as follow:
In our model, FP is the dependent variable and FRQ is an independent one to determine the effect of good quality information on firm performance. FP is measured through market to book (MTOB).
I estimate four regressions with the different measures of financial report-ing quality as explanatory variables (EQ, C_Score, B_Score , AQ and DFRQ):
[1]FP ø ø FRQ ø Size ø Debt ø Risk ø Working capital
ø Industry ø R DIntensity µ
5 _
& .it it it it it it
it it i it
1 2 3 4
6 7 η= + + + + + +
+ + +
To consider the moderating role of the factors previously described, four new models are estimated for each of them, where again FRQ is measured by its three proxies: EQ, AQ and conservatism:
[2] η µ= + + + + + +
+ + + + +FP ø ø FRQ ø CORRUPTION ø CORRUPTION FRQ ø Size ø Debt
ø Risk ø Working capital ø Industry ø R DIntensity
_
_ & .it it it it it it
it it it it i it
1 2 3 4 5
6 7 8 9
[3] η µ= + + + + + + +
+ + + +FP ø ø FRQ ø IFRS ø IFRS FRQ ø Size ø Debt ø Risk
ø Working capital ø Industry ø R DIntensity
_
_ & .it it it it it it it
it it it i it
1 2 3 4 5 6
7 8 9
[4]η µ
= + + + + + ++ + + + +
+ + + +
FP ø ø FRQ ø US ø CONTINENTAL ø BRITISH ø USA FRQ
ø CONTINENTAL FRQ ø BRITISH FRQ ø Size ø Debt ø Risk
ø Working capital ø Industry ø R DIntensity
_
_ _
_ & .
it it it it it it
it it it it it
it it it i it
1 2 3 4 5
6 7 8 9 10
11 12 13
[5] η µ= + + + + + + +
+ + + +FP ø ø FRQ ø GDP ø GDP FRQ ø Size ø Debt ø Risk
ø Working capital ø Industry ø R DIntensity
∆ 3∆
_ & .it it it it it it it
it it it i it
1 2 _ 4 5 6
7 8 9
where:i indicates the municipality and t refers to the time period, ø are the parameters to be estimated, εi represents the persistent unobserved heterogeneity μit represents the classical disturbance term.FPi is a numerical variable measured by the Market to Book ratio.FRQt is a numerical variable that represents the quality of financial reporting.
Estudios de Economía, Vol. 41 - Nº 166
This variable is measured by EQ (FRQKOTHARI), conservatism (C_SCORE and B_SCORE) and AQ (BALLSHIVAKUMAR). Additionally, with the aim of achieving robust results, it is used as an aggregated measure of FRQ, AFRQ. CORRUPTIONit is a index variable that takes values in the range 0 to 10 to represent the level of corruption perception (0, very corrupt, 10, absence of corruption).IFRSit is a dummy variable that takes the value of 1 if the country of origin of the company has adopted IFRS, and 0 otherwise. US, CONTINENTAL and BRITISH are dummy variables that represent the dif-ferent international accounting systems.∆GDPit is a numerical variable that represents the economic cycle through the change in the GDP of each country.Sizeit is a numerical variable that represents the size of company i for period t as the logarithm of total assets.Debtit is a numerical variable that reflects the debt of company i for period t. Risksit is a numerical variable that represents the risk faced by company i for period t, measured by the beta.Working_Capitalit is a numerical variable that represents liquidity, i.e. the com-pany’s capacity to continue the normal development of its activities in the short term, measured as the difference between current assets and current liabilities.Industryit is a multinomial variable that represents the activity sector.R&DIntensityit is a numerical variable that represents the ratio of R&D expen-diture to total sales by company i for period t.
4. Empirical Evidence and Discussion of Results
4.1. Descriptive Statistics
Table 1 shows the descriptive statistics of the variables used in this study. The mean value of MTOB is 1.880233 and its standard deviation, ±100.4183, meaning that, in general, the companies examined are positively assessed for the market, they have a higher assessment than their book value and they have growth opportunities in view of their current assets. Regarding the FRQ mea-sures, the mean value of FRQKOTHARI is 49.33612 with a standard deviation of ± 1449.245, the mean value of C_SCORE and B_SCORE are 1.758795 and –222.152, respectively. Finally, BALL-SHIVAKUMAR that represents the accru-als quality has a mean value of 305.2815 and a standard deviation of ±10477.9.
Furthermore, Table 1 summarises the descriptive statistics for the control variables, expressed in millions of Euros. For example, the average size of the companies analysed is 7.8744 with a standard deviation of ±1.97945 and the average debt stands at 0.6758 with a standard deviation of ±110.19017.
With respect to the variable CORRUPTION, Table 2 shows the index of mean corruption perception for the countries in the sample. At the top are placed Denmark and Finland, which have been able to achieve this lack of perception of corruption owing, in part, to strong systems that have access to information and rules governing the conduct of public office holders. By contrast, China, Greece and Korea are at the lower end of the index. In Korea, the absence of effective public institutions and leaders accountable for their performance

Consequences of financial reporting quality… / Jennifer Martínez-Ferrero 67
highlights the need to adopt a much stronger stance against corruption. This index has experienced unsatisfactory results for those eurozone nations that have been most affected by the economic and financial crisis, such as Spain, Portugal, Greece and Italy.
Table 3 shows the percentage of countries in the sample that have adopted fully or partially (for all or for some of the companies registered in the country) IFRS accounting standards. Of the countries analysed in the sample, only the US, Switzerland and Singapore do not allow IFRS or are in the process of adapting to them. In the case of the US, the SEC allows foreign private issuers’ financial statements prepared using IFRS as reported by the IASB, without having to include a reconciliation of the IFRS figures to US GAAP. It is noteworthy that since 2002 there has also been a rapprochement between the IASB and Financial Accounting Standards Board, responsible for the development of accounting standards in the United States, to try to harmonise international standards with those of the US. In Switzerland, meanwhile, IFRS are not permitted. Finally, Singapore has adopted most IFRS but there have been significant changes to them. All local businesses have begun to adapt to IFRS from 2012. Because our time period is between 2002 and 2010, the value taken in this case is 0.
Table 4 shows the descriptive statistics of the accounting systems and the variable representing business cycle analysis. Regarding the accounting systems, 50.86% of the sample belongs to a North American accounting system (US variable), representing for half of the sample, because of the high percentage of American companies analysed. A total of 31.54% of the analysed companies belong to the British system, while, despite encompassing a larger number of countries, the continental system represents 13.82% of the sample.
For its part, the variable cycle ∆GDP representative of the average rate of change in GDP is around 1%, while its standard deviation is ±2.644332. On average the countries analysed in the sample for the period 2002-2010 enjoy positive annual GDP growth.
Table 5 shows the bivariate correlations. Neither the coefficients between the dependent and independent variables nor those between the different inde-pendent variables are very high.
TABLE 1DESCRIPTIVE STATISTICS
Mean Std. Dev. Min Max
MTOB 1.880233 100.4183 –11980.85 1081.475FRQKOTHARI 49.33612 1449.245 0.006576 75152.02C_SCORE 1.758795 45.53327 9.48E-06 3556.409B_SCORE –222.152 11440.87 –531936.8 467200.5BALL-SHIVAKUMAR 305.2815 10477.9 –533699.9 461530.1SIZE 7.874393 1.979449 –7.144209 13.38014DEBT 0.6757981 110.1902 –13201 616.0333RISK 1.212173 8.264746 –3.11677 428.8075WORKING_CAPITAL 627.4492 2840.651 –31035 143270INDUSTRY 2.919092 1.696143 0 8R&DINTENSITY 0.1788567 4.909281 0 350.9103

Estudios de Economía, Vol. 41 - Nº 168
TABLE 2INDEX OF MEAN CORRUPTION PERCEPTION FOR THE COUNTRIES
IN THE SAMPLE (2002-2010)
Mean
US 7.41United Kingdom 8.29Ireland 7.54Canada 8.68Australia 8.71Germany 7.94Netherlands 8.81Luxemburg 8.32Austria 8.17Denmark 9.36Norway 8.63Finland 9.42Sweden 9.24Switzerland 8.92France 7.01Italy 4.82Spain 6.7Belgium 7.25Portugal 6.53Greece 4.23Japan 7.36China 3.78Singapore 9.31Korea 5Hong-Kong 8.2
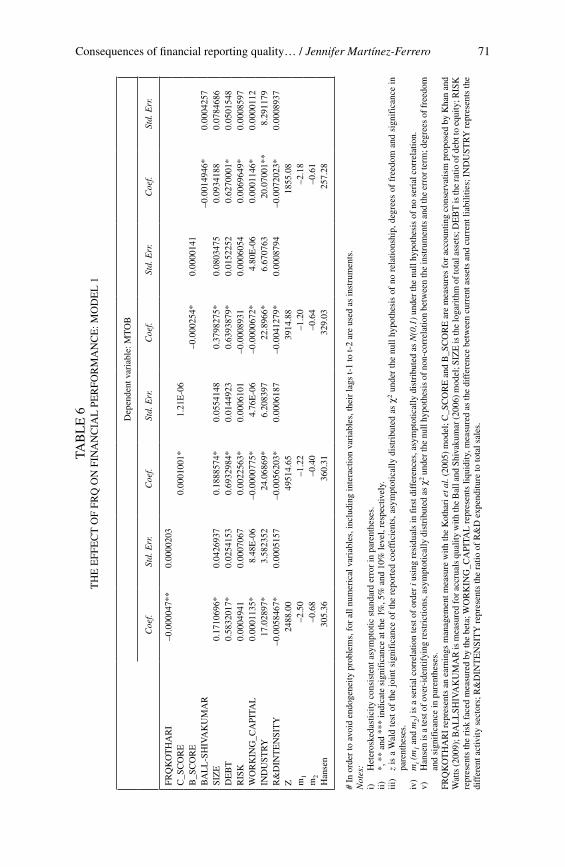
4.2. Results of dependency models
Focusing on the main object of analysis in this study, Table 6 highlights the effect of FRQ on FP measured by the market to book ratio. FRQ is measured using the Kothari et al. (2005) model for earnings quality, variation of the Basu (1997) model proposed by Khan and Watts (2009) for accounting conservatism and the Ball-Shivakumar (2006) model for accruals quality.
In the first model, earnings quality is used as a proxy of FRQ. FRQKOTHARI is statistically significant at a 95% confidence level and it has a negative effect on FP(coef. –0.000047). This means that a higher level of earnings manage-ment practices (a higher level of FRQKOTHARI) is associated with a lower FRQ, and thus, lower level of MTOB ratio (FP). These empirical results are in accordance with the hypothesis H1 that supports a positive relationship, since companies with a high quality level of financial information tend to have higher financial performance.
Therefore, this result supports the previous evidence of Louis (2004), Gunny (2005) and Rangan (1998), who find that earnings releases of analysts reflect the

Consequences of financial reporting quality… / Jennifer Martínez-Ferrero 69
TABLE 3ADOPTION OF IFRS FOR THE COUNTRIES IN THE SAMPLE (2002-2010)*
US 0United Kingdom 1Ireland 1Canada 1Australia 1Germany 1Netherlands 1Luxemburg 1Austria 1Denmark 1Norway 1Finland 1Sweden 1Switzerland 0France 1Italy 1Spain 1Portugal 1Greece 1Japan 1China 1Singapore 0Korea 1Hong-Kong 1
* IFRSit is a dummy variable that takes the value of 1 if the country of origin of the company has adopted IFRS, and 0 otherwise.
TABLE 4DESCRIPTIVE STATISTICS OF MODERATING FACTORS
Mean Std. Dev.
∆GDP 1.021187 2.644332
Frequencies
Absolute Relative (%)
US 7549 50.86CONTINENTAL 2052 17.6BRITISH 4682 31.54
earnings management practices, which implies that those companies that enjoy better Earnings Quality are associated with better and higher earnings releases. Thus, the authors find a positive link between EQ and subsequent profitability, also affecting the subsequent return on assets.
The second measure of FRQ used in this study is related to the level of ac-counting conservatism. For this, I created the C_Score and B_Score parameters

Estudios de Economía, Vol. 41 - Nº 170
TAB
LE
5B
IVA
RIA
TE
CO
RR
EL
AT
ION
S
MTO
BF
RQ
KO
TH
AR
IC
_Sco
reB
_Sco
reB
ALL
SHIV
AK
UA
MR
Cor
rupt
ion
IFR
SU
SC
ON
TIN
EN
TAL
BR
ITIS
H∆
GD
PSi
zeD
ebt
MTO
B1
FR
QK
OT
HA
RI
–0.0
021
C_S
core
0.18
380.
0018
1B
_Sco
re–0
.330
6–0
.001
7–0
.746
81
BA
LL
SHIV
AK
UM
AR
–0.0
037
0.47
650.
0023
–0.0
024
1C
orru
ptio
n0.
0141
–0.0
028
0.00
180.
0005
0.00
531
IFR
S–0
.020
7–0
.015
0.04
870.
0094
0.01
10.
0605
1U
S–0
.014
0.00
29–0
.045
50.
006
–0.0
222
–0.2
69–0
.447
21
CO
NT
INE
NTA
L0.
0141
–0.0
088
0.00
85–0
.007
–0.0
105
–0.0
472
0.14
91–0
.413
11
BR
ITIS
H0.
0096
–0.0
074
0.03
96–0
.000
9–0
.002
40.
3005
0.31
72–0
.681
6–0
.270
61
∆G
DP
0.02
72–0
.003
70.
15–0
.103
–0.0
002
0.18
70.
0968
–0.2
40.
0472
0.22
751
Size
–0.0
208
–0.0
007
–0.0
489
0.00
490.
0108
–0.1
576
–0.2
170.
3032
0.12
52–0
.433
2–0
.049
11
Deb
t0.
503
0.00
460.
3992
–0.4
77–0
.000
3–0
.005
60.
0033
–0.0
054
0.01
8–0
.007
7–0
.002
30.
0431
1R
isk
–0.0
017
0.00
310.
0032
–0.0
009
0.00
070.
0143
0.00
05–0
.019
20.
0471
–0.0
121
0.00
890.
0002
0.00
53W
orki
ng_c
apit
al–0
.002
10.
0009
–0.0
416
0.01
440.
007
–0.0
011
–0.0
758
0.05
61–0
.005
5–0
.098
8–0
.034
30.
1685
–0.0
148
Indu
stry
0.03
650.
0069
0.01
88–0
.011
30.
0033
–0.0
14–0
.062
80.
0091
–0.0
595
0.03
68–0
.014
–0.1
448
0.01
34R
&D
inte
nsit
y–0
.000
5–0
.000
10.
0052
0.00
040.
0013
0.00
70.
0118
–0.0
268
0.01
140.
0222
–0.0
035
–0.0
469
–0.0
015
Ris
kW
orki
ng_c
apita
lIn
dust
ryR
&D
inte
nsit
yR
isk
1W
orki
ng_c
apit
al–0
.000
11
Indu
stry
–0.0
024
–0.0
301
1R
&D
inte
nsit
y0.
0002
–0.0
057
0.03
111
FRQ
KO
THA
RI
repr
esen
ts a
n ea
rnin
gs m
anag
emen
t m
easu
re w
ith t
he K
otha
ri et
al.
(200
5) m
odel
; C
_SC
OR
E an
d B
_SC
OR
E ar
e m
easu
res
for
acco
untin
g co
nser
vatis
m p
ropo
sed
by K
han
and
Wat
ts (
2009
); B
ALL
SHIV
AK
UM
AR
is m
easu
red
for a
ccru
als q
ualit
y w
ith th
e B
all a
nd S
hiva
kum
ar (2
006)
mod
el; S
IZE
is th
e lo
garit
hm o
f tot
al a
sset
s; D
EBT
is th
e ra
tio o
f deb
t to
equi
ty; R
ISK
repr
esen
ts th
e ris
k fa
ced
mea
sure
d by
the
beta
; WO
RK
ING
_CA
PITA
L re
pres
ents
liqu
idity
, mea
sure
d as
the
diff
eren
ce b
etw
een
curr
ent a
sset
s an
d cu
rren
t lia
bilit
ies;
IND
UST
RY re
pres
ents
the
diff
eren
t act
ivity
sec
tors
; R&
DIN
TEN
SITY
repr
esen
ts
the
ratio
of R
&D
exp
endi
ture
to to
tal s
ales
. CO
RR
UPT
ION
is a
num
eric
al v
aria
ble
that
repr
esen
ts th
e le
vel o
f cor
rupt
ion
in e
ach
coun
try. I
FRS
is a
dum
my
varia
ble
that
take
s the
val
ue 1
if th
e co
untry
of t
he c
ompa
ny
has
adop
ted
the
IFR
S an
d 0
othe
rwis
e. U
S, C
ON
TIN
ENTA
L an
d B
RIT
ISH
are
dum
my
varia
bles
that
repr
esen
t the
acc
ount
ing
syst
em. ∆
GD
P is
a n
umer
ical
var
iabl
e th
at re
pres
ents
the
econ
omic
cyc
le m
easu
red
by
the
grow
th ra
te o
f Gro
ss D
omes
tic P
rodu
ct.
Consequences of financial reporting quality… / Jennifer Martínez-Ferrero 71
TAB
LE
6T
HE
EFF
EC
T O
F FR
Q O
N F
INA
NC
IAL
PE
RFO
RM
AN
CE
: MO
DE
L 1
Dep
ende
nt v
aria
ble:
MT
OB
Coe
f.St
d. E
rr.
Coe
f.St
d. E
rr.
Coe
f.St
d. E
rr.
Coe
f.St
d. E
rr.
FRQ
KO
TH
AR
I–0
.000
047*
*0.
0000
203
C_S
CO
RE
0.00
0100
1*1.
21E
-06
B_S
CO
RE
–0.0
0025
4*0.
0000
141
BA
LL
-SH
IVA
KU
MA
R–0
.001
4946
*0.
0004
257
SIZ
E0.
1710
696*
0.04
2693
70.
1888
574*
0.05
5414
80.
3798
275*
0.08
0347
50.
0934
188
0.07
8468
6D
EB
T0.
5832
017*
0.02
5415
30.
6932
984*
0.01
4492
30.
6393
879*
0.01
5225
20.
6270
001*
0.05
0154
8R
ISK
0.00
0494
10.
0007
067
0.00
2256
3*0.
0006
101
–0.0
0089
310.
0006
054
0.00
6964
9*0.
0008
597
WO
RK
ING
_CA
PITA
L0.
0001
135*
8.48
E-0
6–0
.000
0775
*4.
76E
-06
–0.0
0006
72*
4.80
E-0
60.
0001
146*
0.00
0011
2IN
DU
STR
Y17
.028
97*
3.58
2352
24.0
6869
*6.
2083
9722
.896
6*6.
6707
6320
.070
01**
8.29
1179
R&
DIN
TE
NSI
TY
–0.0
0584
67*
0.00
0515
7–0
.005
6203
*0.
0006
187
–0.0
0412
79*
0.00
0879
4–0
.007
2023
*0.
0008
937
Z
2488
.00
4951
4.65
3914
.88
1855
.08
m1
–2.5
0–1
.22
–1.2
0–2
.18
m2
–0.6
8–0
.40
–0.6
4–0
.61
Han
sen
305.
3636
0.31
329.
0325
7.28
# In
ord
er to
avo
id e
ndog
enei
ty p
robl
ems,
for
all
num
eric
al v
aria
bles
, inc
ludi
ng in
tera
ctio
n va
riab
les,
thei
r la
gs t-
1 to
t-2
are
used
as
inst
rum
ents
.N
otes
: i)
H
eter
oske
dast
icity
con
sist
ent a
sym
ptot
ic s
tand
ard
erro
r in
par
enth
eses
. ii)
*,
**
and
***
indi
cate
sig
nifi
canc
e at
the
1%, 5
% a
nd 1
0% le
vel,
resp
ectiv
ely.
iii
)
z is
a W
ald
test
of
the
join
t si
gnif
ican
ce o
f th
e re
port
ed c
oeff
icie
nts,
asy
mpt
otic
ally
dis
trib
uted
as
χ2 un
der
the
null
hypo
thes
is o
f no
rel
atio
nshi
p, d
egre
es o
f fr
eedo
m a
nd s
igni
fica
nce
in
pare
nthe
ses.
iv
)
mi (
m1
and
m2)
is a
ser
ial c
orre
latio
n te
st o
f or
der
i usi
ng r
esid
uals
in f
irst
dif
fere
nces
, asy
mpt
otic
ally
dis
trib
uted
as
N(0
,1)
unde
r th
e nu
ll hy
poth
esis
of
no s
eria
l cor
rela
tion.
v)
Han
sen
is a
test
of o
ver-
iden
tifyi
ng re
stri
ctio
ns, a
sym
ptot
ical
ly d
istr
ibut
ed a
s χ2
unde
r the
nul
l hyp
othe
sis
of n
on-c
orre
latio
n be
twee
n th
e in
stru
men
ts a
nd th
e er
ror t
erm
; deg
rees
of f
reed
om
and
sign
ific
ance
in p
aren
thes
es.
FRQ
KO
TH
AR
I re
pres
ents
an
earn
ings
man
agem
ent m
easu
re w
ith th
e K
otha
ri e
t al.
(200
5) m
odel
; C_S
CO
RE
and
B_S
CO
RE
are
mea
sure
s fo
r ac
coun
ting
cons
erva
tism
pro
pose
d by
Kha
n an
d W
atts
(200
9); B
AL
LSH
IVA
KU
MA
R is
mea
sure
d fo
r acc
rual
s qu
ality
with
the
Bal
l and
Shi
vaku
mar
(200
6) m
odel
; SIZ
E is
the
loga
rith
m o
f tot
al a
sset
s; D
EB
T is
the
ratio
of d
ebt t
o eq
uity
; RIS
K
repr
esen
ts th
e ri
sk f
aced
mea
sure
d by
the
beta
; WO
RK
ING
_CA
PITA
L r
epre
sent
s liq
uidi
ty, m
easu
red
as th
e di
ffer
ence
bet
wee
n cu
rren
t ass
ets
and
curr
ent l
iabi
litie
s; I
ND
UST
RY
rep
rese
nts
the
diff
eren
t act
ivity
sec
tors
; R&
DIN
TE
NSI
TY
rep
rese
nts
the
ratio
of
R&
D e
xpen
ditu
re to
tota
l sal
es.

Estudios de Economía, Vol. 41 - Nº 172
shown in the second and third models respectively. In the first model, the effect of C_Score on the dependent variable is positive (coef. –0.0001001) and signifi-cant at a 99% confidence level. This means that more conservative companies, in relation to the difference in the timelines of disclosing good and bad earnings news, enjoy a better FP. This shows a positive effect of the FRQ on corporate performance (hypothesis H1). However, if I consider the second measure of accounting conservatism (B_Score), these results are not in accordance with the previous models, showing a negative relationship. This variable shows a negative effect on the dependent variable (coef. –0.000254) and it is significant at 99% confidence level. It considers the earnings disclosure timelines with re-spect to bad news and it also includes the definition of C_Score (see equations 3 and 4). Therefore, it represents accounting conservatism in a broader way. In consequence, conservative companies, i.e. those which recognize bad economic news more promptly, tend to present a higher level of financial information quality and enjoy better market valuation. Our results are in accordance with previous evidence obtained by García-Lara et al. (2010), who obtained empiri-cal evidence of the positive association between accounting conservatism and future profitability. This accounting conservatism has become an incentive to managers to promote better performing projects to increase future performance because these economic or financial projects are more profitable. Meanwhile, Ahmed and Duellmand (2011) show that conservative companies enjoy great-erprofitability in the future because they allocate their financial and economic resources in more efficient projects.
Our empirical evidence coincides with the findings of authors such as García-Lara et al. (2010) and Ahmed and Duellmand (2011), who show the positive association between accounting conservatism and future profitability because of improvements in investment efficiency. As in Earnings Quality, accounting conservatism has become an incentive to managers to promote better performing projects that increase future performance because these economic or financial projects are more profitable.
The last measure of FRQ, associated with the level of accruals quality, is measured following the model proposed by Ball and Shivakumar (2006). The results show that the BALLSHIVAKUMAR variable has a negative effect on FP (coef. –0.0014946) at a 99% confidence level. This result is in accordance with our hypothesis H1 that supports a positive relationship, since a higher level of BALLSHIVAKUMAR represents a lower level of accruals quality and consequently, a lower level of FP. Thus, accruals quality impacts positively on FP, thereby companies which report poor quality financial information have better market to book ratio as a FP measure.
As the other alternative measures of FRQ, I expect that companies which report more credible, error-free and unbiased information enjoy a better corpo-rate performance, due to the fact that the market identifies these companies and positively assesses these ethical practices (Lu et al., 2012; Hope et al., 2012).
In conclusion, the results obtained support a positive relationship between the FRQ and Financial Performance level, as proposed in hypothesis H1. Therefore, companies characterized by their earnings quality, their accounting conservatism and their accruals quality are associated with higher levels of corporate perfor-mance measured by market to book ratio. The market perception for companies with better FRQ is higher than other companies. Our results support the previous
Consequences of financial reporting quality… / Jennifer Martínez-Ferrero 73
evidence of García-Lara et al. (2010), Ahmed and Duellmand (2011), Gunny (2005) and Gong et al. (2008) who obtained empirical evidence of the positive association between FRQ and corporate performance wherehigher corporate performance is a consequence of better quality financial reporting.
In regard to the control variables, the results are very similar in all the models. Firm size and leverage level positively affect corporate performance, and it is statistically significant at 99% confidence level. Therefore, larger and indebt companies enjoy higher FP. Meanwhile, R&DINTENSITY shows a negative effect on Financial Performance, so, companies with more R&D projects have lower FP, having to allocate more resources to this strategy.On the other hand, the effects and significance of RISK and WORKING_CAPITAL on FP vary in relation to the FRQ measure considered in the model. In the case of INDUSTRY, the general effect is significant and positive at 99% confidence level in all models. This means that companies from sectors such as information technology, telecom-munication services and utilities tend to have better FP. The change in the sign of some of them (e.g. working capital) is due to their relation to the measure of FRQ used, remembering that the different measures used in the research have a different effect on FRQ. That is, on one hand BALLSHIVAKUMAR and FRQKOTHARI (measures of EQ and AQ, respectively) negatively affect FRQ (i.e. lower levels of them improve FRQ). However, accounting conservatism positively affects FRQ. Financial statements reported more conservatively from an accounting point of view are associated with better FRQ. This variability of results concerning the control variables does not affect the robustness of the results obtained in the different models used for the different measures of FRQ.
4.3. Results of model dependence with moderating factors
With the aim of capturing robust results and considering the use of an in-ternational database and information divergence, four factors are incorporated as moderators of the FRQ-financial performance relation, as evidenced above.
Table 7 shows the moderating effect of corruption perception in the country of origin of the company, which allows us to observe the effect of national corruption on the quality of information and, consequently, corporate performance. In the same way as previously, four models of FRQ are considered. For the different measures of FRQ, the evidence obtained shows that for those companies that carry out their activities in institutional contexts characterised by a higher perception of corruption and report high quality financial statements, the positive effect of such quality on financial performance is reduced. This result holds for different measures. Individually, the effect of FRQKOTHARI (–0.0018766) shows the positive link between FRQ and financial performance. However, its interaction with CORRUPTION (0.002576) shows how the effect on financial performance is moderated and reduced (–0.00178766+0.002576= –0.0006994). Similarly, this occurs with BALLSHIVAKUMAR with a coefficient of –0.2652551, but its interaction with the level of corruption reduces the positive effect of FRQ on financial performance (–0.2652551+0.00335955=–0.231596). Finally, the two variables that measure accounting conservatism show the same evidence as previ-ously. They hold a positive coefficient that reflects the positive link between FRQ and financial performance (0.0009831 and 0.0038229, respectively), but these effects also are reduced in those countries with a strong corruption perception
Estudios de Economía, Vol. 41 - Nº 174
(0.0009831–0.0001102=–0.0008729 and 0.00038229–0.0005261=–0.0032968, respectively).
The evidence obtained and reflected in Table 7 shows the moderating role of the level of national corruption perception in the FRQ-financial performance relationship, allowing us to accept H2. Companies that report high quality fi-nancial statements in countries with a high corruption perception enjoy lower financial performance due to FRQ than those operating in environments per-ceived as less corrupt.
Table 8 shows the effect of FRQ on financial performance by considering the moderating effect of the adoption of IFRS. With regard to AQ, measured by the FRQKOTHARI variable, the evidence obtained shows the positive influence of AQ on the market to book value (coef.–7.69e-06) at the 99% confidence level. As discussed above, a higher value of this variable is associated with lower AQ and therefore lower FRQ. Stopping at the interaction between FRQ and IFRS (FRQ_IFRS), the result shows how the positive effect on financial performance increases for companies that are located in countries that have adopted IFRS as accounting standards and present higher FRQ (coef. – 7.693-06 –0.0001537 = –0.00016139). This effect remains similar if we consider the BALLSHIVAKUMAR variable as a measure of FRQ. Those companies that report proper financial statements to IFRS and have higher EQ enjoy higher financial performance (coef. BALLSHIVAKUMAR*IFRS: –0.0064992). If we consider the level of conservatism, both the B_Score and the C_Score are positive (0.0004542 and 0.0003067, respectively), which allows us to state that the higher the level of conservatism and FRQ, the better financial performance. This effect disappears for firms located in countries adopting IFRS, i.e. a higher level of conservatism in countries adopting IFRS is associated with lower financial performance. In short, this evidence makes it possible to partially accept H3, since the adoption of IFRS moderates the effect of FRQ on financial performance, although the effect varies depending on the extent of FRQ considered.
Table 9 shows the effect of FRQ on financial performance by considering the moderating effect of international accounting systems: American, Continental and British. The positive effect of FRQ on financial performance is maintained for the different proxies (AQ, conservatism and EQ). However, if I analyse in detail each of the alternative measures of FRQ, I find that in companies based on the British accounting system the effect of FRQ on the market to book value increases (coef. –0.000049 – 0.0011066 = –0.0011556), whereas in the case of those located in the US system, this effect is reduced (coef. –0.000049 – 0.0000447 = –0.0000043). This same evidence is found when considering EQ (BALLSHIVAKUMAR) as a measure of quality. However, the evidence varies if conservatism is used as the FRQ proxy, i.e. more conservative companies lo-cated in countries that adopt the continental and US systems enjoy better market valuations and greater financial performance than those located in countries that adopt the British accounting system. Again, the evidence permits us to accept H4, although the results vary depending on the measure of FRQ used.
Table 10 reflects the effect of FRQ on financial performance by consider-ing the moderating effect of the economic cycle. The result of the interaction between FRQ measures and GDP growth rate shows that the impact of FRQ on corporate performance is higher in expansion periods, i.e., positive GDP growth rates. On an individual basis, FRQKOTHARI maintains a negative

Consequences of financial reporting quality… / Jennifer Martínez-Ferrero 75
TAB
LE
7T
HE
EFF
EC
T O
F FR
Q O
N F
INA
NC
IAL
PE
RFO
RM
AN
CE
: MO
DE
L 2
(C
OR
RU
PTIO
N A
S M
OD
ER
AT
ING
FA
CT
OR
)
Dep
ende
nt v
aria
ble:
MT
OB
Coe
f.St
d. E
rr.
Coe
f.St
d. E
rr.
Coe
f.St
d. E
rr.
Coe
f.St
d. E
rr.
FRQ
KO
TH
AR
I–0
.001
8766
*0.
0000
407
C_S
CO
RE
0.00
0983
1*0.
0002
952
B_S
CO
RE
0.00
3822
9*0.
0004
234
BA
LL
-SH
IVA
KU
MA
R–0
.265
2551
*0.
0682
182
CO
RR
UP
TIO
N2.
6621
96*
0.04
9048
64.
0429
28*
0.16
4344
53.
0246
14*
0.14
3995
31.
8663
02*
0.19
356
FR
Q_C
OR
RU
PT
ION
0.00
0257
6*5.
80E
-06
–0.0
0011
02*
0.00
0037
4–0
.000
5261
*0.
0000
545
0.03
3595
5*0.
0086
36SI
ZE
0.19
1279
7*0.
0193
232
0.15
4021
3**
0.06
8141
50.
2347
6*0.
0600
161
0.16
6504
*0.
0593
457
DE
BT
0.56
2405
7*0.
0086
570.
7214
311*
0.02
0257
60.
6859
298*
0.01
9768
80.
5112
359*
0.04
1299
7R
ISK
–0.0
0708
75*
0.00
0472
3–0
.006
7399
*0.
0006
775
–0.0
0950
25*
0.00
0681
7–0
.000
646
0.00
0677
2W
OR
KIN
G_C
API
TAL
0.00
0063
6*5.
20E
-06
–0.0
0008
2*9.
67E
-06
–0.0
0007
8*8.
25E
-06
0.00
0089
*9.
19E
-06
IND
UST
RY
4.87
1462
*0.
1386
241
3.83
847
3.10
1343
5.62
6633
5.03
4048
11.2
3946
**5.
0704
21R
&D
INT
EN
SIT
Y–0
.006
1969
*0.
0002
197
–0.0
0638
96*
0.00
0758
7–0
.002
2673
*0.
0006
657
–0.0
0851
63*
0.00
0697
1Z
22
5173
.22
6598
.99
5126
.42
2342
.42
m1
–2.5
2–1
.23
–1.2
1–2
.16
m2
0.70
–0.2
7–0
.41
–0.6
9H
anse
n56
5.28
489.
2237
0.71
224.
64
# In
ord
er to
avo
id e
ndog
enei
ty p
robl
ems,
for
all
num
eric
al v
aria
bles
, inc
ludi
ng in
tera
ctio
n va
riab
les,
thei
r la
gs t-
1 to
t-2
are
used
as
inst
rum
ents
.N
otes
: i)
H
eter
oske
dast
icity
con
sist
ent a
sym
ptot
ic s
tand
ard
erro
r in
par
enth
eses
. ii)
*,
**
and
***
indi
cate
sig
nifi
canc
e at
the
1%, 5
% a
nd 1
0% le
vel,
resp
ectiv
ely.
iii
)
z is
a W
ald
test
of
the
join
t si
gnif
ican
ce o
f th
e re
port
ed c
oeff
icie
nts,
asy
mpt
otic
ally
dis
trib
uted
as
χ2 un
der
the
null
hypo
thes
is o
f no
rel
atio
nshi
p, d
egre
es o
f fr
eedo
m a
nd s
igni
fica
nce
in
pare
nthe
ses.
iv
) m
i (m
1 an
d m
2) is
a s
eria
l cor
rela
tion
test
of
orde
r i u
sing
res
idua
ls in
fir
st d
iffe
renc
es, a
sym
ptot
ical
ly d
istr
ibut
ed a
s N
(0,1
) un
der
the
null
hypo
thes
is o
f no
ser
ial c
orre
latio
n.v)
H
anse
n is
a te
st o
f ove
r-id
entif
ying
rest
rict
ions
, asy
mpt
otic
ally
dis
trib
uted
as
χ2 un
der t
he n
ull h
ypot
hesi
s of
non
-cor
rela
tion
betw
een
the
inst
rum
ents
and
the
erro
r ter
m; d
egre
es o
f fre
edom
an
d si
gnif
ican
ce in
par
enth
eses
.FR
QK
OT
HA
RI
repr
esen
ts a
n ea
rnin
gs m
anag
emen
t mea
sure
with
the
Kot
hari
et a
l. (2
005)
mod
el; C
_SC
OR
E a
nd B
_SC
OR
E a
re m
easu
res
for
acco
untin
g co
nser
vatis
m p
ropo
sed
by K
han
and
Wat
ts (2
009)
; BA
LL
SHIV
AK
UM
AR
is m
easu
red
for a
ccru
als
qual
ity w
ith th
e B
all a
nd S
hiva
kum
ar (2
006)
mod
el; S
IZE
is th
e lo
gari
thm
of t
otal
ass
ets;
DE
BT
is th
e ra
tio o
f deb
t to
equi
ty; R
ISK
re
pres
ents
the
risk
fac
ed m
easu
red
by th
e be
ta; W
OR
KIN
G_C
API
TAL
rep
rese
nts
liqui
dity
, mea
sure
d as
the
diff
eren
ce b
etw
een
curr
ent a
sset
s an
d cu
rren
t lia
bilit
ies;
IN
DU
STR
Y r
epre
sent
s th
e di
ffer
ent a
ctiv
ity s
ecto
rs; R
&D
INT
EN
SIT
Y r
epre
sent
s th
e ra
tio o
f R
&D
exp
endi
ture
to to
tal s
ales
. CO
RR
UPT
ION
is a
num
eric
al v
aria
ble
that
rep
rese
nts
the
leve
l of
corr
uptio
n in
eac
h co
untr
y.

Estudios de Economía, Vol. 41 - Nº 176
TAB
LE
8T
HE
EFF
EC
T O
F FR
Q O
N F
INA
NC
IAL
PE
RFO
RM
AN
CE
: MO
DE
L 3
(IF
RS
AS
MO
DE
RA
TIN
G F
AC
TO
R)
Dep
ende
nt v
aria
ble:
MT
OB
Coe
f.St
d. E
rr.
Coe
f.St
d. E
rr.
Coe
f.St
d. E
rr.
Coe
f.St
d. E
rr.
FRQ
KO
TH
AR
I–7
.69E
-06*
2.29
E-0
6C
_SC
OR
E0.
0004
542*
0.00
0070
8B
_SC
OR
E0.
0003
067*
0.00
0083
9B
AL
L-S
HIV
AK
UM
AR
–0.0
0646
69*
0.00
2154
6IF
RS
0.10
6213
211
.572
07–1
.316
495
2.05
4954
0.18
9252
522
.965
67–1
.273
345
11.3
0202
FR
Q_I
FR
S–0
.000
1537
*4.
75E
–06
–0.0
0065
35*
0.00
0072
4–0
.000
6134
*0.
0000
852
–0.0
0649
92*
0.00
2411
2SI
ZE
0.07
0917
2*0.
0153
767
0.15
8654
1**
0.07
3201
70.
2504
357*
0.07
1048
50.
1391
789*
*0.
0663
151
DE
BT
0.58
1762
7*0.
0097
805
0.73
3853
9*0.
0122
151
0.64
5051
9*0.
0143
903
0.59
0245
5*0.
0410
322
RIS
K–0
.004
4872
*0.
0004
307
–0.0
0417
66*
0.00
0801
6–0
.003
5022
*0.
0005
625
–0.0
0409
19*
0.00
0626
2W
OR
KIN
G_C
API
TAL
0.00
0072
8*5.
07E
-06
–0.0
0012
04*
5.86
E-0
6–0
.000
0884
*5.
39E
-06
0.00
0113
*9.
59E
-06
IND
UST
RY
4.41
8393
*0.
1709
482
12.9
0785
*3.
2005
531
.396
69*
3.64
6916
5.59
9057
3.70
719
R&
DIN
TE
NSI
TY
–0.0
0691
66*
0.00
0201
8–0
.006
121*
0.00
0791
8–0
.005
2773
*0.
0007
791
–0.0
0943
*0.
0007
671
Z
2684
07.5
766
70.7
745
39.0
634
48.7
1m
1–2
.50
–1.2
4–1
.20
–2.1
8m
2–0
.74
–0.4
–0.3
5–0
.68
Han
sen
558.
7039
1.03
423.
8431
3.68
# In
ord
er to
avo
id e
ndog
enei
ty p
robl
ems,
for
all
num
eric
al v
aria
bles
, inc
ludi
ng in
tera
ctio
n va
riab
les,
thei
r la
gs t-
1 to
t-2
are
used
as
inst
rum
ents
.N
otes
: i)
H
eter
oske
dast
icity
con
sist
ent a
sym
ptot
ic s
tand
ard
erro
r in
par
enth
eses
. ii)
*,
**
and
***
indi
cate
sig
nifi
canc
e at
the
1%, 5
% a
nd 1
0% le
vel,
resp
ectiv
ely.
iii
)
z is
a W
ald
test
of
the
join
t si
gnif
ican
ce o
f th
e re
port
ed c
oeff
icie
nts,
asy
mpt
otic
ally
dis
trib
uted
as
χ2 un
der
the
null
hypo
thes
is o
f no
rel
atio
nshi
p, d
egre
es o
f fr
eedo
m a
nd s
igni
fica
nce
in
pare
nthe
ses.
iv
)
mi (
m1
and
m2)
is a
ser
ial c
orre
latio
n te
st o
f or
der
i usi
ng r
esid
uals
in f
irst
dif
fere
nces
, asy
mpt
otic
ally
dis
trib
uted
as
N(0
,1)
unde
r th
e nu
ll hy
poth
esis
of
no s
eria
l cor
rela
tion.
v)
Han
sen
is a
test
of o
ver-
iden
tifyi
ng re
stri
ctio
ns, a
sym
ptot
ical
ly d
istr
ibut
ed a
s χ2
unde
r the
nul
l hyp
othe
sis
of n
on-c
orre
latio
n be
twee
n th
e in
stru
men
ts a
nd th
e er
ror t
erm
; deg
rees
of f
reed
om
and
sign
ific
ance
in p
aren
thes
es.
FRQ
KO
TH
AR
I re
pres
ents
an
earn
ings
man
agem
ent m
easu
re w
ith th
e K
otha
ri e
t al.
(200
5) m
odel
; C_S
CO
RE
and
B_S
CO
RE
are
mea
sure
s fo
r ac
coun
ting
cons
erva
tism
pro
pose
d by
Kha
n an
d W
atts
(200
9); B
AL
LSH
IVA
KU
MA
R is
mea
sure
d fo
r acc
rual
s qu
ality
with
the
Bal
l and
Shi
vaku
mar
(200
6) m
odel
; SIZ
E is
the
loga
rith
m o
f tot
al a
sset
s; D
EB
T is
the
ratio
of d
ebt t
o eq
uity
; RIS
K
repr
esen
ts th
e ri
sk f
aced
mea
sure
d by
the
beta
; WO
RK
ING
_CA
PITA
L r
epre
sent
s liq
uidi
ty, m
easu
red
as th
e di
ffer
ence
bet
wee
n cu
rren
t ass
ets
and
curr
ent l
iabi
litie
s; I
ND
UST
RY
rep
rese
nts
the
diff
eren
t act
ivity
sec
tors
; R&
DIN
TE
NSI
TY
rep
rese
nts
the
ratio
of
R&
D e
xpen
ditu
re to
tota
l sal
es. I
FRS
is a
dum
my
vari
able
that
take
s th
e va
lue
1 if
the
coun
try
of th
e co
mpa
ny h
as a
dopt
ed
the
IFR
S an
d 0
othe
rwis
e.
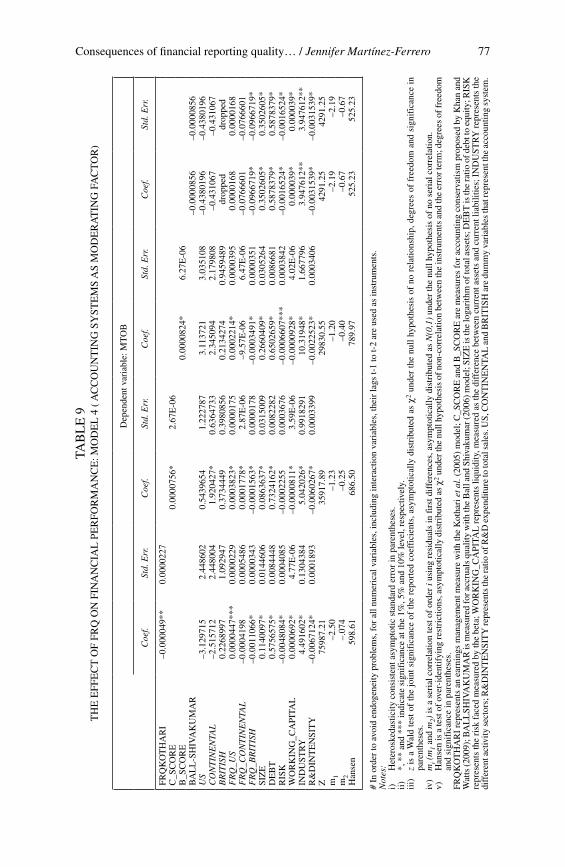
Consequences of financial reporting quality… / Jennifer Martínez-Ferrero 77
TAB
LE
9T
HE
EFF
EC
T O
F FR
Q O
N F
INA
NC
IAL
PE
RFO
RM
AN
CE
: MO
DE
L 4
( A
CC
OU
NT
ING
SY
STE
MS
AS
MO
DE
RA
TIN
G F
AC
TO
R)
Dep
ende
nt v
aria
ble:
MT
OB
Coe
f.St
d. E
rr.
Coe
f.St
d. E
rr.
Coe
f.St
d. E
rr.
Coe
f.St
d. E
rr.
FRQ
KO
TH
AR
I–0
.000
049*
*0.
0000
227
C_S
CO
RE
0.00
0075
6*2.
67E
-06
B_S
CO
RE
0.00
0082
4*6.
27E
-06
BA
LL
-SH
IVA
KU
MA
R–0
.000
0856
–0.0
0008
56U
S–3
.129
715
2.44
8602
0.54
3965
41.
2227
873.
1137
213.
0351
08–0
.438
0196
–0.4
3801
96C
ON
TIN
EN
TAL
–2.5
1571
22.
4480
041.
9204
27*
0.63
6473
32.
3450
942.
1798
08–0
.431
067
–0.4
3106
7B
RIT
ISH
0.22
6899
71.
0929
470.
3734
449
0.39
8085
60.
2134
274
0.94
5948
9dr
oppe
ddr
oppe
dF
RQ
_US
0.00
0044
7***
0.00
0022
90.
0003
823*
0.00
0017
50.
0002
214*
0.00
0039
50.
0000
168
0.00
0016
8F
RQ
_CO
NT
INE
NTA
L–0
.000
4198
0.00
0548
60.
0001
778*
2.87
E-0
6–9
.57E
-06
6.47
E-0
6–0
.076
6601
–0.0
7666
01F
RQ
_BR
ITIS
H–0
.001
1066
*0.
0000
343
–0.0
0015
63*
0.00
0017
8–0
.000
3491
*0.
0000
351
–0.0
9667
19*
–0.0
9667
19*
SIZ
E0.
1140
097*
0.01
4460
60.
0863
637*
0.03
1500
90.
2660
409*
0.03
0526
40.
3502
605*
0.35
0260
5*D
EB
T0.
5756
575*
0.00
8444
80.
7324
162*
0.00
8228
20.
6502
659*
0.00
8668
10.
5878
379*
0.58
7837
9*R
ISK
–0.0
0480
84*
0.00
0408
5–0
.000
2255
0.00
0367
6–0
.000
6607
***
0.00
0384
2–0
.001
6524
*–0
.001
6524
*W
OR
KIN
G_C
API
TAL
0.00
0069
2*4.
77E
-06
–0.0
0008
11*
3.59
E-0
6–0
.000
0928
*4.
02E
-06
0.00
0039
*0.
0000
39*
IND
UST
RY
4.49
1602
*0.
1304
384
5.04
2026
*0.
9918
291
10.3
1948
*1.
6677
963.
9476
12**
3.94
7612
**R
&D
INT
EN
SIT
Y–0
.006
7124
*0.
0001
893
–0.0
0602
67*
0.00
0339
9–0
.002
2523
*0.
0003
406
–0.0
0315
39*
–0.0
0315
39*
Z
7598
7.21
3591
7.89
2983
0.55
4291
.25
4291
.25
m1
–2.5
0–1
.23
–1.2
0–2
.19
–2.1
9m
2–.
074
–0.2
5–0
.40
–0.6
7–0
.67
Han
sen
598.
6168
6.50
789.
9752
5.23
525.
23
# In
ord
er to
avo
id e
ndog
enei
ty p
robl
ems,
for
all
num
eric
al v
aria
bles
, inc
ludi
ng in
tera
ctio
n va
riab
les,
thei
r la
gs t-
1 to
t-2
are
used
as
inst
rum
ents
.N
otes
: i)
H
eter
oske
dast
icity
con
sist
ent a
sym
ptot
ic s
tand
ard
erro
r in
par
enth
eses
. ii)
*,
**
and
***
indi
cate
sig
nifi
canc
e at
the
1%, 5
% a
nd 1
0% le
vel,
resp
ectiv
ely.
iii
)
z is
a W
ald
test
of
the
join
t si
gnif
ican
ce o
f th
e re
port
ed c
oeff
icie
nts,
asy
mpt
otic
ally
dis
trib
uted
as
χ2 un
der
the
null
hypo
thes
is o
f no
rel
atio
nshi
p, d
egre
es o
f fr
eedo
m a
nd s
igni
fica
nce
in
pare
nthe
ses.
iv
)
mi (
m1
and
m2)
is a
ser
ial c
orre
latio
n te
st o
f or
der
i usi
ng r
esid
uals
in f
irst
dif
fere
nces
, asy
mpt
otic
ally
dis
trib
uted
as
N(0
,1)
unde
r th
e nu
ll hy
poth
esis
of
no s
eria
l cor
rela
tion.
v)
Han
sen
is a
test
of o
ver-
iden
tifyi
ng re
stri
ctio
ns, a
sym
ptot
ical
ly d
istr
ibut
ed a
s χ2
unde
r the
nul
l hyp
othe
sis
of n
on-c
orre
latio
n be
twee
n th
e in
stru
men
ts a
nd th
e er
ror t
erm
; deg
rees
of f
reed
om
and
sign
ific
ance
in p
aren
thes
es.
FRQ
KO
TH
AR
I re
pres
ents
an
earn
ings
man
agem
ent m
easu
re w
ith th
e K
otha
ri e
t al.
(200
5) m
odel
; C_S
CO
RE
and
B_S
CO
RE
are
mea
sure
s fo
r ac
coun
ting
cons
erva
tism
pro
pose
d by
Kha
n an
d W
atts
(200
9); B
AL
LSH
IVA
KU
MA
R is
mea
sure
d fo
r acc
rual
s qu
ality
with
the
Bal
l and
Shi
vaku
mar
(200
6) m
odel
; SIZ
E is
the
loga
rith
m o
f tot
al a
sset
s; D
EB
T is
the
ratio
of d
ebt t
o eq
uity
; RIS
K
repr
esen
ts th
e ri
sk f
aced
mea
sure
d by
the
beta
; WO
RK
ING
_CA
PITA
L r
epre
sent
s liq
uidi
ty, m
easu
red
as th
e di
ffer
ence
bet
wee
n cu
rren
t ass
ets
and
curr
ent l
iabi
litie
s; I
ND
UST
RY
rep
rese
nts
the
diff
eren
t act
ivity
sec
tors
; R&
DIN
TE
NSI
TY
repr
esen
ts th
e ra
tio o
f R&
D e
xpen
ditu
re to
tota
l sal
es. U
S, C
ON
TIN
EN
TAL
and
BR
ITIS
H a
re d
umm
y va
riab
les
that
repr
esen
t the
acc
ount
ing
syst
em.

Estudios de Economía, Vol. 41 - Nº 178
TAB
LE
10
TH
E E
FFE
CT
OF
FRQ
ON
FIN
AN
CIA
L P
ER
FOR
MA
NC
E: M
OD
EL
5 (
EC
ON
OM
IC C
YC
LE
AS
MO
DE
RA
TIN
G F
AC
TO
R)
Dep
ende
nt v
aria
ble:
MT
OB
Coe
f.St
d. E
rr.
Coe
f.St
d. E
rr.
Coe
f.St
d. E
rr.
Coe
f.St
d. E
rr.
FRQ
KO
TH
AR
I–0
.000
0999
*0.
0000
123
C_S
CO
RE
0.00
0061
3*3.
82E
-06
B_S
CO
RE
0.00
0269
1*0.
0000
145
BA
LL
-SH
IVA
KU
MA
R–0
.070
4641
*0.
0061
661
∆G
DP
0.13
6634
7*0.
0018
286
0.10
3308
4*0.
0057
424
0.06
9858
8*0.
0094
220.
1487
814*
0.00
9684
8F
RQ
_∆G
DP
–0.0
0003
94*
7.78
E-0
67.
21E
-06*
1.67
E-0
60.
0001
546*
8.24
E-0
6–0
.053
17*
0.00
3976
4SI
ZE
0.01
0112
70.
0200
149
0.00
8783
10.
0320
124
0.13
1335
8*0.
0340
723
0.21
0908
8*0.
0351
411
DE
BT
0.60
3517
*0.
0090
953
0.69
8943
6*0.
0084
413
0.64
7917
3*0.
0088
315
0.57
9654
4*0.
0265
886
RIS
K–0
.004
3813
*0.
0004
713
–0.0
0080
36**
0.00
0386
6–0
.002
2837
*0.
0004
669
–0.0
0206
74*
0.00
0477
5W
OR
KIN
G_C
API
TAL
0.00
0070
8*4.
55E
-06
–0.0
001*
3.96
E-0
6–0
.000
1114
*4.
56E
-06
0.00
0076
3*5.
97E
-06
IND
UST
RY
8.36
685*
0.67
6741
45.
2929
1*1.
4832
712
.278
13*
2.23
3784
2.19
2879
1.68
8786
R&
DIN
TE
NSI
TY
–0.0
0598
32*
0.00
0248
7–0
.006
8971
*0.
0003
433
–0.0
0653
94*
0.00
0370
3–0
.002
6194
*0.
0003
991
Z
2415
21.9
456
532.
1416
271.
5323
05.6
0m
1–2
.51
–1.2
2–1
.20
–2.2
1m
2–0
.65
–0.4
7–0
.28
–0.6
7H
anse
n56
6.95
601.
1957
4.25
365.
44
# In
ord
er to
avo
id e
ndog
enei
ty p
robl
ems,
for
all
num
eric
al v
aria
bles
, inc
ludi
ng in
tera
ctio
n va
riab
les,
thei
r la
gs t-
1 to
t-2
are
used
as
inst
rum
ents
.N
otes
: i)
H
eter
oske
dast
icity
con
sist
ent a
sym
ptot
ic s
tand
ard
erro
r in
par
enth
eses
. ii)
*,
**
and
***
indi
cate
sig
nifi
canc
e at
the
1%, 5
% a
nd 1
0% le
vel,
resp
ectiv
ely.
iii
)
z is
a W
ald
test
of
the
join
t si
gnif
ican
ce o
f th
e re
port
ed c
oeff
icie
nts,
asy
mpt
otic
ally
dis
trib
uted
as
χ2 un
der
the
null
hypo
thes
is o
f no
rel
atio
nshi
p, d
egre
es o
f fr
eedo
m a
nd s
igni
fica
nce
in
pare
nthe
ses.
iv
)
mi (
m1
and
m2)
is a
ser
ial c
orre
latio
n te
st o
f or
der
i usi
ng r
esid
uals
in f
irst
dif
fere
nces
, asy
mpt
otic
ally
dis
trib
uted
as
N(0
,1)
unde
r th
e nu
ll hy
poth
esis
of
no s
eria
l cor
rela
tion.
v)
Han
sen
is a
test
of o
ver-
iden
tifyi
ng re
stri
ctio
ns, a
sym
ptot
ical
ly d
istr
ibut
ed a
s χ2
unde
r the
nul
l hyp
othe
sis
of n
on-c
orre
latio
n be
twee
n th
e in
stru
men
ts a
nd th
e er
ror t
erm
; deg
rees
of f
reed
om
and
sign
ific
ance
in p
aren
thes
es.
FRQ
KO
TH
AR
I re
pres
ents
an
earn
ings
man
agem
ent m
easu
re w
ith th
e K
otha
ri e
t al.
(200
5) m
odel
; C_S
CO
RE
and
B_S
CO
RE
are
mea
sure
s fo
r ac
coun
ting
cons
erva
tism
pro
pose
d by
Kha
n an
d W
atts
(200
9); B
AL
LSH
IVA
KU
MA
R is
mea
sure
d fo
r acc
rual
s qu
ality
with
the
Bal
l and
Shi
vaku
mar
(200
6) m
odel
; SIZ
E is
the
loga
rith
m o
f tot
al a
sset
s; D
EB
T is
the
ratio
of d
ebt t
o eq
uity
; RIS
K
repr
esen
ts th
e ri
sk f
aced
mea
sure
d by
the
beta
; WO
RK
ING
_CA
PITA
L r
epre
sent
s liq
uidi
ty, m
easu
red
as th
e di
ffer
ence
bet
wee
n cu
rren
t ass
ets
and
curr
ent l
iabi
litie
s; I
ND
UST
RY
rep
rese
nts
the
diff
eren
t ac
tivity
sec
tors
; R
&D
INT
EN
SIT
Y r
epre
sent
s th
e ra
tio o
f R
&D
exp
endi
ture
to
tota
l sa
les.
∆G
DP
is a
num
eric
al v
aria
ble
that
rep
rese
nts
the
econ
omic
cyc
le m
easu
red
by t
he g
row
th
rate
of
Gro
ss D
omes
tic P
rodu
ct..
Consequences of financial reporting quality… / Jennifer Martínez-Ferrero 79
impact (coef. –0.0000999) on the market to book ratio in this model as pre-viously (higher FRQ leads to greater financial performance). Furthermore, from the interaction between this measure and the variable ∆GDP, we see that the economic cycle positively moderates the FRQ-financial performance relationship (–0.0000999–0.0000394 = –0.00013939). The same result is observed by using BALLSHIVAKUMAR, with a negative impact on finan-cial performance (coef. –0.0704641) and an even more negative interaction (–0.0704641–0.05317 = –0.1236341), allowing us to claim that companies that report financial statements with greater AQ in periods of economic expansion enjoy better market valuations and consequently better financial performance compared with in periods of economic recession (negative GDP growth rates). In the same way, we see that the positive effect of accounting conservatism on financial performance (coef. 0.0000613 and 0.0002691, respectively) is increased during periods of positive GDP growth (coef. 0.0000613 +7.21 e-09 = 0.0000613072 and 0.0002691 +0.0001546 = 0.00034237, respectively). Based on these arguments, the results provide the evidence needed to accept H5. Therefore, times of recession mean that the positive effect on corporate performance of FRQ is reduced by the economic and financial difficulties being experienced by the markets.
In summary, regarding the moderating factors analysed in this study, the positive effect of FRQ on financial performance is increased in countries with a lower corruption perception, in those countries that have adopted IFRS, in those belonging to a continental and British accounting system (as a rule) and in periods of economic expansion with positive GDP growth rates.
4.4. Results of an aggregated measure of FRQ
With the goal in mind to achieve robust results of the FRQ measures employed (EQ, accounting conservatism and AQ), I create an aggregate mea-sure of FRQ. This variable is the sum of four dummy variables; therefore, it takes values between 0 (no quality of information) and 4 (strong level of quality). To do this, I create four dummies, DEQ, DC_Score, DB_Score and DAQ, depending on the variables FRQKOTHARI, C_Score, B_Score and BALLSHIVAKUMAR.
The results for the dependency model that incorporates and analyses the effect of an aggregated measure of FRQ on financial performance, specifically on the market to book ratio, are shown in Table 11. Clearly, they show the positive effect on financial performance as consequence of AFRQ, which is statisti-cally significant at the 99% confidence level with a coefficient of 0.0844362. Therefore, higher levels of AFRQ (especially those who are at the right index limit) lead to better financial performance.
This result allows us to see that the evidence previously obtained (for the different FRQ proxies) is robust for this aggregated measure, which contains three aspects considered in the literature (EQ, accounting conservatism and AQ). Therefore, companies that report more quality information on all three counts enjoy better valuation and perception from investors and society at large, allowing them to improve financial performance.
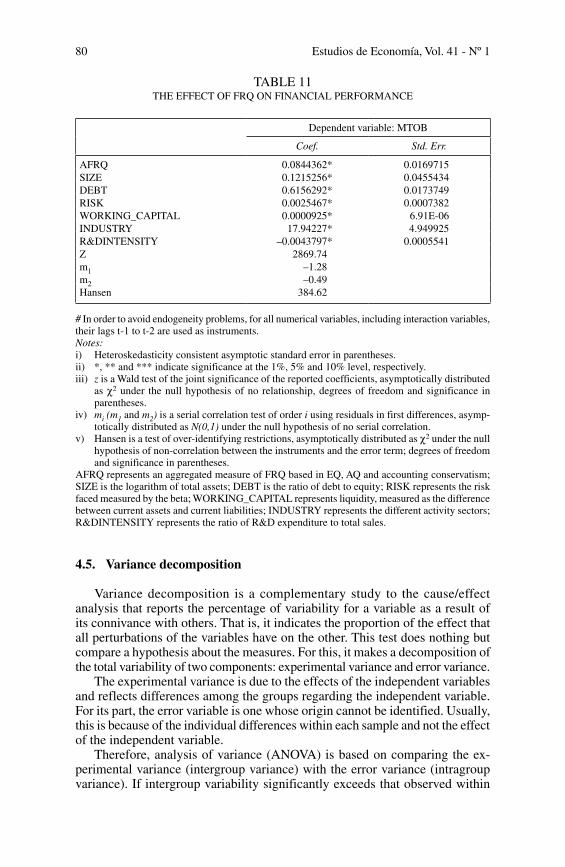
Estudios de Economía, Vol. 41 - Nº 180
TABLE 11THE EFFECT OF FRQ ON FINANCIAL PERFORMANCE
Dependent variable: MTOB
Coef. Std. Err.
AFRQ 0.0844362* 0.0169715SIZE 0.1215256* 0.0455434DEBT 0.6156292* 0.0173749RISK 0.0025467* 0.0007382WORKING_CAPITAL 0.0000925* 6.91E-06INDUSTRY 17.94227* 4.949925R&DINTENSITY –0.0043797* 0.0005541Z 2869.74m1 –1.28m2 –0.49Hansen 384.62
# In order to avoid endogeneity problems, for all numerical variables, including interaction variables, their lags t-1 to t-2 are used as instruments.Notes: i) Heteroskedasticity consistent asymptotic standard error in parentheses. ii) *, ** and *** indicate significance at the 1%, 5% and 10% level, respectively. iii) z is a Wald test of the joint significance of the reported coefficients, asymptotically distributed
as χ2 under the null hypothesis of no relationship, degrees of freedom and significance in parentheses.
iv) mi (m1 and m2) is a serial correlation test of order i using residuals in first differences, asymp-totically distributed as N(0,1) under the null hypothesis of no serial correlation.
v) Hansen is a test of over-identifying restrictions, asymptotically distributed as χ2 under the null hypothesis of non-correlation between the instruments and the error term; degrees of freedom and significance in parentheses.
AFRQ represents an aggregated measure of FRQ based in EQ, AQ and accounting conservatism; SIZE is the logarithm of total assets; DEBT is the ratio of debt to equity; RISK represents the risk faced measured by the beta; WORKING_CAPITAL represents liquidity, measured as the difference between current assets and current liabilities; INDUSTRY represents the different activity sectors; R&DINTENSITY represents the ratio of R&D expenditure to total sales.
4.5. Variance decomposition
Variance decomposition is a complementary study to the cause/effect analysis that reports the percentage of variability for a variable as a result of its connivance with others. That is, it indicates the proportion of the effect that all perturbations of the variables have on the other. This test does nothing but compare a hypothesis about the measures. For this, it makes a decomposition of the total variability of two components: experimental variance and error variance.
The experimental variance is due to the effects of the independent variables and reflects differences among the groups regarding the independent variable. For its part, the error variable is one whose origin cannot be identified. Usually, this is because of the individual differences within each sample and not the effect of the independent variable.
Therefore, analysis of variance (ANOVA) is based on comparing the ex-perimental variance (intergroup variance) with the error variance (intragroup variance). If intergroup variability significantly exceeds that observed within

Consequences of financial reporting quality… / Jennifer Martínez-Ferrero 81
groups, it is found that the effects of the independent variable are significant and, therefore, that there are significant differences between them.
To carry out the comparison of inter- and intragroup variance, the ANOVA technique was used in SPSS software (Table 12). This program or any other statistical program performs a decomposition of the total variability in the variability explained by the regression and the residual or unexplained by the regression. The ANOVA technique, which contrasts the significance of the set model, thus takes into account the variability explained by the regression regard-ing unexplained (whose distribution is a model F-Snedecor).
H0: βi = 0 ∀iH1: some βi ≠ 0
The p-values associated with each contrast of nullity indicate that the only significant variables are R&D intensity, Risk, Industry, FRQKOTHARI, C_Score and B_SCore with a significance of 0.000. For the other coefficients, I cannot reject the null hypothesis at this level of significance. It therefore seems that these variables do not explain the dependent variable (market to book ratio).
TABLE 12ANOVA FOR A FACTOR (MTOB)
Sum of squares Df RMS F Sig.
SIZE Intergroup 48,751.016 13,574 3.591 .493 1.000Intragrupo 6,862.547 942 7.285Total 55,613.562 14,516
LEVERAGE Intergroup 2,169,930.808 13,574 159.859 .001 1.000Intragrupo 174,081,498.426 942 184,799.892Total 176,251,429.233 14,516
WORKING_CAPITAL
Intergroup 95,561,135,019.065 13,574 7,040,012.894 .276 1.000Intragrupo 24,064,284,543.983 942 25,545,949.622Total 119,625,419,563.048 14,516
R&DINTENSITY Intergroup 348,806.408 13,403 26.025 888.135 .000Intragrupo 25.083 856 .029Total 348,831.491 14,259
RISK Intergroup 933,246.264 13,114 71.164 1.399 .000Intragrupo 46,912.226 922 50.881Total 980,158.490 14,036
INDUSTRY Intergroup 39,949.157 13,574 2.943 1.436 .000Intragrupo 1,931.195 942 2.050Total 41,880.352 14,516
FRQKOTHARI Intergroup 26,878,911,416.425 12,147 2,212,802.455 8.517 .000Intragrupo 116,655,399.464 449 259,811.580Total 26,995,566,815.890 12,596
BALLSHIVAKUMAR Intergroup 19,878,656.288 10,281 1,933.533 .269 1.000Intragrupo 2,734,221.730 380 7,195.320Total 22,612,878.018 10,661
C_Score Intergroup 1,689,495,125,550.275 12,714 132,884,625.260 124.414 .000Intragrupo 208,277,108.746 195 1,068,087.737Total 1,689,703,402,659.021 12,909
B_Score Intergroup 1,417,196,597,798.322 12,714 111,467,405.836 616.741 .000Intragrupo 35,243,565.921 195 180,736.235Total 1,417,231,841,364.243 12,909
Estudios de Economía, Vol. 41 - Nº 182
5. Concluding Remarks
Numerous advantages of providing high-quality information have been cited: FRQ reduces information risk and liquidity (Lambert et al., 2007), prevents managers from using discretionary powers for their own benefit and helps them make efficient investment decisions (Chen et al., 2010). Lambert et al. (2007) obtained empirical evidence that the quality of accounting information can influence the cost of capital, both directly, by affecting market participants’ perceptions about the distribution of future cash flows, and indirectly, by affecting real decisions that alter the distribution of future cash flows. Chen et al. (2010) found that FRQ positively affects the investment efficiency of private firms in emerging markets and this effect enhances bank financing and decreases incentives to minimise earnings for tax avoidance purposes.
Financial information issued by a company has become an essential resource for any participant in the market, because it permits a reduced amount of infor-mation asymmetries between managers, investors, regulatory agencies, society and other stakeholders. Therefore, one of the main questions that arises about the quality of financial reporting is its effect on the subsequent performance of a company, i.e. how this higher perceived quality is valued by the market.
This paper examines the consequences of Financial Reporting Quality (FRQ) on Corporate Performance, using three proxies of FRQ: (i) earnings quality; (ii) accounting conservatism; and (iii) accruals quality. Our first purpose is to analyze the effect of good FRQ on financial performance (FP) measured by the market to book ratio. Owing to the use of an international sample, with the subsequent divergence of information and accounting aspects as well as institutional and cultural differences among countries, I analyse the proposed relationship based on a variety of moderating factors: the percep-tion of corruption in the country of origin of the company, the adoption or not of the standards established by IFRS, the accounting system in which the company carries out its activity and the variability of results depending on the economic cycle
To that end, the hypotheses proposed are tested on an unbalanced sample of 1, 960 international non-financial listed companies from 25 countries and an Administrative Region in the period 2002-2010. The use of simultaneous equations for panel data, via the GMM estimator proposed by Arellano and Bond (1991), highlights the positive effect of FRQ on Financial Performance. The results show that companies which report financial statements with better quality information (associated to better earnings quality, accounting conser-vatism and better accruals quality) enjoy a higher FP, measured by market measures which reflect the trust that stakeholders have not only in the company at present, but also in the past and future.
The results here presented are robust to different measures of FRQ, es-pecially an aggregate measure that considers the different aspects of quality measured. Furthermore, the relationship analysed here is moderated by a set of factors such as the level of corruption and the adaptation of IFRS in the country of origin of the company, the accounting system and the business cycle in which the economy operates. For those firms located in areas with a lower corruption perception, in countries that have adopted IFRS and in business cycle expansion, information quality has a positive influence on financial

Consequences of financial reporting quality… / Jennifer Martínez-Ferrero 83
performance. However, it should be noted that the moderating effect varies depending on the extent of FRQ considered. This effect also varies according to the international accounting system used.
The study makes several contributions. I contribute to the emerging literature on FRQ, specifically on accounting conservatism, EM and AQ. This research contributes to the literature by explaining financial performance determinants and the causes of good FRQ. The quality of financial information is a relevant issue in the current state of the global financial and economic crisis and one of the factors to take into account when current and future investors are granting external financing to companies. The relevance of the research is based upon controlling for the main determinants of profitability (size, industry, risk, etc.) so that the quality of information plays an essential role in explaining the differences in companies’ results.
Furthermore, this paper presents evidence of the relationship between FRQ and the level of financial performance, using the GMM estimator of Arellano and Bond (1991) for panel data that permits solving the endogeneity problem between both variables. Although this estimator has been used previously in studies such as de Miguel et al. (2005), its application to the accounting sci-ence field is absent, which gives a special research innovation. In addition, the use of this methodology allows us to capture unobservable heterogeneity and provide deeper insights into the study. Our results are consistent with the idea that greater FRQ is associated with better financial performance. An added contribution of this work is the creation of an aggregate measure of FRQ that includes the three aspects previously employed in the literature (EQ, accounting conservatism and AQ), which adds a newness to research on FRQ.
These findings mean practical implications for managers, investors and stakeholders in general. These results may be of interest to managers, enabling them to assess the impact their quality of information has on the outcome and practices that improve market value. Moreover, investors have a greater volume of information at their disposal and thereby, a decreasing amount of information asymmetry. Because of this, investors and stakeholders value these companies in the market in a positive way. However, this paper has certain limitations, such as the use of an international database, with the consequent heterogene-ity of information on accounting issues. This limitation aims to be exceeded with the addition of a variety of moderating factors, such as adoption or not of the IFRS, accounting systems and the level of corruption in the country, and the business cycle. It is true that a potential limitation of the use of the corruption index provided by Transparency International is that it is based on surveys, so the results are more subjective and less reliable in countries where fewer sources are extracted. In addition, what is legally defined (or perceived) as corruption differs by jurisdiction. Furthermore, financial performance is measured through market to book ratio, a market measure, and I do not con-sider other accounting measures. Thus, future research should aim to analyze whether the relationships found here are still met for accounting measures (ROA or ROE for example) in order to confirm the results.

Estudios de Economía, Vol. 41 - Nº 184
References
Ahmed, A. S. and Duellman, S. (2011). “Evidence on the role of accounting conservatism in monitoring managers’ investment decisions”. Accounting and Finance, 51 (3): 6090-633.
Arellano, M., and S. Bond. (1991). “Some tests of specification for panel data: Monte Carlo evidence and an application to employment equations”. The Review of Economic Studies 58 (2): 277-297.
Baber, W. R., P. M. Fairfield, and J. A. Haggard. (1991). “The effect of concern about reported income on discretionary spending decisions: The case of research and development”. Accounting Review 66 (4), 818-829.
Ball, R., S. Kothari, A. Robin. (2000). “The effect of international institutional factors on properties of accounting earnings”. Journal of Accounting and Economics 29 (1): 1-51.
Ball, R., A. Robin and J. S. Wu. (2003). “Incentives Versus Standards: Properties of Accounting Income in Four East Asian Countries”. Journal of Accounting and Economics 3, 235-270.
Ball, R., Robin, A., Sadka, G., (2008). “Is financial reporting shaped by equity markets or by debt markets? An international study of timeliness and conservatism”. Review of Accounting Studies 13 (2-3), 168-205.
Ball, R. and L. Shivakumar. (2006). “The role of accruals in asymmetrically timely gain and losses recognition”. Journal of Accounting Research, 44 (2): 207-242.
Bens, D., Nagar, V. and Wong, M. F. H. (2002). “Real investment implications of employee stock option exercises”. Journal of Accounting Research, 40 (2): 359-406.
Barth, M., W. Landsman and M. Lang. (2008). “International Accounting Standards and Accounting Quality”. Journal of Accounting Research 46 (3), 467-498.
Basu, S. (1997). “The Conservatism Principle and the Asymmetric Timeliness of Earnings”. Journal of Accounting and Economics 24 (1): 3-27.
Bhattacharya, U., Daouk H. and Welker M. (2003). “The World Price of Earnings Opacity”. Accounting Review 78, 641-678.
Bushman, R . M. and Smith, A. J. (2001). “Financial accounting information and corporate governance”. Journal of Accounting and Economics, 32: 237-333.
Campbell, J. L. (2007). “Why would corporations behave in socially responsible ways? An institutional theory of corporate social responsibility”. Academy of Management Review, 32, 946-96.
Campbell, J. and Lindberg, L., (1991). “The evolution of governance regimes”. In: Campbell, J. (Ed. ). Governance of the American Economy. Cambridge University Press, Cambridge, pp. 319-335.
Chen, H., Q. Tang, Y. Jiang, and Z. Lin. (2010). “The role of international financial reporting standards in accounting quality: Evidence from the European Union”. Journal of International Financial Management and Accounting, 21 (3), 220-78.
Chen, F., Hope, O. K., Li, Q. and Wang, X. (2011). “Financial Reporting Quality and Investment Efficiency of Private Firms in Emerging Markets”. The Accounting Review 86 (4): 1255-1288.
Consequences of financial reporting quality… / Jennifer Martínez-Ferrero 85
Choi, T. H., and Pae, J. (2011). “Business Ethics and Financial Reporting Quality: Evidence from Korea”. Journal of Business Ethics 103 (3): 403-427.
Claessens, S., and Fan, J. (2002). “Corporate governance in Asia: A survey”, International Review of Finance, 3, 71-103.
Costello, A. M. and Wittenberg-Moerman, R. (2011). “The Impact of Financial Reporting Quality on Debt Contracting: Evidence from Internal Control Weakness Reports”. Journal of Accounting Research, 49, 97-136.
Dechow, P. M. and I. Dichev. (2002). The quality of accruals and earnings: The role of accrual estimation errors. The Accounting Review, 77 (supplement): 35-39.
Dechow, P. M., W. Ge, and C. Schrand. (2010). “Understanding earnings qual-ity: A review of the proxies, their determinants and their consequences”. Journal of Accounting and Economics, 50 (2-3): 344-401.
Dechow, P. M., and R. G. Sloan. (1991). “Executive incentives and the horizon problem: An empirical investigation”. Journal of Accounting and Economics 14 (1), 51-89.
Dechow, P. M. Sloan, R. G. and Sweeney, A. P. (1995). “Detecting earnings management”. Accounting Review, 70 (2), 193-225.
De Miguel, A., J. Pindado, and C. de la Torre. (2005). “How do entrenchment and expropriation phenomena affect control mechanisms?”. Corporate Governance: An International Review 13, 505-516.
DiMaggio, P. J., and Powell, W. W. (1983). “The iron cage revisited: Institutional isomorphism and collective rationality in organizational fields”. American Sociological Review, 48, 147-160
Francis, J., LaFond, R., Olsson, P. and Schipper, K. (2005). “The market pricing of accrual quality”. Journal of Accounting and Economics 39 (2): 295-327.
Francis, J, Nanda, D and Olsson, P. (2008). “Voluntary disclosure, earnings qual-ity, and cost of capital”. Journal of Accounting Research 46 (1): 53-99.
García Lara, J., García Osma, B., Penalva, F. (2009). “Accounting conservatism and corporate governance”. Review of Accounting Studies 14 (1), 161-201.
García Lara, J. M., B. Garcia Osma, and F. Penalva, (2010), “Conditional con-servatism and firm investment efficiency”. Working Paper (Universidad Carlos III de Madrid, Madrid).
García Osma, B., B. Gill de Albornoz Noguer, and A. Gisbert Clemente. (2005). “La investigación sobre earnings management”. Revista Española de Financiación y Contabilidad 34 (127): 1001-1034.
Garrett, J., Hoitash, R. and Prawitt, D. F. (2012). “Trust and Financial Reporting Quality” (Working Paper). Available at SSRN: http://ssrn. com/ab-stract=2137957 or http://dx. doi. org/10. 2139/ssrn. 2137957
Gong, G., Henock, L. and Sun, A. X. (2008). “Earnings Management and Firm Performance Following Open Market Repurchases”. The Journal of Finance, 63 (2): 947-986.
Gunny, K. (2005). “What are the Consequences of Real Earnings Management?”. Working Paper, University of Colorado.
Hillman, A. J. and Keim, G. D. (2001). “Shareholder Value, Stakeholder Management, and Social Issues: What’s the Bottom Line?”. Strategic Management Journal, 22 (2), 125-139.
Hong. Y. and Andersen, M. L. (2011). “The Relationship Between Corporate Social Responsibility and Earnings Management: An exploratory study”. Journal of Business Ethics 104 (4): 461-471.

Estudios de Economía, Vol. 41 - Nº 186
Hope, O. K., W. B. Thomas and D. Vyas. (2012). “Financial reporting quality of U. S. private and public firms”. Rotman School of Management. Working Paper No. 1995124.
Jo, H., and Kim, Y. (2007). “Disclosure frequency and earnings management”. Journal of Financial Economics, 84, 561-590.
Jonas, G. J. and Blanchet, J. (2000). “Assessing quality of financial reporting”. Accounting Horizons, 14 (3): 353-363.
Jones, J. J. (1991). “Earnings management during import relief investiga-tions”. Journal of Accounting Research, 29 (2), 193-228.
Khan, M. and Watts, R. (2009). “Estimation and Empirical Properties of a Firm-Year Measure of Accounting Conservatism”. Journal of Accounting and Economics 48 (2-3):132-150.
Kothari, S., Leone, A. J., and C. E. Wasley. (2005). “Performance matched discretionary accrual measures”. Journal of Accounting and Economics 39 (1): 163-197.
Klein, A. (2002). “Audit committee, board of director characteristics, and earnings management”. Journal of Accounting and Economics 33 (3): 375-400.
Klein, A., and Marquardt, C. A. (2006). “Fundamentals of accounting losses”. The Accounting Review, 81 (1), 179-206.
Lambert, R., Leuz, C. and Verrecchia, R. E. (2007). “Accounting information, disclosure, and the cost of capital”. Journal of Accounting Research 45 (2): 385-420
Lantto, A-M. andSahlstrom, P. (2009). “Impact of International Financial Reporting Standard Adoption on Key Financial Ratios”. Accounting and Finance, 49, 341-1.
La Porta, R., Lopez-de-Silane, F., Shleifer, A. and Vishny, R. W. (1998). “Law and Finance”. Journal of Political Economy 106 (6), 1113-1155.
Lee, C. H., Li, L. Y. and Yue, H. (2006). “Performance, growth and earnings management”. Review of Accounting Studies, 11 (2-3): 305-334.
Leuz, C., Nanda, D., and Wysocki, P. D. (2003). “Earnings management and investor protection: An international comparison”. Journal of Financial Economics, 69 (3), 505-527.
Louis, H. (2004). “Earnings management and the market performance of acquir-ing firms”. Journal of Financial Economics, 74: 121-148.
Lu, H., Richardson, G. and Salterio, S. (2011). “Direct and Indirect Effects of Internal Control Weakness on Accrual Quality: Evidence from a Unique Canadian Regulatory Setting”. Contemporary Accounting Research 28 (2): 675-707.
Mahoney, L., LaGore, W. and Scazzero, J. A. (2008). “Corporate Social Performance, Financial Performance for Firms that Restate Earnings”. Issues in Social and Environmental Accounting, 2 (1), 104-130.
Margolis, J. D., and Walsh, J. P. (2003). “Misery loves companies: Rethinking social initiatives by business”. Administrative Science Quarterly, 48 (2), 265-305.
McDermott, K. E. (2011). “Financial Reporting Quality and Investment in Corporate Social Responsibility”.
Mora, A., Lara, J., Osma, B., and Gisbert, A. (2004). “La Comparabilidad de la Información Contable en Europa: Efectos de la Manipulación Contable

Consequences of financial reporting quality… / Jennifer Martínez-Ferrero 87
sobre el Nivel de Conservadurismo”. Trabajo presentado en Congreso AECA. Universidad de Valencia.
Nair, R. D. and Frank, W. G. (1980). “The impact of Disclosure and Measurement Practices on International Accounting Classification”. The Accounting Review, 55 (3), 426-450.
Nobes, C. (1998). “Towards a general model of the reasons for the international differences in financial reporting”. Abacus, 34, 162-187
Perez-Batres, L. A., Van V. Miller, M. and Pisani, J. (2011). “Institutionalizing sustainability: an empirical study of corporate registration and com-mitment to the United Nations global compact guidelines”. Journal of Cleaner Production, 19 (8), 843-851
Prior, D., Surroca, J. and Tribó, J. A. (2008). “Are socially responsible managers really ethical? Exploring the relationship between earnings manage-ment and corporate social responsibility”. Corporate Governance: An International Review, 16(3), 160-177.
Rajgopal, S. And Venkatachalam, M. (2011). “Financial reporting quality and idiosyncratic return volatility”. Journal of Accounting and Economics, 51, 1-20.
Raman, K., L. Shivakumar, and A. Tamayo (2012). “Target’s earnings quality and bidders’ takeover decisions”. Review of Accounting Studies, Forthcoming.
Rangan, S. (1998). “Earnings Management and the performance seasoned equity offerings”. Journal of Financial Economics, 50: 101-122.
Roe, M. J. (1991). “A Political Theory of American Corporate Finance”. Columbia Law Review 91, 10-67.
Seifert, B., Morris, S. A., and Bartkus, B. R. (2004). “Having, giving, and getting: Slack resources, corporate philanthropy, and firm financial performance”. Business and Society, 43 (2): 135-161.
Surroca, J., Tribó, J. A. andWaddock, S. (2010). “Corporate responsibility and financial performance: the role of intangible resources”. Strategic Management Journal, 31 (5), 463-490.
Transparency International, “Corruption Perception Index”(2002-2010). Available at http://www. transparency. org/
Tu, C. J. (2012). “The Impact of Stocks Index Adjustments Announcement on Earnings Management”. International Journal of Economics and Finance, 4 (11), 91-98.
Van Tendeloo, B. and A. Vanstraelen. (2005). “Earnings Management Under German GAAP Versus IFRS”. European Accounting Review 14 (1), 155-180.
Waddock, S. A. and Graves, S. B. (1997). “Corporate Social Performance-Financial Performance Link”. Strategic Management Journal, 18 (4), 303-319.
Warfield, T. D., Wild, J. J. and Wild, K. L. (1995). “Managerial ownership, ac-counting choices, and informativeness of earnings”. Journal of Accounting and Economics 20 (1): 61-91.
Weimer, J., and Pape, J. (1999). “A taxonomy of systems of corporate gover-nance”. Corporate Governance: An International Review, 7 (2), 152-166.
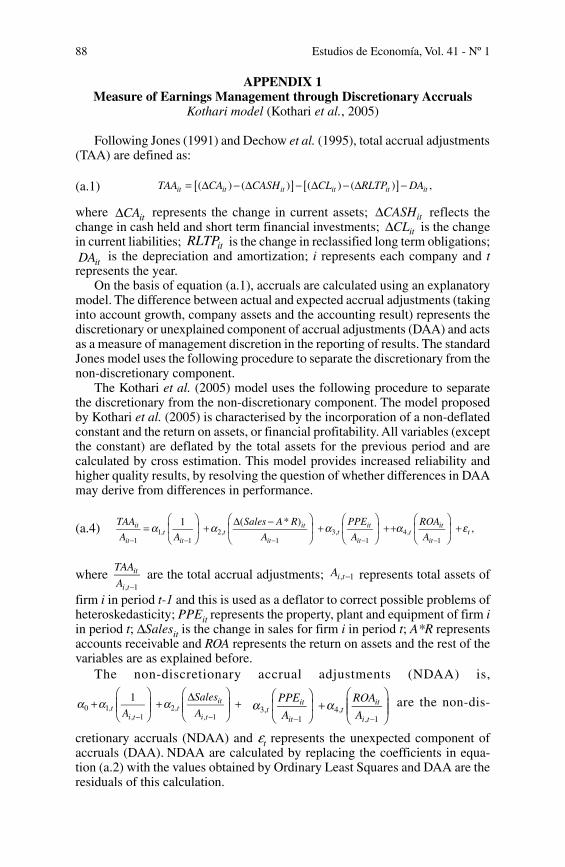
Estudios de Economía, Vol. 41 - Nº 188
APPENDIX 1Measure of Earnings Management through Discretionary Accruals
Kothari model (Kothari et al., 2005)
Following Jones (1991) and Dechow et al. (1995), total accrual adjustments (TAA) are defined as:
(a.1) [ ] [ ]= ∆ − ∆ − ∆ − ∆ −TAA CA CASH CL RLTP DA( ) ( ) ( ) ( ) ,it it it it it it
where ∆CAit represents the change in current assets; ∆CASHit reflects the change in cash held and short term financial investments; ∆CLit is the change in current liabilities; RLTPit is the change in reclassified long term obligations; DAit is the depreciation and amortization; i represents each company and t represents the year.
On the basis of equation (a.1), accruals are calculated using an explanatory model. The difference between actual and expected accrual adjustments (taking into account growth, company assets and the accounting result) represents the discretionary or unexplained component of accrual adjustments (DAA) and acts as a measure of management discretion in the reporting of results. The standard Jones model uses the following procedure to separate the discretionary from the non-discretionary component.
The Kothari et al. (2005) model uses the following procedure to separate the discretionary from the non-discretionary component. The model proposed by Kothari et al. (2005) is characterised by the incorporation of a non-deflated constant and the return on assets, or financial profitability. All variables (except the constant) are deflated by the total assets for the previous period and are calculated by cross estimation. This model provides increased reliability and higher quality results, by resolving the question of whether differences in DAA may derive from differences in performance.
(a.4) α α α α ε=
+ ∆ −
+
++
+
− − − − −
TAA
A A
Sales A R
A
PPE
A
ROA
A
1 ( * ),it
itt
itt
it
itt
it
itt
it
itt
11,
12,
13,
14,
1
where TAA
Ait
i t, 1− are the total accrual adjustments; Ai t, 1− represents total assets of
firm i in period t-1 and this is used as a deflator to correct possible problems of heteroskedasticity; PPEit represents the property, plant and equipment of firm i in period t; ∆Salesit is the change in sales for firm i in period t; A*R represents accounts receivable and ROA represents the return on assets and the rest of the variables are as explained before.
The non-discretionary accrual adjustments (NDAA) is,
A
Sales
A
1t
i tt
it
i t0 1,
, 12,
, 1
α α α+
+ ∆
+
− −
PPE
A
ROA
Atit
itt
it
i t3,
14,
, 1
α α
+
− −
are the non-dis-
cretionary accruals (NDAA) and εt represents the unexpected component of accruals (DAA). NDAA are calculated by replacing the coefficients in equa-tion (a.2) with the values obtained by Ordinary Least Squares and DAA are the residuals of this calculation.