population biology of snowshoe hares. ii. …
TRANSCRIPT

Journal of Animal Ecology (1988), 57, 269-286
POPULATION BIOLOGY OF SNOWSHOE HARES. II. INTERACTIONS WITH WINTER FOOD PLANTS
BY J. N. M. SMITH*, C. J. KREBS*, A. R. E. SINCLAIR* AND
R. BOONSTRA t
* The Ecology Group, Department of Zoology, University of British Columbia, 6270 University Blvd, Vancouver, British Columbia, Canada V6T 2A9, and t Division of Life Sciences, Scarborough Campus, Upiversity of Toronto, 1265 Military Trail, West Hill,
Ontario, Canada MJC JA4
SUMMARY . i
(1) We investigated interactions between snowshoe hares (Lepus americanus) and their food plants in winter during a cyclic fluctuation in numbers at Kluane, Yukon, between 1977 and 1985. •
(2) The winter diet of hares at Kluane was dominated by four species of shrubs and trees. Betula glandulosa, the most preferred species, was common on only four of nine study plots. Salix glauca was eaten most often in mid-winter, when Betula was covered by snow. Where Betula was absent, Salix was eaten at or above the level expected from its relative abundance. Picea glauca was generally not preferred, but was eaten, especially where Betula was absent. Shepherdia canadensis was eaten fourth most often.
(3) By the peak of the cycle in the winter of 1981-82, hares had removed much of the biomass of small twigs of Betula glandulosa and Salix glauca from three study plots. Hares had little effect on the biomass of Pice a glauca twigs. The biomass of these three species on two control plots at the end of the 1981-82 winter was, however, still sufficient to support the hares residing there. A larger population of hares on a third plot with added food depleted their supply of natural foods more severely.
( 4) An analysis of the fates of tagged twigs showed that hares browsed an average of 63% of Betula glandulosa twigs, 26% of Salix glauca twigs, 20% of Shepherdia twigs, and 14% of Picea glauca twigs in the winter during the 3 years of peak density. At the peak in hare numbers in 1981-82, over 80% of Betula twigs were eaten. Twigs within 50 em of the ground were browsed most often.
(5) Heavily-browsed Betula glandulosa bushes grew new twigs rapidly after hare numbers had declined. Salix glauca showed less terminal regrowth, but produced stump sprouts, which we did not measure. Picea glauca and Shepherdia were not heavily browsed, nor did they grow faster after browsing by hares.
(6) Adult hares became heavier in spring as numbers rose, and then lighter as their numbers declined. The latter effect was absent on plots with added food. Growth rates of juvenile hares in summer and autumn declined as hare numbers rose, but did so more slowly on two plots where food was added. Juveniles lost mass in winters of peak density, but did not do so on two plots with added food. The growth rates of juvenile hares recovered within 2 years of the decline.
(7) Our results suggest that snowshoe hares at Kluane did not experience an absolute food shortage in winter at peak densities. Also, radio telemetry studies at Kluane showed that most hares died of predation, not starvation. We suggest that a relative food shortage
269
270 Population biology of snowshoe hares
at high hare numbers facilitated deaths of hares from predation, consistent with Keith et a/. (1984).
INTRODUCTION
In winter, snowshoe hares (Lepus americanus) eat the terminal twigs of woody shrubs and trees (Bider 1961; Bookhout 1965; Telfer 1972; Klein 1977; Wolff 1978). According to Keith (1981, Keith eta/. 1984), a shortage of winter food is a principal cause of the rapid declines in hare numbers from the cyclic peaks that are reached every 8-11 years. Two previous studies have tested this aspect of Keith's hypothesis to explain hare cycles. Pease, Vowles & Keith (1979) found that hares at Rochester, Alberta, removed more than half of the standing crop of twigs in the winter during a peak in numbers, and that standing crops of twigs in autumn were inadequate to maintain the resident hares overwinter. Keith eta/. ( 1984) replicated this study using improved methods, and found evidence of absolute food shortage on only two of three plots, although hare numbers declined on all three. Thus, peaks in hare numbers are often, but not always, associated with an absolute shortage of winter food.
In a previous paper (Krebs et a/. 1986a), we presented demographic data on hare populations in the Kluane region, Yukon, Canada. In this paper, we consider indirect evidence on whether these populations experienced food shortage during a cyclic peak in density in 1980-81. We conducted a population study of marked samples of twigs from 1977 to 1984, and monitored their growth and survival in the face of browsing by hares in winter. We also measured the diets of wild hares and how they selected food plants in relation to their species and height above the ground. We estimated the standing crop of the three most common twigs available to hares on three plots in spring each year. Finally, we tested for evidence of food shortage using the weights of live-trapped hares. In a companion paper (Sinclair eta/. 1988), we consider physiological evidence that hares on our study areas experienced food shortage, and discuss the predictions of several current hypotheses to explain hare cycles.
METHODS
Study areas
The characteristics of the local vegetation and the demography of snowshoe hares were studied on nine plots (9 ha each) near Kluane, Yukon, where hares were regularly trapped using methods in Krebs et a/. (l986a), in a variety of the habitats used by hares. The dominant vegetation varied from closed canopy spruce forest to open areas oflow shrubs; major plant species as given in Krebs eta/. (1986a). Four plots, within 10 km of base camp on the south shore ofKluane Lake, were at least 1 km apart. Two plots (Jacquot Control and Jacquot Food) were on an island in Kluane Lake, about 35 km north of the base camp, one plot (Koo Lake) about 20 km south, and two were about 130 km south, i.e. Dezadeash Food on a small island near the SW corner of Dezadeash lake, and Gribble's Control on the mainland about 10 km further south.
Supplemental food (commercial rabbit food) was supplied to hares on three plots (Jacquot Food, Microwave Food, and Dezadeash Food) (Krebs eta/. (1986a). Maximum snow depths on each plot are in Krebs eta/. (1986a).

J. N. M. SMITH eta/. 271
Species composition of woody plants
Snowshoe hares feed on small twigs ( < 5 mm diam.) of woody shrubs and trees in winter (Pease, Vowles & Keith 1979); we estimated their relative abundances as follows. Two twigs on one tree or shrub were tagged in the summer of 197 6 or 1977 with numbered aluminium tags at all stations on each 10 x 10 hare trapping grid (30m spacing between stations), and their height a.g.l. measured, most <2m, on the shrub or tree nearest to the grid point. Hares can reach twigs about 60 em above ground or snow surface, or higher twigs by felling thicker stems (Keith eta/. 1984). The relative frequencies of each tagged species provided a rough estimate of the species composition of shrubs on the plot.
Selection of woody browse by wild hares
We estimated the choice of food plants by wild hares in winter and spring by tracking hares after fresh snowfalls in November and February, following tracks and recording the species and diameter of each twig where clipped. Typically tracks were followed until about 200 browse points had been recorded per plot, slightly > 200 in February, and slightly < 200 in November. We did not estimate the numbers of hares that made the tracks. A second estimate of species and availability was obtained from the samples of tagged twigs.
Estimates of standing crop of twigs
We estimated the standing crop of the three dominants Salix g/auca (grey willow), Picea glauca (white spruce), and Betula g/andulosa (bog birch) annually at Microwave, 1050, and Beaver Pond, i.e. numbers of twigs with a 5 mm basal diameter on thirty randomly-chosen quadrats of 1·8 x 7·6 min May, after all snow had melted. For slender Betula glandu/osa several twigs with a combined diameter of 5 mm were counted as a single unit and samples weighed. Twigs > 5 mm in diameter and > 2 m in height were ignored because these were out of reach for hares at maximum snow depths. The counts of twigs and estimates of twig biomass were then extrapolated to standing crop of small twigs available to snowshoe hares in kg ha- 1•
Survival and growth of tagged twigs
The 200 tagged twigs on each plot were photographed in black-and-white against a white background in May before the onset of summer growth, and in September after leaves had fallen, and twig area measured using an optical image analyser. Twig growth was recorded from May to September, and twig survival from September to May. Totally-browsed twigs, or missing twigs, were replaced by tagging another twig on the same bush and height of tagged twigs recorded. Browsing by hares was easily distinguished from browsing by moose (A/ces a/ces), the only other herbivore to feed on twigs in winter. Krebs eta/. (1986b) give details of the method.
Sets of four small exclosures (7·6 x 7·6 m) were erected on six plots (Microwave Food (2 sets), Beaver Pond, Silver Creek Control, Dezadeash Food, Gribble's Control, Jacquot Food, and Jacquot Control), intended to exclude vertebrate herbivores of different sizes; i.e. 1 m high fences of: (a) 0·4 em mesh (b) 2 · 5 em mesh hardware cloth, (c) by three strands of barbed wire, and (d) by iron posts only. Type (a) to exclude all vertebrate herbivores, (b) to exclude all save small mammals (mice, voles and chipmunks), and (c) to exclude large mammals such as moose. Type (d) plots were controls. Types (a), (b) and (c) were topped by two additional strands of barbed wire to discourage moose from reaching into

272 Population biology of snowshoe hares
TABLE 1. Distribution of sampling procedures among plots
Growth and survival Browse Standing Sets of Added
Plot of twigs points crop exclosures food
Silver Creek Yes Yes No I No Beaver Pond Yes Yes Yes 1 No Kloo Lake Yes Yes No 0 No 1050 Yes Yes Yes 0 No Microwave Food Yes Yes Yes 2 Yes Jacquot Control Yes Yes No I No Jacquot Food Yes Yes No I Yes Gribble's Control Yes Yes No 1 No Dezadeash Food Yes Yes No I Yes
the exclosures. We tagged and photographed twenty-five twigs to approximate species composition within each exclosure, and followed their growth and survival as described above.
Mass and growth rates of hares
Live-trapped hares were weighed by spring balance to ± 10 g to yield mean values for local populations, and rates of change in mass by three seasons, autumn (SeptemberNovember; winter (December-March); and spring (April-May). Some of our sampling activities were carried out on all nine plots, while others were restricted to certain plots (Table 1).
RESULTS
Species composition of woody plants
The species composition of tagged twigs on the nine plots (Table 2) is dominated by three species of plants, Salix glauca, common on all plots, Picea glauca common on most plots, but rare on Microwave Food, Betula glandulosa common on four plots, but rare or absent from the other five. Together these three species made up over 83% of the tagged twigs on all plots. No other species was tagged on three plots, and on only one did any other species comprise more than 10% of tagged twigs (Salix planifolia (thin red willow) on Jacquot Food). Although only the data from the summer of 1978 are presented here, subsequent loss and replacement of tags had little effect on the proportions of tagged twigs on any plot.
Snow influences the availability of food to hares in winter (Keith et al. 1984). At Kluane, mean maximum snow depths varied from 23 em at Jacquot Control to 70 em at Microwave (Krebs et al. 1986a). One effect of deep snow is to partially or completely cover low shrubs like Betula glandulosa or Shepherdia canadensis (soapberry). For example, in mid-May 1986, a year of late snowmelt, only II% of 105 tagged Betula twigs at Beaver Pond and on two nearby plots were exposed by 12 May, after about half of the snowpack had melted. Since hares do not dig for food, twigs covered by snow are unavailable. Deep snow also allows hares to reach taller twigs, such as side branches of mature Pice a trees.
Other species of shrubs or small trees were patchily distributed, and sometimes locally abundant, but not well-represented in our samples of tagged twigs. These included Shepherdia canadensis, Salix alaxensis (felt leaf willow), Eleagnus commutata (silverberry), Populus tremuloides (aspen), and P. balsamifera (balsam poplar).

J. N. M. SMITH et al.
TABLE 2. Proportions of tagged twigs classed by species on each of nine plots near Kluane, Yukon in 1978. All plots contained 200 twigs
Salix Pice a Betula Shepherdia Plot name glauco glauco glandulosa canadensis Other
Silver Creek 0·34 0·55 0·00 0·00 0·10 Beaver Pond 0·49 0·09 0·42 0·00 0·10 Kloo Lake 0·63 0·31 0·02 0·03 0·00 1050 0·57 0·08 0·35 0·00 0·00 Microwave Food 0·21 0·00 0·79 0·00 0·00 Jacquot Control 0·14 0·73 0·00 0·10 0·03 Jacquot Food 0·50 0·33 0·00 0·02 0·14 Gribble's Control 0·26 0·38 0·29 0·01 0·06 Dezadeash Food 0·66 0·22 0·00 0·08 0·05
TABLE 3. Twigs eaten by wild hares in February and November on all grids with Betula glandulosa (n=4), without Betula (n=3), and on Jacquot Island (n=2). Values shown are the mean proportions of all twigs clipped by hares each year on all
plots in each category. Standard errors are given after each mean
Plant species selected Site Salix glauco Picea glauco Betula glandulosa Shepherdia canadensis Other
February Betula 0·59±0·05 0·18±0·03 0·21±0·08 0·00 0·02±0·01 No Betula 0·45±0·05 0·23±0·07 0·11 ±0·03 0·22±0·04 Jacquot 0·54±0·11 0·23±0·02 0·11±0·04 0·12±0·04
November Betula 0·23±0·08 0·01 ±0·01 0·71±0·09 0·04±0·01 0·02±0·01 No Betula 0·29±0·06 0·15±0·05 0·22±0·07 0·34±0·06 Jacquot 0·44±0·09 0·05±0·02 0·37±0·10 0·08±0·03
273
In summary, the diversity of species of twigs at Kluane in winter is low. Only Salix glauca and Picea glauca are consistently available above the snow surface on most plots.
Food selection by wild hares
We obtained two sets of data on the foods chosen by hares. The first, from tracking hares in the snow, revealed that only a few species were taken (Table 3), with Betula glandulosa and Salix glauca being eaten most often. On the plots with Betula, about 70% of all twigs taken in November were Betula. Snow cover in February reduced consumption of Betula to about 20% of all twigs eaten. About half the twigs eaten in February were S. glauca, and about a quarter were Picea glauca. On mainland plots without Betula, hares ate about the same proportion of S. glauca twigs as on plots where Betula occurred. Rather than increasing their intake of S. glauca, they ate more twigs of Shepherdia, Picea glauca, and other species. The high value (0· 34) for other species in November (Table 3) comes mainly from a single patchily-distributed species, Eleagnus commutata, found only on one plot (Silver Creek). Eleagnus is a low shrub, that is usually covered by snow in February. On the two plots on Jacquot Island, where there was no Betula, and where the demography of hares was different from the other seven plots (Krebs eta/. 1986a; Trostel1986), the species of twigs clipped by hares were very similar to those taken on mainland plots without Betula.

274
~ 5 N
~ 4
E 5 5
4 2 "' E 3 -~ "0
c: 2 0
~ I .....__,.::-'::::-::---'--'
Population biology of snowshoe hares
5
4
3
Year
(b) Betula gfandu/asa
FIG. l. Diameters of four common species of twigs at the point of clipping from the plant by snowshoe hares each year from 1977 to 1984 in February (e) and November (0). Thin vertical bars denote two standard errors above and below the mean. Where no error bars are visible, they are smaller than the point. No Picea glauca twigs were browsed by hares in 1979 and 1983. The stippled vertical bar indicates the period of peak hare numbers in all figures.
The diameters of twigs at the clipping point were higher in February than in November except for Shepherdia twigs (Fig. 1 ). These data are pooled samples from all plots; there were only minor differences among the plots. Basal diameters ofbrowsed Salix g/auca and Betula twigs increased systematically with hare numbers, particularly in the sample in February. The diameters of twigs at the clipping point remained high for a year after the peak in hare numbers, and then declined steadily. Changes in the diameters of clipped twigs were less marked for Picea g/auca and Shepherdia, and neither showed a striking change through the cycle. Thus, hares clipped thicker and less nutritious stems (Sinclair et a/. 1988) of the two most common species in their diet in winters of peak numbers.
Second, we consider selection of tagged twigs by hares. In each winter from 1978-79 to 1981-82 hares ate twigs non-randomly compared to the proportions of each species tagged (P< 0·001, chi-squared tests). In the 1982-83 winter, however, few twigs of any species were eaten, and the proportions of each species eaten did not deviate from chance expectation. We next calculated preference ratios (Crawley 1983) by dividing the proportion of each species in the diet by its proportion in the tagged sample. Values of this index above unity indicate preference, a value of one indifference, and values below one avoidance. We again distinguished between plots containing Betula (Beaver Pond, 1050, Microwave and Gribble's), and the remaining plots, where Betula was absent or very rare. On plots with Betula, its twigs were consistently preferred each winter (Table 4). The mean preference ratio for Betula fell more than 6 x S.E. above unity. On plots with Betula, both Salix and Picea twigs were strongly avoided by hares, except in 1982-83, when Picea twigs were taken more often than expected from their abundance. In this winter, however, few tagged twigs of any species were eaten. Few tagged twigs of other species were available on plots with Betula. Although twigs of other species were preferred overall, the standard errors of their preference ratios were high, and this conclusion must be tentative.
·On plots lacking Betula, Salix twigs were eaten as often, or more often than expected from their relative abundance (Table 4). Picea twigs were generally avoided, save in the

J. N. M. SMITH et al. 275
TABLE 4. Preference ratios (proportion of twigs eaten/proportion of total tagged) for twigs eaten by hares during five winters. Preferred values are > 1. Years of peak hare density are underlined. Data are grouped according to whether Betula
glandulosa was present (n=4) or absent (n=5)
Status Number Number Salix Pice a Betula of Betula tagged eaten glauca glauca glandulosa Other
1978-79 Present 854 92 0·57 0·55 1-40 1-83 Absent 951 49 1·03 0·68 1·95
1979-80 Present 759 194 0·55 0·80 1-40 1·86 Absent 776 209 1·31 0·63 0·71
1980--81 Present 845 408 0·68 0·36 1·46 0·88 Absent 962 160 1-33 0·30 2·00
1981-82 Present 649 328 0-48 0·63 1·52 Absent 865 184 1·31 0·48 1·56
1982-83 Present 761 26 0·55 1·88 1·16 3·17 Absent 734 13 0·91 1·55 0·00
Mean Betula/No Betula 0·57/1·18 0·84/0·73 1-40/- 1·93/1·24 S.E. 0·03/0·08 0·27/0·22 0·06/- 0-47/0·39
winter of 1982-83. Other species were again poorly represented among tagged samples, and preference ratios were variable from year to year. On one plot (Gribble's), a second species of willow, Salix scouleriana (tree willow), may have been a preferred food.
When the estimates of selection of tagged twigs by hares and the data from snow tracking on the species of twigs eaten by hares are compared, the following points emerge. First, Salix glauca was the most widely-eaten food in winter. On plots where Betula glandulosa was absent, Salix was taken at or slightly above the expectation based on its relative abundance. Picea glauca, the second very widely-distributed species, was generally avoided by hares, although it sometimes made up a substantial proportion of their diet. Table 4 suggests that hares may have selected Picea more often in 1982-83, after hare numbers had declined, but this conclusion is tentative because of small samples. On plots with Betula glandulosa, it was a preferred food of hares and dominated their diets. However, the availability of Betula was reduced by snow cover in mid-winter. Where Betula was present, hares generally avoided both Salix and Picea twigs strongly. Other species of twigs were eaten on some plots, but none were very abundant or widespread. Too few twigs of these other species were tagged to estimate whether or not they were preferred by hares. Thus, the availability of winter food for hares at Kluane can be characterized quite well by twig abundance on the three most abundant trees and shrubs, Salix glauca, Picea glauca, and Betula glandulosa.
Standing crop of three dominant species of browse
We estimated the standing crop of twigs of the three most abundant plant species (Salix glauca, Betula glandulosa and Picea glauca) on three plots (1050, Microwave Food, and Beaver Pond). Other species of twigs were rare on these plots. Figure 2 shows that the biomass of two of the three species (Salix and Betula) declined as numbers of hares increased. There was, however, little change in the biomass of Picea. Table 5 shows the

276
w ui (\j
+I
I 0
£
~
"' 1000 "' 0
E >-0
500
Population biology of snowshoe hares
(a) Salix glauco
(c) Picea glauco
1978 1980
Year
1982
1000
1984
(b) Betula glandulosa
1980
Year
1984
FIG. 2. Annual estimates of biomass (±2 S.E.) of three species of plants commonly eaten by snowshoe hares on three plots atKluane, Yukon: 1050 (e), Beaver Pond (0) and Microwave(&).
biomass of twigs of each species available in relation to the hare population on each of the three plots. There was a drastic reduction in the biomass of twigs available per hare on all three plots as hare numbers increased. The reduction was particularly marked on the
TABLE 5. Biomass of twigs of Salix glauca, Picea glauca and Betula glandulosa available to hares in May on three plots from 1978 to 1984. Years of peak hare density are underlined. The numbers tabulated are the kg ha-t of browse of that species estimated from transects, divided by the density of hares per 25 ha on the
plot (from Krebs et al. 1986a, Table 4)
Biomass present (kg hare- 1)
1978 1979 1980 1981 1982 1983 1984
Salix glauca 1050 968 473 188 108 885 8058 16570 Microwave 1663 208 35 5 10 295 2595 Beaver Pond 6018 843 130 58 225 2548 1863
Betula glandulosa 1050 238 190 73 60 48 468 3118 Microwave 1673 243 58 38 18 220 3795 Beaver Pond 875 383 73 30 28 180 345
Picea glauca 1050 380 140 90 98 585 1675 5935 Microwave 78 18 5 5 5 30 75 Beaver Pond 3733 1078 150 80 553 2508 1578
Total 1050 1585 803 353 268 1518 10200 25800 Microwave 3413 465 95 50 35 545 6450 Beaver Pond 10225 2303 353 165 805 5233 3783
J. N. M. SMITH eta/. 277
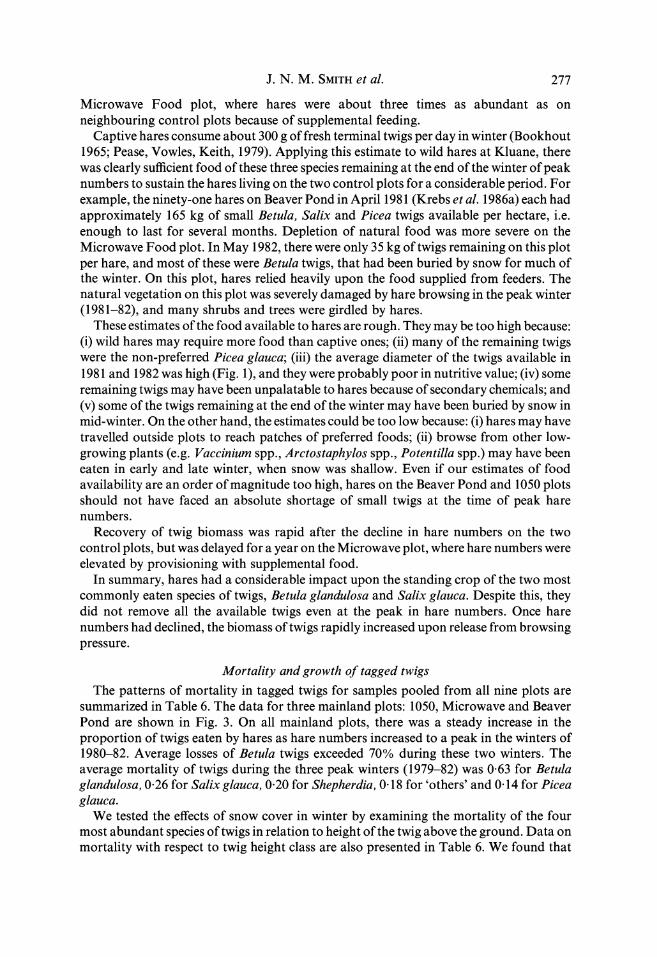
Microwave Food plot, where hares were about three times as abundant as on neighbouring control plots because of supplemental feeding.
Captive hares consume about 300 g offresh terminal twigs per day in winter (Bookhout 1965; Pease, Vowles, Keith, 1979). Applying this estimate to wild hares at Kluane, there was clearly sufficient food of these three species remaining at the end of the winter of peak numbers to sustain the hares living on the two control plots for a considerable period. For example, the ninety-one hares on Beaver Pond in April1981 (Krebs eta/. 1986a) each had approximately 165 kg of small Betula, Salix and Picea twigs available per hectare, i.e. enough to last for several months. Depletion of natural food was more severe on the Microwave Food plot. In May 1982, there were only 35 kg of twigs remaining on this plot per hare, and most of these were Betula twigs, that had been buried by snow for much of the winter. On this plot, hares relied heavily upon the food supplied from feeders. The natural vegetation on this plot was severely damaged by hare browsing in the peak winter (1981-82), and many shrubs and trees were girdled by hares.
These estimates of the food available to hares are rough. They may be too high because: (i) wild hares may require more food than captive ones; (ii) many of the remaining twigs were the non-preferred Picea glauca; (iii) the average diameter of the twigs available in 1981 and 1982 was high (Fig. 1 ), and they were probably poor in nutritive value; (iv) some remaining twigs may have been unpalatable to hares because of secondary chemicals; and (v) some of the twigs remaining at the end of the winter may have been buried by snow in mid-winter. On the other hand, the estimates could be too low because: (i) hares may have travelled outside plots to reach patches of preferred foods; (ii) browse from other lowgrowing plants (e.g. Vaccinium spp., Arctostaphylos spp., Potentilla spp.) may have been eaten in early and late winter, when snow was shallow. Even if our estimates of food availability are an order of magnitude too high, hares on the Beaver Pond and 1050 plots should not have faced an absolute shortage of small twigs at the time of peak hare numbers.
Recovery of twig biomass was rapid after the decline in hare numbers on the two control plots, but was delayed for a year on the Microwave plot, where hare numbers were elevated by provisioning with supplemental food.
In summary, hares had a considerable impact upon the standing crop of the two most commonly eaten species of twigs, Betula glandulosa and Salix glauca. Despite this, they did not remove all the available twigs even at the peak in hare numbers. Once hare numbers had declined, the biomass of twigs rapidly increased upon release from browsing pressure.
Mortality and growth of tagged twigs
The patterns of mortality in tagged twigs for samples pooled from all nine plots are summarized in Table 6. The data for three mainland plots: 1050, Microwave and Beaver Pond are shown in Fig. 3. On all mainland plots, there was a steady increase in the proportion of twigs eaten by hares as hare numbers increased to a peak in the winters of 1980-82. Average losses of Betula twigs exceeded 70% during these two winters. The average mortality of twigs during the three peak winters (1979-82) was 0·63 for Betula glandulosa, 0·26 for Salix glauca, 0·20 for Shepherdia, 0·18 for 'others' and 0·14 for Picea glauca.
We tested the effects of snow cover in winter by examining the mortality of the four most abundant species of twigs in relation to height of the twig above the ground. Data on mortality with respect to twig height class are also presented in Table 6. We found that

278 Population biology of snowshoe hares
TABLE 6. Winter mortality of twigs of four species on six control plots from 1978 to 1983, in relation to height above the ground. Winters of peak hare numbers are underlined. Class 1 =0--50 em; class 2=51-150 em; class 3 = > 150cm. 'All' is total
mortality for all twigs on all nine plots
Height Proportion of twigs browsed by hares in winter
Species class 1977-78 1978-79 197'h'!O 198{}-81 1981-82 1982-83
Betula glandulosa 1 0·08 0·27 0·29 1·00 1·00 0·08 2 0·12 0·13 0·29 0·50 0·63 0·05 3
All 0·07 0·17 0·36 0·71 0·82 0·04
Salix glauca 1 0·08 0·08 0·15 0·54 0·57 0·02 2 0·04 0·05 0·13 0·20 0·09 0·01 3 0·00 0·08* 0·00 0·14* 0·08* 0·00*
All 0·10 0·10 0·24 0·27 0·27 0·02
Picea glauca 1 0·14 0·05 0·11 0·39 0·29 0·09 2 0·05 0·04 0·36 0·08 0·08 0·02 3 0·00 0·22* 0·27* 0·14* 0·00* 0·00*
All 0·06 0·04 0·21 0·08 0·13 0·03
Shepherdia canadensis 1 0·20 0·07 0·08 0·31 0·18 0·00 2 0·09 0·14 0·01 0·01 3
All 0·17 0·05 0·11 0·26 0·23 0·01
'Others' All 0·08 0·08 0·29 0·18 0·07 0·00
* Estimates of mortality based on samples of < 20.
Year
Year
FIG. 3. Loss of biomass of tagged twigs of three plant species, Betula glandulosa ( & ), Picea glauca ( 0) and Salix glauca ( • ), on three study plots from 1977 to 1984. Biomass lost was estimated from
photographs of each twig twice a year.

J. N. M. SMIIH et al. 279
TABLE 7. Percentage growth of twig biomass in summer for four species of common foods of snowshoe hares. Years of peak hare density are underlined. Sample sizes are all > lOOtagged twigs. Data are pooled from all plots. Standard errors are given
in parentheses below the mean
Percentage growth in biomass in summer each year
Species 1977 1978 1979 1980 1981 1982 1983 1984
Betula glandulosa 43·1 54·7 25·8 55·9 46·7 175·9 103-6 60·7 (2-9) (5·6) (2-4) (4·2) (3·7) (17-8) (5·9) (6.6)
Salix glauca 24·3 18·6 15·5 20·9 26·1 27-8 23·2 19·5 (1·2) (0·9) (0·9) (1·1) (1·2) (1·3) (0·9) (H)
Picea glauca 65·7 53·2 30·8 21·4 15-1 21·5 21·4 19·8 (6·0) (5·5) (2-3) (1·6) (1·3) (1·7) (1·3) (1·4)
Shepherdia canadensis 30·3 38·0 34·7 41·9 32·7 32·9 31·0 (3·2) (3-3) (3-7) (5·3) (4·3) (3·1) (4·0)
browsing was generally concentrated on twigs within 50 em of the ground. An exception was Pice a in 1978-81, where a higher proportion of twigs was browsed above 50 em. This bimodal mortality of Picea twigs occurred when deep snow allowed hares to reach the lower side branches of taller Picea trees. The selective mortality of low twigs is a little surprising, as many of these twigs must have been unavailable for much of the winter under snow cover.
The average growth of tagged twigs on all plots is shown in Table 7 for the four most abundant species. The pattern of variation in growth differed among species. In Betula, growth tripled in 1982, the year after hare numbers had declined on most plots. Growth of Betula remained high in 1983. Growth in Salix glauca also peaked in 1982, but changes in growth rate were much less marked than in Betula. This may have been an artefact of our methods. Regrowth of Salix was vigorous, but consisted of unbranched root suckers; we did not tag these, because they lacked branching points. Growth of Picea was high while hare numbers were low in 1977 and 1978, then fell gradually and remained low thereafter. Growth of Shepherdia varied irregularly from year to year, with minor peaks in 1979 and 1981. Thus, one of the four species of plant most commonly eaten by hares at Kluane, Betula glandulosa, showed marked variation in growth in response to browsing by hares.
Data from the exclosures were used to test if the spurt in growth of Betula was a consequence of heavy browsing by hares up to 1981. The exclosures varied in their effectiveness at excluding herbivores (mostly hares) because of snow drifts, and damage by moose or tree falls. We therefore defined three classes of exclosures in relation to the maximum amount of browsing that occurred there during 1979-82. These were: low levels of browsing ( < 20% of twigs browsed); moderate browsing (21-40% browsed) and heavy browsing ( > 40% browsed). The data for the two most heavily-utilized species, Betula glandulosa and Salix glauca are shown in Fig. 4. In the case of Betula (Fig. 4a), there was no spurt in growth in 1982 and little difference in growth of twigs between enclosures that were browsed lightly or moderately. There was, however, a clear stimulating effect on growth after high levels of browsing. This effect was sustained up to 1984, 2 years after hare numbers had declined. In the case of Salix glauca, there were few tagged twigs of this species in exclosures that were heavily browsed, but there is a hint of the same effect seen for Betula. Growth rates of Salix rose sharply from 1980 to 1981, and were higher in exclosures where plants were heavily browsed than in exclosures with moderate or light browsing during the three winters from 1980 to 1983 (Fig. 4b).

280
320
Population biology of snowshoe hares
(a) Betula qlandulosa
80
Year
(b) Salix glauco
FIG. 4. Growth of tagged twigs in small exclosures in relation to low ( • ), medium ( 0) and high (.a.) levels of browsing by snowshoe hares. See text for definition of levels of browsing.
In summary, mortality of twigs of all species peaked at the time of maximum hare abundance. Over 70% of twigs of most species survived browsing by hares each winter, but mortality oftwigs of Betula glandulosa was extremely high, and exceeded 80% in the winter of 1981-82. Twigs closest to the ground were most often eaten by hares. Betula plants responded to heavy browsing by hares by growing much faster than plants protected from browsing in the two summers following the decline in hare numbers. There was probably a similar response in Salix glauca, mainly in the form of increased production of basal shoots. There was no response in Shepherdia or Picea glauca.
Body mass of hares
If hares experience food shortage at the peak in numbers, we might expect: (i) adult hares to be lighter at the end of the winter of peak numbers and (ii), juvenile hares to grow more slowly in the autumn following peak summer density, and to experience difficulty maintaining body mass during winters of peak numbers.
Data on mass of adult hares in spring were available from six plots. These were the three plots where food was supplemented and their respective controls. Hares did not exhibit a clear-cut cycle in numbers on the two plots on Jacquot island, and data on body mass are thus presented only for the remaining four plots (Fig. 5). Data on the average mass of hares in spring are presented separately for males and females, as adult females are heavier in late winter. Patterns of change in average mass from year to year were quite similar on the two control plots, and on the two plots with added food. We therefore pooled the data for presentation. The average mass of control females in April increased slightly as hare numbers approached a peak, but then declined sharply (Fig. 5a). Female hares were much heavier on average in every spring from 1978 to 1983 on the plots with added food (Fig. 5a). The average mass of males in April showed a similar pattern (Fig. 5b ), but it declined slightly less steeply from 1980 to 1982 than did the average of females. Males were only heavier on the plots with added food during the decline in 1981-82 (Fig. 5b). Average mass reached a minimum on the control plots in 1982, after hare numbers had declined to

J. N. M. SMITH et al.
(a)
1984
Year
FIG. 5. Average mass of adult female (a) and male (b) hares in April from 1978 to 1983 with (e) and without (0) added food.
w 14 (a)
ui N 12 (b)
+I
I ,.. 0 "0
S'
"' "' 0 6 E
.s Q)
4 "' c 0
.<:: u
c 2 0 Q)
::; 0
-85 Year
FIG. 6. Rates of change in mass of juvenile hares in autumn (a) and winter (b), with (e) and without (o) added food.
281
less than half of their peak density. Unfortunately, few data were available in 1978, or 1983, and we cannot estimate body mass with confidence in those years.
Juveniles grew rapidly on the mainland in the autumn of 1978, but growth rates had declined on control plots by 1979, and they remained lower thereafter (Fig. 6a). Growth on mainland plots with added food also declined during this period, but did so more slowly. Juveniles on plots with added food gained significantly more mass than those on control plots in the autumns of 1979 and 1980 (P< 0·05, t-tests). After 1980, there were no marked differences in growth in autumn between plots with and without added food.

282 Population biology of snowshoe hares
Juveniles lost mass on control plots on the mainland each winter from 1978-79 to 1981-82. Rates of loss of mass were particularly high in 1981-82, when the average juvenile was losing nearly 4 g per day. Juvenile hares in winter weigh about 1300 g, and this means a loss of nearly 10% of body mass in a month. In contrast, juvenile hares on mainland plots with added food were able to maintain or even increase in mass during winters of peak density. In 1980-81, rates oflossfgain in mass were more similar on fed and control plots, an unexplained result.
Thus, juvenile hares on control plots became lighter on average, and many were presumably short of food, in the four winters of late increase and peak numbers (1978-82). This pattern was not seen when added food was provided, and added food also improved growth rates in autumn before and early during the peak in hare numbers. The average mass of adult hares on control plots, but not plots with added food, declined in spring when numbers were high. This evidence suggests that some young hares were short of food on control plots at high densities, particularly in the winter of 1981-82, when peak numbers occurred on most plots.
In summary, we found indirect evidence of food shortage (low body mass) in both adult and juvenile snowshoe hares near the peak in numbers. Adult females and juveniles were effected more than adult males. Adult hares became heavier in April at the peak in hare numbers, and lighter thereafter.
DISCUSSION
Diets of hares in winter
Hares in our study area fed mainly upon twigs of four species: Betula glandulosa, Salix glauca, Picea glauca and Shepherdia canadensis. This is quite similar to the diet reported for other hare populations in nearby Alaska (Wolff 1978, 1980: Bryant & Kuropat 1980; J.P. Bryant, personal communication), although there are local differences dependent on the presence or absence of particular plant species. Our rough estimates of preferences of wild hares agree well with the results of 'cafeteria' experiments with wild and captive snowshoe hares (Klein 1977; Bryant & Kuropat 1980; Sinclair & Smith 1984). In wild hares at Kluane, as in these earlier studies, Betula and Salix are generally preferred over Picea. Seasonal changes in availability within the winter have a marked effect on the diets of wild hares. In early winter, low shrubs like Betula glandulosa and Shepherdia are available to hares. By mid-winter, snow has covered the low shrubs and bent over the Salix, thus allowing hares to reach the terminal twigs of the taller branches. This is reflected in the diets of hares. More Salix, and more Picea glauca is eaten in mid-winter, especially in years of heavy snowfall like 1980. There is a marked avoidance of juvenile growth in Picea (Sinclair & Smith 1984), but deep snow allows hares to reach some mature side branches, which are preferred by captive hares in cafeteria trials (Sinclair & Smith 1984). This last result is curious, since digestibility of Picea is relatively low (Sinclair et al. 1988.
Hares clipped Betula and Salix twigs of increasing diameter as hare numbers approached a peak. This was probably caused by selective removal of the thinner twigs by hares, and perhaps also because hares felled thicker stems to reach thin terminal twigs. Thin twigs are generally preferred by hares (Pease, Vowles & Keith 1979; Wolff 1980; Bryant 1981; Fox & Bryant 1984), and are more nutritious (Bryant 1981; Sinclair et al. 1988). Thinner twigs and buds, however, may contain more phenols or resins (Palo,

J. N. M. SMITH et al. 283
Pehrson & Kutsson 1983; Fox & Bryant 1984; Bryant et al. 1985; Sinclair & Smith 1984; Sinclair et al. 1988), and the thinnest twigs are sometimes avoided by hares (e.g. Palo, Pehrson & Knutsson 1983). Twigs oflarger diameter were taken in February compared to November, either because of increased snow cover, or because smaller twigs had previously been removed by hares. Although three species of plants provided the bulk of hares' winter diet, hares also fed upon other foods, and these may have had an important effect on their nutritional balance, particularly if they were rich in protein or energy.
Depletion of winter foods by hares and its consequences
It is clear from both estimates of standing crop and mortality of twigs, that hares had a major impact on the supply of twigs of their preferred food plants in winter. Our results agree in this respect with earlier studies by Pease, Vowles & Keith (1979) and Keith et al. (1984). These studies found that standing crops of twigs in autumn were inadequate to support resident hares for the subsequent winter. We found that twigs of the two plants most frequently eaten at Kluane, Betula glandulosa and Salix glauca, suffered very high mortality rates at the time of peak hare numbers and during the early part of the decline. Despite this, enough small twigs remained on two control plots to support the hares living there. Less suitable natural food remained on a third plot where supplemental feeding had increased hare numbers, but even here hares may not have faced an absolute food shortage.
Although hares may not have faced an absolute shortage of winter food, as their numbers increased they probably suffered increased search and travel costs in locating the dwindling supplies of preferred foods. They may also have been forced to eat twigs containing high levels of secondary compounds, or twigs of less-favoured species of plants. Dominance interactions among hares (Graf 1985) might have restricted access to patches of preferred foods. These factors may explain why some hares were unable to maintain mass at peak densities. Assays of faecal protein also indicated that some hares were short of food at peak densities (Sinclair et al. 1988).
After the decline in hare numbers in the winter of 1981-82, the biomass of food per hare increased rapidly (Fig. 2, Table 5), and hares on most plots probably had adequate supplies of preferred twigs. An exception was the Microwave plot, where hares had damaged the vegetation severely. After 1983, a high proportion of Salix glauca twigs on this plot were of juvenile growth form. Juvenile twigs are unpalatable to hares in choice tests (see below), and hares on this site might therefore have been short of palatable natural food. This could have limited their growth and reproduction. On three other plots, however, most remaining twigs were mature ones (Sinclair et al. 1988).
Plant growth and browsing by hares
Browsing often has a stimulating effect upon the production of twigs of woody plants (review in Fox & Bryant 1984), although browsing can also depress plant growth (Crawley 1983). We found a clear stimulating effect of browsing upon future twig growth in Betula glandulosa, the hares most preferred winter food. A similar result was observed in Salix glauca, but our methods did not quantify this fully. The growth response in Betula was only shown at high levels of browsing (maximum loss of over 40% of tagged twigs). A flush of juvenile growth has an important consequence for hares. Juvenile birch and willow twigs are unpalatable to snowshoe hares for at least 2 years after they are produced (Bryant, Chapin & Klein 1983; Bryant et al. 1985). This means that hares must: (i) eat these unpalatable shoots and perhaps suffer deleterious consequences (e.g. Palo 1985); (ii)

284 Population biology of snowshoe hares
replace them in their diets with rarer plants that are harder to find; (iii) dilute the unpalatable shoots with other plants (Sinclair et al. 1988). However, the timing of the increased production of juvenile Betula and Salix twigs at Kluane was after the decline in hare numbers. This result suggests that changes in the palatability and growth form of twigs were a consequence, rather than a cause of the decline in hare numbers.
Changes in average mass of hares in autumn and winter
We found that juvenile hares gained less mass in autumns of peak density, and tended to lose mass in winter. Adults also lost mass in the spring during the early decline. All of these effects were ameliorated by the addition of supplemental food. These results accord well with those of earlier descriptive (Pease, Vowles & Keith 1979; Keith et al. 1984) and experimental studies (Vaughan & Keith 1981). Given this evidence of food shortage in winter, one might expect hares to have frequently starved in winters of peak numbers. This was studied by Keith et al. (1984) in Alberta, and at Kluane by Boutin et al. (1986), and Trostel (1986). In both areas, there was a slight increase in mortality from starvation at peak numbers, but predation was the principal cause of death. This result suggests that food shortage at times of peak numbers predisposed hares to be captured by predators.
A striking feature of hare cycles is that body mass of hares varies in parallel with hare numbers, with hares tending to be heaviest at peak densities (Keith & Windberg 1978). We also found this pattern (Fig. 5), particularly in female mass in April. Male hares in our study followed a similar pattern of change in mass to females, but showed smaller changes with density. A difficulty with these data is that few hares are caught at low densities. Also, the trapped sample may be biased. For example, lighter animals may be less likely to be trapped at high densities.
The role of food shortage in the 10-year cycle
There are two main views of the role offood shortage in hare cycles. According to Keith 1974, 1981; Keith & Windberg 1978; Vaughan & Keith 1981, food shortage acts through starvation by lowering peak hare numbers to the point where hare numbers can be limited by predation. This interaction between food shortage and predation generates a timedelay that drives the cycle. Keith et al. (1984) later modified this position to suggest that food shortage exerts its effects upon hare numbers mainly through predisposing hares to die from predation. Our results do not support Keith's earlier view, as hares on our study plots did not seem to face an absolute food shortage. We also found, by conducting food addition experiments, that hare numbers declined in the presence of superabundant natural (Krebs et al. 1986c) and artificial food (Krebs et al. 1986a).
Our results are, however, compatible with the idea that food shortage predisposed hares to die from predation (Keith et al. 1984). Several pieces of evidence (see above) indicate that hares in our study faced a relative shortage of food. Animals that are short of food may have to move further and expend more energy to find suitable foods, and perhaps to feed away from cover. Most deaths of hares in our study were due to predation (Boutin et al. 1986). Keith et al. (1984) found that hares that had been killed by predators were in a poor nutritional condition compared to hares in a shot sample. Passerine birds that are short of food in winter are also more likely to die from predation (Jansson, Ekman & von Bromssen 1981).
The second major view of the role of winter food in hare cycles is Bryant's hypothesis of changes in plant quality and structure in response to browsing by hares (Bryant 1981; Bryant, Chapin & Klein 1983; Bryant et al. 1985; Fox & Bryant 1984). According to this

J. N. M. SMITH eta!. 285
view, juvenile twigs are unpalatable to hares because they contain aversive or digestibilityreducing chemicals. Hares decline in numbers because they cannot maintain themselves on juvenile twigs. An increase in the ratio of juvenile to adult twigs after the peak in hare numbers provides the 2-3 year time delay needed to generate cycles by reducing survival of hares, and perhaps decreasing their fecundity and reproductive success. In agreement with Bryant's views, hares generally avoid juvenile twigs in both captive trials and in the wild (Palo, Pehrson & Knutsson 1983; Fox & Bryant 1984; Bryant, Chapin & Klein 1983; Bryant eta!. 1985, Sinclair & Smith 1984), but see Moss & Hewson (1985). Our study, however, has failed to support some key predictions of Bryant's hypothesis. In particular, browsing by hares did not consistently increase the levels of aversive chemicals in food plants during the decline in hare numbers, and ratios of juvenile to adult twigs on control plots did not change in the direction predicted by Bryant (Sinclair eta!. 1988). Bryant's hypothesis does not, therefore, explain why hare numbers decline. It may, however, help to explain why hare numbers do not increase as soon as absolute food shortages are over.
A critical demographic variable in the 1 0-year cycle is the poor survival of juvenile hares at peak densities (Keith & Windberg 1978; Krebs et a!. 1986a). This poor survival of juveniles begins during summer (Krebs eta!. 1986a). There is a suggestion from faecal protein levels that adult hares may be less well nourished during years of high density (Sinclair eta!. 1988). This might influence maternal behaviour or lactation. Future studies of the role offood in the 10-year cycle should therefore also consider food in summer. We may then be able to decide whether foraging decisions of hares play a key role in the demographic mechanisms that drive the 10-year cycle.
ACKNOWLEDGMENTS
We thank the Natural Sciences and Engineering Research Council, the Canadian National Sportsmen's Fund, the Canadian Wildlife Service and the Department oflndian Affairs and Northern Development for financial support. The Arctic Institute of North America, University of Calgary, kindly provided facilities at Kluane Lake Base. A. Williams provided much logistic help. S. Boutin, J. Cary, C. Galindo, S. Gilbert, R. Graf, V. Haist, K. Hanson, E. Krebs, J. Krebs, S. Miller, M. Moult, R. Moses, B. Muller and R. Ward helped with fi~ld work. J. Carey, L. Grenier and L. Jamieson analysed the twig photographs. We thartkJ. P. Bryant for showing us his unpublished data, andJ. H. Myers and D. R. Bazely for criticism of the MS. S. As kindly helped with computing. J. N. M.S. is grateful to Drs C. M. Perrins and J. R. Krebs of the Edward Grey Institute, Dept. of Zoology, Oxford University, and to Professor S. Ulfstrand of the Zoological Institute, Uppsala University, for hospitality during preparation of the MS.
REFERENCES
Bider, J. R. (1%1). An ecological study of the hare Lepus americanus. Canadian Journal of Zoology, 39, 81-103. Bookhout, T. A. (1965). The snowshoe hare in upper Michigan: its biology and feeding coactions with white
tailed deer. Michigan Conservation Department. Research and Development Report, 38, 1-198. Boutin, S. A., Krebs, C. J., Sinclair, A. R. E. & Smith, J. N. M. (1986). Proximate causes of losses in a snowshoe
hare population. Canadian Journal of Zoology, 64, 606-610. Bryant, J.P. (1981). The regulation of snowshoe hare feeding behavior during winter by plant anti-herbivore
chemistry. Proceedings of the World Lagomorph Conference (Ed by K. Myers & C. D. Macinnes), pp. 720-731, Guelph University Press, Guelph, Ontario.
Bryant, J.P. & Kuropat, P. (1980). Selection of winter browse by subarctic browsing vertebrates: the role of plant chemistry. Annual Review of Ecology and Systematics, 11, 261-285.

286 Population biology of snowshoe hares
Bryant, J. P., Chapin, F. S. III & Klein, D. R. (1983). Carbon/nutrient balance of boreal plants in relation to vertebrate herbivory. Oikos, 40, 357-368.
Bryant, J. P ., Wieland, G. D., Clausen, T. & Kuropat, P. (1985). Interactions of snowshoe hare and feltleaf willow in Alaska. Ecology, 66, 1564-1573.
Crawley, M. J. (1983). Herbivory. The Dynamics of Animal-Plant Interactions. Studies in Ecology, Vol. 10, Blackwell Scientific Publications, Oxford.
Fox, J. F. & Bryant, J. P. (1984). Instability of the snowshoe hare and woody plant interaction. Oecologia (Berlin}, 63, 128-135.
Graf, R. P. (1985). Social organization of snowshoe hares. Canadian Journal of Zoology, 63, 468-474. Jansson, C., Ekman J. & von Briimssen, A. (1981). Winter mortality and food supply in tits Parus spp. Oikos, 37,
313-322. Keith, L. B. (1974). Some features of population dynamics in mammals. Proceedings of the International
Congress of Game Biologists, 11, 17-58. Keith, L. B. (1981). Role of food in hare population cycles. Oikos, 40, 385-395. Keith, L. B. & Windberg, L.A. (1978). A demographic analysis of the snowshoe hare cycle. Wildlife Monographs,
58, 1-70. Keith, L. B., Cary, J. R., Rongstad, 0. J. & Brittingham, M. C. (1984). Demography and ecology of a declining
snowshoe hare population. Wildlife Monographs, 90, 1-43. Klein, D. R. (1977). Winter food preferences of snowshoe hares (Lepus american us) in interior Alaska.
Proceedings of the International Congress of Game Biologists, 13, 266-275. Krebs, C. J., Gilbert, B. S., Boutin, S., Sinclair, A. R. E. & Smith, J. N. M. (1986a). Population biology of
snowshoe hares. I. Demography of food-supplemented populations in the southernYukon, 1976-1984. Journal of Animal Ecology, 55, 963-982.
Krebs, C. J., Sinclair, A. R. E., Boonstra, R. & Smith, J. N. M. (1986b). A photographic technique for estimating browse growth and use. Wildlife Society Bulletin, 14, 286-288.
Krebs, C. J., Boutin, S. & Gilbert, B.S. (1986c). A natural feeding experiment on a declining snowshoe hare population. Oecologia (Berlin}, 70, 194-197.
Moss, R. & Hewson, R. (1985). Effects on heather of heavy grazing by mountain hares. Holarctic Ecology, 8, 280-284.
Palo, R. T. (1985). Chemical defence in birch: inhibition of digestibility in ruminants by phenolic extracts. Oecologia (Berlin}, 68, 10-14.
Palo, R. T., Pehrson, A. & Knutsson, P-G. (1983). Can birch phenolics be of importance in the defence against browsing vertebrates? Report of a preliminary study. Finnish Game Research, 41, 75-80.
Pease, J. L., Vowles, R. H. & Keith, L. B. (1979). Interaction of snowshoe hares and woody vegetation. Journal of Wildlife Management, 43, 43-60.
Sinclair, A. R. E. & Smith, J. N. M. (1984). Do plant secondary compounds determine feeding preferences of snowshoe hares? Oecologia (Berlin}, 61, 403-410.
Sinclair, A. R. E., Krebs, C. J., Smith, J. N. M. & Boutin, S. (1988). Population biology of snowshoe hares. III: nutrition, plant secondary compounds, and food limitation. Journal of Animal Ecology, 57 (in press).
Telfer, E. S. (1972). Browse selection by deer and hares. Journal of Wildlife Management, 36, 1344-1349. Trostel, K. (1986). Investigations of causes of the 10-year hare cycle. Unpublished M.Sc. thesis, University of
British Columbia, Vancouver, B.C., Canada. Vaughan, M. R. & Keith, L. B. (1981). Demographic response of experimental snowshoe hare populations to
overwinter food shortage. Journal of Wildlife Management, 45, 354-380. Wolff, J. 0. (1978). Food habits of snowshoe hares in interior Alaska. Journal of Wildlife Management, 42, 148-
153. Wolff, J. 0. (1980). The role of habitat patchiness in the population dynamics of snowshoe hares (Lepus
americanus). Ecological Monographs, 50, 111-130.
(Received 25 May 1987)