recurrent introgression of mitochondrial dna among hares...
TRANSCRIPT

Syst. Biol. 61(3):367–381, 2012c© The Author(s) 2011. Published by Oxford University Press, on behalf of the Society of Systematic Biologists. All rights reserved.
For Permissions, please email: [email protected]:10.1093/sysbio/syr114Advance Access publication on December 26, 2011
Recurrent Introgression of Mitochondrial DNA Among Hares (Lepus spp.)Revealed by Species-Tree Inference and Coalescent Simulations
J. MELO-FERREIRA1,2,3,∗ , P. BOURSOT3, M. CARNEIRO1,2, P. J. ESTEVES1,4,L. FARELO1,2, AND P. C. ALVES1,2,5
1CIBIO, Centro de Investigacao em Biodiversidade e Recursos Geneticos, Universidade do Porto, Campus Agrario de Vairao, 4485−661 Vairao, Portugal;2Departamento de Biologia, Faculdade de Ciencias da Universidade do Porto, 4099−002 Porto, Portugal; 3Universite Montpellier 2, CNRS UMR 5554,
Institut des Sciences de l’Evolution, 34095 Montpellier cedex 5, France; 4CITS—Centro de Investigacao em Tecnologias da Saude, IPSN, Gandra,CESPU, Portugal; and 5University of Montana, Wildlife Biology Program, College of Forestry and Conservation, Missoula, MT 59812, USA;
∗Correspondence to be sent to: CIBIO, Centro de Investigacao em Biodiversidade e Recursos Geneticos, Universidade do Porto,Campus Agrario de Vairao, 4485−661 Vairao, Portugal; E-mail: [email protected].
Received 20 July 2010; reviews returned 9 February 2011; accepted 9 July 2011Associate Editor: Laura Kubatko
Abstract.—Understanding recent speciation history requires merging phylogenetic and population genetics approaches,taking into account the persistence of ancestral polymorphism and possible introgression. The emergence of a clear phy-logeny of hares (genus Lepus) has been hampered by poor genomic sampling and possible occurrence of mitochondrialDNA (mtDNA) introgression from the arctic/boreal Lepus timidus into several European temperate and possibly Ameri-can boreal species. However, no formal test of introgression, taking also incomplete lineage sorting into account, has beendone. Here, to clarify the yet poorly resolved species phylogeny of hares and test hypotheses of mtDNA introgression,we sequenced 14 nuclear DNA and 2 mtDNA fragments (8205 and 1113 bp, respectively) in 50 specimens from 11 harespecies from Eurasia, North America, and Africa. By applying an isolation-with-migration model to the nuclear data onsubsets of species, we find evidence for very limited gene flow from L. timidus into most temperate European species, andnot into the American boreal ones. Using a multilocus coalescent–based method, we infer the species phylogeny, which wefind highly incongruent with mtDNA phylogeny using parametric bootstrap. Simulations of mtDNA evolution under thespeciation history inferred from nuclear genes did not support the hypothesis of mtDNA introgression from L. timidus intothe American L. townsendii but did suggest introgression from L. timidus into 4 temperate European species. One such eventlikely resulted in the complete replacement of the aboriginal mtDNA of L. castroviejoi and of its sister species L. corsicanus.It is remarkable that mtDNA introgression in hares is frequent, extensive, and always from the same donor arctic species.We discuss possible explanations for the phenomenon in relation to the dynamics of range expansions and species replace-ments during the climatic oscillations of the Pleistocene. [Coalescent simulations; discordant phylogenies; introgression;Lepus; rapid radiation; species-tree inference.]
Population genetics and phylogenetics have histor-ically been developed relatively independently withdifferent methods and models. It is, however, now rec-ognized that establishing a link between gene genealogyand population or species divergence history requiresthe incorporation of the variance of the coalescenceprocess in populations, as well as the possibility of sec-ondary exchanges after population split. Distinguishingthese two major causes of conflicting signals acrossloci is of major importance but notoriously difficult,and several methods have been developed for identify-ing introgression events in a phylogenetic framework.Whereas most of these methods either do not accountsimultaneously for the possibility of incomplete lin-eage sorting (e.g., Bryant and Moulton 2004; Jin et al.2006; Gauthier and Lapointe 2007) or do not make anassumption about the nature of the discordance (Aneet al. 2007), recent methods incorporate the coalescenceof lineages while attempting to assess the possibility ofgene introgression (Buckley et al. 2006; Joly et al. 2009;Kubatko 2009). Although any genomic region may beaffected by introgression, literature reports of reticulateevolution induced by introgression in animals mostlyconcern mitochondrial DNA (mtDNA) (e.g., Ferris et al.1983; Ruedi et al. 1997; Roca et al. 2005; Alves et al. 2006;Berthier et al. 2006). This phenomenon often generates
strong conflicting phylogenetic signals between nuclearand mtDNA markers (e.g., Buckley et al. 2006; Bossuand Near 2009; Spinks and Shaffer 2009).
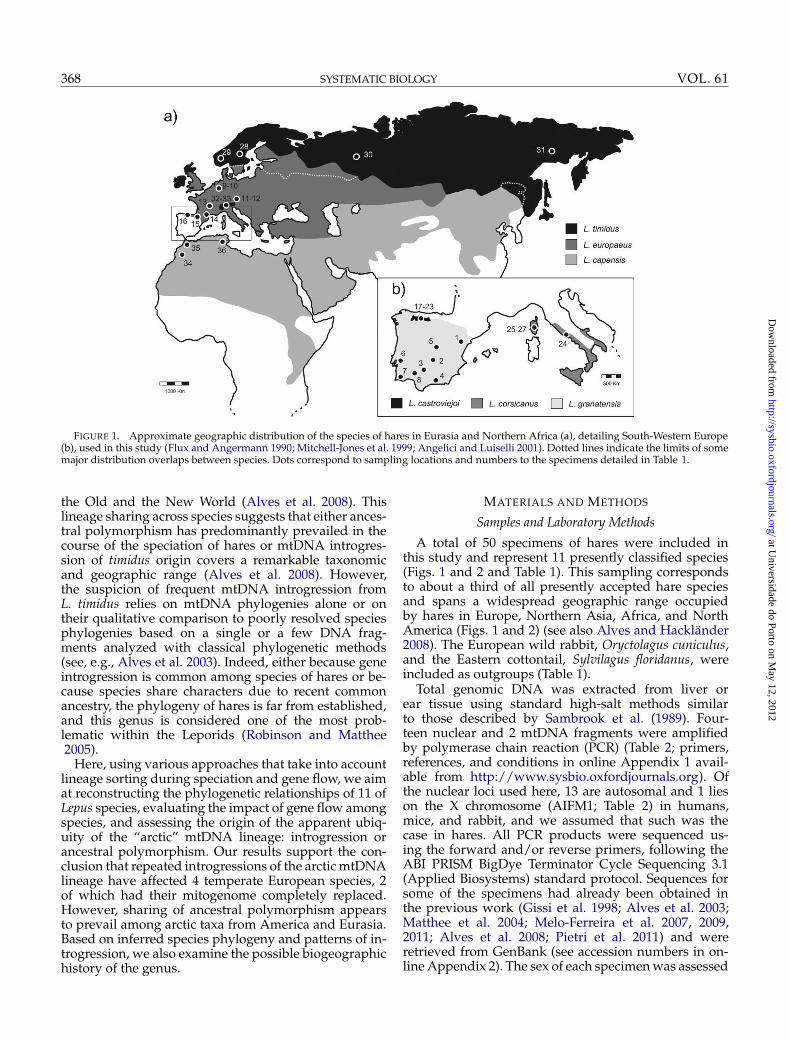
Introgression has been repeatedly invoked to explainthe sharing of closely related mtDNA haplotypes amongdifferent species of hares (Lepus spp.). In fact, most sus-pected cases involve Lepus timidus, an arctic/borealspecies widespread in northern Eurasia, as the mtDNAdonor species (e.g., Thulin et al. 1997, 2006; Alves et al.2003; Melo-Ferreira et al. 2005, 2007; Suchentrunk et al.2005; Fredsted et al. 2006) (Fig. 1). These instances ofapparent mtDNA introgression were reported not onlyin areas of present contact with the recipient species(e.g., into L. europaeus in Sweden or the Alps; Thulinet al. 1997, 2006; Suchentrunk et al. 2005) but also inregions from where L. timidus is now absent but waspresent until it went locally extinct at the end of the lastglacial period (e.g., into L. granatensis and L. europaeusin the Iberian Peninsula; Alves et al. 2003). Interestingly,there are regions where inferred mtDNA introgressionfrom L. timidus is massive and reaches quasi-fixationin some populations (as in the hares from the IberianPeninsula; Melo-Ferreira et al. 2005). Available data alsosuggest that this “arctic” mtDNA lineage is shared byat least 10 other species, some inhabiting temperate re-gions and others also occurring in the arctic, in both
367
at Universidade do Porto on M
ay 12, 2012http://sysbio.oxfordjournals.org/
Dow
nloaded from
368 SYSTEMATIC BIOLOGY VOL. 61
FIGURE 1. Approximate geographic distribution of the species of hares in Eurasia and Northern Africa (a), detailing South-Western Europe(b), used in this study (Flux and Angermann 1990; Mitchell-Jones et al. 1999; Angelici and Luiselli 2001). Dotted lines indicate the limits of somemajor distribution overlaps between species. Dots correspond to sampling locations and numbers to the specimens detailed in Table 1.
the Old and the New World (Alves et al. 2008). Thislineage sharing across species suggests that either ances-tral polymorphism has predominantly prevailed in thecourse of the speciation of hares or mtDNA introgres-sion of timidus origin covers a remarkable taxonomicand geographic range (Alves et al. 2008). However,the suspicion of frequent mtDNA introgression fromL. timidus relies on mtDNA phylogenies alone or ontheir qualitative comparison to poorly resolved speciesphylogenies based on a single or a few DNA frag-ments analyzed with classical phylogenetic methods(see, e.g., Alves et al. 2003). Indeed, either because geneintrogression is common among species of hares or be-cause species share characters due to recent commonancestry, the phylogeny of hares is far from established,and this genus is considered one of the most prob-lematic within the Leporids (Robinson and Matthee2005).
Here, using various approaches that take into accountlineage sorting during speciation and gene flow, we aimat reconstructing the phylogenetic relationships of 11 ofLepus species, evaluating the impact of gene flow amongspecies, and assessing the origin of the apparent ubiq-uity of the “arctic” mtDNA lineage: introgression orancestral polymorphism. Our results support the con-clusion that repeated introgressions of the arctic mtDNAlineage have affected 4 temperate European species, 2of which had their mitogenome completely replaced.However, sharing of ancestral polymorphism appearsto prevail among arctic taxa from America and Eurasia.Based on inferred species phylogeny and patterns of in-trogression, we also examine the possible biogeographichistory of the genus.
MATERIALS AND METHODS
Samples and Laboratory Methods
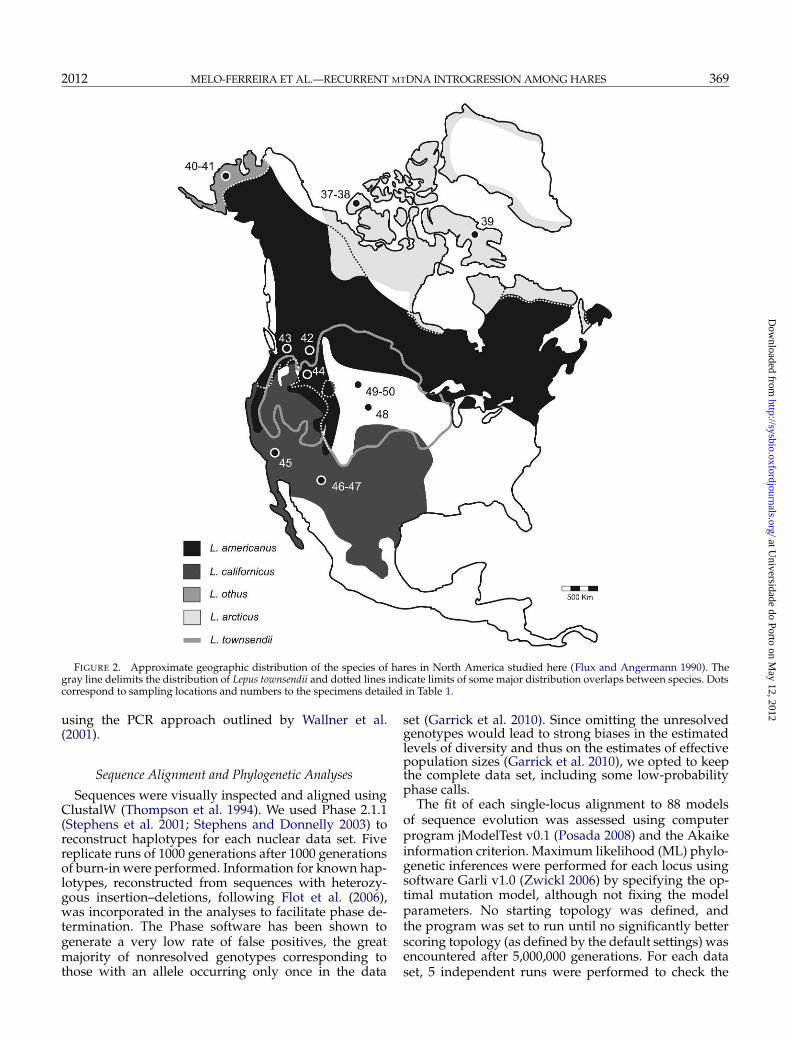
A total of 50 specimens of hares were included inthis study and represent 11 presently classified species(Figs. 1 and 2 and Table 1). This sampling correspondsto about a third of all presently accepted hare speciesand spans a widespread geographic range occupiedby hares in Europe, Northern Asia, Africa, and NorthAmerica (Figs. 1 and 2) (see also Alves and Hacklander2008). The European wild rabbit, Oryctolagus cuniculus,and the Eastern cottontail, Sylvilagus floridanus, wereincluded as outgroups (Table 1).
Total genomic DNA was extracted from liver orear tissue using standard high-salt methods similarto those described by Sambrook et al. (1989). Four-teen nuclear and 2 mtDNA fragments were amplifiedby polymerase chain reaction (PCR) (Table 2; primers,references, and conditions in online Appendix 1 avail-able from http://www.sysbio.oxfordjournals.org). Ofthe nuclear loci used here, 13 are autosomal and 1 lieson the X chromosome (AIFM1; Table 2) in humans,mice, and rabbit, and we assumed that such was thecase in hares. All PCR products were sequenced us-ing the forward and/or reverse primers, following theABI PRISM BigDye Terminator Cycle Sequencing 3.1(Applied Biosystems) standard protocol. Sequences forsome of the specimens had already been obtained inthe previous work (Gissi et al. 1998; Alves et al. 2003;Matthee et al. 2004; Melo-Ferreira et al. 2007, 2009,2011; Alves et al. 2008; Pietri et al. 2011) and wereretrieved from GenBank (see accession numbers in on-line Appendix 2). The sex of each specimen was assessed
at Universidade do Porto on M
ay 12, 2012http://sysbio.oxfordjournals.org/
Dow
nloaded from
2012 MELO-FERREIRA ET AL.—RECURRENT MTDNA INTROGRESSION AMONG HARES 369
FIGURE 2. Approximate geographic distribution of the species of hares in North America studied here (Flux and Angermann 1990). Thegray line delimits the distribution of Lepus townsendii and dotted lines indicate limits of some major distribution overlaps between species. Dotscorrespond to sampling locations and numbers to the specimens detailed in Table 1.
using the PCR approach outlined by Wallner et al.(2001).
Sequence Alignment and Phylogenetic Analyses
Sequences were visually inspected and aligned usingClustalW (Thompson et al. 1994). We used Phase 2.1.1(Stephens et al. 2001; Stephens and Donnelly 2003) toreconstruct haplotypes for each nuclear data set. Fivereplicate runs of 1000 generations after 1000 generationsof burn-in were performed. Information for known hap-lotypes, reconstructed from sequences with heterozy-gous insertion–deletions, following Flot et al. (2006),was incorporated in the analyses to facilitate phase de-termination. The Phase software has been shown togenerate a very low rate of false positives, the greatmajority of nonresolved genotypes corresponding tothose with an allele occurring only once in the data
set (Garrick et al. 2010). Since omitting the unresolvedgenotypes would lead to strong biases in the estimatedlevels of diversity and thus on the estimates of effectivepopulation sizes (Garrick et al. 2010), we opted to keepthe complete data set, including some low-probabilityphase calls.
The fit of each single-locus alignment to 88 modelsof sequence evolution was assessed using computerprogram jModelTest v0.1 (Posada 2008) and the Akaikeinformation criterion. Maximum likelihood (ML) phylo-genetic inferences were performed for each locus usingsoftware Garli v1.0 (Zwickl 2006) by specifying the op-timal mutation model, although not fixing the modelparameters. No starting topology was defined, andthe program was set to run until no significantly betterscoring topology (as defined by the default settings) wasencountered after 5,000,000 generations. For each dataset, 5 independent runs were performed to check the
at Universidade do Porto on M
ay 12, 2012http://sysbio.oxfordjournals.org/
Dow
nloaded from

370 SYSTEMATIC BIOLOGY VOL. 61
TABLE 1. Latin and common names of the species included in this study and geographic location of the sampled specimens (see also Figs. 1and 2)
Species Spp. code Common name Number Code Locality Sexa
Lepus granatensis Lgr Iberian hare 1 Lgr1 Spain F2 Lgr2 Spain M3 Lgr3 Spain M4 Lgr4 Spain M5 Lgr5 Spain M6 Lgr6 Portugal M7 Lgr7 Portugal M8 Lgr8 Spain M
Lepus europaeus Ler Brown hare 9 Ler1 Germany M10 Ler2 Germany M11 Ler3 Austria F12 Ler4 Austria M13 Ler5 France M14 Ler6 France M15 Ler7 Spain F16 Ler8 Spain M
Lepus castroviejoi Lcs Broom hare 17 Lcs1 Spain F18 Lcs2 Spain M19 Lcs3 Spain M20 Lcs4 Spain F21 Lcs5 Spain M22 Lcs6 Spain M23 Lcs7 Spain M
Lepus corsicanus Lcr Italian hare 24 Lcr1 Italy M25 Lcr2 France M26 Lcr3 France F27 Lcr4 France M
Lepus timidus Ltm Mountain hare 28 Ltm1 Sweden M29 Ltm2 Norway M30 Ltm3 Russia M31 Ltm4 Russia M32 Ltm5 France F33 Ltm6 Italy M
Lepus capensis Lcp Cape hare 34 Lcp1 Morocco M35 Lcp2 Morocco M36 Lcp3 Tunisia M
Lepus arcticus Lar Arctic hare 37 Lar1 Canada F38 Lar2 Canada M39 Lar3 Canada M
Lepus othus Lot Alaskan hare 40 Lot1 USA M41 Lot2 USA M
Lepus americanus Lam Snowshoe hare 42 Lam1 USA M43 Lam2 USA M44 Lam3 USA F
Lepus californicus Lcf Black-tailed jackrabbit 45 Lcf1 USA M46 Lcf2 USA M47 Lcf3 USA M
Lepus townsendii Ltw White-tailed jackrabbit 48 Ltw1 USA M49 Ltw2 USA M50 Ltw3 USA M
Oryctolagus cuniculus Ocn European rabbit 51 Ocn1 Spain MSylvilagus floridanus Sfl Eastern cottontail 52 Sfl1 USA M
Notes: aF: female; M: male.
consistency of the estimates. For the mtDNA data set,support of the resulting nodes was estimated using 500bootstrap replicates as implemented in Garli. We testedwhether the resulting best trees were statistically signif-icantly different by applying the Shimodaira–Hasegawa(SH) test (Shimodaira and Hasegawa 1999) using PAUP*(Swofford 2001).
Bayesian inference (BI) was performed for the samedata sets using software BEAST v1.6.1 (Drummond andRambaut 2007). The best-fit model for each unlinked nu-clear fragment was used, as determined with jModel-Test. Regarding mtDNA, 2 partitions corresponding tocytochrome b and control region were considered andascribed to a different model, although concatenatingthem as a single marker. The posterior probabilities were
determined after runs of 10 million generations for theindividual nuclear genes and of 250 million generationsfor mtDNA, without fixing the value of the model pa-rameters and using the Yule tree prior. The stability ofthe runs and convergence of the Markov chain MonteCarlo (MCMC) were assessed using Tracer v1.5 (Ram-baut and Drummond 2007). The initial 10% of each runwere excluded as burn-in.
Phylogenetic methods that explicitly take into ac-count the possibility of differential lineage sorting acrossindividual loci are expected to perform better in multilo-cus data sets (see, e.g., Edwards et al. 2007; Kubatko andDegnan 2007). Thus, phylogenetic analyses based on the14 nuclear genes were performed using the species-treeinference methodology *BEAST (Heled and Drummond
at Universidade do Porto on M
ay 12, 2012http://sysbio.oxfordjournals.org/
Dow
nloaded from
2012 MELO-FERREIRA ET AL.—RECURRENT MTDNA INTROGRESSION AMONG HARES 371
2010), as implemented in BEAST v1.6.1 (Drummondand Rambaut 2007). To avoid violating the assump-tion of no recombination within each locus, we reducedthe sequence data sets to the largest nonrecombiningblocks using the software IMgc (Woerner et al. 2007).In *BEAST, the assignment of specimens to taxa mustbe given as a prior for the analysis. The input file for*BEAST was created using the application BEAUti, partof the package, and partitions and models were editedby hand to fit the models determined by jModeltest. Pos-terior phylogenies were determined in *BEAST using anuncorrelated lognormal relaxed clock (Drummond et al.2006) and the Yule tree prior. The prior of the relaxedclock standard deviation was set to an exponential dis-tribution with a mean of 0.5 as recommended by theauthors. All remaining priors were set to the defaults.Three replicate runs of 500 million generations wereperformed, sampling trees and parameter estimates ev-ery 50,000 generations. Convergence was checked usingTracer v1.5 (Rambaut and Drummond 2007), and sum-mary trees were generated with TreeAnnotator v1.6.1,part of the BEAST package.
To test whether the best reconstructed mtDNA phy-logeny significantly differed from the species tree es-timated using the multispecies/multilocus coalescentmethod, we used a parametric bootstrap approach. Un-der the constraints of the species-tree topology andmonophyly of species (only nodes with posterior proba-bility >0.95 were constrained), the best ML score of suchmtDNA phylogeny was determined using Garli v1.0. Afull ML search was performed without constrainingthe mutation model parameters. The program was setto run until no significantly better scoring topology(as defined by the default settings) was encounteredafter 5,000,000 generations. Five replicate runs wereperformed to check for the consistency of the estimates.The likelihood ratio of the best unconstrained and con-strained trees, D, was calculated. Using the best con-strained topology and the mutation model estimatedfrom the ML search, 500 sequence data sets were simu-lated using Mesquite (Maddison and Maddison 2009).The best ML phylogeny for each simulated data set wasdetermined twice using Garli, both without constrain-ing the topology and forcing the species-tree topology.A full ML search was performed in both cases runningGarli until no better scoring topology was found after100,000 generations. Three replicates were performed toensure consistency of the ML estimates. For each simu-lated data set, D’, the likelihood ratio between the bestML scores of the unconstrained and constrained run,was calculated. A distribution of D’ values was builtand compared with the empirical estimate.
Isolation-with-Migration Analyses and CoalescentSimulations
To test whether nuclear gene flow occurred amongspecies showing topological discordances between nu-clear and mtDNA, we used IMa2 (Hey 2010). This
method co-estimates the multilocus effective popula-tion sizes (present and ancestral), divergence times, andmigration rates under a model of isolation with migra-tion (IM) (Nielsen and Wakeley 2001; Hey and Nielsen2004). Pairs of taxa showing discordant topologicalpositions between nuclear and mtDNA phylogenieswere analyzed using this methodology: castroviejoiversus timidus, corsicanus versus timidus, granatensisversus timidus, europaeus versus timidus, granatensisversus europaeus, timidus versus townsendii, arcticus ver-sus townsendii, othus versus townsendii, granatensis ver-sus castroviejoi, and granatensis versus corsicanus. IMgc(Woerner et al. 2007) was used to reduce the speciespairwise data sets to the largest nonrecombining blockin accordance to the assumption of the IM model ofno recombination within loci. This approach has beenshown to reduce most of the potential biases in the finalestimates (Strasburg and Rieseberg 2010). Overall, 94–100% of the characters and 97–100% of the sequenceswere retained. To verify the consistency of the estimatesacross different runs, IMa2 was run 3 times includingthe 14 nuclear loci with different starting seeds andparameter upper bound priors for each species pairand the infinite-sites mutation model (Kimura 1969).Locus-specific mutation rates were estimated from theLepus–Oryctolagus average corrected distance, consider-ing a split time of 11.8 myr (Matthee et al. 2004) and ageneration time of 2 years (Marboutin and Peroux 1995).The geometric mean of the locus-specific mutation rateswas used to calculate the effective population sizes anddivergence times from IMa2 highest posterior densityof each parameter, following the instructions of the IMamanual. The likelihood ratio test described by Nielsenand Wakeley (2001) was applied to assess whether mi-gration rates were significantly different from zero. Wefurther used likelihood ratio tests to compare modelswith free or constrained migration, sampling 100,000trees, as implemented in the L-mode of IMa2. In addi-tion, the patterns of speciation among the arctic species,L. timidus, L. arcticus, and L. othus, were investigatedunder the IM model with 3 populations (taxa) as imple-mented in IMa2 (Hey 2010). Given the uncertainty ofthe phylogenetic relationships among these species (seeResults section), all three topological possibilities weretested. Both nuclear and mtDNA loci were included inthis analysis with the infinite-sites and HKY (Hasegawaet al. 1985) mutation models, respectively.
In order to assess whether the conflicting phyloge-netic signals found between the nuclear DNA- andthe mtDNA-based phylogenies could be explained byincomplete lineage sorting alone or by gene flow, weemployed a methodology similar to that developed byJoly et al. (2009). The estimates of current and ancestralpopulation sizes and divergence times obtained underthe IM model were used as input for SimCoal2 (Lavaland Excoffier 2004). A total of 10,000 simulated datasets were produced for each of the pairwise speciescomparisons referred above, mimicking the empiricalmtDNA data sets (sequence lengths and sample sizes),under a model where an ancestral haploid population
at Universidade do Porto on M
ay 12, 2012http://sysbio.oxfordjournals.org/
Dow
nloaded from

372 SYSTEMATIC BIOLOGY VOL. 61
of size NeA/2 split into 2 descendants of size Ne1/2and Ne2/2, t generations ago, and no gene flow occur-ring after the split. Again, the mtDNA mutation ratewas estimated considering a rabbit–hare divergence of11.8 myr (Matthee et al. 2004) and a generation timeof 2 years (Marboutin and Peroux 1995). Sequenceswere generated using a mutation model with unequaltransition–transversion rate (the transition proportionwas determined for the empirical data sets with jMod-eltest). For each replicate, the minimum pairwise un-corrected p-distance between the simulated descendantpopulations was retained and a distribution of expectedminimum distances under no gene flow was produced.The empirical pairwise distance between species formtDNA was considered to significantly reject the strictlineage sorting model if it was lower than the 5th per-centile of the simulated minimum distances.
RESULTS
Sequenced Data and Phylogenetic Inferences
Sixteen DNA fragments, 14 nuclear and 2 mitochon-drial (Table 2), were sequenced, yielding a total of 9318bp in 11 Lepus species and 2 outgroups, the Europeanrabbit and the Eastern cottontail (52 specimens; Table 1;newly obtained sequences were deposited in GenBankwith accession numbers JN036862–JN037408—see alsoAppendix 2). After the removal of gaps, which are ig-nored in most of the analyses performed here, the nu-clear DNA data set was composed of 7687 characters,which was further reduced to 6874 characters if consid-ering only the largest nonrecombining blocks (Table 2).The final mtDNA alignment had 1061 bp in total (Table2). Apart from loci DARC and CYB that were com-posed of coding sequence only, the remaining nuclearfragments were either totally intronic or were mostly in-tronic with a small and nearly invariant 1061 exon (seeAppendix 3). The analyzed sequence matrices and theresulting
phylogenetic trees were deposited in TreeBase and areavailable at http://purl.org/phylo/treebase/phylows/study/TB2:S11662.
The replicate runs of the ML phylogenetic reconstruc-tions based on each individual locus yielded consistentbest likelihood scores but slightly different topologies(not shown), which likely resulted from the low level ofinformation present in each single gene. This was alsoreflected in the generally low posterior probabilities formost of the clades obtained in the BI of the single-genephylogenies (Appendix 4). The ML and BI estimates ofthe phylogeny of the individual genes showed that thespecies share sequences at a high degree (Appendices 4and 5). Also, vast discordance among loci was suggestedby the frequently significant differences among the bestML topologies as assessed by the SH test (Appendix 6).
Given such discordances among nuclear loci, phy-logenetic inference of the species tree based on theirconcatenation would be prone to errors (Edwards 2009),and thus, we used the multispecies coalescent meth-ods implemented in *BEAST (Heled and Drummond2010). This is a Bayesian MCMC method that usesthe multispecies/multilocus coalescent to estimate thespecies trees from the distribution of single-gene trees,co-estimating the effective population sizes of tip andancestral taxa. We have reduced our data set to thelargest nonrecombining blocks, which eliminated 10%of the sites and 5% of the sequences. However, an anal-ysis with the complete data set resulted in the inferenceof the same species tree, suggesting that recombinationwould have little effect in the results. The phylogenyobtained using *BEAST is shown in Figure 3a. Low pos-terior probabilities for some nodes were recovered, andhere we only show the nodes with a support higherthan 95% of the posterior trees (see Appendix 7 forfull results). Finally, to test whether the inclusion ofsites with low-probability phase call estimated by Phase2.1.1 (Stephens et al. 2001; Stephens and Donnelly 2003)influenced the estimation of the species tree, we per-
TABLE 2. Variation and appropriate mutation models of the molecular markers used in this study
Number of characters
Marker Total NGa LNRBb Variablec Mutationmodeld
1 ALB Albumin 618 602 602 32 TPM2uf2 CA2 Carbonic anhydrase II 679e 653 549 32 TPM1uf+Γ3 DARC Duffy blood group, chemokine receptor 886 877 861 35 TPM1uf+Γ4 HPX Hemopexin 796 650 392 33 TPM3uf5 KITLG KIT ligand 572 546 422 27 TPM2uf6 PRKCI Protein kinase C, iota 417 372 348 30 TrN7 SPTBN1 Spectrin, beta, nonerythrocytic 1 637 574 574 36 TPM1uf+Γ8 TF Transferrin 429 417 417 40 TVM+Γ9 TSHB Thyroid-stimulating hormone, beta 357 356 356 18 TIM2
10 OXA1L Oxidase assembly 1 684f 657 652 38 TIM1+Γ11 UCP2 Uncoupling protein 2 377 301 301 25 TIM112 UCP4 Uncoupling protein 4 543 534 534 11 HKY13 PPOX Protoporphyrinogen oxidase 613 573 335 29 TPM214 AIFM1 Apoptosis-inducing factor 1 602 575 531 28 TPM1Combined nuclear DNA 8205 7687 6874 414 —15 CYTB Cytochrome b 617 617 — 176 TPM1uf+Γ16 CR Control region 496 444 — 164 HKY+I+ΓCombined mtDNA 1113 1061 — 340 TPM1uf+I+Γ
Notes: aNG: No gaps (Alignment gaps removed). bLNRB: Largest nonrecombining blocks. cOnly ingroup taxa were considered. dSee Posada(2008) for a description of models and references. eInsertion of 380 bp in Sylvilagus floridanus not considered. fMicrosatellite not considered.
at Universidade do Porto on M
ay 12, 2012http://sysbio.oxfordjournals.org/
Dow
nloaded from
2012 MELO-FERREIRA ET AL.—RECURRENT MTDNA INTROGRESSION AMONG HARES 373
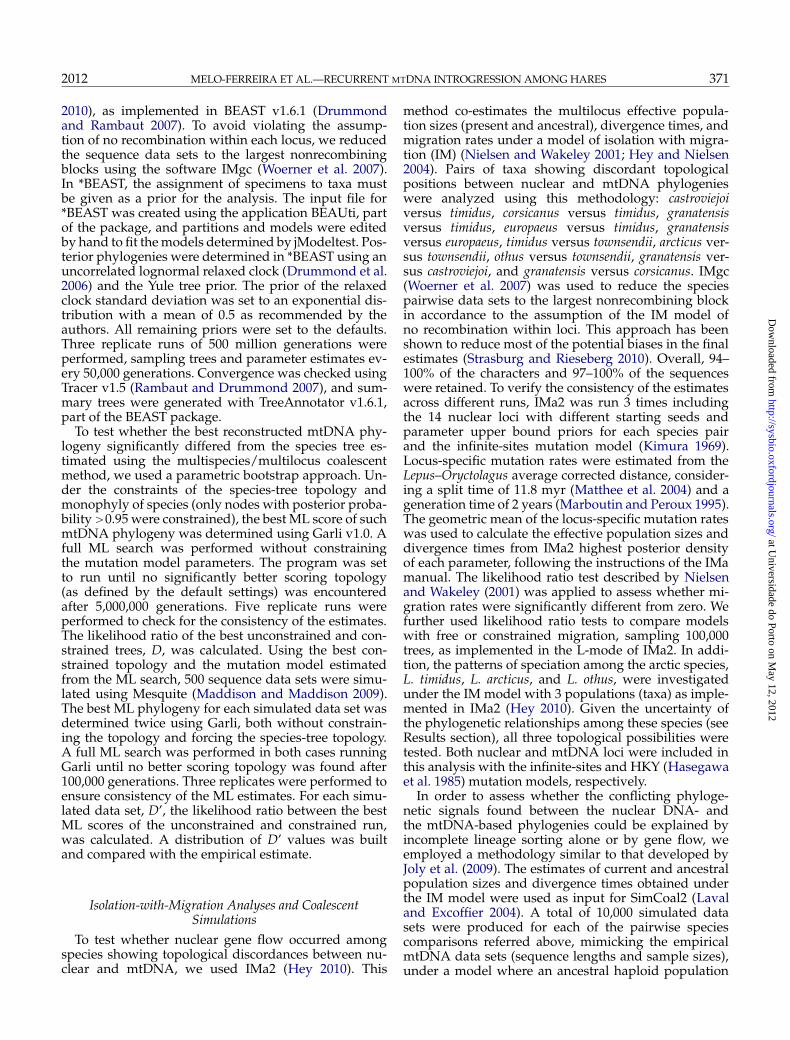
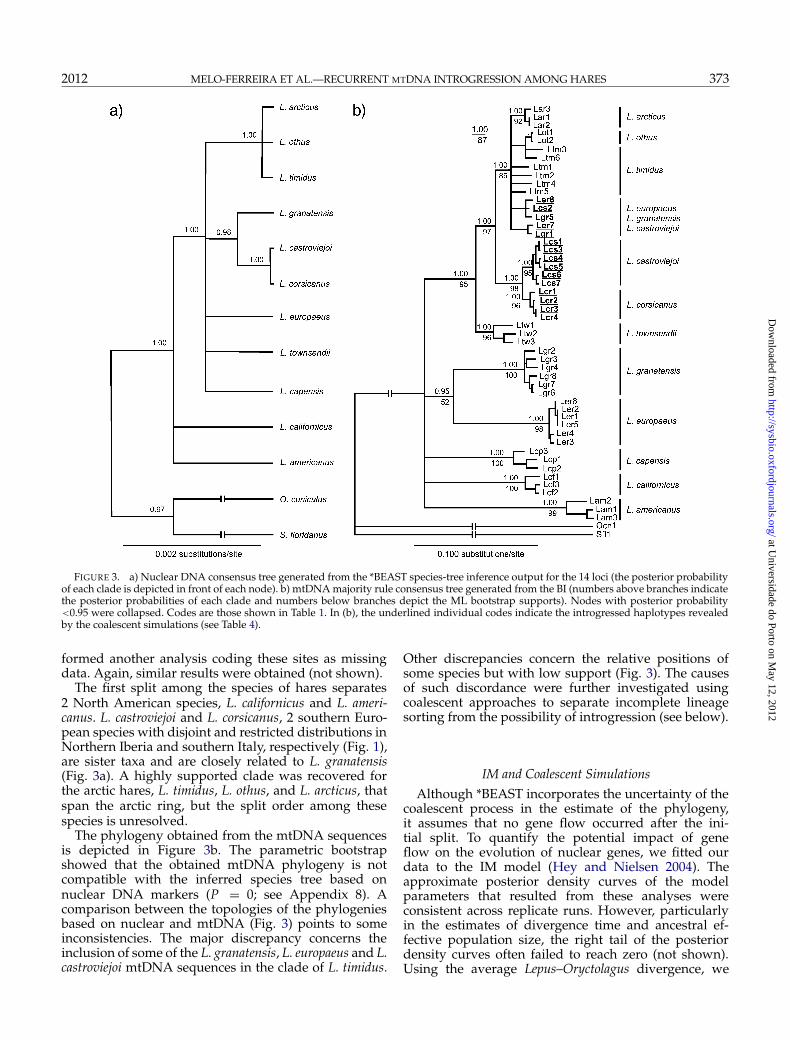
FIGURE 3. a) Nuclear DNA consensus tree generated from the *BEAST species-tree inference output for the 14 loci (the posterior probabilityof each clade is depicted in front of each node). b) mtDNA majority rule consensus tree generated from the BI (numbers above branches indicatethe posterior probabilities of each clade and numbers below branches depict the ML bootstrap supports). Nodes with posterior probability<0.95 were collapsed. Codes are those shown in Table 1. In (b), the underlined individual codes indicate the introgressed haplotypes revealedby the coalescent simulations (see Table 4).
formed another analysis coding these sites as missingdata. Again, similar results were obtained (not shown).
The first split among the species of hares separates2 North American species, L. californicus and L. ameri-canus. L. castroviejoi and L. corsicanus, 2 southern Euro-pean species with disjoint and restricted distributions inNorthern Iberia and southern Italy, respectively (Fig. 1),are sister taxa and are closely related to L. granatensis(Fig. 3a). A highly supported clade was recovered forthe arctic hares, L. timidus, L. othus, and L. arcticus, thatspan the arctic ring, but the split order among thesespecies is unresolved.
The phylogeny obtained from the mtDNA sequencesis depicted in Figure 3b. The parametric bootstrapshowed that the obtained mtDNA phylogeny is notcompatible with the inferred species tree based onnuclear DNA markers (P = 0; see Appendix 8). Acomparison between the topologies of the phylogeniesbased on nuclear and mtDNA (Fig. 3) points to someinconsistencies. The major discrepancy concerns theinclusion of some of the L. granatensis, L. europaeus and L.castroviejoi mtDNA sequences in the clade of L. timidus.
Other discrepancies concern the relative positions ofsome species but with low support (Fig. 3). The causesof such discordance were further investigated usingcoalescent approaches to separate incomplete lineagesorting from the possibility of introgression (see below).
IM and Coalescent Simulations
Although *BEAST incorporates the uncertainty of thecoalescent process in the estimate of the phylogeny,it assumes that no gene flow occurred after the ini-tial split. To quantify the potential impact of geneflow on the evolution of nuclear genes, we fitted ourdata to the IM model (Hey and Nielsen 2004). Theapproximate posterior density curves of the modelparameters that resulted from these analyses wereconsistent across replicate runs. However, particularlyin the estimates of divergence time and ancestral ef-fective population size, the right tail of the posteriordensity curves often failed to reach zero (not shown).Using the average Lepus–Oryctolagus divergence, we
at Universidade do Porto on M
ay 12, 2012http://sysbio.oxfordjournals.org/
Dow
nloaded from

374 SYSTEMATIC BIOLOGY VOL. 61
estimated the mutation rate to be 4.1 × 10⁻⁹ substi-tutions/site/generation for nuclear DNA (geometricmean of 14 loci), which is similar to that estimated formice (4 × 10⁻⁹; Waterston et al. 2002), and 4.9 × 10⁻⁹
substitutions/site/generation when considering boththe nuclear and the mtDNA loci (geometric mean of15 loci). Estimates of effective population size (Ne) cor-related well with the present day geographic range ofthe species (Fig. 1), with L. corsicanus and L. castroviejoihaving the lowest and L. europaeus and L. timidus thehighest Ne (Table 3). To test whether estimated levels ofgene flow of nuclear genes among species were signif-icantly different from zero and whether a model withequal migration rates in both directions could explainthe data, we used the log likelihood ratio (LLR) tests im-plemented in IMa2. Among European species, a modelwith no gene flow was rejected in most cases, exceptbetween L. granatensis and L. corsicanus. Among Euro-pean species, gene flow (migration) was found to besignificantly different from zero only in one of the direc-tions in each species pair (except between L. granatensisand L. corsicanus), and interestingly, L. timidus is thedonor species in all pairs where it is involved (Table3). However, only in one case was a model of equalmigration in both directions rejected (L. granatensis andL. castroviejoi). No gene flow was inferred between thearctic hares and L. townsendii (Table 3). The analyses ofthe group of 3 arctic hares (L. timidus, L. arcticus, and L.othus) showed no significant migration in any direction,whichever topology was assumed for the species tree(Appendix 9).
We used the estimates of divergence times and Neto simulate data sets mimicking the mtDNA sequencesobtained in this work, using a mutation rate of 6.0 ×10⁻⁸ substitutions/site/generation estimated from theaverage corrected divergence between hares and theEuropean rabbit. The 5th percentile of the minimumpairwise uncorrected p-distance among simulatedspecies is shown in Table 4. In the analyses involvingL. castroviejoi or L. corsicanus and L. timidus, all the ob-served pairwise mtDNA divergences were smaller thanthe 5th percentile of the simulated minimum distances,that is, in all cases, these low divergences appearedunlikely to result from the variance of the coalescentprocess in the absence of gene flow. In the remaininganalyses, only a few of the between-species pairwisedistances were significantly lower than expected underan incomplete lineage sorting scenario (Table 3). Thesedistances involve sequences that are placed within the L.timidus clade in the mtDNA phylogeny while belongingto another species (Fig. 3b).
DISCUSSION
In this work, we shed light on the poorly knownphylogeny of hares and, by contrasting the inferred his-tory to the evolutionary patterns obtained for mtDNA,test how widespread and repeated mtDNA introgres-sion is among species, particularly that originating from
the arctic L. timidus. Any attempt to reconstruct thespeciation history must take into account both thevariance of the coalescent among genomic regionsand the possibility of introgression. By applying anIM model to pairs of species, we were able to infer verylimited nuclear gene flow. The evolutionary history ofhares was reconstructed from the nuclear genes using amultispecies coalescent method that takes into accountdifferential lineage sorting across markers. TreatingmtDNA independently, we could ask whether its pat-tern of divergence among species was compatible withthe species history in the absence of gene flow. In sev-eral instances, we found that this was not the case, thussupporting the conclusion of mtDNA introgression.
Nuclear Gene Flow and Rapid Radiation as Sources ofPhylogenetic Uncertainty
Although around 8 kb of nuclear genome of hareswas sequenced here, these were split among 14 loci andtherefore the length of each fragment was rather smalland low variation was found (Table 2). Such low vari-ation translated into some degree of uncertainty on theestimation of single-gene trees with frequent sequencesharing among species (see Appendices 4 and 5). How-ever, we found significant gene-to-gene discordance ofphylogenetic signals, which may indicate differentialprevalence of ancestrally shared polymorphism acrossmarkers (see Appendices 4 and 5). These results high-light the importance of using a method that takes intoaccount the information of each gene tree in a coales-cent framework and that takes advantage of samplingof multiple individuals per species (McCormack et al.2009).
Hares are thought to have radiated very rapidlythroughout Eurasia with the general development oftemperate grasslands (Corbet 1986; Yamada et al. 2002;Matthee et al. 2004) about 4–6 Ma (Matthee et al. 2004).The low posterior probabilities we obtained as supportfor the internal nodes of the species tree may result fromsuch rapid radiation and reflect extensive incompletelineage sorting (see, e.g., Belfiore et al. 2008). However,because the species-tree inference methodology doesnot take introgression into account (Heled and Drum-mond 2010), the effects of potential nuclear gene flowwere neglected. Previous population-level single nu-cleotide polymorphism analyses have suggested thatsome introgression of nuclear genes may have occurredfrom L. timidus into L. europaeus and L. granatensis, al-though reaching very low frequencies in the affectedpopulations (nuclear introgression affected a maximumof 3 of 10 loci, with frequencies mostly under 10%; Melo-Ferreira et al. (2009), but see Melo-Ferreira et al. (2011)for a case of massive introgression of an X-linked frag-ment not included in the present study). Our analyseshere using the IM model among 5 European species sug-gested gene flow in some directions, although a modelwith no migration was rarely rejected (Table 3). Also,the inferred values of the migration parameters were
at Universidade do Porto on M
ay 12, 2012http://sysbio.oxfordjournals.org/
Dow
nloaded from

2012 MELO-FERREIRA ET AL.—RECURRENT MTDNA INTROGRESSION AMONG HARES 375
TA
BL
E3.
ML
esti
mat
es(9
5%p
oste
rior
den
sity
inte
rval
sin
par
enth
eses
)of
dem
ogra
ph
icp
aram
eter
sob
tain
edw
ith
IMa2
betw
een
pai
rsof
har
esp
ecie
s(g
ener
atio
nle
ngt
hof
2ye
ars)
Sp.1
Sp.2
Ne1
aN
e2a
NeA
atb
2Nm
1c
2Nm
2c
AB
CD
Dd
AB
C0D
dA
BC
D0d
AB
C00
d
Lcs
Ltm
26,4
4818
5,83
618
8,38
571
6,32
20.
0386
*0.
0076
n.s
.n
.s.
n.s
.*
(11,
790–
52,5
77)
(125
,229
–275
,057
)(0
.004
1–0.
0934
)(0
–0.1
077)
Lcr
Ltm
6685
174,
819
172,
782
705,
387
0.01
13*
0.00
04n
.s.
*n
.s.
*(5
730–
32,4
68)
(162
,341
–344
,418
)(0
–0.0
419)
(0–0
.093
2)L
grL
tm82
,035
181,
186
91,4
7854
5,32
70.
0488
*0.
0299
n.s
.*
n.s
.*
(50,
165–
126,
889)
(119
,807
–268
,532
)(0
–301
,583
)(2
66,7
62–1
,003
,308
)(0
.004
1–0.
1418
)(0
–0.1
595)
Ler
Ltm
134,
172
192,
024
67,4
9548
3,85
90.
0820
*0.
0326
n.s
.*
n.s
.*
(85,
026–
198,
920)
(123
,653
–290
,082
)(0
–197
,284
)(2
78,1
61–7
59,6
82)
(0.0
134–
0.22
81)
(0–0
.209
7)L
grL
er10
1,93
714
1,00
323
5,00
560
4,54
40.
0003
0.04
31*
n.s
.n
.s.
**
(64,
092–
151,
991)
(93,
392–
206,
927)
(0–0
.088
4)(0
.004
3–0.
1818
)L
grL
cs92
,726
21,7
8437
2,18
489
2,31
00
0.03
27*
*n
.s.
**
(61,
157–
135,
943)
(11,
183–
39,3
73)
(0–0
.025
1)(0
.010
9–0.
0633
)L
grL
cr87
.717
6290
323,
259
687,
288
00.
0050
n.s
.n
.s.
n.s
.n
.s.
(56,
614–
131,
866)
(163
1–17
,823
)(0
–0.0
279)
(0–0
.014
9)L
tmL
tw16
5,48
815
6,51
224
,273
389,
383
0.11
300
n.s
.n
.s.
n.s
.n
.s.
(102
,908
–256
,133
)(8
3,18
6–29
3,17
5)(1
26–1
31,1
01)
(197
,220
–622
,002
)(0
–0.4
150)
(0–0
.303
3)L
arL
tw18
,844
28,4
9622
,981
163,
161
0.02
40
n.s
.n
.s.
n.s
.n
.s.
(838
8–11
4,90
3)(1
3,44
4–17
5,80
1)(0
–203
,722
)(0
–0.2
051)
(0–0
.166
1)L
otL
tw74
,681
140,
072
91,5
9428
8,24
30.
097
0.02
3n
.s.
n.s
.n
.s.
n.s
.(3
1,20
6–16
1,63
0)(7
3,37
1–27
1,68
6)(0
–272
,401
)(0
–0.5
345)
(0–0
.389
8)
Not
es: M
issi
ng
val
ues
corr
esp
ond
toca
ses
wh
ere
par
amet
ers
cou
ldn
otbe
reli
ably
esti
mat
ed;s
eeTa
ble
2fo
rco
des
ofsp
ecie
s.aE
ffec
tiv
ep
opu
lati
onsi
zeof
pop
ula
tion
1(N
e1),
2(N
e2),
and
the
ance
stra
lpop
ula
tion
(NeA
).b
Tim
ein
gen
erat
ion
ssi
nce
spec
ies
1an
d2
spli
t.c P
opu
lati
onm
igra
tion
rate
into
pop
ula
tion
1(2
Nm
1)
and
pop
ula
tion
2(2
Nm
2)
(sig
nifi
can
tv
alu
esin
dic
ated
*P<
0.05
;Nie
lsen
and
Wak
eley
2001
).d
Lik
elih
ood
rati
ote
stof
nes
ted
mod
els
wit
heq
ual
gen
efl
owbe
twee
np
opu
lati
ons
(AB
CD
D),
no
gen
efl
owin
top
opu
lati
on1
(AB
C0D
),n
oge
ne
flow
into
pop
ula
tion
2(A
BC
D0)
,an
dw
ith
no
gen
efl
ow(A
BC
00).
Th
ete
stst
atis
tic
was
calc
ula
ted
asfo
llow
s:A
BC
DD
(2L
LR
agai
nst
AB
CD
E)
foll
ows
ach
i-sq
uar
ed
istr
ibu
tion
wit
h1
deg
ree
offr
eed
omw
ith
crit
ical
val
ue
*P<
0.05
at2L
LR>
3.84
;AB
C0D
and
AB
CD
0(2
LL
Rag
ain
stA
BC
DE
)an
dA
BC
00(2
LL
Rag
ain
stA
BC
DD
)fo
llow
ach
i-sq
uar
ed
istr
ibu
tion
that
is1 /
2×ch
i-sq
uar
e(1)
+1 /
2×ch
i-sq
uar
e(0)
wit
hcr
itic
alv
alu
e*P
<0.
05at
2LL
R>
2.70
.
at Universidade do Porto on M
ay 12, 2012http://sysbio.oxfordjournals.org/
Dow
nloaded from
376 SYSTEMATIC BIOLOGY VOL. 61
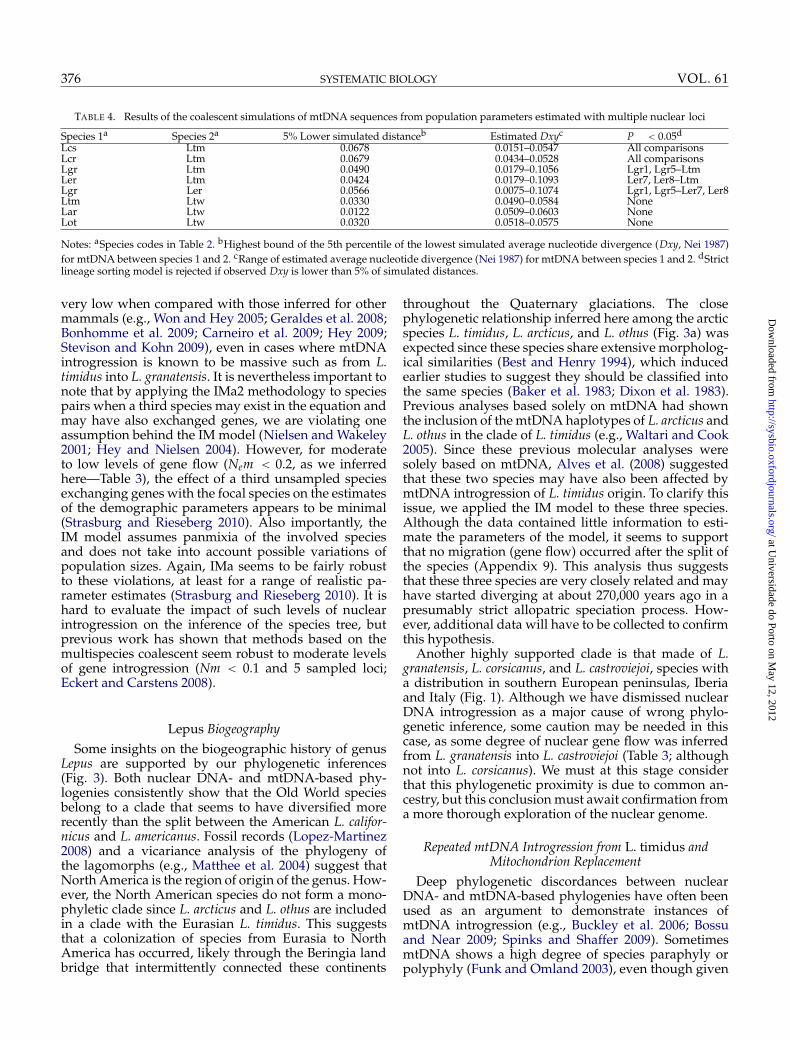
TABLE 4. Results of the coalescent simulations of mtDNA sequences from population parameters estimated with multiple nuclear loci
Species 1a Species 2a 5% Lower simulated distanceb Estimated Dxyc P < 0.05d
Lcs Ltm 0.0678 0.0151–0.0547 All comparisonsLcr Ltm 0.0679 0.0434–0.0528 All comparisonsLgr Ltm 0.0490 0.0179–0.1056 Lgr1, Lgr5–LtmLer Ltm 0.0424 0.0179–0.1093 Ler7, Ler8–LtmLgr Ler 0.0566 0.0075–0.1074 Lgr1, Lgr5–Ler7, Ler8Ltm Ltw 0.0330 0.0490–0.0584 NoneLar Ltw 0.0122 0.0509–0.0603 NoneLot Ltw 0.0320 0.0518–0.0575 None
Notes: aSpecies codes in Table 2. bHighest bound of the 5th percentile of the lowest simulated average nucleotide divergence (Dxy, Nei 1987)for mtDNA between species 1 and 2. cRange of estimated average nucleotide divergence (Nei 1987) for mtDNA between species 1 and 2. dStrictlineage sorting model is rejected if observed Dxy is lower than 5% of simulated distances.
very low when compared with those inferred for othermammals (e.g., Won and Hey 2005; Geraldes et al. 2008;Bonhomme et al. 2009; Carneiro et al. 2009; Hey 2009;Stevison and Kohn 2009), even in cases where mtDNAintrogression is known to be massive such as from L.timidus into L. granatensis. It is nevertheless important tonote that by applying the IMa2 methodology to speciespairs when a third species may exist in the equation andmay have also exchanged genes, we are violating oneassumption behind the IM model (Nielsen and Wakeley2001; Hey and Nielsen 2004). However, for moderateto low levels of gene flow (Nem < 0.2, as we inferredhere—Table 3), the effect of a third unsampled speciesexchanging genes with the focal species on the estimatesof the demographic parameters appears to be minimal(Strasburg and Rieseberg 2010). Also importantly, theIM model assumes panmixia of the involved speciesand does not take into account possible variations ofpopulation sizes. Again, IMa seems to be fairly robustto these violations, at least for a range of realistic pa-rameter estimates (Strasburg and Rieseberg 2010). It ishard to evaluate the impact of such levels of nuclearintrogression on the inference of the species tree, butprevious work has shown that methods based on themultispecies coalescent seem robust to moderate levelsof gene introgression (Nm < 0.1 and 5 sampled loci;Eckert and Carstens 2008).
Lepus Biogeography
Some insights on the biogeographic history of genusLepus are supported by our phylogenetic inferences(Fig. 3). Both nuclear DNA- and mtDNA-based phy-logenies consistently show that the Old World speciesbelong to a clade that seems to have diversified morerecently than the split between the American L. califor-nicus and L. americanus. Fossil records (Lopez-Martinez2008) and a vicariance analysis of the phylogeny ofthe lagomorphs (e.g., Matthee et al. 2004) suggest thatNorth America is the region of origin of the genus. How-ever, the North American species do not form a mono-phyletic clade since L. arcticus and L. othus are includedin a clade with the Eurasian L. timidus. This suggeststhat a colonization of species from Eurasia to NorthAmerica has occurred, likely through the Beringia landbridge that intermittently connected these continents
throughout the Quaternary glaciations. The closephylogenetic relationship inferred here among the arcticspecies L. timidus, L. arcticus, and L. othus (Fig. 3a) wasexpected since these species share extensive morpholog-ical similarities (Best and Henry 1994), which inducedearlier studies to suggest they should be classified intothe same species (Baker et al. 1983; Dixon et al. 1983).Previous analyses based solely on mtDNA had shownthe inclusion of the mtDNA haplotypes of L. arcticus andL. othus in the clade of L. timidus (e.g., Waltari and Cook2005). Since these previous molecular analyses weresolely based on mtDNA, Alves et al. (2008) suggestedthat these two species may have also been affected bymtDNA introgression of L. timidus origin. To clarify thisissue, we applied the IM model to these three species.Although the data contained little information to esti-mate the parameters of the model, it seems to supportthat no migration (gene flow) occurred after the split ofthe species (Appendix 9). This analysis thus suggeststhat these three species are very closely related and mayhave started diverging at about 270,000 years ago in apresumably strict allopatric speciation process. How-ever, additional data will have to be collected to confirmthis hypothesis.
Another highly supported clade is that made of L.granatensis, L. corsicanus, and L. castroviejoi, species witha distribution in southern European peninsulas, Iberiaand Italy (Fig. 1). Although we have dismissed nuclearDNA introgression as a major cause of wrong phylo-genetic inference, some caution may be needed in thiscase, as some degree of nuclear gene flow was inferredfrom L. granatensis into L. castroviejoi (Table 3; althoughnot into L. corsicanus). We must at this stage considerthat this phylogenetic proximity is due to common an-cestry, but this conclusion must await confirmation froma more thorough exploration of the nuclear genome.
Repeated mtDNA Introgression from L. timidus andMitochondrion Replacement
Deep phylogenetic discordances between nuclearDNA- and mtDNA-based phylogenies have often beenused as an argument to demonstrate instances ofmtDNA introgression (e.g., Buckley et al. 2006; Bossuand Near 2009; Spinks and Shaffer 2009). SometimesmtDNA shows a high degree of species paraphyly orpolyphyly (Funk and Omland 2003), even though given
at Universidade do Porto on M
ay 12, 2012http://sysbio.oxfordjournals.org/
Dow
nloaded from
2012 MELO-FERREIRA ET AL.—RECURRENT MTDNA INTROGRESSION AMONG HARES 377
its lower effective population size it is expected to morereadily sort lineages among species than the nucleargenome (Moore 1995). These conclusions of introgres-sion are, however, frequently presented without explic-itly testing the alternative hypothesis that incompletelineage sorting alone may explain the phylogenetic dis-crepancies (e.g., Buckley et al. 2006; Bossu and Near2009; Spinks and Shaffer 2009).
In the mtDNA phylogeny, L. granatensis, L. europaeus,and L. castroviejoi clearly harbor 2 types of haplotypes,one type grouping in a specific clade and the secondtype grouping within L. timidus (Fig. 3b). This phylo-genetic pattern was previously interpreted as resultingfrom introgression of L. timidus origin into these Iberianspecies, which was inferred to have occurred at theend of the last glacial period (Alves et al. 2003; Melo-Ferreira et al. 2005, 2007). Here, we were able to testintrogression against an alternative incomplete lineagesorting scenario, and our results deserve a deeper lookinto the case of L. castroviejoi. Haplotypes belonging tothis species cluster at 2 different positions in the mtDNAtree: one group forms a clade with L. corsicanus (translat-ing the recent common ancestry of these species; Alves,Melo-Ferreira, Branco, et al. 2008) that is sister to thearctic clade and one haplotype falls within the arcticclade (as identified by Melo-Ferreira et al. 2005, 2007)(Fig. 3b). A previous interpretation of this pattern con-sidered that the former group of haplotypes could repre-sent the aboriginal mtDNA lineage of L. castroviejoi (andL. corsicanus) and the latter to result from recent intro-gression from L. timidus (Melo-Ferreira et al. 2005, 2007).This rationale implies that L. castroviejoi and L. corsicanusare phylogenetically closely related to L. timidus. Thisrelatedness is, however, contradicted by the nucleardata where L. castroviejoi and L. corsicanus do not appearrelated to L. timidus (Fig. 3a). In fact, among the collec-tion of nuclear DNA trees resulting from the *BEASTMCMC chain, only a tiny fraction (0.9%) sustains a closerelationship between L. castroviejoi and L. corsicanus andthe “arctic” clade, thus suggesting it to be highly un-likely. We thus raised the hypothesis that the original L.castroviejoi/L. corsicanus mtDNA has not been sampledand has been replaced by a timidus-like mtDNA lineageat some point in the history of the species. To test thishypothesis, we modeled the nuclear divergence from L.timidus in an IM framework and used the estimated pa-rameters to simulate mtDNA data. Given the difficultiesin obtaining good quality posterior curves for the timeof divergence and ancestral population sizes, we alsoinferred divergence times applying a simple mutation–drift expectation with the assumption of no gene flow(k = 2μt + π, where k is the average pairwise differencesamong alleles from 2 populations, μ is the mutationrate, π is the nucleotide diversity of the ancestral popu-lation averaged from the descendants, and t is the timeof divergence between species). The obtained estimatesare, however, remarkably similar to those inferred usingIMa2 (Appendix 10).
The results of the coalescent simulations showed thatall mtDNA haplotypes from L. castroviejoi and L. corsi-
canus present a divergence to L. timidus that is smallerthan expected under a simple pure lineage sorting sce-nario (Table 4). We note that this analysis could becompromised if our estimates of mtDNA divergencewere affected by saturation, but we found no evidenceof such a phenomenon (Appendix 11). Previous workusing a more extensive sampling of L. castroviejoi and L.corsicanus failed to identify any mtDNA haplotype unre-lated to the arctic clade (Pierpaoli et al. 1999; Alves et al.2003; Melo-Ferreira et al. 2005; Alves, Melo-Ferreira,Branco, et al. 2008), which suggests that a completemitochondrion replacement of these species may haveoccurred. Despite the many uncertainties on divergencetime estimates and the difficulty of finding paleontolog-ical calibration points within Lepus, it seems clear thatmtDNA introgression occurred at 2 different epochs,first presumably into the ancestor of L. castroviejoi andL. corsicanus and then more recently into the former, inthe Iberian Peninsula. This method also provided thefirst formal confirmation that the extensive sharing ofmtDNA haplotypes of 2 Iberian species, L. granatensisand L. europaeus, with L. timidus is not compatible withsharing of ancestral polymorphism and thus can only beexplained by introgression (specimens Lgr1, Lgr5, Ler7,and Ler8; Table 3 and Fig. 3b). In contrast, we cannotexclude that the proximity between L. townsendii andthe arctic clade apparent in the mtDNA phylogeny isdue to incomplete lineage sorting alone (Table 3).
On the Repeated mtDNA Introgression among Hares
The widespread and repeated introgression from L.timidus into several temperate species that we documenthere raises the question of whether some deterministicfactor, specific to this species or to its mtDNA, mayhave produced this striking reticulation pattern. Themost generic condition under which such extensiveinterspecific introgression can occur has recently beenproposed and modeled (Currat and Excoffier 2004; Cur-rat et al. 2008). When the territory of a resident species isinvaded by another more successful species, even rarehybridization events at the front of this expansion canwith high probability lead to introgression from the resi-dent species into the expanding one. Drift at the front ofinvasion and during the following expansion is respon-sible for the phenomenon. The important range changesof species caused by glacial oscillations are likely tohave induced repeated and transient secondary contactsamong species, promoting situations of competitive re-placement. The phylogeographic patterns inferred formany European species support these range displace-ments that often result in hybrid zones where popula-tions that evolved in different glacial refugia meet andexchange genes (reviewed, e.g., by Hewitt 2001, 2004).Although it has been suggested that many of those hy-brid zones are stable, there are many evidences of his-torical movement of hybrid zones (Buggs 2007; Hewitt2011; Wang et al. 2011), which could then correspond tosituations of competitive replacement. In Eurasia, some
at Universidade do Porto on M
ay 12, 2012http://sysbio.oxfordjournals.org/
Dow
nloaded from
378 SYSTEMATIC BIOLOGY VOL. 61
cases of interspecific gene flow were inferred to resultfrom situations of range replacement, as for example,among Myotis bats (Berthier et al. 2006) or Myodes voles(Tegelstrom 1987; Abramson et al. 2009). In the case ofhares, it is known that L. timidus was widespread inEurope during the last glacial period, as is attested byfossil records of this species found in southern France(Lopez-Martinez 1980) and northern Iberian Peninsula(Altuna 1970). The current distribution of the species(see Fig. 1) thus results from the recent retreat to higherlatitudes or altitudes (as the Alps). Introgression fromL. timidus into the temperate species could then corre-spond to phases of climate warming, when the latterspecies would be favored and replace the former. Melo-Ferreira et al. (2007) suggested that the most recent ofsuch events, in the Iberian Peninsula, could correspondto the last major episode of climate warming at the endof the last glaciation. We attempted to date the moreancient introgression event that affected the ancestor ofL. castroviejoi and L. corsicanus using the rationale ap-plied above (between L. castroviejoi–L. corsicanus and L.timidus; k = 2μt + π) and estimated it to have occurredabout 550,000 years ago, during the Pleistocene glacialcycles.
It is striking that mtDNA introgression appears to al-ways have occurred in the same direction, that is, fromthe cold-adapted species into the more temperate ones.Why the reverse phenomenon did not occur duringcooling periods, when cold-adapted species presumablyreplaced temperate ones, remains to be understood. Sev-eral hypotheses can be tentatively proposed. One is thatthe reverse phenomenon may simply not have occurredbecause ad hoc ecological conditions did not take place.Temperate species may have gone extinct during cool-ing periods before the cold-adapted species managedto colonize the territories previously occupied by them.Or cooling of the climate may have been too slow tofavor the rapid expansion of cold-adapted species thatis needed for introgression to be extensive. In fact, thedynamics of cycles of climate changes is generally notsymmetrical, and phases of cooling and warming canoccur at very different paces (Petit et al. 1999; Cheddadiet al. 2005). Also, the types of ecological changes that oc-cur during climate fluctuations may be favorable to thephenomenon of competitive replacement in one direc-tion but not the other. Temperate and arctic species maydiffer in the broadness of their climatic envelope, whichcould account for some asymmetry in the replacementprocesses (with the possible complication that ecologicalrequirements of these species may have changed overtime). A more thorough understanding of the nature ofthe ecological changes, in relation to the ecology of thesespecies, is needed. It could also simply be that traces ofintrogression into the arctic species at the previous cool-ing period might have disappeared during the Holocenewith the extinction of the arctic species from presentlytemperate geographic regions that they previously oc-cupied and where introgression could have occurred.In this case, the memory of past introgressions wouldbe kept only in case of complete replacement. Other
factors such as asymmetric reproductive behavior insituations of hybridization, or asymmetries in genomicincompatibilities, could also be invoked to account forthe asymmetry of the phenomenon, as discussed inMelo-Ferreira et al. (2009), but would need to cause aconsistent bias of introgression across different inter-specific interactions of L. timidus, which appears lesslikely.
An alternative explanation to the asymmetry of intro-gression would be that mtDNA of L. timidus has someselective advantage that promotes its introgression.Arguments in favor of this hypothesis are, however,yet far from established. First of all, it should be shownthat introgression of mtDNA is indeed more thoroughthan that of other parts of the genome. The detailedpopulation genetics study of Melo-Ferreira et al. (2009)revealed limited introgression at 10 autosomal markersin 2 species suffering extensive mtDNA introgression(L. granatensis and L. europaeus), but a more recent study(Melo-Ferreira et al. 2011) showed very extensive intro-gression of an X chromosome fragment from L. timidusinto L. granatensis. On the other hand, Melo-Ferreiraet al. (2011) provided some population genetics evi-dence that the foreign mtDNA might have outcompetedthe native one in the latter species. Thus, the case for se-lection is far from resolved, and as often in evolution,going from patterns to processes will need the integra-tion of additional knowledge in various fields, includingecology, palaeoclimate, physiology, and genomics.
SUPPLEMENTARY MATERIAL
Supplementary material, including online-only ap-pendices, can be found at http://www.sysbio.oxfordjournals.org/.
FUNDING
This work was partially supported by FEDER throughthe COMPETE program and Portuguese national fundsthrough the FCT—Fundacao para a Ciencia e a Tec-nologia (POCI2010/BIA-BDE/58817/2004, PTDC/BIA-BDE/72277/2006, PTDC/BIA-EVF/111931/2009, andPTDC/BIA-EVF/115069/2009 research projects) andby Programa Operacional Potencial Humano-Quadrode Referencia Estrategico Nacional funds from theEuropean Social Fund and Portuguese Ministerio daEducacao e Ciencia (FCT, SFRH/BPD/43264/2008,SFRH/BPD/16207/2006, and SFRH/BPD/72343/2010postdoc grants to J.M.F., P.J.E., and M.C., respectively).
ACKNOWLEDGMENTS
We thank Christian Gortazar, Rafael Villafuerte, AlexeiKryukov, Ettore Randi, Christian Pietri, Franz Suchen-trunk, and L. Scott Mills for providing some of thesamples used here. The Lepus arcticus and Lepus othustissue samples were gently yielded by the Universityof Alaska Museum (original codes: Lar1—UAM47253;
at Universidade do Porto on M
ay 12, 2012http://sysbio.oxfordjournals.org/
Dow
nloaded from

2012 MELO-FERREIRA ET AL.—RECURRENT MTDNA INTROGRESSION AMONG HARES 379
Lar2—UAM47257;Lar3—UAM66293;Lot1—UAM42143;Lot2—UAM45545). DNA sequencing was performedon the platform of IFR119 (“Montpellier EnvironnementBiodiversite”) and in Centro de Testagem Molecular(CTM) of CIBIO. We thank Jack Sullivan, Ron DeBry,Laura Kubatko, Brian Carstens, and 3 anonymous re-viewers for insightful and invaluable comments onan early version of the manuscript. This is contribu-tion ISEM−2011−063 from Institut des Sciences del’Evolution.
REFERENCES
Abramson N.I., Rodchenkova E.N., Kostygov A.Y. 2009. Genetic vari-ation and phylogeography of the bank vole (Clethrionomys glare-olus) in Russia with special reference to the introgression of themtDNA of a closely related species, red-backed vole (C. rutilus).Russ. J. Genet. 45:533–545.
Altuna J. 1970. Hallazgo de una liebre artica (Lepus timidus) en elyacimiento prehistorico de Urtiga (Guipuzcoa). Munibe. 22:165–168.
Alves P.C., Ferrand N., Suchentrunk F., Harris D.J. 2003. Ancient intro-gression of Lepus timidus mtDNA into L. granatensis and L. europaeusin the Iberian Peninsula. Mol. Phylogenet. Evol. 27:70–80.
Alves P.C., Hacklander K. 2008. Lagomorph species: geographicaldistribution and conservation status. In: Alves P.C., Ferrand N.,Hacklander K., editors. Lagomorph biology: evolution, ecology,and conservation. Berlin: Springer. p. 395–406.
Alves P.C., Harris D.J., Melo-Ferreira J., Branco M., Ferrand N.,Suchentrunk F., Boursot P. 2006. Hares on thin ice: introgression ofmitochondrial DNA in hares and its implications for recent phylo-genetic analyses. Mol. Phylogenet. Evol. 40:640–641.
Alves P.C., Melo-Ferreira J., Branco M., Suchentrunk F., Ferrand N.,Harris D.J. 2008. Evidence for genetic similarity of two allopatricEuropean hares (Lepus corsicanus and L. castroviejoi) inferred fromnuclear DNA sequences. Mol. Phylogenet. Evol. 46:1191–1197.
Alves P.C., Melo-Ferreira J., Freitas H., Boursot P. 2008. The ubiquitousmountain hare mitochondria: multiple introgressive hybridizationin hares, genus Lepus. Philos. Trans. R. Soc. Lond B. 363:2831–2839.
Ane C., Larget B., Baum D.A., Smith S.D., Rokas A. 2007. Bayesian es-timation of concordance among gene trees. Mol. Biol. Evol. 24:412–426.
Angelici F.M., Luiselli L. 2001. Distribution and status of the Apenninehare Lepus corsicanus in continental Italy and Sicily. Oryx. 35:245–249.
Baker A.J., Eger J.L., Peterson R.L., Manning T.H. 1983. Geographicvariation and taxonomy of the arctic hare. Acta Zool. Fennica.174:45–48.
Belfiore N.M., Liu L., Moritz C. 2008. Multilocus phylogenetics of arapid radiation in the genus Thomomys (Rodentia: Geomyidae).Syst. Biol. 57:294–310.
Berthier P., Excoffier L., Ruedi M. 2006. Recurrent replacement ofmtDNA and cryptic hybridization between two sibling bat speciesMyotis myotis and Myotis blythii. Proc. R. Soc. Lond. B.273:3101–3109.
Best T.L., Henry T.H. 1994. Lepus othus. Mamm. Species.458:1–5.Bonhomme M., Cuartero S., Blancher A., Crouau-Roy B. 2009. Assess-
ing natural introgression in 2 biomedical model species, the rhesusmacaque (Macaca mulatta) and the long-tailed macaque (Macacafascicularis). J. Hered. 100:158–169.
Bossu C.M., Near T.J. 2009. Gene trees reveal repeated instances ofmitochondrial DNA introgression in orangethroat darters (Perci-dae: Etheostoma). Syst. Biol. 58:114–129.
Bryant D., Moulton V. 2004. Neighbor-net: an agglomerative methodfor the construction of phylogenetic networks. Mol. Biol. Evol.21:255–265.
Buckley T.R., Cordeiro M., Marshall D.C., Simon C. 2006. Differen-tiating between hypotheses of lineage sorting and introgressionin New Zealand alpine cicadas (Maoricicada Dugdale). Syst. Biol.55:411–425.
Buggs R.J. 2007. Empirical study of hybrid zone movement. Heredity.99:301–312.
Carneiro M., Ferrand N., Nachman M.W. 2009. Recombination andspeciation: loci near centromeres are more differentiated than locinear telomeres between subspecies of the European Rabbit (Orycto-lagus cuniculus). Genetics. 181:593–606.
Cheddadi R., de Beaulieu J.L., Jouzel J., Andrieu-Ponel V., LaurentJ.M., Reille M., Raynaud D., Bar-Hen A. 2005. Similarity of vege-tation dynamics during interglacial periods. Proc. Natl. Acad. Sci.U.S.A. 102:13939–13943.
Corbet G.B. 1986. Relationships and origins of the European lago-morphs. Mamm. Rev. 16:105–110.
Currat M., Excoffier L. 2004. Modern humans did not admix with Ne-anderthals during their range expansion into Europe. PLoS Biol.2:2264–2274.
Currat M., Ruedi M., Petit R.J., Excoffier L. 2008. The hidden side ofinvasions: massive introgression by local genes. Evolution. 62:1908–1920.
Dixon K.R., Chapman J.A., Willner G.R., Wilson D.E., Lopez-FormentW. 1983. The New World jackrabbits and hares (genus Lepus). 2.Numerical taxonomic analysis. Acta Zool. Fennica. 174:53–56.
Drummond A.J., Ho S.Y., Phillips M.J., Rambaut A. 2006. Relaxed phy-logenetics and dating with confidence. PLoS Biol. 4:e88.
Drummond A.J., Rambaut A. 2007. BEAST: Bayesian evolutionaryanalysis by sampling trees. BMC Evol. Biol. 7:214.
Eckert A.J., Carstens B.C. 2008. Does gene flow destroy phylogeneticsignal? The performance of three methods for estimating speciesphylogenies in the presence of gene flow. Mol. Phylogenet. Evol.49:832–842.
Edwards S.V. 2009. Is a new and general theory of molecular system-atics emerging? Evolution. 63:1–19.
Edwards S.V., Liu L., Pearl D.K. 2007. High-resolution species treeswithout concatenation. Proc. Natl. Acad. Sci. U.S.A. 104: 5936–5941.
Ferris S.D., Sage R.D., Huangj C.M., Nielsen J.T., Ritte U., Wilson A.C.1983. Flow of mitochondrial DNA across species boundary. Proc.Natl. Acad. Sci. U.S.A. 80:2290–2294.
Flot J.F., Tillier A., Samadi S., Tillier S. 2006. Phase determinationfrom direct sequencing of length-variable DNA regions. Mol. Ecol.Notes. 6:627–638.
Flux J.E.C., Angermann R. 1990. The hares and jackrabbits. In: Chap-man J. A. and Flux J. E. C. , editors. Rabbits, hares and pikas. Statussurvey and conservation action plan. Gland (Switzerland): IUCN.
Fredsted T., Wincentz T., Villesen P. 2006. Introgression of mountainhare (Lepus timidus) mitochondrial DNA into wild brown hares(Lepus europaeus) in Denmark. BMC Ecol. 6:17.
Funk D.J., Omland K.E. 2003. Species-level paraphyly and polyphyly:frequency, causes, and consequences, with insights from animalmitochondrial DNA. Annu. Rev. Ecol. Syst. 34:397–423.
Garrick R.C., Sunnucks P., Dyer R.J. 2010. Nuclear gene phylogeog-raphy using PHASE: dealing with unresolved genotypes, lost alle-les, and systematic bias in parameter estimation. BMC Evol. Biol.10:118.
Gauthier O., Lapointe F.J. 2007. Seeing the trees for the network:consensus, information content, and superphylogenies. Syst. Biol.56:345–355.
Geraldes A., Basset P., Gibson B., Smith K.L., Harr B., Yu H.T., BulatovaN., Ziv Y., Nachman M.W. 2008. Inferring the history of speciationin house mice from autosomal, X-linked, Y-linked and mitochon-drial genes. Mol. Ecol. 17:5349–5363.
Gissi C., Gullberg A., Arnason U. 1998. The complete mitochondrialDNA sequence of the rabbit, Oryctolagus cuniculus. Genomics.50:161–169.
Hasegawa M., Kishino H., Yano T. 1985. Dating of the human-apesplitting by a molecular clock of mitochondrial DNA. J. Mol. Evol.22:160–174.
Heled J., Drummond A.J. 2010. Bayesian inference of species treesfrom multilocus data. Mol. Biol. Evol. 27:570–580.
Hewitt G.M. 2001. Speciation, hybrid zones and phylogeography—orseeing genes in space and time. Mol. Ecol. 10:537–549.
Hewitt G.M. 2004. Genetic consequences of climatic oscillations in theQuaternary. Philos. Trans. R. Soc. Lond. B. 359:183–195.
Hewitt G.M. 2011. Quaternary phylogeography: the roots of hybridzones. Genetica. 139:617–638.
at Universidade do Porto on M
ay 12, 2012http://sysbio.oxfordjournals.org/
Dow
nloaded from
380 SYSTEMATIC BIOLOGY VOL. 61
Hey J. 2009. The divergence of chimpanzee species and subspeciesas revealed in multipopulation isolation-with-migration analyses.Mol. Biol. Evol. 27:921–933.
Hey J. 2010. Isolation with migration models for more than two popu-lations. Mol. Biol. Evol. 27:905–920.
Hey J., Nielsen R. 2004. Multilocus methods for estimating populationsizes, migration rates and divergence time, with applications to thedivergence of Drosophila pseudoobscura and D. persimilis. Genetics.167:747–760.
Jin G., Nakhleh L., Snir S., Tuller T. 2006. Maximum likelihood of phy-logenetic networks. Bioinformatics. 22:2604–2611.
Joly S., McLenachan P.A., Lockhart P.J. 2009. A statistical approach fordistinguishing hybridization and incomplete lineage sorting. Am.Nat. 174:E54–E70.
Kimura M. 1969. The number of heterozygous nucleotide sites main-tained in a finite population due to steady flux of mutations. Genet-ics. 61:893–903.
Kubatko L.S. 2009. Identifying hybridization events in the presence ofcoalescence via model selection. Syst. Biol. 58:478–488.
Kubatko L.S., Degnan J.H. 2007. Inconsistency of phylogenetic esti-mates from concatenated data under coalescence. Syst. Biol. 56:17–24.
Laval G., Excoffier L. 2004. SIMCOAL 2.0: a program to simu-late genomic diversity over large recombining regions in a sub-divided population with a complex history. Bioinformatics. 20:2485–2487.
Lopez-Martinez N. 1980. Les lagomorphs (Mammalia) du pleistocenesuperieur de Jaurens. Nouv. Arch. Mus. Hist. Nat. Lyon. 18:5–16.
Lopez-Martinez N. 2008. The lagomorph fossil record and the originof the European rabbit. In: Alves P. C., Ferrand N., Hacklander K.,editors. Lagomorph biology: evolution, ecology, and conservation.Berlin: Springer-Verlag. p. 27–46.
Maddison W.P., Maddison D.R. 2009. Mesquite: a modular sys-tem for evolutionary analysis, version 2.6. Available from:http://mesquiteproject.org.
Marboutin E., Peroux R. 1995. Survival pattern of European hare in adecreasing population. J. Appl. Ecol. 32:809–816.
Matthee C.A., van Vuuren B.J., Bell D., Robinson T.J. 2004. A molec-ular supermatrix of the rabbits and hares (Leporidae) allows forthe identification of five intercontinental exchanges during theMiocene. Syst. Biol. 53:433–447.
McCormack J.E., Huang H., Knowles L.L. 2009. Maximum likelihoodestimates of species trees: how accuracy of phylogenetic inferencedepends upon the divergence history and sampling design. Syst.Biol. 58:501–508.
Melo-Ferreira J., Alves P.C., Freitas H., Ferrand N., Boursot P. 2009.The genomic legacy from the extinct Lepus timidus to the three harespecies of Iberia: contrast between mtDNA, sex chromosomes andautosomes. Mol. Ecol. 18:2643–2658.
Melo-Ferreira J., Alves P.C., Rocha J., Ferrand N., Boursot P. 2011.Interspecific X-chromosome and mitochondrial DNA introgres-sion in the Iberian hare: selection or allele surfing? Evolution. 65:1956–1968.
Melo-Ferreira J., Boursot P., Randi E., Kryukov A., Suchentrunk F., Fer-rand N., Alves P.C. 2007. The rise and fall of the mountain hare (Le-pus timidus) during Pleistocene glaciations: expansion and retreatwith hybridization in the Iberian Peninsula. Mol. Ecol. 16:605–618.
Melo-Ferreira J., Boursot P., Suchentrunk F., Ferrand N., Alves P.C.2005. Invasion from the cold past: extensive introgression of moun-tain hare (Lepus timidus) mitochondrial DNA into three other harespecies in northern Iberia. Mol. Ecol. 14:2459–2464.
Mitchell-Jones A., Amori G., Bogdanowicz W., Krystufek B., ReijndersP., Spitzenberger F., Stubbe M., Thissen J., Vohralik V., Zima J. 1999.Atlas of European mammals. London: Academic Press.
Moore W.S. 1995. Inferring phylogenies from mtDNA variation—mitochondrial-gene trees versus nuclear-gene trees. Evolution.49:718–726.
Nei M. 1987. Molecular evolutionary genetics. New York: ColumbiaUniversity Press.
Nielsen R., Wakeley J. 2001. Distinguishing migration from isolation:a Markov chain Monte Carlo approach. Genetics. 158:885–896.
Petit J.R., Jouzel J., Raynaud D., Barkov N.I., Barnola J.M., Basile I.,Bender M., Chappellaz J., Davis M., Delaygue G., Delmotte M.,
Kotlyakov V.M., Legrand M., Lipenkov V.Y., Lorius C., Pepin L.,Ritz C., Saltzman E., Stievenard M. 1999. Climate and atmospherichistory of the past 420,000 years from the Vostok ice core, Antarc-tica. Nature. 399:429–436.
Pierpaoli M., Riga F., Trocchi V., Randi E. 1999. Species distinction andevolutionary relationships of the Italian hare (Lepus corsicanus) asdescribed by mitochondrial DNA sequencing. Mol. Ecol. 8:1805–1817.
Pietri C., Alves P.C., Melo-Ferreira J. 2011. Hares in Corsica: highprevalence of Lepus corsicanus and hybridization with introducedL. europaeus and L. granatensis. Eur. J. Wildl. Res. 52:313–321.
Posada D. 2008. jModelTest: phylogenetic model averaging. Mol. Biol.Evol. 25:1253–1256.
Rambaut A., Drummond A.J. 2007. Tracer v1.4. Available from:http://beast.bio.ed.ac.uk/Tracer.
Robinson T.J., Matthee C.A. 2005. Phylogeny and evolutionary originsof the Leporidae: a review of cytogenetics, molecular analyses anda supermatrix analysis. Mamm. Rev. 35:231–247.
Roca A.L., Georgiadis N., O’Brien S.J. 2005. Cytonuclear genomic dis-sociation in African elephant species. Nat. Genet. 37:96–100.
Ruedi M., Smith M.F., Patton J.L. 1997. Phylogenetic evidence of mito-chondrial DNA introgression among pocket gophers in New Mex-ico (family Geomyidae). Mol. Ecol. 6:453–462.
Sambrook E., Fritsch F., Maniatis T. 1989. Molecular cloning. ColdSpring Harbour, NY: Cold Spring Harbour Press.
Shimodaira H., Hasegawa M. 1999. Multiple comparisons of log-likelihoods with applications to phylogenetic inference. Mol. Biol.Evol. 16:1114–1116.
Spinks P.Q., Shaffer H.B. 2009. Conflicting mitochondrial and nuclearphylogenies for the widely disjunct ewmys (Testudines: Emydidae)species complex, and what they tell us about biogeography andhybridization. Syst. Biol. 58:1–20.
Stephens M., Donnelly P. 2003. A comparison of Bayesian methodsfor haplotype reconstruction from population genotype data. Am.J. Hum. Genet. 73:1162–1169.
Stephens M., Smith N.J., Donnelly P. 2001. A new statistical methodfor haplotype reconstruction from population data. Am. J. Hum.Genet. 68:978–989.
Stevison L.S., Kohn M.H. 2009. Divergence population genetic analysisof hybridization between rhesus and cynomolgus macaques. Mol.Ecol. 18:2457–2475.
Strasburg J.L., Rieseberg L.H. 2010. How robust are ”Isolation withMigration” analyses to violations of the IM model? A simulationstudy. Mol. Biol. Evol. 27:297–310.
Suchentrunk F., Mamuris Z., Stamatis C., Ben Slimen H., HacklanderK., Haerer G., Giacometti M. 2005. Introgressive hybridizationin wild living mountain hares (L. timidus varronis) and brownhares (L. europaeus) and morphological consequences. Mamm. Biol.70(Suppl.):39–40.
Swofford D.L. 2001. PAUP* phylogenetic analysis using parsimony(and other methods). Sunderland (MA): Sinauer Associates.
Tegelstrom H. 1987. Transfer of mitochondrial DNA from the northernred-backed vole (Clethrionomys rutilus) to the bank vole (C. glareo-lus). J. Mol. Evol. 24:218–227.
Thompson J.D., Higgins D.G., Gibson T.J. 1994. CLUSTAL W: im-proving the sensitivity of progressive multiple sequence alignmentthrough sequence weighting, position-specific gap penalties andweight matrix choice. Nucleic Acids Res. 22:4673–4680.
Thulin C.G., Fang M., Averianov A.O. 2006. Introgression from Lepuseuropaeus to L. timidus in Russia revealed by mitochondrial singlenucleotide polymorphisms and nuclear microsatellites. Hereditas.143:68–76.
Thulin C.G., Jaarola M., Tegelstrom H. 1997. The occurrence of moun-tain hare mitochondrial DNA in wild brown hares. Mol. Ecol.6:463–467.
Wallner B., Huber S., Achmann R. 2001. Non-invasive PCR sexing ofrabbits (Oryctolagus cuniculus) and hares (Lepus europaeus). Mamm.Biol. 66:190–192.
Waltari E., Cook J.A. 2005. Hares on ice: phylogeography and histor-ical demographics of Lepus arcticus, L. othus, and L. timidus (Mam-malia: Lagomorpha). Mol. Ecol. 14:3005–3016.
Wang L., Luzynski K., Pool J.E., Janousek V., Dufkova P., VyskocilovaM.M., Teeter K.C., Nachman M.W., Munclinger P., Macholan M.,
at Universidade do Porto on M
ay 12, 2012http://sysbio.oxfordjournals.org/
Dow
nloaded from

2012 MELO-FERREIRA ET AL.—RECURRENT MTDNA INTROGRESSION AMONG HARES 381
Pialek J., Tucker P.K. 2011. Measures of linkage disequilibriumamong neighbouring SNPs indicate asymmetries across the housemouse hybrid zone. Mol. Ecol. 20:2985–3000.
Waterston R.H., Lindblad-Toh K., Birney E., Rogers J., Abril J.F.,Agarwal P., Agarwala R., Ainscough R., Alexandersson M., AnP., Antonarakis S.E., Attwood J., Baertsch R., Bailey J., BarlowK., Beck S., Berry E., Birren B., Bloom T., Bork P., Botcherby M.,Bray N., Brent M.R., Brown D.G., Brown S.D., Bult C., Burton J.,Butler J., Campbell R.D., Carninci P., Cawley S., ChiaromonteF., Chinwalla A.T., Church D.M., Clamp M., Clee C., CollinsF.S., Cook L.L., Copley R.R., Coulson A., Couronne O., Cuff J.,Curwen V., Cutts T., Daly M., David R., Davies J., Delehaunty K.D.,Deri J., Dermitzakis E.T., Dewey C., Dickens N.J., DiekhansM., Dodge S., Dubchak I., Dunn D.M., Eddy S.R., El-nitski L., Emes R.D., Eswara P., Eyras E., Felsenfeld A.,Fewell G.A., Flicek P., Foley K., Frankel W.N., Fulton L.A.,Fulton R.S., Furey T.S., Gage D., Gibbs R.A., GlusmanG., Gnerre S., Goldman N., Goodstadt L., Grafham D.,Graves T.A., Green E.D., Gregory S., Guigo R., Guyer M.,Hardison R.C., Haussler D., Hayashizaki Y., Hillier L.W., Hin-richs A., Hlavina W., Holzer T., Hsu F., Hua A., Hubbard T., HuntA., Jackson I., Jaffe D.B., Johnson L.S., Jones M., Jones T.A., Joy A.,Kamal M., Karlsson E.K., Karolchik D., Kasprzyk A., KawaiJ., Keibler E., Kells C., Kent W.J., Kirby A., Kolbe D.L., KorfI., Kucherlapati R.S., Kulbokas E.J., Kulp D., Landers T., LegerJ.P., Leonard S., Letunic I., Levine R., Li J., Li M., Lloyd C.,Lucas S., Ma B., Maglott D.R., Mardis E.R., Matthews L., MauceliE., Mayer J.H., McCarthy M., McCombie W.R., McLaren S.,McLay K., McPherson J.D., Meldrim J., Meredith B., MesirovJ.P., Miller W., Miner T.L., Mongin E., Montgomery K.T.,Morgan M., Mott R., Mullikin J.C., Muzny D.M., Nash W.E.,
Nelson J.O., Nhan M.N., Nicol R., Ning Z., Nusbaum C., O’ConnorM.J., Okazaki Y., Oliver K., Overton-Larty E., Pachter L., ParraG., Pepin K.H., Peterson J., Pevzner P., Plumb R., Pohl C.S., Poli-akov A., Ponce T.C., Ponting C.P., Potter S., Quail M., ReymondA., Roe B.A., Roskin K.M., Rubin E.M., Rust A.G., Santos R.,Sapojnikov V., Schultz B., Schultz J., Schwartz M.S., Schwartz S.,Scott C., Seaman S., Searle S., Sharpe T., Sheridan A., ShownkeenR., Sims S., Singer J.B., Slater G., Smit A., Smith D.R., SpencerB., Stabenau A., Stange-Thomann N., Sugnet C., Suyama M.,Tesler G., Thompson J., Torrents D., Trevaskis E., Tromp J., UclaC., Ureta-Vidal A., Vinson J.P., Von Niederhausern A.C., WadeC.M., Wall M., Weber R.J., Weiss R.B., Wendl M.C., West A.P.,Wetterstrand K., Wheeler R., Whelan S., Wierzbowski J., Willey D.,Williams S., Wilson R.K., Winter E., Worley K.C., Wyman D., YangS., Yang S.P., Zdobnov E.M., Zody M.C., Lander E.S. 2002. Initialsequencing and comparative analysis of the mouse genome.Nature. 420:520–562.
Woerner A.E., Cox M.P., Hammer M.F. 2007. Recombination-filteredgenomic datasets by information maximization. Bioinformatics.23:1851–1853.
Won Y.J., Hey J. 2005. Divergence population genetics of chimpanzees.Mol. Biol. Evol. 22:297–307.
Yamada F., Takaki M., Suzuki H. 2002. Molecular phylogeny ofJapanese Leporidae, the Amami rabbit Pentalagus furnessi, theJapanese hare Lepus brachyurus, and the mountain hare Lepustimidus, inferred from mitochondrial DNA sequences. Genes Genet.Syst. 77:107–116.
Zwickl D.J. 2006. Genetic algorithm approaches for the phylogeneticanalysis of large biological sequence datasets under the maximumlikelihood criterion. [PhD. dissertation]. Austin (TX): University ofTexas.
at Universidade do Porto on M
ay 12, 2012http://sysbio.oxfordjournals.org/
Dow
nloaded from