population dynamics and community structure of … · population dynamics and community structure...
TRANSCRIPT
RESEARCH Open Access
Population dynamics and community structureof Anophelesmosquitoes along the China-MyanmarborderYing Wang1, Daibin Zhong2, Liwang Cui3, Ming-Chieh Lee2, Zhaoqing Yang4, Guiyun Yan2 and Guofa Zhou2*
Abstract
Background: Understanding the ecology of malaria vectors such as species composition and population dynamicsis essential for developing cost-effective strategies to control mosquito vector populations.
Methods: Adult mosquitoes (n = 79,567) were collected in five villages along the China-Myanmar border from April2012 to September 2014 using the CDC light trap without bait method. Mosquito community structure, Anophelesspecies composition and diversity were analyzed.
Results: Twenty species of Anopheles mosquitoes were identified, with An. minimus s.l. accounting for 85 % of thetotal collections. Mosquito densities varied from 0.05 females per trap per night (f/t/n) to 3.00 f/t/n, with strongseasonality in all sites and densities peaked from June to August. An. minimus s.l. was predominant (accounting for54–91 % of total captures) in four villages, An. maculatus s.l. was predominant (71 %) in the high elevation village ofDao Nong, and An. culicifacies accounted for 15 % of total captures in the peri-urban area of Simsa Lawk. All 20species have been captured in the Mung Seng Yang village, 18 and 15 species in Ja Htu Kawng and Na Bangrespectively, and nine species in both Simsa Lawk and Dao Nong. Species richness peaked from April to August.Species diversity, species dominance index, and species evenness fluctuated substantially from time to time with noclear seasonality, and varied greatly amongst villages.
Conclusions: Mosquitoes were abundant in the China-Myanmar bordering agricultural area with clear seasonality.Species composition and density were strongly affected by natural environments. The targeted interventionstrategy should be developed and implemented so as to achieve cost-effectiveness for malaria control andelimination along the border areas.
Keywords: Malaria vector, China-Myanmar border, Population dynamics, Population density, Species richness,Species diversity, Seasonality
BackgroundMosquitoes are vectors of various human and animal in-fectious diseases [1]. Vector control is an importantcomponent and sometimes the only effective way (e.g.,for dengue fever) to reduce the transmission of thesediseases [1–5]. Understanding the species compositionand population dynamics of the local mosquitoes is thecrucial step for developing and implementing appropriatestrategies to control mosquito vector populations and sub-sequently the mosquito-borne infectious diseases.
Malaria is one of the major mosquito-borne diseasesendemic to East and Southeast Asia [6–8]. The GreaterMekong Subregion (GMS) is one of the most threaten-ing foci of malaria in Southeast Asia [7–10]. The malariaburden in Myanmar is the heaviest among the GMS na-tions. More than half of the malaria cases and ∼ 75 % ofthe malaria deaths in the GMS occurred in Myanmar[11]. International border regions, such as the oneshared by China and Myanmar’s Kachin State, have thehighest malaria incidence and the highest malaria-related mortality rate, at 7.8 deaths/1000 people [11–13].A large proportion of ethnic minorities live in these re-mote, often hilly and forested border areas, which are
* Correspondence: [email protected] in Public Health, University of California at Irvine, Irvine, CA, USAFull list of author information is available at the end of the article
© 2015 Wang et al. Open Access This article is distributed under the terms of the Creative Commons Attribution 4.0International License (http://creativecommons.org/licenses/by/4.0/), which permits unrestricted use, distribution, andreproduction in any medium, provided you give appropriate credit to the original author(s) and the source, provide a link tothe Creative Commons license, and indicate if changes were made. The Creative Commons Public Domain Dedication waiver(http://creativecommons.org/publicdomain/zero/1.0/) applies to the data made available in this article, unless otherwise stated.
Wang et al. Parasites & Vectors (2015) 8:445 DOI 10.1186/s13071-015-1057-1
prone to malaria transmission by the forest mosquitoesAnopheles minimus s.l. and Anopheles dirus s.l.. TheChinese side of the China-Myanmar border remains asignificant foci of clinical malaria despite significant de-cline of malaria in other parts of China in the past twodecades [14, 15].Effective control of disease vectors requires a good un-
derstanding of vector ecology, including vector distribu-tion, development and population dynamics. Recentachievements in malaria control and enthusiasm frominternational communities have inspired a number ofEast and Southeast Asian countries such as Thailandand China to redirect program strategies from malariacontrol towards elimination. There is an increased focuson studying malaria transmission along the China-Myanmar border; however, mosquito vector ecology inthis area remains almost untouched [16–19]. This lackof information hinders progress toward the goals ofeliminating malaria and controlling other mosquito-borne diseases in the area.The purpose of this study is to acquire critical epidemio-
logical information on vector population ecology by con-ducting field surveys on vector species composition,
species richness, diversity, and population dynamics onboth sides of the China-Myanmar border. The results willhelp to fill important knowledge gaps and aid in develop-ing cost-effective malaria control and elimination strat-egies in the area.
MethodsStudy sitesThis study was conducted at five sites along the China-Myanmar border (Fig. 1). Two of the sites are located inYingjiang county, Yunnan province, China: Na Bang vil-lage, at an elevation of c. 250 m above sea level (a.s.l.)(range from 240 to 270 m), and Dao Nong village, withan elevation of c. 700 m a.s.l. (range from 660 to 740 m).The other three study sites are in the Lai Za district ofKachin State, Myanmar: Simsa Lawk, representing aperi-urban environment, and Ja Htu Kawng and MungSeng Yang villages, representing rural settings. All threesites in Myanmar are located in the same valley whereNa Bang town and Lai Za town are located, at an eleva-tion of c. 250 m a.s.l. (range from 240 to 280 m). All fivestudy sites are surrounded by mountains and compriseeither dense forest (Na Bang and Simsa Lawk), maize
Lai ZaNa Bang
Myanmar
China
International boundary
2 km
Elevation (m)
2100
100
1100
Myanmar
China
Pie chart legend
AnophelesCulex
Aedes
Armigeres
Others
Major town
A. Simsa Lawk
B. Mung Seng Yang
D. Na Bang
C. Ja Htu Kawng
E. Dao Nong
Fig. 1 Locations of the study sites and pie-chart showing mosquito community structure (percentage distribution) along China-Myanmar border.Localities: a Simsa Lawk; b Mung Seng Yang; c Ja Htu Kawng, d Na Bang; and e. Dao Nong
Wang et al. Parasites & Vectors (2015) 8:445 Page 2 of 8

cultivations on slopes (Ja Htu Kawng and Mung SengYang), or white pepper plantations (Dao Nong village).The major habitat type found in all villages was standingwater ponds and fish ponds. The area has a subtropicalclimate, with January through March being relatively dryand cold, and June to August is considered to be the rainysummer season. The annual rainfall is about 1450 mmwith no clear dry season. Annual mean temperature is21.7 °C, with a low of 15 °C in January and high of 25 °Cin July. The caught populations totaled 230, 235, and 510in 2012 in Mung Seng Yang, Ja Htu Kawng, and SimsaLawk respectively; the populations were 470 and 240 (cen-sus includes permanent residents only) in 2012 in NaBang and Dao Nong, respectively.
Mosquito collection and species identificationIn the study sites in China, mosquitoes were collectedfrom systematically selected 68 houses in Na Bang vil-lage and all 48 houses in Dao Nong village from April2012 to April 2013. In Myanmar, mosquitoes were col-lected from systematically selected 31 houses in SimsaLawk, from 34 houses in Ja Htu Kawng, and from all40 houses in Mung Seng Yang, from April 2012 toSeptember 2014. Locations of all sampled houses weredetermined with a handset global positioning system(Additional file 1: Table S1) (Garmin InternationalInc., Olathe, KS, USA). Owners of the surveyed houseswere requested to sign a freely administered informedconsent form covering participation in the study,questionnaire surveys, and monitoring of mosquitopopulation dynamics, i.e., permission to set up the trapsand collect mosquitoes. To conduct the sampling, CDCminiature light traps (BioQuip Products, Inc, RanchoDominguez, CA, USA) without bait were placed in housesat dusk and then collected in the following morning.Traps were placed in the same house for two consecutivenights each sampling occasion. A total of 36 traps weredeployed each night. Traps shifted from house to houseand from village to village over time so that every house ina given village and every village in the study area has beensampled once (2 nights) every two weeks or two times(4 nights) each month. Once collected, mosquitoeswere morphologically separated as Anopheles, Culex,Aedes, and other subfamilies or genera.Anopheles mosquitoes were further morphologically
identified to species or species complex in the fieldwhen possible [20, 21]. Subsample specimen werestored in −20 °C freezer immediately after species orspecies complex was identified and kept frozen untilfurther analysis. The DNA of An. minimus s.l. mosquitoeswas extracted from the abdomen of each mosquito for fur-ther species confirmation [17]. Anopheles collections fromDao Nong, Na Bang, Ja Htu Kawng, and Mung Seng Yangvillages between May 2012 to April 2013 have been used
in previous publication [17], the previous stud only pub-lished the summary of pooled data of all villages and timeframes, and it focused on the role of An. minimus as themalaria vector [17]. In addition to new collections, speciesdiversity, evenness, similarity and their temporal changeswere not determined in the previous study. Inter-villageheterogeneity, e.g., differences in Anopheles densities, spe-cies richness, and diversity, etc. have not been compared.
Data analysisDensity of mosquitoes was calculated as the number offemales per trap per night (f/t/n) and monthly averagewas calculated over all houses in a given village. PooledAnopheles density was calculated by summing across allAnopheles species. Species richness was measured by thenumber of species. Species diversity of Anopheles mos-quitoes was measured using the Simpson diversity index,D, which can be interpreted as the probability of interspe-cific encounter, and Shannon-Weiner index, H, whichtakes into account of individuals of each species [22–25].
The Simpson diversity index is defined as D ¼ 1−XN
i¼1
p2i ,
where pi is the fraction of a species which belong to thei-th species, and N is the number of species. If all speciesare equally distributed, then the index has its highest valueof [1 − (1/N)]; if one species is dominant, then the indexwill approach zero. Other indices calculated included theBerger-Parker dominance index, d, evenness index, E =H/Ln(S), where H is the Shannon-Weiner diversity indexand S is the total number of species observed at a givenvillage, and the Morista-Hoen similarity index, C [25].Mosquito abundance data was transformed by the
power functionffiffiffiffiX4
p, where X is the monthly density, be-
fore comparison and this transformation ensured overalldata normality as required for data comparison usinganalysis such as analysis of variance (ANOVA) and Stu-dent t-test [25, 26]. Differences in monthly average mos-quito abundance (time series) among different villageswere tested using one-way analysis of variance (ANOVA)with repeated measures after data transformation. Pair-wise differences in mosquito abundance were comparedusing the ANOVA post-hoc Tukey-Kramer HSD test orHsu’s MCB test with a significance level of 5 %. Statisticalanalysis was carried out using JMP statistical software(JMP 9.0, SAS Institute Inc., USA).
ResultsOver the study period, a total of 14,786 trap nights wereconducted and 79,567 mosquitoes were collected in thefive villages. Among the mosquitoes captured, the major-ity were Culex (n = 62,828 or 79.0 %), followed byAnopheles (n = 15,410, 19.4 %), Aedes (n = 466, 0.6 %);the remainder belonged to other subfamilies or genera
Wang et al. Parasites & Vectors (2015) 8:445 Page 3 of 8
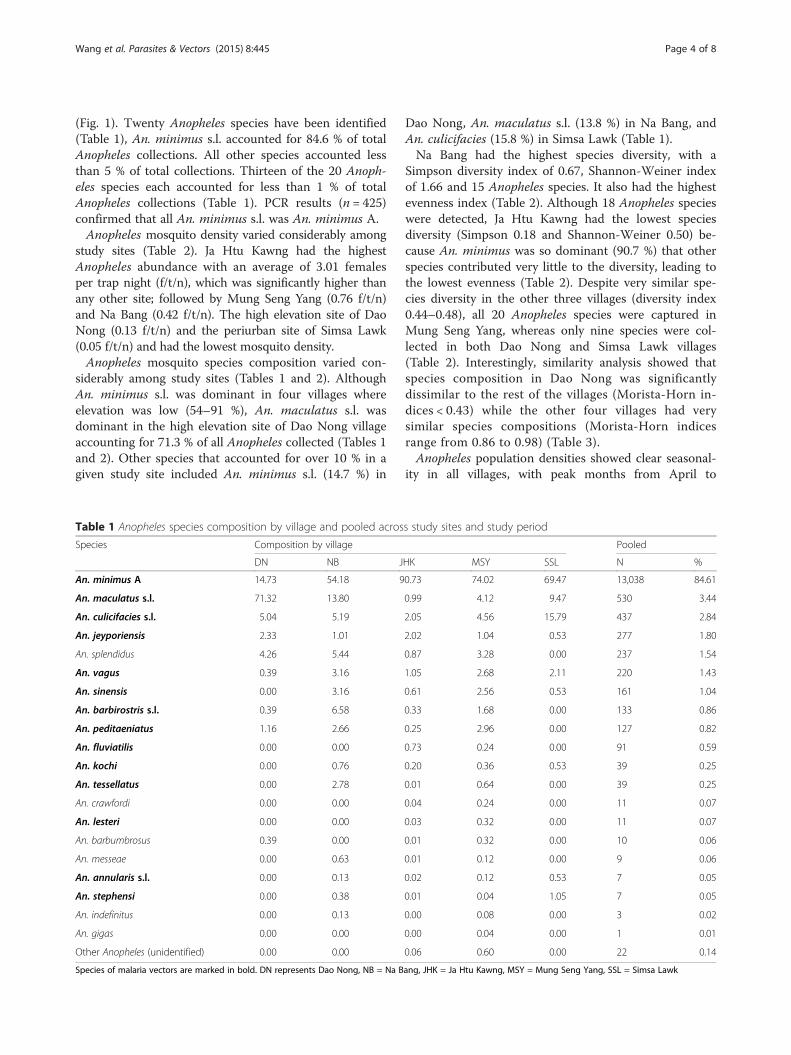
(Fig. 1). Twenty Anopheles species have been identified(Table 1), An. minimus s.l. accounted for 84.6 % of totalAnopheles collections. All other species accounted lessthan 5 % of total collections. Thirteen of the 20 Anoph-eles species each accounted for less than 1 % of totalAnopheles collections (Table 1). PCR results (n = 425)confirmed that all An. minimus s.l. was An. minimus A.Anopheles mosquito density varied considerably among
study sites (Table 2). Ja Htu Kawng had the highestAnopheles abundance with an average of 3.01 femalesper trap night (f/t/n), which was significantly higher thanany other site; followed by Mung Seng Yang (0.76 f/t/n)and Na Bang (0.42 f/t/n). The high elevation site of DaoNong (0.13 f/t/n) and the periurban site of Simsa Lawk(0.05 f/t/n) and had the lowest mosquito density.Anopheles mosquito species composition varied con-
siderably among study sites (Tables 1 and 2). AlthoughAn. minimus s.l. was dominant in four villages whereelevation was low (54–91 %), An. maculatus s.l. wasdominant in the high elevation site of Dao Nong villageaccounting for 71.3 % of all Anopheles collected (Tables 1and 2). Other species that accounted for over 10 % in agiven study site included An. minimus s.l. (14.7 %) in
Dao Nong, An. maculatus s.l. (13.8 %) in Na Bang, andAn. culicifacies (15.8 %) in Simsa Lawk (Table 1).Na Bang had the highest species diversity, with a
Simpson diversity index of 0.67, Shannon-Weiner indexof 1.66 and 15 Anopheles species. It also had the highestevenness index (Table 2). Although 18 Anopheles specieswere detected, Ja Htu Kawng had the lowest speciesdiversity (Simpson 0.18 and Shannon-Weiner 0.50) be-cause An. minimus was so dominant (90.7 %) that otherspecies contributed very little to the diversity, leading tothe lowest evenness (Table 2). Despite very similar spe-cies diversity in the other three villages (diversity index0.44–0.48), all 20 Anopheles species were captured inMung Seng Yang, whereas only nine species were col-lected in both Dao Nong and Simsa Lawk villages(Table 2). Interestingly, similarity analysis showed thatspecies composition in Dao Nong was significantlydissimilar to the rest of the villages (Morista-Horn in-dices < 0.43) while the other four villages had verysimilar species compositions (Morista-Horn indicesrange from 0.86 to 0.98) (Table 3).Anopheles population densities showed clear seasonal-
ity in all villages, with peak months from April to
Table 1 Anopheles species composition by village and pooled across study sites and study period
Species Composition by village Pooled
DN NB JHK MSY SSL N %
An. minimus A 14.73 54.18 90.73 74.02 69.47 13,038 84.61
An. maculatus s.l. 71.32 13.80 0.99 4.12 9.47 530 3.44
An. culicifacies s.l. 5.04 5.19 2.05 4.56 15.79 437 2.84
An. jeyporiensis 2.33 1.01 2.02 1.04 0.53 277 1.80
An. splendidus 4.26 5.44 0.87 3.28 0.00 237 1.54
An. vagus 0.39 3.16 1.05 2.68 2.11 220 1.43
An. sinensis 0.00 3.16 0.61 2.56 0.53 161 1.04
An. barbirostris s.l. 0.39 6.58 0.33 1.68 0.00 133 0.86
An. peditaeniatus 1.16 2.66 0.25 2.96 0.00 127 0.82
An. fluviatilis 0.00 0.00 0.73 0.24 0.00 91 0.59
An. kochi 0.00 0.76 0.20 0.36 0.53 39 0.25
An. tessellatus 0.00 2.78 0.01 0.64 0.00 39 0.25
An. crawfordi 0.00 0.00 0.04 0.24 0.00 11 0.07
An. lesteri 0.00 0.00 0.03 0.32 0.00 11 0.07
An. barbumbrosus 0.39 0.00 0.01 0.32 0.00 10 0.06
An. messeae 0.00 0.63 0.01 0.12 0.00 9 0.06
An. annularis s.l. 0.00 0.13 0.02 0.12 0.53 7 0.05
An. stephensi 0.00 0.38 0.01 0.04 1.05 7 0.05
An. indefinitus 0.00 0.13 0.00 0.08 0.00 3 0.02
An. gigas 0.00 0.00 0.00 0.04 0.00 1 0.01
Other Anopheles (unidentified) 0.00 0.00 0.06 0.60 0.00 22 0.14
Species of malaria vectors are marked in bold. DN represents Dao Nong, NB = Na Bang, JHK = Ja Htu Kawng, MSY = Mung Seng Yang, SSL = Simsa Lawk
Wang et al. Parasites & Vectors (2015) 8:445 Page 4 of 8
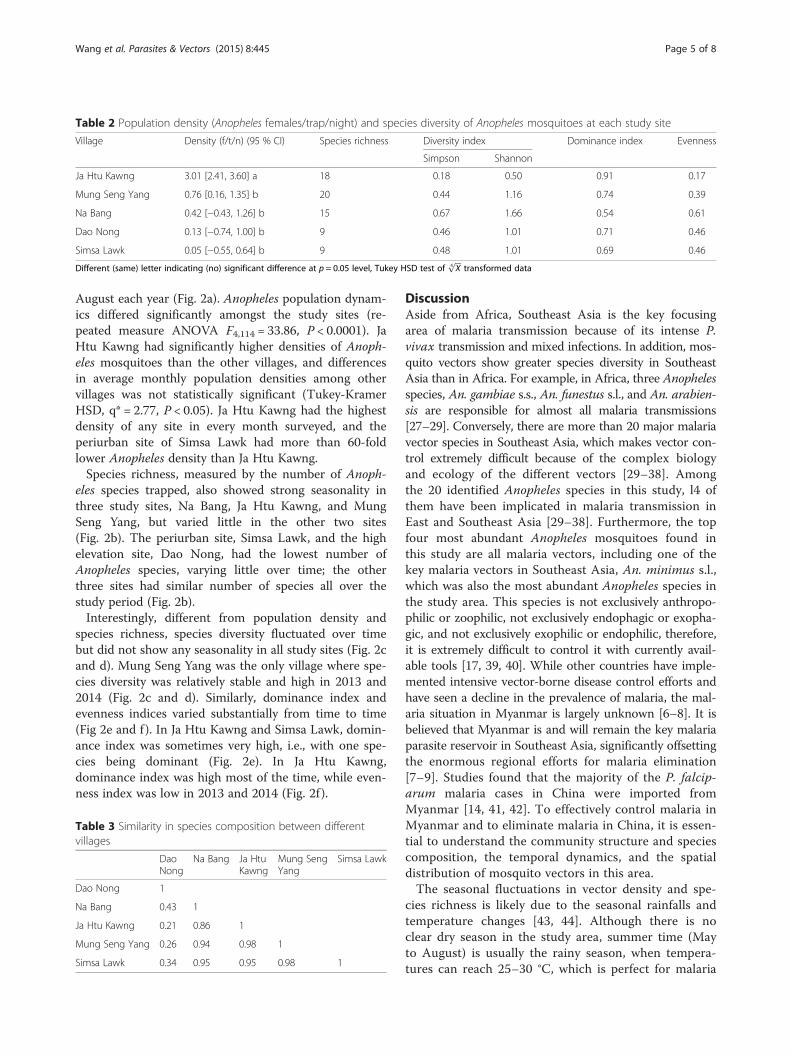
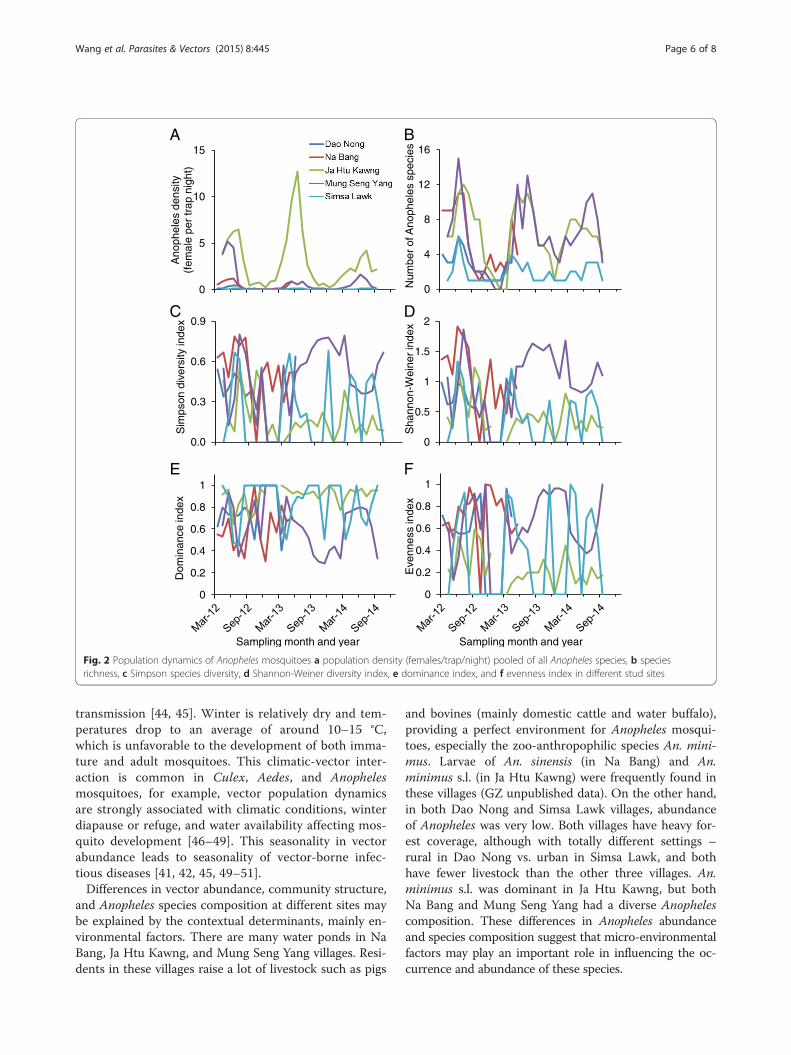
August each year (Fig. 2a). Anopheles population dynam-ics differed significantly amongst the study sites (re-peated measure ANOVA F4,114 = 33.86, P < 0.0001). JaHtu Kawng had significantly higher densities of Anoph-eles mosquitoes than the other villages, and differencesin average monthly population densities among othervillages was not statistically significant (Tukey-KramerHSD, q* = 2.77, P < 0.05). Ja Htu Kawng had the highestdensity of any site in every month surveyed, and theperiurban site of Simsa Lawk had more than 60-foldlower Anopheles density than Ja Htu Kawng.Species richness, measured by the number of Anoph-
eles species trapped, also showed strong seasonality inthree study sites, Na Bang, Ja Htu Kawng, and MungSeng Yang, but varied little in the other two sites(Fig. 2b). The periurban site, Simsa Lawk, and the highelevation site, Dao Nong, had the lowest number ofAnopheles species, varying little over time; the otherthree sites had similar number of species all over thestudy period (Fig. 2b).Interestingly, different from population density and
species richness, species diversity fluctuated over timebut did not show any seasonality in all study sites (Fig. 2cand d). Mung Seng Yang was the only village where spe-cies diversity was relatively stable and high in 2013 and2014 (Fig. 2c and d). Similarly, dominance index andevenness indices varied substantially from time to time(Fig 2e and f). In Ja Htu Kawng and Simsa Lawk, domin-ance index was sometimes very high, i.e., with one spe-cies being dominant (Fig. 2e). In Ja Htu Kawng,dominance index was high most of the time, while even-ness index was low in 2013 and 2014 (Fig. 2f ).
DiscussionAside from Africa, Southeast Asia is the key focusingarea of malaria transmission because of its intense P.vivax transmission and mixed infections. In addition, mos-quito vectors show greater species diversity in SoutheastAsia than in Africa. For example, in Africa, three Anophelesspecies, An. gambiae s.s., An. funestus s.l., and An. arabien-sis are responsible for almost all malaria transmissions[27–29]. Conversely, there are more than 20 major malariavector species in Southeast Asia, which makes vector con-trol extremely difficult because of the complex biologyand ecology of the different vectors [29–38]. Amongthe 20 identified Anopheles species in this study, l4 ofthem have been implicated in malaria transmission inEast and Southeast Asia [29–38]. Furthermore, the topfour most abundant Anopheles mosquitoes found inthis study are all malaria vectors, including one of thekey malaria vectors in Southeast Asia, An. minimus s.l.,which was also the most abundant Anopheles species inthe study area. This species is not exclusively anthropo-philic or zoophilic, not exclusively endophagic or exopha-gic, and not exclusively exophilic or endophilic, therefore,it is extremely difficult to control it with currently avail-able tools [17, 39, 40]. While other countries have imple-mented intensive vector-borne disease control efforts andhave seen a decline in the prevalence of malaria, the mal-aria situation in Myanmar is largely unknown [6–8]. It isbelieved that Myanmar is and will remain the key malariaparasite reservoir in Southeast Asia, significantly offsettingthe enormous regional efforts for malaria elimination[7–9]. Studies found that the majority of the P. falcip-arum malaria cases in China were imported fromMyanmar [14, 41, 42]. To effectively control malaria inMyanmar and to eliminate malaria in China, it is essen-tial to understand the community structure and speciescomposition, the temporal dynamics, and the spatialdistribution of mosquito vectors in this area.The seasonal fluctuations in vector density and spe-
cies richness is likely due to the seasonal rainfalls andtemperature changes [43, 44]. Although there is noclear dry season in the study area, summer time (Mayto August) is usually the rainy season, when tempera-tures can reach 25–30 °C, which is perfect for malaria
Table 2 Population density (Anopheles females/trap/night) and species diversity of Anopheles mosquitoes at each study site
Village Density (f/t/n) (95 % CI) Species richness Diversity index Dominance index Evenness
Simpson Shannon
Ja Htu Kawng 3.01 [2.41, 3.60] a 18 0.18 0.50 0.91 0.17
Mung Seng Yang 0.76 [0.16, 1.35] b 20 0.44 1.16 0.74 0.39
Na Bang 0.42 [−0.43, 1.26] b 15 0.67 1.66 0.54 0.61
Dao Nong 0.13 [−0.74, 1.00] b 9 0.46 1.01 0.71 0.46
Simsa Lawk 0.05 [−0.55, 0.64] b 9 0.48 1.01 0.69 0.46
Different (same) letter indicating (no) significant difference at p = 0.05 level, Tukey HSD test offfiffiffiX4
ptransformed data
Table 3 Similarity in species composition between differentvillages
DaoNong
Na Bang Ja HtuKawng
Mung SengYang
Simsa Lawk
Dao Nong 1
Na Bang 0.43 1
Ja Htu Kawng 0.21 0.86 1
Mung Seng Yang 0.26 0.94 0.98 1
Simsa Lawk 0.34 0.95 0.95 0.98 1
Wang et al. Parasites & Vectors (2015) 8:445 Page 5 of 8
transmission [44, 45]. Winter is relatively dry and tem-peratures drop to an average of around 10–15 °C,which is unfavorable to the development of both imma-ture and adult mosquitoes. This climatic-vector inter-action is common in Culex, Aedes, and Anophelesmosquitoes, for example, vector population dynamicsare strongly associated with climatic conditions, winterdiapause or refuge, and water availability affecting mos-quito development [46–49]. This seasonality in vectorabundance leads to seasonality of vector-borne infec-tious diseases [41, 42, 45, 49–51].Differences in vector abundance, community structure,
and Anopheles species composition at different sites maybe explained by the contextual determinants, mainly en-vironmental factors. There are many water ponds in NaBang, Ja Htu Kawng, and Mung Seng Yang villages. Resi-dents in these villages raise a lot of livestock such as pigs
and bovines (mainly domestic cattle and water buffalo),providing a perfect environment for Anopheles mosqui-toes, especially the zoo-anthropophilic species An. mini-mus. Larvae of An. sinensis (in Na Bang) and An.minimus s.l. (in Ja Htu Kawng) were frequently found inthese villages (GZ unpublished data). On the other hand,in both Dao Nong and Simsa Lawk villages, abundanceof Anopheles was very low. Both villages have heavy for-est coverage, although with totally different settings –rural in Dao Nong vs. urban in Simsa Lawk, and bothhave fewer livestock than the other three villages. An.minimus s.l. was dominant in Ja Htu Kawng, but bothNa Bang and Mung Seng Yang had a diverse Anophelescomposition. These differences in Anopheles abundanceand species composition suggest that micro-environmentalfactors may play an important role in influencing the oc-currence and abundance of these species.
0
5
10
15
Ano
phel
es d
ensi
ty
(fem
ale
per
trap
nig
ht)
0
4
8
12
16
Num
ber
of A
noph
eles
spe
cies
0.0
0.3
0.6
0.9
Sim
pson
div
ersi
ty in
dex
0
0.5
1
1.5
2
Sha
nnon
-Wei
ner
inde
x
0
0.2
0.4
0.6
0.8
1
Dom
inan
ce in
dex
0
0.2
0.4
0.6
0.8
1
Eve
nnes
s in
dex
A B
C D
E F
Sampling month and year Sampling month and year
Fig. 2 Population dynamics of Anopheles mosquitoes a population density (females/trap/night) pooled of all Anopheles species, b speciesrichness, c Simpson species diversity, d Shannon-Weiner diversity index, e dominance index, and f evenness index in different stud sites
Wang et al. Parasites & Vectors (2015) 8:445 Page 6 of 8
It is worth mentioning that the result from this studyis different from the result of the study conducted innorthern Thailand [37], which found that An. minimuss.l. occurs in less disturbed forested area and that defor-estation has negative effects on An. minimus s.l. abun-dance [38]. In our study, An. minimus s.l. was mostabundant in deforested areas such as Ja Htu Kawng andMung Seng Yang villages and it was less abundant in theforested areas such as Na Bang and Dao Nong. In theThailand study, breeding habitats were mainly foundalong streams outside the villages, whereas in this study,habitats were mainly standing water ponds within thevillage (GZ personal observations), we suspect that thespecies found in the two studies are different. Unfortu-nately, the Thailand study did not mention details aboutthe An. minimus s.l. species. Most of the Anopheles mos-quitoes caught (97 %) were known malaria vectors, in-cluding the key malaria vectors in Southeast Asia An.minimus s.l.. Anopheles sinensis is considered the mostcommon malaria vector in China [32], but it is not com-mon in the study area, perhaps because An. sinensis pre-fers rice paddies and does not like the forest environment.In addition to inter-villages variations in Anopheles dens-ities and species diversity, there is the potential of intra-village heterogeneity, such as house-to-house variations inAnopheles densities and possible spatial clustering, whichis open for further investigation.
ConclusionIn conclusion, this study provides fundamental informa-tion on mosquito abundance and population dynamicsin the China-Myanmar border area. The results indicatethat both vector abundance and species diversity varygreatly from village to village and from season to season.The knowledge gained from this study will be useful fordesigning targeted intervention strategies for malariacontrol in Myanmar and malaria elimination in China.
Additional file
Additional file 1: GPS readings of all surveyed houses. (XLSX 18 kb)
Competing interestsThe authors have declared that they have no competing interests.
Authors’ contributionsGZ, ZY, GY, and LC participated in the development of the protocol. YW andGZ conceived of the study, analysed the data, and wrote the manuscript.MCL was responsible for data management. All authors read and approvedthe final manuscript.
AcknowledgementsWe would like to thank the field staff at the Na Bang station for their effortsin assisting with the collection and identification of mosquitoes. We aregrateful to the Kachin State government for supporting this study in thearea. This study was supported by National Institutes of Health (U19AI089672) and by Emerging Infectious Disease Prevention and Control Key
Laboratory of Guangdong Provincial Higher Education (KLB09007) and theMilitary Scientific Research Project of China (CWS12J017).
Author details1Institute of Tropical Medicine, Third Military Medical University, Chongqing,China. 2Program in Public Health, University of California at Irvine, Irvine, CA,USA. 3Department of Entomology, Pennsylvania State University, UniversityPark, PA, USA. 4Department of Pathogen Biology and Immunology, KunmingMedical University, Kunming, China.
Received: 6 February 2015 Accepted: 26 August 2015
References1. World Health Organization. Vector control for malaria and other mosquito-
borne disease. Geneva: WHO TRS-857; 1995. http://www.who.int/malaria/publications/atoz/who_trs_857/en/. Accessed January 15, 2015.
2. Morrison AC, Zielinski-Gutierrez E, Scott TW, Rosenberg R. Definingchallenges and proposing solutions for control of the virus vector Aedesaegypti. PLoS Med. 2008;5, e68.
3. mal ERACGoVC. A research agenda for malaria eradication: vector control.PLoS Med. 2011;8:e1000401.
4. van den Hurk AF, Ritchie SA, Mackenzie JS. Ecology and geographicalexpansion of Japanese encephalitis virus. Annu Rev Entomol. 2009;54:17–35.
5. Tomori O. Yellow fever in Africa: public health impact and prospects forcontrol in the 21st century. Biomedica. 2002;22:178–210.
6. World Health Organization. World malaria report 2012. Geneva: WHO; 2012.http://www.who.int/malaria/publications/world_malaria_report_2012/report/en/.Accessed January 15, 2015.
7. Cui L, Yan G, Sattabongkot J, Cao Y, Chen B, Chen X, et al. Malaria in the GreaterMekong Subregion: heterogeneity and complexity. Acta Trop. 2012;121:227–39.
8. Delacollette C, D’Souza C, Christophel E, Thimasarn K, Abdur R, Bell D, et al.Malaria trends and challenges in the Greater Mekong Subregion. SoutheastAsian J Trop Med Public Health. 2009;40:674–91.
9. Gething PW, Elyazar IR, Moyes CL, Smith DL, Battle KE, Guerra CA, et al. Along neglected world malaria map: Plasmodium vivax endemicity in 2010.PLoS Negl Trop Dis. 2012;6, e1814.
10. Battle KE, Gething PW, Elyazar IR, Moyes CL, Sinka ME, Howes RE, et al. The globalpublic health significance of Plasmodium vivax. Adv Parasitol. 2012;80:1–111.
11. World Health Organization. World malaria report 2008. Geneva: WHO; 2008.http://www.who.int/malaria/publications/atoz/9789241563697/en/. AccessedJanuary 15, 2015.
12. World Health Organization. Malaria in the Great Mekong Subregion:Regional and Country Profile. WHO Southeast Asia and Western PacificRegion, India. 2010. http://www.searo.who.int/entity/malaria/documents/Mekong_pro/en/. Accessed January 15, 2015.
13. World Health Organization. World malaria report 2010. Geneva: WHO; 2010. http://www.who.int/malaria/world_malaria_report_2010/en/. Accessed January 15, 2015.
14. Xia ZG, Yang MN, Zhou SS. Malaria situation in the People’s Republic ofChina in 2011. Chin J Parasitol Parasitic Dis. 2012;30:419–22 [In Chinese].
15. Lin H, Lu L, Tian L, Zhou S, Wu H, Bi Y, et al. Spatial and temporaldistribution of falciparum malaria in China. Malar J. 2009;8:130.
16. Yan J, Li N, Wei X, Li P, Zhao Z, Wang L, et al. Performance of two rapiddiagnostic tests for malaria diagnosis at the China-Myanmar border area.Malar J. 2013;12:73.
17. Yu G, Yan G, Zhang N, Zhong D, Wang Y, He Z, et al. The Anophelescommunity and the role of Anopheles minimus on malaria transmission onthe China-Myanmar border. Parasit Vectors. 2013;6:264.
18. Zhou X, Li SG, Chen SB, Wang JZ, Xu B, Zhou HJ, et al. Co-infections withBabesia microti and Plasmodium parasites along the China-Myanmar border.Infect Dis Poverty. 2013;2:24.
19. Moore SJ, Min X, Hill N, Jones C, Zaixing Z, Cameron MM. Border malaria inChina: knowledge and use of personal protection by minority populationsand implications for malaria control: a questionnaire-based survey. BMCPublic Health. 2008;8:344.
20. Dong SH. The mosquito fauna of Yunnan, vol. 1. Kunming: YunnanPublishing Group; 2010. p. 394.
21. Dong SH, Zhou HN, Gong ZD. The mosquito fauna of Yunnan, vol. 2.Kunming: Yunnan Publishing Group; 2010. p. 750.
22. Alatalo R, Alatalo R. Components of diversity: multivariate analysis withinteraction. Ecology. 1977;58:900–6.
Wang et al. Parasites & Vectors (2015) 8:445 Page 7 of 8
23. Norris JL, Pollock KH. Non-parametric MLE for Poisson species abundancemodels allowing for heterogeneity between species. Environ Ecol Stat.1998;5:391–402.
24. Kweka EJ, Zhou G, Munga S, Lee MC, Atieli HE, Nyindo M, et al. Anophelinelarval habitats seasonality and species distribution: a prerequisite foreffective targeted larval habitats control programmes. PLoS One.2012;7, e52084.
25. Southwood TRE, Henderson PA. Ecological methods. Blackwell science.2000. p. 575.
26. Legendre P, Legendre L. Numerical ecology. 2nd ed. Amsterdam: Elsevier;1998. p. 853.
27. Zhou G, Afrane YA, Vardo-Zalik AM, Atieli H, Zhong D, Wamae P, et al.Changing patterns of malaria epidemiology between 2002 and 2010 inwestern Kenya: the fall and rise of malaria. PLoS One. 2011;6, e20318.
28. Sinka ME, Bangs MJ, Manguin S, Rubio-Palis Y, Chareonviriyaphap T, Coetzee M,et al. A global map of dominant malaria vectors. Parasit Vectors. 2012;5:69.
29. Sinka ME, Bangs MJ, Manguin S, Chareonviriyaphap T, Patil AP, TemperleyWH, et al. The dominant Anopheles vectors of human malaria in the Asia-Pacific region: occurrence data, distribution maps and bionomic precis.Parasit Vectors. 2011;4:89.
30. Elyazar IR, Sinka ME, Gething PW, Tarmidzi SN, Surya A, Kusriastuti R, et al.The distribution and bionomics of Anopheles malaria vector mosquitoes inIndonesia. Adv Parasitol. 2013;83:173–266.
31. Alam MS, Khan MG, Chaudhury N, Deloer S, Nazib F, Bangali AM, et al.Prevalence of Anopheline species and their Plasmodium infection status inepidemic-prone border areas of Bangladesh. Malar J. 2010;9:15.
32. Zhu G, Xia H, Zhou H, Li J, Lu F, Cao J, et al. Susceptibility of Anophelessinensis to Plasmodium vivax in malarial outbreak areas of central China.Parasit Vectors. 2013;6:176.
33. Zollner GE, Ponsa N, Garman GW, Poudel S, Bell JA, Sattabongkot J, et al.Population dynamics of sporogony for Plasmodium vivax parasites fromwestern Thailand developing within three species of colonized Anophelesmosquitoes. Malar J. 2006;5:68.
34. Singh N, Chand SK, Bharti PK, Singh MP, Chand G, Mishra AK, et al.Dynamics of forest malaria transmission in Balaghat district, MadhyaPradesh, India. PLoS One. 2013;8, e73730.
35. Bashar K, Tuno N, Ahmed TU, Howlader AJ. False positivity of circumsporozoiteprotein (CSP)-ELISA in zoophilic anophelines in Bangladesh. Acta Trop.2013;125:220–5.
36. Rattanarithikul R, Konishi E, Linthicum KJ. Detection of Plasmodium vivaxand Plasmodium falciparum circumsporozoite antigen in anophelinemosquitoes collected in southern Thailand. Am J Trop Med Hyg.1996;54:114–21.
37. Overgaard HJ, Tsuda Y, Suwonkerd W, Takagi M. Characteristics of Anophelesminimus (Diptera: Culicidae) larval habitats in Northern Thailand. EnvironEntomol. 2002;31:134–41.
38. Garros C, Koekemoer LL, Coetzee M, Coosemans M, Manguin S. A singlemultiplex assay to identify major malaria vectors within the AfricanAnopheles funestus and the Oriental An. minimus groups. Am J Trop MedHyg. 2004;70:583–90.
39. Chareonviriyaphap T, Bangs MJ, Suwonkerd W, Kongmee M, Corbel V,Ngoen-Klan R. Review of insecticide resistance and behavioral avoidance ofvectors of human diseases in Thailand. Parasit Vectors. 2013;6:280. Review.
40. Hii J, Rueda LM. Malaria vectors in the Greater Mekong Subregion: overviewof malaria vectors and remaining challenges. Southeast Asian J Trop MedPublic Health. 2013;44 Suppl 1:73–165. Review.
41. Li N, Parker DM, Yang Z, Fan Q, Zhou G, Ai G, et al. Risk factors associatedwith slide positivity among febrile patients in a conflict zone of north-eastern Myanmar along the China-Myanmar border. Malar J. 2013;12:361.
42. Zhou G, Sun L, Xia R, Duan Y, Xu J, Yang H, et al. Clinical malaria along theChina-Myanmar border, Yunnan Province, China, January 2011-August 2012.Emerg Infect Dis. 2014;20:675–8.
43. Bouma MJ. Methodological problems and amendments to demonstrateeffects of temperature on the epidemiology of malaria. A new perspectiveon the highland epidemics in Madagascar, 1972–89. Trans R Soc Trop MedHyg. 2003;97:133–9.
44. Kristan M, Abeku TA, Beard J, Okia M, Rapuoda B, Sang J, et al. Variations inentomological indices in relation to weather patterns and malaria incidencein East African highlands: implications for epidemic prevention and control.Malar J. 2008;7:231.
45. Paaijmans KP, Blanford S, Bell AS, Blanford JI, Read AF, Thomas MB. Influenceof climate on malaria transmission depends on daily temperature variation.PNAS. 2010;107:15135–9.
46. Sithiprasasna R, Linthicum KJ, Liu GJ, Jones JW, Singhasivanon P. Someentomological observations on temporal and spatial distribution of malariavectors in three villages in northwestern Thailand using a geographicinformation system. Southeast Asian J Trop Med Public Health. 2003;34:505–16.
47. Ebrahimi B, Shakibi S, Foster WA. Delayed egg hatching of Anophelesgambiae (Diptera: Culicidae) pending water agitation. J Med Entomol.2014;51:580–90.
48. Tsunoda T, Cuong TC, Dong TD, Yen NT, Le NH, Phong TV, et al. Winterrefuge for Aedes aegypti and Ae. albopictus mosquitoes in Hanoi duringWinter. PLoS One. 2014;9:e95606.
49. Tian HY, Bi P, Cazelles B, Zhou S, Huang SQ, Yang J, et al. Howenvironmental conditions impact mosquito ecology and Japaneseencephalitis: an eco-epidemiological approach. Environ Int. 2015;79:17–24.
50. Midekisa A, Beyene B, Mihretie A, Bayabil E, Wimberly MC. Seasonalassociations of climatic drivers and malaria in the highlands of Ethiopia.Parasit Vectors. 2015;8:339.
51. Srimath-Tirumula-Peddinti RC, Neelapu NR, Sidagam N. Association ofclimatic variability, vector population and malarial disease in District ofVisakhapatnam, India: a modeling and prediction analysis. PLoS One.2015;10, e0128377.
Submit your next manuscript to BioMed Centraland take full advantage of:
• Convenient online submission
• Thorough peer review
• No space constraints or color figure charges
• Immediate publication on acceptance
• Inclusion in PubMed, CAS, Scopus and Google Scholar
• Research which is freely available for redistribution
Submit your manuscript at www.biomedcentral.com/submit
Wang et al. Parasites & Vectors (2015) 8:445 Page 8 of 8