population projection and policy implications for
TRANSCRIPT
June 1999
POPULATION PROJECTION AND POLICYIMPLICATIONS FOR EDUCATION:
A DISCUSSION WITH REFERENCE TO KERALA
P.K. Michael Tharakan & K. Navaneetham
Working Paper No. 296
brought to you by COREView metadata, citation and similar papers at core.ac.uk
provided by IDS OpenDocs


An earlier version of this paper was presented at an internal seminar in
the Centre for Development Studies and in a Workshop on Major Issues
in School Education with reference to Protected Teachers, Uneconomic
Schools, School Age Population, Teacher Pupil Ratio etc. organised by
the Kerala State Planning Board on 18 July 1998. We are grateful to the
participants at both these sessions and to an unknown referee for their
POPULATION PROJECTION AND POLICYIMPLICATIONS FOR EDUCATION:
A DISCUSSION WITH REFERENCE TO KERALA
P. K. Michael Tharakan
and
K. Navaneetham
Centre for Development Studies
Thiruvananthapuram
June 1999
4
ABSTRACT
In the context of high levels of public expenditure, alreadycommitted to the educational sector in States like Kerala, it is arguedthat there should be restrictions on further investment. Such argumentsare apparently supported by the fact that the birth rate is declining andtherefore it will result in lesser number of school age population. Sincethis trend directly affect the elementary education sector-the mostsensitive- it is important to project the school age populations withrealistic assumptions. This study uses the recent information on the trendsin fertility and reproductive preferences to make a realistic futureassumption on fertility. Since the total fertility rate (TFR) is distorted bythe changes in the timing of child bearing, the initial level of TFR wasadjusted in the projection assumption. Among the three assumptions used(high, medium and low) the medium variant shows that the fall in schoolgoing age population will be around 3.29 lakhs between 1991 and 2001.However, there will be an increase in the school age population of around2.37 lakhs between 2001 and 2006 and 1.54 lakhs between 2001 and2011. Therefore, the fruits of fertility decline will be realized fully afterthe year 2011 only. In that context, built up school space should not bediverted for use outside schooling purposes; but should be used withinthe same sector for qualitative upgradation. Decelerating birth rate andits expected impact upon primary school enrolment, by itself cannot beconsidered as cause enough to withdraw public investment. Such over-all impact will hide within it, level-wise changes of demand for education,from lower to higher school classes, particularly within the relativelyeducationally 'backward' districts and communities. Therefore, thedecelerating birth rate should be carefully monitored. Taking into accountits trend and location, further public investment should be reorientedand rationalized. To close schools purely on the basis of deceleratingdemographic trends will be counterproductive to the nationally andinternationally accepted objective of education for all.
JEL Classification: I2, I20
Key Words: population projection, uneconomical schools, school age
population, educational planning, education policy, Kerala

5
1. Introduction
The World Conference on Education for All (WCEFA) in Jomtein,
Thailand, in March 1990, and the summit of nine highly populous
countries in Delhi, in December 1993, have set the goal of minimum
level of basic education for all persons by the year 2000 or thereabouts.
This target was evolved upon a consensus about positive interaction
between education and development. Education can play a crucial role
both in enlarging peoples’ income-earning opportunities and in enabling
them to achieve a better quality of life at a given level of income [Dreze.
J and Saran. M, 1993, 5]. The argument that education is to be considered
as a fundamental right is gathering strength. This idea is embodied in
the proposed 83rd constitutional amendment introduced in the Rajya Sabha
in July 1997 [PROBE/CDE, 1999, 1]. The target of a minimum level of
basic education enjoins upon governments to make priority investments
in the sector of primary education. Literacy programmes like Total
Literacy Campaigns [TLC] are equally important for attaining Education
For All (EFA). A significant component of the TLC is oriented towards
adult population. Such programmes depend upon voluntary action and
efforts of Non-Governmental Organisations (NGOs) along with co-
ordination by Governmental bodies [see Tharakan, P.K.M, 1990]. In the
case of primary education, public responsibility cannot be avoided. In

6
this sector, the most significant component of educational transaction is
through formal institutions. The principal institutional mechanism for
developing human skill and knowledge is through the formal educational
system. Formal institutional instruction requires school buildings and
other accessories, teachers’ training, teaching and learning materials etc.
These can be provided by government and non-governmental agencies;
as the educational history of Kerala State shows [Tharakan, P.K.M, 1984].
Since in developing societies, the clientele for primary education come
mostly from economically weaker sections , private activity guided by
market signals alone cannot provide effective basis for its promotion
[Dreze. J. and Saran. M, 1993, 7-8; World Bank, 1991, 11]. Education
at the elementary level cannot be expanded solely based on short run
economic considerations. It is understandable that governments will share
the responsibility of mobilizing resources for achieving EFA with NGOs
and voluntary and private agencies. The elementary education sector is
too important to be left to the market forces alone and it should come
under the direct control and responsibility of the governments [Varghese,
N.V, 1991, 186-197]. Whatever be the merits of NGOs, voluntary and
private organisations, they cannot be expected to replace government
investment in total, in providing institutional and infrastructural
requirements for a major target like EFA. The ultimate responsibility
will be that of the government.
States like Kerala [which have already done well in elementary
education], seems to earmark a portion of responsibility for further
promotion to private [i.e., non-government] agencies. With the State
spending 29.5 per cent of its budgeted expenditure and 7.5 per cent of its
State Domestic Product [SDP] for education in 1993-94 [MOHRD, 1994],
Kerala’s public resources are heavily committed already to education.
Kerala’s per capita government expenditure on education is also very
high and is way ahead of the all-India average [Tyagi, P.N., 1991, p.114].

7
On the other hand, there are evidences that private educational institutions
do well in inparting education1 . Already, there are several arguments on
the basis of micro-level efficiency and of short-term financial gains in
favour of privatisation of educational institutions [Shah, K.R, 1993, 215-
222]. In this context it will be rational to streamline and restrict public
expenditure found avoidable in education. The Kerala State Resource
Commission [KSRC] identified ‘uneconomical’ schools2 in early 1990s
on the basis of low enrolments. There was a subsequent decision of the
Directorate of Public Instruction [DPI] to close down some schools. This
can be seen as a step towards rationalising government expenditure in
education. The schools recommended for closure and the schools actually
closed; include private (government aided) schools as well. In Kerala,
from 1957 onwards, major expenditure like maintenance grant and
teachers’ salary, of all private schools, except the unaided schools, are
1 There are observations from different parts of India about “better” products ofprivate education. With regard to secondary education in Colombia, the DominicanRepublic, the Philippines, Tanzania and Thailand it was found that private schoolstudents generally outperform public school students on standardised marks andlanguage tests, even after holding constant for the fact that on an average, privateschool students come from more advantaged backgrounds than their public schoolcounterparts [Paqueo, U. 1991, 205-218].
2 The exact number of schools identified as ‘uneconomical’ on the basis of lowenrolment are not known accurately. The Malayala Manorama (6 March, Saturday,1993) reported that the State Resource Commission recommended that 485 schoolsidentified as uneconomical are to be closed immediately. The same newspaperreported [Malayala Manorama, 19 May, Tuesday, 1992] that a three membercommittee headed by DPI recommended that only 87 from the 607 schoolsidentified as uneconomical are to be closed. They wanted schools run by localbodies and Fisheries and Tribal schools to be deleted from the list of schools to beclosed. According to the estimate of the committee around 2000 students willhave to find readmission if these 87 schools are closed. They are to beaccommodated by government or Aided schools. Around 600 teachers who arelikely to be out of work are to be “protected” and are to be accommodated bygovernment schools. Those working in corporate management schools shouldbe accommodated by the same management in other schools . The policy of closing‘uneconomical schools’ seems to have changed or suspended for the time being.

8
borne by government [Mathew, A, 1987, 174-175]. Running such schools
involve considerable financial responsibility for the Government since
the financial returns in terms of fees from these schools as well as from
government schools are very low. Therefore it was reasonable to decide
that financial responsibility of the governemnt should be restricted by
closing such schools which are bound to be unsustainable. On the other
hand, it was also reasonable to let unaided private schools with less
governmental financial responsibility and supervision to be continued3 .
There could be also a demographic argument for lessening public
investment in basic education. The population growth rate in India as a
whole was at its peak in 1961-81, with growth rate being 2.2 per cent
per annum. In 1971-81 fertility started declining and during the decade
1981-91, the rate of population growth declined to 2.1 per cent [GOI,
MOHRD, 1993, 9]. The consequent deceleration has differed from region
to region [see Prakash. S and Debal.P, 1992, 139-153]. Kerala being a
State with perceptible deceleration in population growth, and having
already high literacy rates, there are strong arguments for reducing
government expenditure on elementary education on strictly demographic
grounds. The Kerala State Planning Board which was in position from
1991 to 1996 commissioned studies in this regard and at least one such
study has recommended reduction of the number of schools and
governmental investment [SPB, 1994]. Such a policy measure is also
3 The previous minister of Education of Kerala while answering a calling attentionmotion had reportedly said in the Kerala legislature that in places where they willnot disturb the functioning of government, or aided schools, unaided schools canbe allowed [Malayalam Manorama, 17 March, Wednesday, 1993]. In anotheroccasion he has stated that whatever be the financial problems of the state, aidedand unaided schools will be permitted [Malayalam Manorama, 23 August, Monday,1993]. It will be worthwhile to see whether the unaided schools allowed in recentyears have followed any such criteria or not. The 1987-1991 ministry headed bySri. E. K. Nayanar did not allow any new unaided schools.

9
suggested by the World Bank Study on Primary Education in India [WB,
1997, 50-51]. In the context of such strong arguments we are undertaking
an exercise here to project population trends for Kerala, to see what kind
of policy formulations are necessary and feasible with regard to public
investment in education. Whether a decelerating trend in school going
age population alone should automatically lead to reduction of
educational facilities or not, is also examined. This question is attempted
to be answered in the over-all context of nationally and internationally
committed targets of EFA.
2. Population Projection of Kerala
In this section, we project the population up to the year 2026. From
the projected population, we derive the school age population (5-14) in
single year age. The smoothed age- sex distribution of 1991 census is
used as a base year population [Registrar General, 1996]. Projections
are made for every five years since 1991. We have used PEOPLE
projection software and it uses the cohort component method for
projecting the population by age and sex. For more details on the software
and the method, please see Groenewold and Navaneetham, 1998. The
important aspect in the population projection is to formulate a realistic
future assumption on the fertility, mortality and migration trends and
patterns. Although we do not exactly know what the likely future levels
and patterns in the three components, we may be able to develop
assumptions with good approximation on the basis of the current and
past information.
2.1. Fertility Assumption
Realistic assumptions on future fertility levels are important and
crucial to make inferences about the future size and structure of the
population, particularly at the school going age populations. We have
10
made three different projections namely high variant, medium variant
and low variant based on three fertility assumptions in order to have a
lower and upper limits of the future school age population.
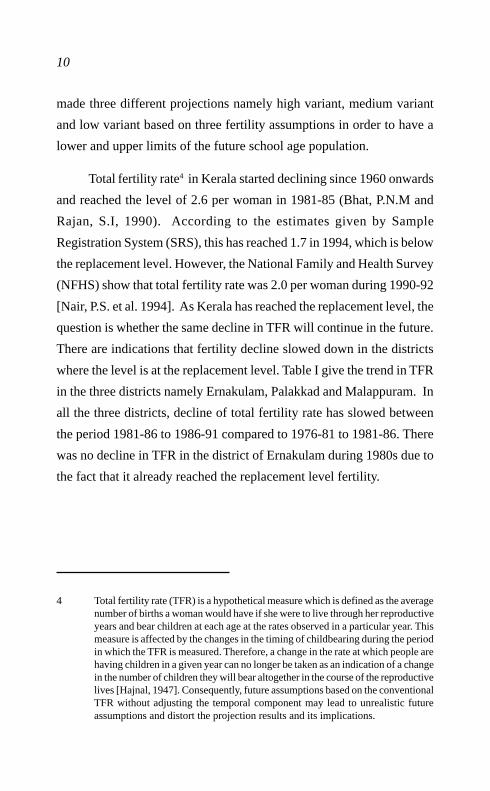
Total fertility rate4 in Kerala started declining since 1960 onwards
and reached the level of 2.6 per woman in 1981-85 (Bhat, P.N.M and
Rajan, S.I, 1990). According to the estimates given by Sample
Registration System (SRS), this has reached 1.7 in 1994, which is below
the replacement level. However, the National Family and Health Survey
(NFHS) show that total fertility rate was 2.0 per woman during 1990-92
[Nair, P.S. et al. 1994]. As Kerala has reached the replacement level, the
question is whether the same decline in TFR will continue in the future.
There are indications that fertility decline slowed down in the districts
where the level is at the replacement level. Table I give the trend in TFR
in the three districts namely Ernakulam, Palakkad and Malappuram. In
all the three districts, decline of total fertility rate has slowed between
the period 1981-86 to 1986-91 compared to 1976-81 to 1981-86. There
was no decline in TFR in the district of Ernakulam during 1980s due to
the fact that it already reached the replacement level fertility.
4 Total fertility rate (TFR) is a hypothetical measure which is defined as the averagenumber of births a woman would have if she were to live through her reproductiveyears and bear children at each age at the rates observed in a particular year. Thismeasure is affected by the changes in the timing of childbearing during the periodin which the TFR is measured. Therefore, a change in the rate at which people arehaving children in a given year can no longer be taken as an indication of a changein the number of children they will bear altogether in the course of the reproductivelives [Hajnal, 1947]. Consequently, future assumptions based on the conventionalTFR without adjusting the temporal component may lead to unrealistic futureassumptions and distort the projection results and its implications.

11
Table I. Trends in total fertility rate in selected districts of Kerala
Districts TFR % decline % decline between 1976-81 between 1981-86
1976-81 1981-86 1986-91 to 1981-86 to 1986-91
Ernakulam 3.39 2.13 2.12 37 Negligible
Palakkad 4.37 3.23 2.78 26 14
Malappuram 5.76 4.37 3.67 24 16
Three dist.combined 4.49 3.22 2.84 28 12
Source: Zachariah, K.C. et al. (1994).
One method to project the future fertility is to analyse the desire
for additional children and current desired family size preferences of
couples. Table II gives the fertility preferences of currently married
women according to the number of living children from NFHS, 1992-
93. On the whole, 28 percent of women say that they want another child.
Among those who had one child, 80 per cent of them said that they want
to have another child in the future. Therefore, it is clear that majority of
them prefer to have at least two children. Also another survey
(Zachariah , K.C. et al, 1994 ) indicates that only 21 percent of women
without surviving sons reported that they do not want to have an additional
child. In other words, it is evident that most couple wants to limit their
family size with at least two children after having a son5 . When asked
about the ideal number of children that they wanted it was reported that
an average of 2.6 children were considered an ideal in Kerala. Those
women who have either no child or one child have reported that 2.3 and
5 It is also observed from the Kerala Fertility survey [Zachariah. K.C et al. 1994]that women who go for the permanent method of population control (sterilization)had an average of 2.8 surviving children in Ernakulam (1.5 boys and 1.3 girls),3.4 children in Palakkad (1.7 boys and 1.7 girls) and 3.9 surviving children inMalappuram (2.1 boys and 1.8 girls).

12
2.2 children respectively would be their ideal family size. The same
question was asked to the younger women and it was reported that the
ideal family size would be 2.6 children among women in the age group
15-19 and 2.7 children among the women in the age group 20-24. These
young women are going to determine the future levels of fertility. The
Kerala Fertility Survey [Zachariah K.C. et al., 1994] also shows that
the desired family size for the women in the age group of 15-19 is around
2.7 children (an average in the three surveyed districts namely Ernakulam,
Palakkad and Malappuram). Even in Ernakulam where we have already
achieved total literacy, women in this age group reported that they wanted
to have an average of two children. Allowing for changes in the attitude
towards children in future due to changes in their socio-economic
conditions, the total fertility rate can be lower than the desired family
size reported now. Hence, if the desired family size is 2.5 children, now,
they will be ending up having at least two children in their reproductive
life in the next 30 years.
Table II. Distribution of currently married women by desire for children
according to number of living children, 1992-93, Kerala
Desire for Children survivingadditionalchildren 0 1 2 3 + Total
Want more 85.8 80.0 13.0 6.8 28.0Want no more 1.5 11.2 26.8 17.9 19.3Sterilized 2.2 5.3 57.2 71.5 48.3Undecided/uptogod 3.3 1.3 2.0 2.2 2.4Infecund 6.6 2.1 0.6 1.3 1.8
Missing 0.7 - 0.3 .6 .2
Total 100 100 100 100 100
Source: National Family Health Survey 1992-93, Kerala

13
We have made three fertility assumptions namely high, medium
and low variant. The medium variant is the most likely trend in the future
level of fertility. The other two variants considered as realistic upper and
lower limits of the future fertility trends. In the high variant projection,
we assume that the total fertility rate will remain constant at the level of
2.0 per woman throughout the projection years. In the case of medium
variant, we assume that there will be a slow decline in TFR and reach
the level 1.8 per woman in 2011 and thereafter remain constant. In the
low variant, it is assumed that TFR will decline moderately and will
reach the level of 1.6 in 2001 and remain constant thereafter.
In all the three variants, we have taken the TFR level of 2.0 during
the base period 1991-96 eventhough the estimates from SRS indicate
the level of 1.7 in 1994. Since TFR is distorted by the changes in the
timing of childbearing (increase in the mean age at childbearing of various
birth order), it has to be adjusted by eliminating the temporal component.
If we make assumptions based on current low level fertility into the
future, it will be misleading the true size of the school age population
and other implications in the future. The tempo adjusted total fertility
rate gives the better understanding of the level and trends of past fertility
and provides a firmer basis for projecting trends in future fertility [For
more details, please see Bongaarts and Feeney, 1998). The analysis carried
out by Bongaarts and Feeney (1998) for Taiwan indicates that the
conventional TFR is .25 births lower than the tempo-adjusted TFR in
the early 1990s. The NFHS 1992-93 reports that median age of
childbearing in Kerala for the first births increased from 20.9 for the age
group of women 45-49 to 22.3 for the age group of women 25-29 (Nair,
P.S., 1995). This gives an indication that mean age at childbearing has
been increasing and might have contributed for depressing the total
fertility rate. Therefore, in our analysis we have assumed a TFR level of

14
2.00 during the period 1991-96 ( approximately 0.25 births above the
observed level of TFR).
Table III . Total fertility rate assumption during the projection period
Total Fertility Rate
Projection period High variant Medium Low variantvariant
1991-96 2.0 2.0 2.01996-01 2.0 2.0 1.92001-06 2.0 1.9 1.82006-11 2.0 1.9 1.72011-16 2.0 1.8 1.62016-21 2.0 1.8 1.6
2021-26 2.0 1.8 1.6
2.2. Mortality Assumption
The life expectancy at birth (average number of years lived by a
new born baby if he/she follows the current age specific mortality
patterns) is projected on the basis of the past experience of increase in
the life expectancy at birth. A logistic growth function was fitted using
trends in life expectancy at birth and it assumes that increase in life
expectancy at birth follows an S-shaped curve. The logic behind using
logistic growth function is that when the life expectancy at birth is very
low, the increase is expected to be slow due to poor health facilities.
Once the health facilities are provided and with improvement in socio-
economic conditions, the life expectancy increases at a faster rate. At
the higher level of life expectancy, the rate of increase is slow and it
would stabilise at the biological maximum. We assumed that the
biological maximum is 80 years for males and 85 years for females. The
survival rate for the projection period on the basis of the projected life
expectancy at birth are derived from the west pattern of Coale and
Demeny model life tables.

15
Table IV. Projected life expectancy at birth
Period Life expectancy at birth
Male Female
1991-96 71.13 76.48
1996-01 72.91 78.38
2001-06 74.37 79.90
2006-11 75.54 81.08
2011-16 76.48 82.00
2016-21 77.23 82.71
2021-26 77.82 83.25
2.3 Migration Assumption
The migration assumption will not greatly influence the school
age population due to selective migration in the adult ages. We assume
that net migration (external and internal combined) from Kerala will be
-300,000 (net loss) for every five-year during the projection period. This
assumption was derived based on the recent estimates on migration given
by Zachariah, 1998. According to his estimates, the net migration from
Kerala, both external and internal combined, was -744,000 during the
decade 1981-91. He has also observed that the net internal (within India)
migration in the decade 1981-91 was less than that in the decade 1971-
81 and he believes that out migration from Kerala to other states of India
would decrease in the future. Therefore, we assume that net migration
from Kerala within India would decrease in the future as well as the
present volume of migration flow to other countries would continue.
Taking this into account, we have assumed that net migration would be
around -153,000 for males and -147,000 for females for every five-year,
during the projection period.

16
2.4. Results of the Population Projections
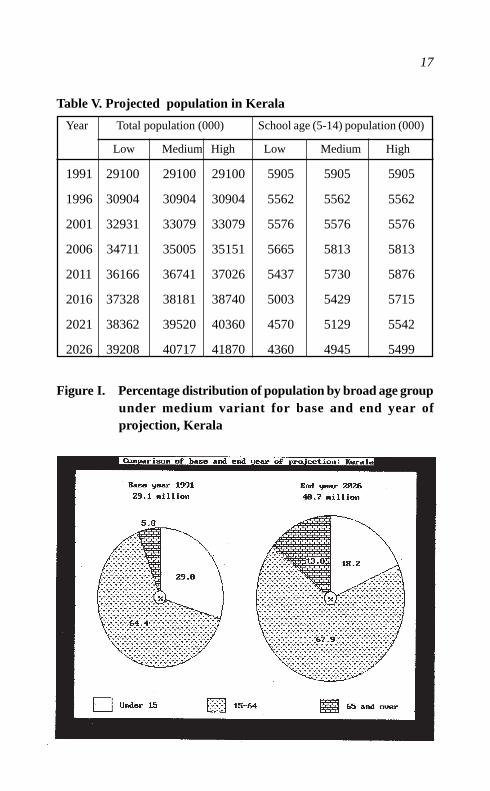
Table V shows the projected total population and school age
population of Kerala under three variants up to the year 2026. Detailed
tables covering population by age and sex for the projection period are
given in the Appendix I. The population size of Kerala will increase
from 29.1 million in 1991 to 40.7 million in 2026 under medium variant
assumption. The annual growth rate would reach the maximum during
the period 1996-2001 (1.36 per cent) and then start declining and will
reach 0.6 per cent during 2021-2026, under the same assumption. The
low and upper limits of the population size in 2026 would be 39.2 and
41.9 million respectively. The pie diagram in figure I show the percentage
of population by broad age groups in Kerala for the base year and end
year. The pie diagram shows that the percentage of old people in the
population will increase from 5.8 per cent in 1991 to 13.8 per cent in
2021. The young age population would decline from 29.8 percent to
18.2 per cent whereas the share of working age population would increase
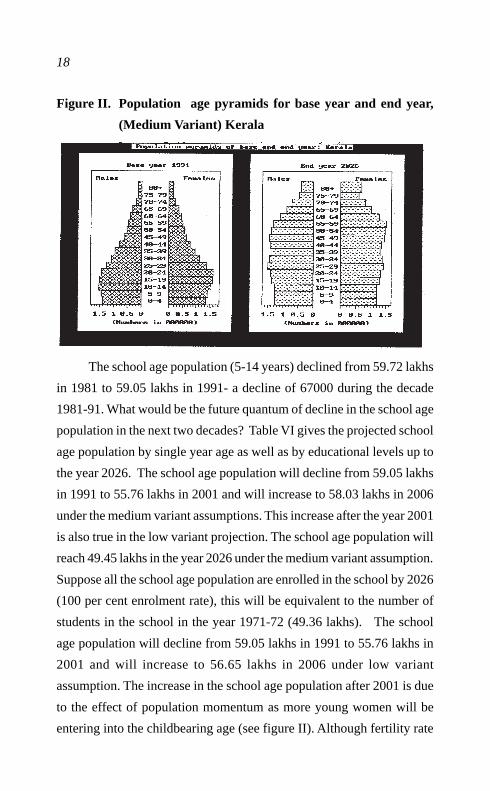
between 1991 and 2021. The age pyramid in figure II shows the age
structure of the population for the base year and end year. It illustrates
that a dramatic change in the age structure of the population. Although
young age population will be declining around 1 million between 1991
and 2026, there will be enormous pressure at the working age population
(an increase of 9 million) and old age population (an increase of 4 million).
17
Table V. Projected population in Kerala
Year Total population (000) School age (5-14) population (000)
Low Medium High Low Medium High
1991 29100 29100 29100 5905 5905 5905
1996 30904 30904 30904 5562 5562 5562
2001 32931 33079 33079 5576 5576 5576
2006 34711 35005 35151 5665 5813 5813
2011 36166 36741 37026 5437 5730 5876
2016 37328 38181 38740 5003 5429 5715
2021 38362 39520 40360 4570 5129 5542
2026 39208 40717 41870 4360 4945 5499
Figure I. Percentage distribution of population by broad age groupunder medium variant for base and end year ofprojection, Kerala
18
Figure II. Population age pyramids for base year and end year,
(Medium Variant) Kerala
The school age population (5-14 years) declined from 59.72 lakhs
in 1981 to 59.05 lakhs in 1991- a decline of 67000 during the decade
1981-91. What would be the future quantum of decline in the school age
population in the next two decades? Table VI gives the projected school
age population by single year age as well as by educational levels up to
the year 2026. The school age population will decline from 59.05 lakhs
in 1991 to 55.76 lakhs in 2001 and will increase to 58.03 lakhs in 2006
under the medium variant assumptions. This increase after the year 2001
is also true in the low variant projection. The school age population will
reach 49.45 lakhs in the year 2026 under the medium variant assumption.
Suppose all the school age population are enrolled in the school by 2026
(100 per cent enrolment rate), this will be equivalent to the number of
students in the school in the year 1971-72 (49.36 lakhs). The school
age population will decline from 59.05 lakhs in 1991 to 55.76 lakhs in
2001 and will increase to 56.65 lakhs in 2006 under low variant
assumption. The increase in the school age population after 2001 is due
to the effect of population momentum as more young women will be
entering into the childbearing age (see figure II). Although fertility rate

19
assumed to decline, the changing age structure of women will be
responsible for the increase in the school age population after 2001. It
should be noted that the changing age structure of women (more number
of women in the reproductive ages) will be due to an increase in the
survivorship of females from birth to reproductive ages, as well as the
fact that these women would belong to the high fertility regime. In
addition, more children will survive from birth to school age because of
decline in the infant and child mortality rate.
Figure III shows the trend in the school age population by
educational levels, that is lower primary (5-8 age group), upper primary
(9-11 age group) and high school (12-14 age group). The school age
population in the LP level is expected to increase from 22.64 lakhs in
1991 to 23.76 lakhs in 2006 and decline to 19.87 lakhs in 2026. It declines
upto 2001 and thereafter it shows an increasing trend until 2006. In the
case of UP level, the school age population will decline from 17.89 lakhs
in 1991 to 16.51 lakhs in 2001 and will increase to 17.48 lakhs before it
starts declining. The school age population in the high school level
declines till 2001 and then increases till 2011.
Figure III. Pr ojected school age population (Medium Variant),
Kerala

20
Table VI. Projected school age population by single year age, Kerala ( in 000')LOW VARIANT

21
3. Implications for Educational Planning
In the population projections presented in the preceding section, a
decline from less than one lakh to 4.68 lakhs is expected in the school
going age population between 1991 and 2011 under various fertility
assumptions. But it also shows that at the LP level there will be an increase
in school going age population from 1996 to 2006. In UP and High
school level there will also be an increase from 2001 to 2011 with gap of
5 years from LP level age group. These aggregate projections itself
indicates that any expansion of the school system, should be done only
with careful planning. With regard to the planning of new primary
schools, the Fifth All India Educational Survey (FAIS)[1992] has
indicated how it is to be done [p.40] :
“ [This was done] either by proposing an
independent primary school to a habitation with a
population of 300 or more without any schooling facilities
within one kilometre radius or clubbing together a cluster
of habitations within one kilometre radius with a
population of 300 or more and proposing a new school.
Population and distance criteria have been relaxed in the
case of topographically difficult regions.”
The findings of the survey indicate that 695 primary schools have
to be newly established in Kerala under the criteria quoted above.
Similarly, 259 upper primary schools are also proposed for Kerala
[p.1284-5]. Further, this State has its share of schools without basic
equipment like black boards and furniture [see Table VII] and ancillary
facilities for drinking water, latrine and for medical check up and
vaccination [see Table VIII]; though proportionately much less than for
all India.

22
Table VII. Availability of black boards, furniture and mats in theschools in Kerala and India, 1992.
Facilities Kerala India
Number Percent Number Percent
No. of schools 6096 - 528730 -
No. of Sections 51199 100 2658220 100
No. of sections having(i). Usable Black board 46987 91.8 472823 17.8
(ii). Unusable black board 2447 4.8 1162050 43.7
(iii). No black board 1762 3.4 1023347 38.5
No. of sections with furniture
(i). Chair and Table 40740 79.6 1053202 39.6(ii). Chair only 3885 7.6 461154 17.3
(iii). Table only 4033 7.9 129150 4.9
(iv). Neither chair nor table 2541 3.0 1014714 38.2
No. of sections having
(i). Mats 41439 80.9 924944 34.8(ii) Inadequate mats 7836 15.3 381806 14.4
(iii). No mats 1924 3.8 1351470 50.8
Source: NIEPA(1992).
Table VIII. Availability of ancillary facilities in schools, Kerala andIndia, 1992
Facilities Kerala IndiaNumber Percent Number Percent
No. of schools 6096 100 528730 100
Drinking water 4658 76.4 250369 47.4Urinal 3962 65.0 81929 15.5Separate urinal for girls 1750 28.7 27232 5.2Lavatory 1517 24.9 33197 6.3Separate lavatory for girls 438 7.2 14584 2.8Medical check-up 2950 48.4 139449 26.4Vaccination 2325 38.1 180291 34.1
Source: NIEPA (1992)
23
This means even in Kerala, a State with total literacy and high
enrolment rates etc, expansion of primary and upper primary schools
and school facilities are still needed. One way of locating exactly where
such expansion is to be effected, is by projecting population at the district
and taluk levels. As mentioned earlier, our State level projection itself
shows decline in the school age population of around 1.75 lakhs between
1991 and 2001 in the medium variant projection. This is most likely be
accounted by decline in the growth of school age populations of those
districts which have relatively high fertility levels. These districts are
also districts with less literacy levels like Malappuram, Wayanad,
Kasaragode and Palakkad compared to the State as a whole [See Table
IX]. Further all these four districts have higher students per school,
compared to State average, leading to a disparity in the number of schools
in the district, relative to the number of students [See Table X]. For
example, 32.38 per cent of the L.P students of the State and who come
from these districts are studying in 26.24 per cent of the total L.P schools
available in the state. In the case of U.P section, this percentage is 25.61
percent of the students studying in 12.61 per cent of the U.P schools in
these districts. Similarly, 20.5 per cent of high school students of the
state in these four districts are studying in 7.64 per cent of the total high
schools in the state available in these districts. Therefore, further analysis
on the basis of population projections and capacity to accommodate
students in schools, to plan for the educational sector of these districts
are necessary.
24
Table IX. Crude birth rate and effective literacy rate by districts in
Kerala
State/District Crude birth rate Effective Literacy Rate, 1991(%)
1984-90 Male Female Total
Malappuram 29.5 92.08 84.09 87.94
Kasaragode 24.4 88.97 76.29 82.51
Wayanad 23.4 87.59 77.69 82.73
Palakkad 22.5 87.24 75.72 81.27
Kannur 20.5 95.54 87.65 91.48
Kozhikode 20.5 95.58 86.79 91.10
Idukki 19.8 90.82 82.96 86.94
Thiruvananthapuram 19.6 92.84 85.76 89.22
Thrissur 18.7 93.77 86.94 90.10
Kollam 18.5 94.09 87.00 90.47
Pathanamthitta 17.2 96.55 93.29 94.86
Ernakulam 16.9 94.46 89.27 92.35
Alappuzha 16.7 96.79 91.12 93.87
Kottayam 16.6 97.46 94.00 95.72
Kerala 20.3 93.62 86.17 89.81
Source: Bhat, P.N.M. (1996) and Census of India, Kerala, 1991.
While it is evident that the lower birth rate in Kerala will have an
over all impact on school enrolment with a time lag; there are other
factors to be taken into account. On the one hand the comparatively
educationally forward districts like Kottayam, Ernakulam and Alappuzha
and which are also lower birth rate districts, are likely to be closer to the
lowest limit and not much further decline is to be expected there. On the
other hand the higher birth rate districts which are mostly higher illiteracy
rate districts can be expected to have a decline in birth rate, and therefore,
the overall decline in the school age population in Kerala will be mostly
25
accounted by these districts. Also, these districts viz., the so far
educationally backward districts, can also be expected to act differently
with regard to enrolment in higher classes. These districts can be expected
to enrol higher number of students in higher classes resulting in increase
in the enrolment rate at the high school level, as the educationally forward
districts are already doing. In other words, the drop out rates in schools
in the currently educationally backward districts are likely to decrease
or get transferred to still higher classes. Therefore, increase in the
enrolment rate at the high school level will be on an increase till 2026
and would not be less than the number of students currently enrolled at
the high school level.
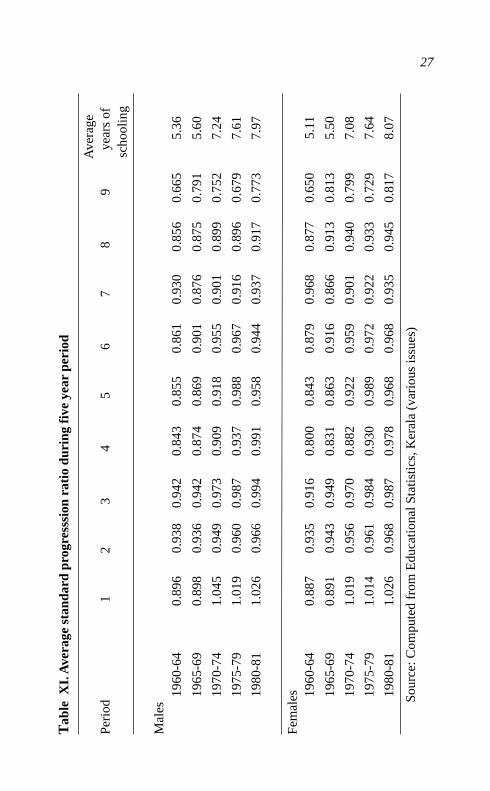
The annual average standard progression ratio6 for all Kerala, for
both males and females shows a steady increase over the years 1960 to
1981 [see Table XI]. Particularly impressive is the greater increase in
the case of female progression ratios. This data is available for only
upto 1981. Further they are State level aggregates. There are other
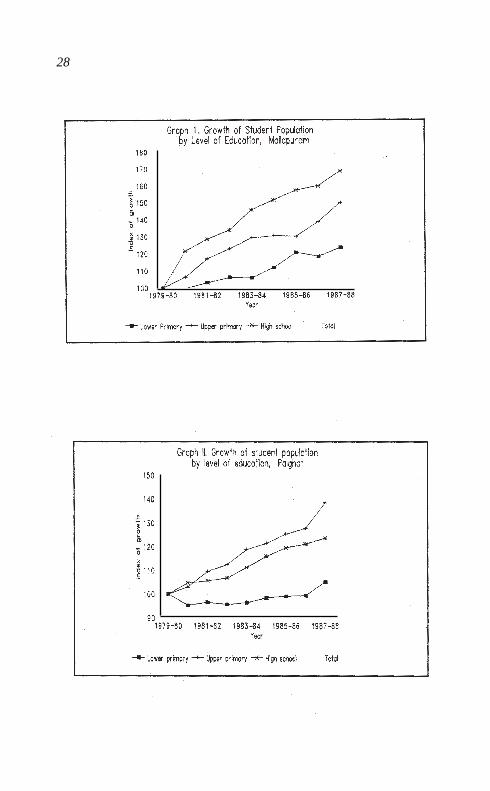
substantiating data at the district level too. In growth of student population
by various levels of education, it is found that Malappuram registers
highest rate of growth with regard to the high school sections [Graph I].
The same trend is seen in the case of Palakkad [Graph II] and Idukki
[Graph III] two other educationally backward districts.
6 Standard progression ratio is defined as the proportion of students passing toanother standard (class) given that one has already completed certain standard(class). While computing we have assumed no repeaters in any class or standardand therefore it is a crude measure.

26T
able
X. D
istr
ibut
ions
of s
tude
nts
and
scho
ols
by d
istr
icts
in K
eral
a, 1
997
Dis
tric
tLo
wer
Prim
ary
Sch
ool
Upp
er P
rimar
y S
choo
lH
igh
Sch
ool
Stu
dent
Stu
dent
Sch
ool
Stu
dent
Stu
dent
Sch
ool
Stu
dent
Stu
dent
Sch
ool
per
dist
. (%
)di
st.
per
dist
. (%
) d
ist.
per
dist
. (%
)
dist
.
Sch
ool
(%)
scho
ol
(%)
Sch
ool
(
%)
Thr
iuva
nant
hapu
ram
381
9.17
7.43
741
7.85
3.24
619
6.89
3.54
Kol
lam
304
6.84
7.17
625
6.13
3.12
620
6.11
3.14
Pat
hana
mth
itta
167
3.28
6.26
429
2.83
2.70
370
2.89
2.48
Ala
ppuz
ha28
45.
376.
0269
44.
802.
2054
64.
842.
82K
otta
yam
244
5.31
6.93
470
4.48
3.03
381
4.29
3.58
Iduk
ki30
23.
093.
2650
72.
681.
6836
62.
291.
99E
rnak
ulam
339
7.66
7.20
708
6.78
3.05
480
6.54
4.34
Tris
sur
381
9.30
7.76
718
7.58
3.36
577
6.61
3.64
Pal
akka
d36
69.
318.
1068
77.
573.
5188
46.
192.
23M
alap
pura
m40
315
.75
12.4
376
212
.42
5.19
1122
9.86
2.80
Koz
hiko
de28
09.
4610
.76
535
8.17
4.86
885
7.44
2.68
Way
anad
448
2.66
1.89
577
2.08
1.14
607
1.73
0.91
Kan
nur
239
8.24
10.9
741
17.
025.
4480
86.
342.
50K
asar
agod
380
4.56
3.82
512
3.54
2.20
539
2.90
1.71
Ker
ala
318
100
100
603
100
100
622
100
100
Sou
rce
: Com
pute
d fr
om E
cono
mic
Sur
vey
of K
eral
a, 1
998
27T
able
XI.
Ave
rage
sta
ndar
d pr
ogre
sssi
on r
atio
dur
ing
five
year
per
iod
Ave
rage
Per
iod
12
34
56
78
9ye
ars
ofsc
hool
ing
Mal
es19
60-6
40.
896
0.93
80.
942
0.84
30.
855
0.86
10.
930
0.85
60.
665
5.36
1965
-69
0.89
80.
936
0.94
20.
874
0.86
90.
901
0.87
60.
875
0.79
15.
60
1970
-74
1.04
50.
949
0.97
30.
909
0.91
80.
955
0.90
10.
899
0.75
27.
24
1975
-79
1.01
90.
960
0.98
70.
937
0.98
80.
967
0.91
60.
896
0.67
97.
61
1980
-81
1.02
60.
966
0.99
40.
991
0.95
80.
944
0.93
70.
917
0.77
37.
97
Fem
ales 19
60-6
40.
887
0.93
50.
916
0.80
00.
843
0.87
90.
968
0.87
70.
650
5.11
1965
-69
0.89
10.
943
0.94
90.
831
0.86
30.
916
0.86
60.
913
0.81
35.
50
1970
-74
1.01
90.
956
0.97
00.
882
0.92
20.
959
0.90
10.
940
0.79
97.
08
1975
-79
1.01
40.
961
0.98
40.
930
0.98
90.
972
0.92
20.
933
0.72
97.
64
1980
-81
1.02
60.
968
0.98
70.
978
0.96
80.
968
0.93
50.
945
0.81
78.
07
Sou
rce:
Com
pute
d fr
om E
duca
tiona
l Sta
tistic
s, K
eral
a (v
ario
us is
sues
)
28

29
This kind of behaviour is expected. If a lower birth rate is preferred,
it means that child’s services are not immediately needed in the household.
In a region which is going through the process of lowering birth rate, the
next most desired occupation (if the child services are not required for
household work) is for schooling. If other factors are the same, the
children in a region of such characteristics are likely to spend more years
in school. This will have implications for the labour market. But we
will not go into that. We will restrict the discussion to the implications
for both built-up educational facilities and for further investments for
building up additional facilities. One distinct implication that can be
drawn from such observations is that school buildings and other accessory
facilities are not to be built up any more in some districts; unless some
special case is found to be existing. This seems to be the case for almost
all Kerala; if the requirements for special regions and groups that are
reflected in the FAIES [p.1280-81] are taken care of. But our own
population projections in the high variant showed that after a decline of
school going age population between 1991 and 2001, there will be an
increase over the next 10 years. Further, even on the medium variant
assumption, after a decline in school going age population between 1991

30
and 2001 there will be an increase between 2001 and 2006 and will
decline only thereafter.
Since educational facilities like schools and their accessories are
built up over the long term, their availability cannot be easily changed
according to changes in population from time to time. The already
available facilities should be used for future requirements and in the
short term, used for alternative purposes. The alternative uses of
elementary educational facilities should be within elementary educational
sector itself. This is because primary/elementary education is a priority
sector. In the case of all India, B.S. Minhas (1991) after analysing the
National Sample Survey’s [NSS] enquiry on the patterns of access to
social services, came to the conclusion that the poorest 40 to 50 per cent
of the households seem hopelessly unable to spare their 6 to 14 year olds
from household’s economic activity, domestic chores and other economic
pressures to avail even of free education. He further argued that these
demand -side constraints on participation in education by the poor are
further reinforced from the supply side inadequacies of the educational
sector. According to him, the available educational facilities are of
abysmally low quality, which breeds indifference and disinterestedness
among the poor children. In the case of Kerala, even the poorer
households can be expected to behave differently, since education is
held to be of high premium here. Notwithstanding that, as a further
incentive for advancing basic education, [in the context of EFA], the
quality of education, both by teaching -learning components and by
physical facilities for education have to be upgraded. The alternative
uses for which the built-up educational facilities can be utilized, in this
context, could be for up-gradation of physical factors in the educational
sector. As far as the schools to be closed down in Kerala are concerned,
there apparently is no such move to use them for any alternative

31
educational use in the primary education sector itself7 . On the other
hand there are several stories reported of severe neglect of even well run
public schools. The up-gradation of even other factors contributing to
quality of learning at the school level is an inevitable requirement in
Kerala is substantiated by the fact that the Kerala Sasthra Sahithya
Parishath [KSSP] in an extended sample survey have estimated that as
high as over 30 per cent of students in classes upto the seventh standard
do not have the language skills expected of fourth standard students.
There are special problems pertaining to social groups which are
educationally backward. The traditional fisher-folk particularly of
Thiruvananthapuram and Malappuram Districts had the level of literacy
as 39 per cent and 35 per cent in 1979. In the nearest population census
of 1981 the general population in these districts had literacy levels of 71
per cent and 60 percent respectively [Table XII]. Also, the literacy
levels of SC and ST population is significantly lower than the non-SC/
ST population as per the 1991 census in all the districts in Kerala [Table
XIII]. Muslim community, particularly Muslim women, Tribal
population, and a small caste called Kudumbis [Schenk- Sandberger,
1989] are all backward in basic literacy. It is evident that schools catering
7 Earlier, there was one newspaper report that the Nandavanam L.P.School inThiruvananthapuram was used to pack and sort out kits of vegetable seeds, to bedistributed by the department of Agriculture. The State Horticultural Corporationwhich sought the assistance of school students for this purpose used the closedschool building for that purpose [Malayala Manorama, 16 June, Thursday, 1992).In Chengannur, the closed school was used to start self-financing college [MalayalaManorama, 17 February, Thursday, 1994] Apart from the controversy surroundingthe self-financing colleges, it is doubtful whether convertion of school buildingsinto colleges, (unless they can be specifically proven to be warranted) is the bestuse of basic or elementary education facilities.

32
predominantly to these communities cannot be just closed on the basis
of general population projections. This is reflected in the reported concern
shown by the three member committee headed by the DPI for fisheries
and tribal schools as mentioned earlier [see foot note no. 2]. Such schools
are likely to require better attention and internal and external
reorganization to make them more effective in serving the cause of
education of these educationally backward communities.
Table XII: District-wise distribution of the literacy rate of the total
population and fishing population
Districts Literacy Rate (percent)
Total Population Fishing Population
(1981) (1979)
Thiruvananthapuram 71 39
Kollam 74 68
Alappuzha 79 72
Ernakulam 77 80
Thrissur 74 66
Malappuram 61 35
Kozhikode 70 67
Kannur 66 65
Kerala 70 62
Source : Thomas, J. 1989, p. 19.

33
Table XIII. Disparity of literacy levels among caste groups in Kerala,
1991
Effective literacy rate ( %)
District NON-SC/ST SC ST
Total Male Female Total Male Female T otal Male Female
Kasargod 85 91 78 64 70 57 66 75 58
Kannur 92 96 88 85 90 80 59 65 52
Wayanad 90 94 86 75 82 69 51 58 43
Kozhikode 92 96 87 86 91 81 52 57 48
Malappuram 89 93 85 79 85 74 44 50 38
Pallakkad 85 91 80 67 75 60 35 40 29
Thrissur 92 95 89 79 84 74 51 55 48
Ernakulam 93 96 90 82 87 78 77 81 72
Idukki 91 94 88 73 81 64 63 68 57
Kottayam 96 98 95 90 94 87 89 90 87
Alappuzha 94 97 92 89 94 85 74 80 69
Pathamthitta 96 98 95 86 90 83 73 76 71
Kollam 90 94 87 82 87 78 74 82 67
Thiruvananthapuram 90 94 87 82 87 78 74 82 67
Kerala 91 95 88 80 85 74 57 63 51
Source: Census of India, 1991.
If alternatives are to be suggested taking into account the
educational requirements of backward districts and groups, it has to be
within the context of a comprehensive scheme of development of primary
education. Such a scheme is not attempted here. Nevertheless, some
tentative requirements, in terms of qualitative physical improvement and
in terms of eventual upgradation of schooling, can be discussed. The
primary asset acquired over the years of educational investment is built-
up space. Unless the school buildings are so dilapidated that they have
to be scrapped; they should be made use of for alternative educational

34
purposes. School buildings can be used for, educational stores,
laboratories, libraries, summer camps, child health programmes, literacy
classes and learning parks etc. Buildings as well as grounds can also be
utilized for development of sports and games. Several such alternative
uses for built-up educational space can be thought of within the
requirements of educational up-gradation.
Evidently, such rationalization and reorganization has to be done
with proper planning. More importantly, the authority to implement such
plans should be vested in the hands of a public body. As far as the
government schools are concerned, already the DPI has such authority.
But in the case of individual private schools, [inspite of considerable
leverage that DPI has in lieu of grants for maintenance and staff salary]
such authority is constrained by a variety of contractual agreements8 . In
such circumstances, legal and legislative measures may be required to
facilitate implementations of the afore-mentioned projects by the DPI,
or still better, by local authorities like the District or Village Panchayats.
Such requirements have direct policy implications.
4. Summary and Conclusion
Decelerating birth rate and its expected impact upon primary school
enrolment, by itself cannot be considered as cause enough to withdraw
public investment in school education sector. First of all, such over all
change will hide within it level-wise changes of demand for education;
from lower to higher school classes as it was seen in the case of relatively
‘backward’ districts. In addition, the overall change itself is not to be so
8 Private managers of schools in city area tend to close down schools in the contextof increasing land prices. Though the government can take over such schoolsand run them for five years, the government will have to give high rents. Toprevent this new legislation is required [Malayala Manorama, 3 April, Sunday,1994]. But it should be remembered that the schools already closed or are identifiedto be closed includes private (aided) as well as public schools.

35
high. Among the three assumptions, the medium variant shows that the
fall will be around 3.29 lakhs between 1991 and 2001. However, there
will be an increase in the school age population of around 2.37 lakhs
between 2001 and 2006 and 1.54 lakhs between 2001 and 2011.
Therefore, the fruits of fertility decline will be realized fully after the
year 2011 in the school age population. In that context, if built up school
space is allotted for uses outside schooling purposes, it will not be a
good policy, particularly in a situation where much more investment
into qualitative improvement of schooling is called for. The argument
that the closed schools can be better made use of by allotting them for
self- financing colleges cannot be an adequate policy response. Such a
shift of investment of built up space away from primary to higher
education sector will be against all principles of equitable education.
In these circumstances, the decelerating birth rate should be
carefully monitored and taking into account its trend and location further
investment should be reoriented and rationalized. States like Kerala
which have already made impressive gains in mass education can have
reversals if the intricacies in changing demand for education is not
anticipated and provided for. More investments for building up higher
classes, wherever required, and extension of accessory services to
qualitative improvement of school education, are needed. These needs
are much more important with regard to backward groups and regions.
To maintain public investment for school education, new innovative
organizational and resources - saving as well as sharing methods like,
PTAs, decentralized management and community support can be utilized.
To close schools purely on the basis of decelerating demographic trends
will be counterproductive to the nationally and internationally accepted
target of education for all.

36A
ppen
dix
I. P
roje
cted
pop
ulat
ion
by a
ge a
nd s
ex u
nder
med
ium
var
iant
ass
umpt
ion,
Ker
ala
(in th
ousa
nds)

37
REFERENCES
Ahlburg, D.A and J.W. Vaupel (1990). “Alternative Projections of the
U.S. Population”, Demography, Vol. 27, No.4, pp.639-652.
Bhat, P.N.M. and Rajan, S.I (1991). “Demographic Transition in Kerala
Revisited”, Economic and Political Weekly, sep 1-8, pp 1957-1980.
Bhat, P.N.M. (1996). Contours of Fertility Decline in India: A District
Level Study Based on the 1991 Census, Discussion Paper SeriesNo. 13., Studies on Human Development in India, UNDP
Research Project, Centre for Development Studies, Trivandrum.
Bongaarts, J and G. Feeney (1998). “On the Quantum and Tempo ofFertility”, Population and Development Review, Vol. 24, No.2.
pp 271-291.
Census of India, 1971. Social and Cultural Tables, Series 9, Kerala, Part
II - c(ii) (c-i to c-vi and F-i to F-v).
Census of India, 1981. Social and Cultural Tables, Series 10, Kerala,
Part IV-A.
Census of India, 1981. Final Population Totals, Paper 3 of 1981, series
10, Kerala, Directorate of Census Operation, Trivandrum,Kerala.
Census of India, 1991. Provisional Population Total, Kerala, Series 12,
Paper 1 of 1991, Directorate of Census Operation, Kerala.
Chari, R.B (1977). Age tables, Census of India, 1971, Series 1 Paper 3,Office of the Registrar General India, New Delhi.
Coale A.J. and P. Demeny (1983). Regional Model Life Tables and Stable
Population, Second Edition. Academic Press, New York.
Devassy, M.K. (1965). General Report, Kerala, Census of India, 1961,Vol VII, part IA (i).

38
Directorate of Public Instruction. (1987). Educational Statistics, 1987,
Dept. of Education, Government of Kerala, Trivandrum.
Dreze, J. and Saran M. (1993). Primary Education and Economic
Development in China and India: Overview and Two Case Studies,
Development Economic Research Programme, London School
of Economics, London, DEP 47.
Frontline (1992). “A bitter lesson, Targeting ‘uneconomic’ schools inKerala” [Bhasker, B], November 6, pp. 88-92
George, K.K. (1993). Limits to Kerala Model of Development,
Monograph Series, Centre for Development Studies,
Thiruvanathapuram.
Gopinathan Nair, P.R (1987). Incidence, Impact and Implications of
Migration: Emigration to Middle East from Kerala (India).
Government of India (1989). Family Welfare Programme in India, Year
Book, 1988-89, Ministry of Health and Family Welfare, Dept. of
Family Welfare.
Government of India, (1993). Education for All, The Indian Scene (secondedition), Ministry of Human Resource Development, Department
of Education, New Delhi.
Hajnal, J. 1947. “The Analysis of Birth Statistics in the Light of the
Recent International Recovery of the Birth Rate”, Population
Studies, 1: 137-164. Cited in Bongaarts and Feeney (1998).
Nair, P.S. et al. (1994). National Family Health Survey 1992-93,
Population Research Centre, University of Kerala, Trivandrum
and International Institute for Population Sciences, Bombay.
Jalaluddin, A.K. (1991). Basic Education and National Development,
The Indian Scene, UNICEF Sponsored Research Study under theProject Basic Education and National Development: Lessons from
China and India, [Revised Draft], Delhi, University of Delhi.

39
Kerala, Government of (1988). Report of the Survey on the Utilization
of Gulf Remittances in Kerala, Department of Economics andStatistics, Trivandrum, December, 1987
Kumar, R.S. (1993). “Participative Management in Schools, Education”,The Hindu, 5 October 1993.
Mathew. A. (1987). A History of Educational Development in Kerala,
(Mimeo), National Institute of Educational Planning andAdministration, New Delhi.
Minhas, B.S. (1991). Educational Deprivation and its Role As a Spoiler
of Access to Better Life in India, Technical Report No. 9104. Indian
Statistical Institute, New Delhi.
MOHRD (1994). Budgetary Resources for Education, Ministry of HumanResources Development, Govt. of India.
Nair, P.R. Gopinathan (1983). Educational Reforms in India:
Universalisation of Elementary Education, Working Paper No.
181, Centre for Development Studies, Trivandrum.
Nair, P.R. Gopinathan (1977), “ Education and Socio-Economic Changein Kerala, 1793-1947”, Social Scientist, Vol 4, No.8, March 1976,
pp.28-43.
Nair, P.R. Gopinathan (1981), Primary Education, Population Growth
and Socio-Economic Change: A Comparative Study with
Particular Reference to Kerala, Allied Publishers Pvt Ltd, NewDelhi.
Groenewold G. and Navaneetham, K. The Projection of Populations:
Data Appraisal, Basic Methods and Applications, Population andDevelopment Teaching Text, Centre for Development Studies,
Thiruvananthapuram.
NIEPA, (1992). Fifth All India Educational Survey, Vol II, NIEPA, New
Delhi.
40
Office of the Registrar General, India (1988). Report of the Expert
Committee on the Population Projections, Occasional paper No.4,Census of India, 1981.
Paqueo V. (1991), “ The Relative efficiency of Private and Public Schoolsin Developing Countries, The World Bank Research Observer, 6,
2 July pp. 205-218.
Prakash. S and Debal P. (1992). “Demographic Transition in India andits Implication for Education”, Perspectives in Education, Vol. 8.
No. 3-4, pp. 139-153.
PROBE/CDE. (1999). Public Report on Basic Education in India, The
Probe Team in Association with Centre for Development
Economics, Oxford University Press, New Delhi.
Schenk-Sandberger, Loes (1988). Poverty, and Survival, Kudumbi
Female Domestic Servants and Their Households in Alleppey
(Kerala), Manohar, Delhi.
Shah. K.R. (1993) “Education: Plea for Higher Plan Allocation”. Research
Note Communication, Journal of Educational Planning and
Administration, VII, 2 April, pp. 215-222.
Sharma, O.P and R.D. Retherford. (1990). Effect of Female literacy on
Fertility in India, Occasional Paper No. 1 of 1990, Office ofthe Registrar General & Census Commissioner, India, Ministry
of Home Affairs, Govt. of India, New Delhi.
Sivanandan, P (1989). Caste and Economic Opportunity- A Study of the
Effect of Educational Development and Land Reforms on the
Employment and Income Earning Opportunities of the Scheduled
Castes and Scheduled Tribes in Kerala, A Ph.D thesis submitted
to the University of Kerala, Centre for Development Studies,
Thiruvanathapuram (Unpublished Manuscript)
41
State Planning Board (1994). Report of the Expert Committee on School
age group Population in 2000 A.D. and its implications on
Educational Policy and Planning, Government of Kerala,
Trivandrum. (C. Ramakumar, S. Irudaya Rajan and C.
Harichandran).
Suri K.C., Bauer and J.R. Rele (1988). Analysis of Work Force in India,
Occasional Paper No. 8 of 1988, Office of Registrar General,
New Delhi.
Tharakan, P.K.Michael, (1984). “Socio-Economic Factors in Educational
Development: Case of Nineteenth Century Travancore”,
Economic and Political Weekly, Vol XIX, Nos. 45, 46, Novem-ber 10 and 17.
Tharakan, P K Michael (1990). The Ernakulam District Total Literacy
Programme: Report of the Evaluation, Centre for Development
Studies, Trivandrum (Typescript).
Thomas J. (1989). Socio- Economic Factors Influencing Educational
Standards In a Marginalized Community, A Case Study on the
Marine Fisherfolk of Kerala, Unpublished M.Phil dissertationsubmitted to Jawaharlal Nehru University, New Delhi, Centre
for Development Studies, Trivandrum.
Tyagi, P.N. (1991). Education for All, A Graphic Presentation, NationalInstitute of Educational Planning and Administration (NIEPA),
New Delhi.
United Nations (1989). Projection Methods for Integrating Population
Variables into Development Planning, Vol I, Dept. of International
Economic and Social Affairs, United Nations, New York.
Varghese, N.V. (1991), “Technological Changes and Human ResourceDevelopment”, In Kothari, V.N (ed.). Issues in Human Capital
Theory and Human Resource Development Policy, Himalaya
Publishing House, Bombay.
42
Visaria, Pravin., Anil Gumber and Leela Visaria (1993). “Literacy and
Primary Education in India, 1980-81 to 1991”, Journal of
Educational Planning and Administration, Vol. VII, Number 1.
World Bank (1991). World Development Report 1991. Oxford UniversityPress, Oxford.
World Bank (1997) Primary Education in India. Washington D.C.
Zachariah, K.C., S. Irudaya Rajan, P.S. Sarma, K. Navaneetham, P.S.
Gopinathan Nair and U.S. Misra .(1994). Demographic Transition
in Kerala in the 1980s, Monograph Series, Centre for Develop-ment Studies, Thiruvananthapuram.
Zachariah, K.C. (1998). Internal Migration: Kerala and other States in
India, paper presented in a open seminar at Centre forDevelopment Studies, CDS, Thiruvananthapuram.

43
CENTRE FOR DEVELOPMENT STUDIES
LIST OF WORKING PAPERS
(From 1991 onwards)
MRIDUL EAPEN Hantex: An Economic Appraisal.September, 1991, W.P.242
SUNIL MANI Government Intervention in Commercial Crop Development:A Case of Flue Cured Virginia Tobacco.November, 1991, W.P.243
K. PUSHPANGADAN Wage Determination in a Casual Labour Market: TheCase Study of Paddy Field Labour in Kerala.January, 1992, W.P.244
K.N. NAIR & S.P. PADHI Dynamics of Land Distribution: An AlternativeApproach and Analysis with Reference to Kerala.January, 1992, W.P.245
THOMAS ISAAC Estimates of External Trade Flows of Kerala - 1975-76 and1980-81.March, 1992, W.P.246
THOMAS ISAAC, RAM MANOHAR REDDY, NATA DUVVURRYRegional Terms of Trade for the State of Kerala.March, 1992, W.P.247
P. MOHANAN PILLAI Constraints on the Diffusion of Innovations in Kerala:A Case Study of Smokeless Chulas.March, 1992, W.P.248
R. ANANDRAJ Cyclicality in Industrial Growth in India: An ExploratoryAnalysis.April, 1992, W.P.249
T.M. THOMAS ISAAC, RAM MANOHAR REDDY, NATA DUVVURYBalance of Trade, Remittance and Net Capital Flows: An Analysis ofEconomic Development in Kerala since independence.October, 1992, W.P.250
M. KABIR, T.N. KRISHNAN Social Intermediation and Health Transition:Lessons from Kerala,October, 1992, W.P.251

44
SUNIL MANI, P. NANDAKUMAR Aggregate Net Financial Flows to India:The Relative Importance of Private Loan vis-a-vis Foreign DirectInvestments.August, 1993, W.P.252
PULAPRE BALAKRISHNAN Rationale and the Result of the CurrentStabilisation Programme.November, 1993, W.P.253
K.K. SUBRAHMANIAN, P. MOHANAN PILLAI Modern Small Industryin Kerala: A Review of Structural Change and Growth Performance.January, 1994, W.P.254
DILIP M.MENON Becoming Hindu and Muslim : Identity and Conflict inMalabar 1900-1936.January, 1994, W.P.255
D. NARAYANA Government Intervention in Commodity Trade: An Analysisof the Coffee Trade in India.January, 1994, W.P.256
K.J. JOSEPH, P. NANDAKUMAR On the Determinants of Current AccountDeficits: A Comparative Analysis of India, China and South Korea.January, 1994, W.P.257
K.K. SUBRAHMANIAN, K.J. JOSEPH Foreign Control and Export Intensityof Firms in Indian Industry.February, 1994, W.P.258
PULAPRE BALAKRISHNAN, K. PUSHPANGADAN Total FactorProductivity Growth in Indian Manufacturing - A Fresh Look.April 1994, W.P.259
D. NARAYANA, K.N. NAIR Role of the Leading Input in Shaping Institutions:Tendency in the Context of Irrigation Uncertainty.May, 1994, W.P.260
G. MURUGAN, K. PUSHPANGADAN Pricing of Drinking Water: AnApplication of Coase Two-part Tariff.December, 1994 W.P.261
MOHANAN PILLAI On the Mexican Crisis.December, 1995, W.P.262
SUNIL MANI Financing Domestic Technology Development through theVenture Capital Route.December, 1995, W.P.263

45
T.T. SREEKUMAR Peasants and Formal Credit in Thiruvithamcore: TheState Institutions and Social Structure 1914-1940.December, 1995 W.P.264
AMITABH Estimation of the Affordability of Land for Housing Purposes inLucknow City, Uttar Pradesh (India): 1970-1990.March, 1996. W.P.265
K. PUSHPANGADAN, G. MURUGAN, K. NAVANEETHAM Travel Time,User Rate & Cost of Supply: Drinking Water in Kerala, India:June 1996. W.P.266
K.J. JOSEPH Structural Adjustment in India: A Survey of Recent Studies &Issues for Further Research,June 1996 W.P.267
D. NARAYANA Asian Fertility Transition: Is Gender Equity in FormalOccupations an Explanatory Factor?October, 1996 W.P.268
D. NARAYANA, SAIKAT SINHAROY Import and Domestic Production ofCapital Goods from Substitution to Complementarity,October 1996. W.P.269
NEW SERIES
W.P. 270 ACHIN CHAKRABORTY On the Possibility of a WeightingSystem for Functionings December 1996
W.P. 271 SRIJIT MISHRA Production and Grain Drain in two inlandRegions of Orissa December 1996
W.P. 272 SUNIL MANI Divestment and Public Sector Enterprise Reforms,Indian Experience Since 1991 February 1997
W.P. 273 ROBERT E. EVENSON, K.J. JOSEPH Foreign TechnologyLicensing in Indian Industry : An econometric analysis of the choiceof partners, terms of contract and the effect on licensees’ performanceMarch 1997
W.P. 274 K. PUSHPANGADAN, G. MURUGAN User Financing &Collective action: Relevance sustainable Rural water supply in India.March 1997.
W.P. 275 G. OMKARNATH Capabilities and the process of DevelopmentMarch 1997
W. P. 276 V. SANTHAKUMAR Institutional Lock-in in Natural ResourceManagement: The Case of Water Resources in Kerala, April 1997.

46
W. P. 277 PRADEEP KUMAR PANDA Living Arrangements of the Elderlyin Rural Orissa, May 1997.
W. P. 278 PRADEEP KUMAR PANDA The Effects of Safe Drinking Waterand Sanitation on Diarrhoeal Diseases Among Children in RuralOrissa, May 1997.
W.P. 279 U.S. MISRA, MALA RAMANATHAN, S. IRUDAYA RAJANInduced Abortion Potential Among Indian Women, August 1997.
W.P. 280 PRADEEP KUMAR PANDA Female Headship, Poverty andChild Welfare : A Study of Rural Orissa, India, August 1997.
W.P. 281 SUNIL MANI Government Intervention in Industrial R & D, SomeLessons from the International Experience for India, August 1997.
W.P. 282 S. IRUDAYA RAJAN, K. C. ZACHARIAH Long TermImplications of Low Fertility in Kerala, October 1997.
W.P. 283 INDRANI CHAKRABORTY Living Standard and EconomicGrowth: A fresh Look at the Relationship Through the Non-Parametric Approach, October 1997.
W.P. 284 K. P. KANNAN Political Economy of Labour and Development inKerala, January 1998.
W.P. 285 V. SANTHAKUMAR Inefficiency and Institutional Issues in theProvision of Merit Goods, February 1998.
W.P. 286 ACHIN CHAKRABORTY The Irrelevance of Methodology andthe Art of the Possible : Reading Sen and Hirschman, February 1998.
W.P. 287 K. PUSHPANGADAN, G. MURUGAN Pricing with ChangingWelfare Criterion: An Application of Ramsey- Wilson Model to UrbanWater Supply, March 1998.
W.P. 288 S. SUDHA, S. IRUDAYA RAJAN Intensifying Masculinity of SexRatios in India : New Evidence 1981-1991, May 1998.
W.P. 289 JOHN KURIEN Small Scale Fisheries in the Context ofGlobalisation, October 1998.
W.P. 290 CHRISTOPHE Z. GUILMOTO, S. IRUDAYA RAJAN RegionalHeterogeneity and Fertility Behaviour in India, November 1998.

47
W.P. 291 P. K. MICHAEL THARAKAN Coffee, Tea or Pepper? FactorsAffecting Choice of Crops by Agro-Entrepreneurs in NineteenthCentury South-West India, November 1998
W.P. 292 PRADEEP KUMAR PANDA Poverty and young Women'sEmployment: Linkages in Kerala, February, 1999.
W.P. 293 MRIDUL EAPEN Economic Diversification In Kerala : A Spatial
Analysis, April, 1999.
W.P. 294 K. P. KANNAN Poverty Alleviation as Advancing Basic Human
Capabilities: Kerala's Achievements Compared, May, 1999.
W.P. 295 N. SHANTA AND J. DENNIS RAJA KUMAR Corporate
Statistics: The Missing Numbers, May 1999.

This work is licensed under a Creative Commons Attribution – NonCommercial - NoDerivs 3.0 Licence. To view a copy of the licence please see: http://creativecommons.org/licenses/by-nc-nd/3.0/