population structure, demographic history and local
TRANSCRIPT

RESEARCH ARTICLE Open Access
Population structure, demographic historyand local adaptation of the grass carpYubang Shen1,2†, Le Wang2†, Jianjun Fu3, Xiaoyan Xu1, Gen Hua Yue2,4,5* and Jiale Li1,6*
Abstract
Background: Genetic diversity within a species reflects population evolution, ecology, and ability to adapt.Genome-wide population surveys of both natural and introduced populations provide insights into geneticdiversity, the evolutionary processes and the genetic basis underlying local adaptation. Grass carp is the mostimportant freshwater foodfish species for food and water weed control. However, there is as yet no overall pictureon genetic variations and population structure of this species, which is important for its aquaculture.
Results: We used 43,310 SNPs to infer the population structure, evidence of local adaptation and sources ofintroduction. The overall genetic differentiation of this species was low. The native populations were differentiatedinto three genetic clusters, corresponding to the Yangtze, Pearl and Heilongjiang River Systems, respectively. Thepopulations in Malaysia, India and Nepal were introduced from both the Yangtze and Pearl River Systems. Loci andgenes involved in putative local selection for native locations were identified. Evidence of both positive and balancingselection was found in the introduced locations. Genes associated with loci under putative selection were involved inmany biological functions. Outlier loci were grouped into clusters as genomic islands within some specific genomicregions, which likely agrees with the divergence hitchhiking scenario of divergence-with-gene-flow.
Conclusions: This study, for the first time, sheds novel insights on the population differentiation of the grass carp,genetics of its strong ability in adaption to diverse environments and sources of some introduced grass carppopulations. Our data also suggests that the natural populations of the grass carp have been affected by theaquaculture besides neutral and adaptive forces.
Keywords: Grass carp, Diversity, Population structure, Evolution, Aquaculture, SNP
BackgroundGenetic diversity is a central concept of evolutionary biol-ogy and molecular ecology, and plays an important role inthe complexity of organisms, ecosystem recovery and theability of a species to adapt diverse environmental condi-tions [1, 2]. Investigation on adaptive divergence in associ-ation with the pattern of gene flow can advance ourunderstanding of speciation genomics [3, 4]. Adaptivedivergence in response to extreme environmental vari-ables is able to be maintained and the flanking regionscan expand due to physical linkage, resulting in reduction
of gene flow [3]. Thus, genetic divergence can be accumu-lated in the form of ‘divergence hitchhiking’ even in thebackground of high gene flow [5]. Alternatively, genome-wide divergence caused by selection per se can also hindergene flow at the whole genome level, leading to furthergenetic divergence in the form of ‘genome hitchhiking’[3]. Discrimination between the two patterns of ‘diver-gence-with-gene-flow’ can enhance our knowledge of spe-ciation and also the underlying evolutionary forces [3, 4].Genomic surveys of natural populations provide essentialinformation on gene flow, genetic variation and adaptivedivergence, as well as biogeographic history of species [6].Populations with recent introduction history typically
have experienced founder effects due to a small numberof introduced individuals. With small effective sizes, thesepopulations are more vulnerable to random genetic driftduring the early stages of the introduction [7]. These evo-lutionary forces in combination with directional selection
© The Author(s). 2019 Open Access This article is distributed under the terms of the Creative Commons Attribution 4.0International License (http://creativecommons.org/licenses/by/4.0/), which permits unrestricted use, distribution, andreproduction in any medium, provided you give appropriate credit to the original author(s) and the source, provide a link tothe Creative Commons license, and indicate if changes were made. The Creative Commons Public Domain Dedication waiver(http://creativecommons.org/publicdomain/zero/1.0/) applies to the data made available in this article, unless otherwise stated.
* Correspondence: [email protected]; [email protected]†Yubang Shen and Le Wang contributed equally to this study2Molecular Population Genetics & Breeding Group, Temasek Life SciencesLaboratory, 1 Research Link, National University of Singapore, Singapore117604, Republic of Singapore1Key Laboratory of Freshwater Aquatic Genetic Resources, Ministry ofAgriculture, Shanghai Ocean University, Shanghai 201306, ChinaFull list of author information is available at the end of the article
Shen et al. BMC Genomics (2019) 20:467 https://doi.org/10.1186/s12864-019-5872-1

can cooperatively contribute to the decrease of geneticdiversity and reduce the success of introduction [8].Nevertheless, advantageous genetic diversity can still bemaintained by a variety of selective regimes [9]. Geneticloci of higher genetic diversity under balancing selectionare crucial to the survival of introduced populations dur-ing adaptation to new environments [9]. Identifying theseloci and understanding the genes associated with theseloci in local adaptation can help in designing novel strat-egies for managing biological invasions and minimizingthe damage caused by non-native species [10]. In anotheraspect, investigation on the source populations and intro-duction routes of introduced populations is also valuablein understanding the evolutionary forces on adaptation incorrelation to environmental factors [10]. Such informa-tion can help in designing practices for utilizing intro-duced resources in both breeding programs and biologicalcontrol [11].The grass carp (Ctenopharyngodon idella) is the most
important freshwater foodfish species as well as a speciesfor aquatic vegetation control [12], providing an excellentopportunity to study the interactions between the aboveevolutionary forces and genomic variations. The grass carpis native to eastern Asia and broadly distributed from theHeilongjiang River System (Amur River) southward tonorthern Vietnam [12]. Within its native distributionrange, grass carp mainly lives in three independent riversystems: Heilongjiang, Yangtze and Pearl [12]. Aquacultureof grass carp is mainly conducted within the geographicalregions of the Yangtze and Pearl River Systems [13]. Its an-nual global production has been over five million tonssince 2013 [13]. In China, the grass carp has been culturedfor over 1300 years [12, 13]. Previous studies based onmicrosatellites showed that genetic differentiation betweendistant native locations was low, but statistically significant[14–17]. Further, considering the long culture history andextensive aquaculture practices, as well as the isolation bylong geographic distance, the contemporary populationstructure of native grass carp likely has been influenced tosome extent by the aquaculture. With a wide range ofdistribution, grass carps are under the pressure fromspatially divergent selection, corresponding to heterozy-gous environments. Its distribution spans approximately30 latitudinal degrees. Some environmental variables varyalong latitude (e.g., extreme temperature from 0° to 38 °C)[12]. Thus, the pattern of adaptive variations at the loci as-sociated with such environmental variables likely presentsa signature of latitudinal gradient.The grass carp has been introduced to over 80 coun-
tries for aquaculture and for controlling the water weeds[13, 18]. The earliest introduction of the grass carp wasdocumented from Southern China to Malaysia in the1800s [18]. However, the exact place of origin of themost introduced grass carp populations is unclear.
Previous studies inferred that grass carps introduced tothe USA, Europe and Japan most likely had multiple ori-gins [16, 19]. However, no studies on tracing the originsof grass carps introduced to the other regions were re-ported. In comparison to the native populations, intro-duced grass carps in USA, Europe and Japan havereduced genetic variability and showed significant diver-gence [16, 19], but adapted to the new habitats very well[18]. In some species, although having experienced sig-nificant founder effects, the potential for adaptive diver-gence in such populations was maintained [10]. Locishowing higher genetic diversity resulting from balan-cing selection may play more important roles in main-taining the survival of introduced species than the lociunder positive selection in the background of loss ofgenetic diversity [9]. However, there is no genome-wideinformation about the genetic variations in inducedgrass carp populations.The purposes of this study were to analyze the genetic
variations and to identify signatures of local selection inthe native and introduced locations in the grass carpusing genome-wide SNPs genotyped by using genotypingby sequencing (GBS). A total of 197 grass carp from sixnative and three introduced locations were genotypedwith 43,310 SNPs. Our study, for the first time, shedsinsights on genetic diversity, population structure, localadaption and sources of introduced grass carps, whichcould be useful in the aquaculture of the grass carp.
MethodsSampling and data collectionA total of 197 grass carp individuals from six native andthree introduced locations were collected between 2007and 2008. The six native sampling sites were in theHeilongjiang, Yangtze and Pearl River Systems. The threesampling sites for introduced grass carp were located inMalaysia, India and Nepal, respectively (Additional file 8:Table S1 & Additional file 1: Figure S1). The annual aver-age and peak temperatures of each sampling site were re-trieved from the National Meteorological Center of China(http://www.nmc.cn) and were highly correlated (Manteltest, R2 = 0.98 and P < 0.001). Thus, only annual averagetemperature was used for further analysis (Additionalfile 8: Table S1). The Malaysian location was docu-mented as being introduced in the 1800s from southernChina, while the Indian location was recorded as beingintroduced from Hong Kong, China (the Pearl RiverSystem), in 1959 and 1968 [20]. The Nepalese locationwas set up by introduction from India in 1966–1967 [18].All samples were estimated as more than one year old. Fintissue of each fish was collected and preserved in 95%ethanol at − 20 °C. Genomic DNA was isolated usingDNeasy Blood & Tissue Kit (Qiagen, Germany) and quan-tified using Qubit® assays (Life Technologies, USA).
Shen et al. BMC Genomics (2019) 20:467 Page 2 of 16

Genotyping by sequencingGenotyping by sequencing (GBS) was conducted using theddRAD-Seq approach [21]. Restriction enzymes PstI-HFand MspI (New England Biolabs, USA) were selected for li-brary construction. 200 ng genomic DNA was fully digestedwith the two enzymes. Digested fragments were ligatedwith barcoded adaptors using T4-ligase (New England Bio-labs, USA). Twenty four individuals were pooled for eachlibrary and the libraries were cleaned up with QIAquickPCR Purification Kit (Qiagen, Germany). The cleaned prod-ucts were size selected and purified (300–500 bp) by run-ning gels and using QIAquick Gel Extraction Kit (Qiagen,Germany), respectively. The recovered libraries were thenamplified using Phusion® High-Fidelity DNA Polymerase(New England Biolabs, USA). After a final cleanup usingQIAquick PCR Purification Kit (Qiagen, Germany), thelibraries were sent to a NextSeq 500 platform (Illumina,USA) for 2 × 150 bp paired-end sequencing.The program process_radtags [22] was employed to filter
the raw sequencing reads with default parameters and readswith any uncalled base were removed. Clean reads werethen demultiplexed and trimmed to 100 bp for in silicomapping. First, reads were mapped to the reference gen-ome of grass carp v1.0 [23] using the program BWA-MEMwith default parameters [24]. Reads with multiple targets inthe reference were excluded from further analysis.Reference-aligned reads were then assembled intostacks for each individual using pstacks, implemented inthe package Stacks v1.34 [22]. Six individuals randomlyselected from each location were used to construct a cata-logue of stacks using cstacks. Stacks from each individualwere then matched against the catalogue for SNP discoveryusing sstacks. Finally, genotyping was conducted across alllocations using the program populations implemented inStacks with a minimum of 10× sequence depth and a suc-cess of > 70% of the individuals in each location. RAD tagswere further removed if any SNP in the tag had more thantwo alleles and showed an observed heterozygosity of > 0.5,in order to remove paralogues [25]. As we observed thatlinkage disequilibrium decayed rapidly within a region of500 bp and the linkage between SNPs from each paired-end RADtag was not significant, only the first SNP for eachsingle-end RAD tag was retained for further analysis bypopulations. Hardy-Weinberg equilibrium (HWE) for eachlocus was examined using Genepop v4.2 [26]. Loci thatdeviated from HWE in a single location at the significancelevel of 0.01 were excluded from further analysis to filterout RAD tags, which are from polymorphic restriction sitesand thus suffer from null allele.
Analyzing population structure and phylogeneticrelationshipGenetic diversity measures for each location, includingobserved heterozygosity (HO), expected heterozygosity
(HE) and nucleotide diversity (Π), as well as FST value foreach locus, were estimated using the program popula-tions [22]. Population genetic divergence was estimatedin the form of pairwise FST using the program Arlequin3.5 [27]. Statistical significance was examined using anexact test with 10,000 permutations. Population struc-ture at both the population and individual levels was in-vestigated by principal component analysis using theprogram Eigenstrat v5.1 [28]. The pattern of populationdifferentiation was examined in the form of isolation-by-distance (IBD) using Mantel tests with the program IBDv1.52 [29]. The genetic distance was measured as FST/(1-FST). For geographical distance, however, the samplinglocations among different river systems are not directlyconnected by river courses. Considering the long dis-tance among locations and also the complicated patternof hydrographical connections among river systems, thepairwise geographical distance was simply modelled aslinear distance between sampling localities. Populationstructure and admixture was investigated using a max-imum likelihood method implemented in the programAdmixture [30]. We carried out analysis with K (numberof population units) ranging from 1 to 12 with defaultparameters. The K value which shows the lowest cross-validation error is suggested to be the most likely num-ber of genetic clusters [30]. Besides using whole data setfor Admixture analysis, we also used only one SNP fromeach paired-end RADtag in case the results were biaseddue to linkage between SNPs from the same paired-endRADtag. However, no difference was observed in theresults between the two data sets. The phylogenetic re-lationship among locations was constructed using aNeighbor-Joining tree based on Nei’s standard geneticdistance with the program Poptree2 [31] by bootstrap-ping over loci for 1000 times.
Inferring population origins of introduced grass carpThe population origins of the introduced grass carp wereinferred using an approximate Bayesian computationmethod [32] implemented in the program Diyabc 2.1.0[33]. Three simple competing scenarios were designedand tested with historical demographic parametersdrawn from the distribution of priors, based on the re-sults of population structure. A total of 52 summary sta-tistics including genic diversities, FST distances and Nei’sdistances were estimated and used for comparing amongscenarios. For the introduced location in Malaysia, twostructured native locations as shown in the admixtureanalysis and an admixture population between the twolocations were used as potential source populations toinfer the ancestral population. In modeling the populationorigins, three competing scenarios were designed: Sce-nario 1, the introduced population originated from anadmixture population of both river systems; Scenario 2,
Shen et al. BMC Genomics (2019) 20:467 Page 3 of 16

the introduced population originated directly from theYangtze River System; and Scenario 3, the introducedpopulation originated directly from the Pearl River Sys-tem. These scenarios assumed no migration among popu-lations. Two ancestral populations from the Yangtze RiverSystem and the Pearl River System, respectively, showingthe closest genetic relationship with the introducedpopulations, were used for examination of the differentscenarios. An equal number of diploid individuals wererandomly selected from each of the introduced and an-cestral populations. The number of individuals was de-termined according to the smallest population. We alsotested the possibilities of applying the other native loca-tions from each river system and found little differencebetween the results. The origin of the South Asian loca-tions (India and Nepal) was inferred in a similar man-ner, by assuming the population in India to be theancestral population of that in Nepal. We also testedthe possibility that the population in India was foundedby migrants from the population in Nepal. However,such scenarios were subsequently revealed to be lesscompetitive.Historical demographic parameters, including diver-
gence time and historical population size changes thatmight correlate to bottleneck events for introducedpopulations, were considered for discrimination of thecompeting scenarios. We applied uniform priors andalso the following parameter settings: t(n + 1) > tn > dband N > Nm; N and Nm = [10–10,000]; t1, t2 and db =[1–150]; t3 = [10–10,000]. All the other parameterswere using the default settings. A total of 106 simu-lated datasets were generated for the three competingscenarios to produce reference tables. The scenariosand priors were pre-evaluated and at least one prior–scenario combination was designed to produce simu-lated datasets that are close to the observed datasets[33]. The competing scenarios were examined by pos-terior probabilities using a logistic regression ap-proach with 1% of the simulated datasets. Type I andII errors were further estimated to compare the com-peting scenarios. The parameters were computedusing the top 1% of simulated datasets which wereclosest to the observed datasets. The competing sce-narios were examined for goodness-of-fit by conduct-ing model checking using all calculated summarystatistics with the PCA approach. Before these ana-lyses, we filtered the SNPs by applying a missing datacut-off of 0.05 and minor allele frequency thresholdof 0.05. Linkage disequilibrium between each pair ofSNPs was examined as R2 with the program VCFtools[34] and SNPs with R2 < 0.05 were removed. Approxi-mately 3000 markers were retained for estimation ofeach set of competing scenarios in three runs to ob-tain statistical robustness.
Identifying footprints of selectionEvidence of local adaptation was detected for individualloci, using a Bayesian generalized linear mixed modelinvolving covariance of allele frequencies and environ-mental variables and taking demography into account,with the program Bayenv [35]. A Bayes factor (BF) wascalculated for each SNP to measure the strength of thecorrelation between SNP variation and environmentalvariables. According to the method by [35], a BF > 3 wasconsidered as a substantial evidence for selection. Theprogram was run for five times with an independentvariance-covariance matrix of population genetic vari-ation to achieve consistency among the runs. Thegenome-wide (neutral) variance-covariance matrix wasestimated using the whole data set, and the mean covari-ance matrix over 100,000 iterations was considered. Weobserved that the annual average temperature was highlycorrelated to latitude (R2 = 0.992, P < 0.001). Only theloci consistently identified to be significantly associatedwith both temperature and latitude were retained tostudy latitudinal gradients.FST-based outlier tests were also performed to identify
signatures of local selection. Firstly, a Bayesian simulation-based test implemented in BayeScan 2.1 [36] was used toidentify outlier SNPs. Outliers were determined using aq-value threshold of 5%. Considering that grass carpsare distributed in different river systems and that thereis among-group genetic structure, a hierarchical islandmodel [37] for identifying outlier loci was also employedusing the program Arlequin 3.5 [27] with the followingparameters: 50,000 simulations, 10 simulated groups, and100 demes per group. Only outliers, with a threshold of0.995 and a false discovery rate of 0.01, were considered ascandidates under putative selection. In comparison toBayenv, the two FST-based outlier tests do not take demo-graphic history into consideration. Because the null distri-bution of these outlier tests still does not account for thebottlenecks that have likely occurred in the introducedpopulations, FST-based outlier tests were separately carriedout for native locations and for all locations.
Identifying loci and genes under putative selectionLoci under putative selection were mapped against theraw annotation of the grass carp genome. SNPs withinboth exons and introns were considered to have a genefeature. Coding sequences of the genes were extractedand then functionally annotated by Blast2Go [38] againstthe nr database with an E-value cut-off of 10–6, annotationcut-off of > 55 and a GO Weight of > 5. Enrichment ofGene Ontology (GO) terms was conducted using the pro-gram WEGO [39] with the whole gene set as background.Candidate genes were also mapped to the reference gen-ome of zebrafish (GRCz10) using Blastn to retrieve the cor-responding Ensembl gene IDs. A more detailed functional
Shen et al. BMC Genomics (2019) 20:467 Page 4 of 16

annotation of these genes was then performed by mappingto the Kyoto Encyclopedia of Genes and Genomes (KEGG)pathway database [40] using the program David with de-fault parameters of gene count > 2 and ease = 0.1 and usingall genes of zebrafish as the background [41].
Analyzing genomic patterns of differentiationThe patterns of differentiation across the genome wereexamined to verify if there were genomic regions wheregenomic loci under putative selection formed into clus-ters and showed elevated divergence in comparison tothe background. Estimates of genetic differentiation be-tween the locations distributed in the Yangtze and PearlRiver Systems were calculated. Fifty, 100, 150 and 200Kb window-sized FST values were separately calculatedbased on the 24 longest scaffolds, ranging from 9.6 to19.1Mb, of grass carp reference genome using the pro-gram populations in stacks. Corresponding window-sized SNP densities were also calculated to assess if thegenome-wide patterns of differentiation were independ-ent of the patterns of SNP density.
ResultsSNP discovery and genotypingGenotyping by sequencing (GBS) produced an averageof 10.17 million raw reads per individual. After qualitycontrol, 9.21 million reads per individual were obtainedfor sequence mapping and SNP discovery. A total of458,544 RADtags were detected and 280,544 SNPs werediscovered across all nine locations, with an average of0.61 SNPs per RADtag. After removing the loci thatfailed to meet the filtering criteria, 43,310 SNPs were ge-notyped across all locations, among which 28,412(65.6%) showed minor allele frequency (MAF) of > 0.05across the entire data set.
Genetic diversity and population structureThe measures of genetic diversity, including HO, HE andΠ, estimated based on all variant SNPs, are shown inAdditional file 8: Table S1. For the six native locations,Vietnam showed slightly lower genetic diversity than theothers. The genetic diversity of the introduced popula-tions was significantly lower than that of the native loca-tions (Mann-Whitney U test, P < 0.01).Pairwise FST analysis revealed significant genetic differ-
entiation between the native and the introduced popula-tions with FST ranging from 0.1126 between Zhaoqingand Indian populations to 0.2399 between Vietnam andMalaysia (Additional file 9: Table S2). However, geneticdifferentiation between each pair of native populationswas lower, with FST ranging from 0.007 between Jiujiangand Shishou to 0.052 between Hanjiang and Vietnam,but significantly different from 0 after Bonferroni correc-tions for multiple comparisons. Compared to the other
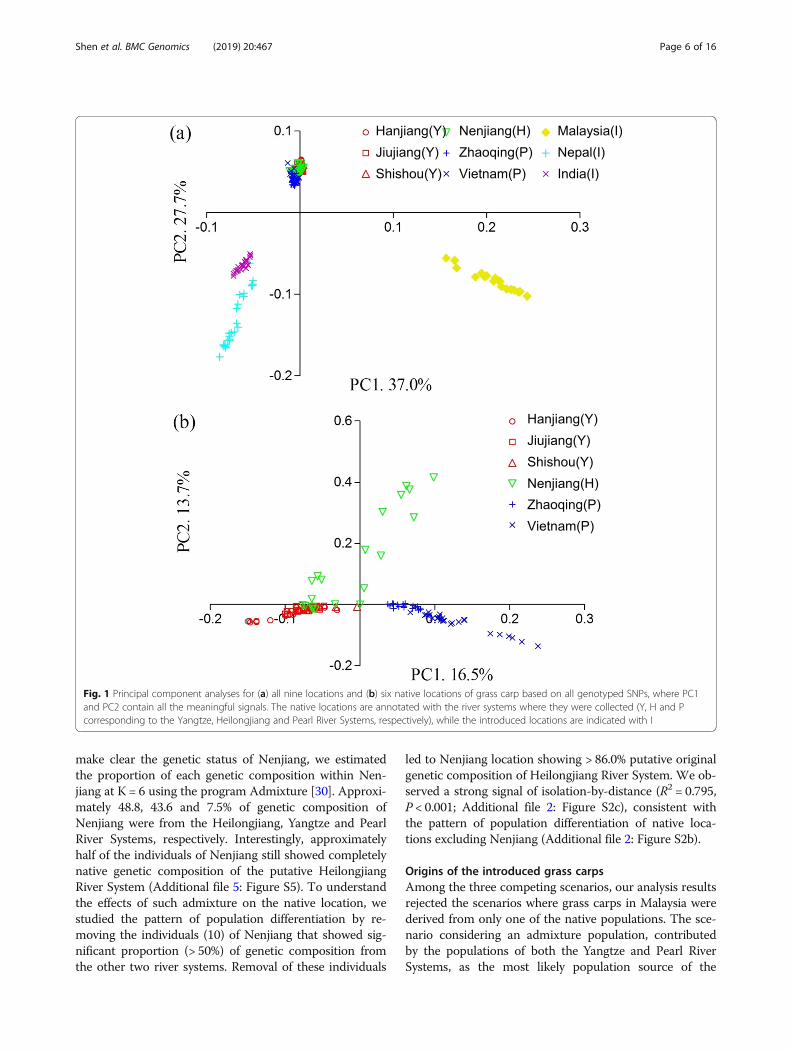
native populations, Zhaoqing from the Pearl River Sys-tem showed slightly lower genetic differentiation fromthe three introduced populations. The effective geneflow (Nm) estimated using FST ≈ 1/(4 Nm + 1) rangedfrom 4.604 to 12.505 among the three river systems. Fornative locations, genetic divergence at each individuallocus was estimated between the most divergent loca-tions (Hanjiang vs Vietnam) and also between the mostdistant locations (Nenjiang vs Vietnam). We observedthat no loci showed FST > 0.5 and only < 15% of loci hadFST > 0.1 between these sampling sites.Principal component analysis revealed that the native
locations were strikingly differentiated from the intro-duced locations (Fig. 1a). For the native locations,Zhaoqing and Vietnam from the Pearl River Systemwere clearly differentiated from the locations from boththe Yangtze River System (Hanjiang, Jiujiang andShishou) and the Heilongjiang River System (Nenjiang)(Fig. 1b). Some individuals from both the Yangtze andHeilongjiang River Systems showed a very close rela-tionship, suggesting population admixture between thetwo river systems (Fig. 1b). The pattern of genetic dif-ferentiation across all native locations did not show asignificant signal of isolation-by-distance (R2 = 0.187,P = 0.16; Additional file 2: Figure S2a). Some individualsof the Heilongjiang River System are suggested to havean origin from the Yangtze River System (Fig. 1b).After excluding the Nenjiang location, we identified astrong correlation between population differentiationand geographical distance (R2 = 0.876, P < 0.001; Add-itional file 2: Figure S2b). Consistent with the above re-sults, the neighbor-joining phylogenetic tree revealedthat the native locations from the Yangtze, Heilongjiangand Pearl River Systems formed three independent clus-ters, respectively. The genetic distance between the intro-duced and the native locations was significantly longerthan that among the native locations of each river system(Additional file 3: Figure S3).In Admixture analysis, the lowest cross-validation error
was identified at K = 6 (CV, 0.359) followed by at K = 4(CV, 0.360) (Additional file 4: Figure S4). For K = 4, all thenative locations were grouped into one cluster, while thethree introduced locations were classified into threeindependent clusters, respectively (Fig. 2). For K = 6, allthe native locations formed into three genetic clusters cor-responding to the three river systems. We also found thatboth Nenjiang and Zhaoqing of the Heilongjiang and thePearl River Systems, respectively, were mixed with geneticcluster from the Yangtze River System (Fig. 2). The resultsfor K = 5 were similar with that for K = 6, except thatlocation India and Nepal formed into one cluster (Add-itional file 5: Figure S5). Consistent with the PCA results,location Nenjiang showed significant genetic compositionfrom both the Yangtze and the Pearl River Systems. To
Shen et al. BMC Genomics (2019) 20:467 Page 5 of 16
make clear the genetic status of Nenjiang, we estimatedthe proportion of each genetic composition within Nen-jiang at K = 6 using the program Admixture [30]. Approxi-mately 48.8, 43.6 and 7.5% of genetic composition ofNenjiang were from the Heilongjiang, Yangtze and PearlRiver Systems, respectively. Interestingly, approximatelyhalf of the individuals of Nenjiang still showed completelynative genetic composition of the putative HeilongjiangRiver System (Additional file 5: Figure S5). To understandthe effects of such admixture on the native location, westudied the pattern of population differentiation by re-moving the individuals (10) of Nenjiang that showed sig-nificant proportion (> 50%) of genetic composition fromthe other two river systems. Removal of these individuals
led to Nenjiang location showing > 86.0% putative originalgenetic composition of Heilongjiang River System. We ob-served a strong signal of isolation-by-distance (R2 = 0.795,P < 0.001; Additional file 2: Figure S2c), consistent withthe pattern of population differentiation of native loca-tions excluding Nenjiang (Additional file 2: Figure S2b).
Origins of the introduced grass carpsAmong the three competing scenarios, our analysis resultsrejected the scenarios where grass carps in Malaysia werederived from only one of the native populations. The sce-nario considering an admixture population, contributedby the populations of both the Yangtze and Pearl RiverSystems, as the most likely population source of the
Fig. 1 Principal component analyses for (a) all nine locations and (b) six native locations of grass carp based on all genotyped SNPs, where PC1and PC2 contain all the meaningful signals. The native locations are annotated with the river systems where they were collected (Y, H and Pcorresponding to the Yangtze, Heilongjiang and Pearl River Systems, respectively), while the introduced locations are indicated with I
Shen et al. BMC Genomics (2019) 20:467 Page 6 of 16

introduced location in Malaysia was preferred over theothers (Scenario 1 in Fig. 3a and Table 1). The posteriorprobability of this scenario was 0.806 (95% CI: 0.782–0.829) and was much higher than the other assumed com-peting scenarios. Both type I and II errors were estimatedto be low for this best scenario (0.021 and 0.009, respect-ively). With regard to the source population of India andNepal, the scenario considering an admixture populationbetween the populations of the Yangtze and Pearl RiverSystems (Scenario 1 in Fig. 3b and Table 1) was alsoinferred to be the most probable scenario, with the highestposterior probability of 0.927 (95% CI: 0.913–0.941). TypeI and II errors for this scenario were calculated as 0.018and 0.012, respectively. We also tested alternatives to thethree competing scenarios by assuming that the intro-duced grass carps were derived from a ghost or anunsampled population, from each of the two river systemsor an admixture population of the two river systems, butdifferentiated from the current populations. However,these scenarios did not change the results and showed noimprovement to the current scenarios. Under the mostcompetitive scenario, estimation of the demographicparameters revealed that both the introduced and nativelocations had relatively large contemporary effective popu-lation sizes (Additional file 10: Table S3). Nevertheless, allthe introduced locations experienced historically signifi-cant population decline during the introduction processes(Additional file 10: Table S3).
Identifying loci under putative selectionOnly SNPs with MAF > 0.05 were used to identify signalsof selection using different approaches. Firstly, the nativelocations were used to infer footprints of local selectionand latitudinal gradients. Using the whole data set, Bayenvidentified 71 loci showing significant associations between
genetic variations and latitudinal gradients (Table 2).Arlequin and BayeScan detected, in total, 276 and 183outliers, respectively, with 128 common outliers. As re-vealed above, location Nenjiang was mixed with geneticcomposition from the other two river systems. Such ad-mixture is likely to disturb the patterns of local selectionand latitudinal gradients. Therefore, we performed an-other round of both correlation and outlier tests after ex-cluding the individuals (10) in Nenjiang that showedsignificant genetic composition from the other river sys-tems as stated above. Using such reduced data set, 70 lociwere found to be significantly associated with latitudinalenvironmental variables, while 285 and 185 loci wererevealed to be outliers by Arlequin and BayeScan, re-spectively, with 127 common outliers (Table 2). Be-tween the two data sets, Arlequin and BayeScandetected 175 (~ 62%) and 142 (~ 77%) common loci,respectively, while no common loci with FST-basedoutlier tests were identified using Bayenv.To infer signatures of balancing selection that may be
involved in the introduction process, all nine locationswere included for FST-based outlier tests. We also ob-served the same pattern as the above: that inclusion ofthe individuals in Nenjiang with significant genetic com-position from the other two river systems produced a setof outliers slightly different to that generated after ex-cluding these samples, both in terms of positive selectionand balancing selection (Table 3). To examine if this wascaused by the admixed composition of Nenjiang locationor just the variations resulting from alteration of samplesets, we performed ‘leave-one-out’ tests by leaving Nen-jiang in and removing any one of the other locations.We found the overall proportions of common loci in‘leave-one-out’ tests were ~ 5% and ~ 15% higher thanthat of the above results generated using the data sets
Fig. 2 Population structure across six native locations from three river systems (Heilongjiang (H), Yangtze (Y) and Pearl (P) River Systems,respectively) and three introduced locations (I) of grass carp as inferred using Admixture at K = 4 and 6. Each vertical line represents oneindividual, while each colour shows the genetic composition that is assigned into a distinct genetic cluster
Shen et al. BMC Genomics (2019) 20:467 Page 7 of 16

including and excluding the individuals of significant aliengenetic compositions in Nenjiang, for Arlequin andBayeScan, respectively. It suggests the admixed compos-ition of Nenjiang location might have slightly influencedthe signature of local selection. Further considering theresults of both Admixture and isolation-by-distances, theintroduction of specimens to the Heilongjiang RiverSystem from the other river systems much likely occurredrecently and the native gene pool of the Heilongjiang River
Table 1 Posterior probabilities with 95% confidence interval ofeach of the three competing scenarios used for inferring thesource population of introduced grass carp, and the type I andII errors for each competing scenario
Scenario Posterior probability (95% CI) Type I error Type II error
Malaysia
Scenario 1 0.806 (0.782, 0.829) 0.021 0.009
Scenario 2 0.014 (0.000, 0.110) 0.002 0.019
Scenario 3 0.180 (0.081, 0.279) 0.007 0.022
India and Nepal
Scenario 1 0.927 (0.913, 0.941) 0.018 0.012
Scenario 2 0.068 (0.054, 0.082) 0.006 0.024
Scenario 3 0.005 (0.004, 0.007) 0.008 0.014
The best competing scenario is indicated in bold. Scenario 1, the introducedpopulation originated from an admixture population of both the Yangtze andthe Pearl River Systems; Scenario 2, the introduced population originateddirectly from the Yangtze River System; and Scenario 3, the introducedpopulation originated directly from the Pearl River System
Table 2 Results of Bayenv and two FST-based outlier tests,Arlequin and BayeScan for identifying footprints of localselection across six native locations, using whole data set anddata set reduced by excluding individuals (10) in Nenjiangshowing significant genetic composition from both the Yangtzeand Pearl River Systems. The common loci indicate the locishared between two corresponding tests
Tests Whole data set Reduced data set Common loci
Bayenv 71 70 0
Arlequin 276 285 175
BayeScan 183 185 142
Common FST outliers 128 127 94
Fig. 3 Three competing scenarios used for inferring the population origin of the introduced location in Malaysia (a) and the two South Asianlocations in India and Nepal (b). For both (a) and (b), scenario 1 involves an admixture source population from the Yangtze and Pearl RiverSystems, while scenarios 2 and 3 have the introduced population originating from the Yangtze and the Pearl River Systems, respectively
Shen et al. BMC Genomics (2019) 20:467 Page 8 of 16

System was still relatively independent (see discussion).The selective regimes were likely still somewhat differentbetween migrants and natives in Nenjiang location. There-fore, only results from the reduced data set were used tostudy local selection for localized populations. In total,Arlequin and BayeScan identified, respectively, 335 and191 outliers under putative positive selection, with 11 com-mon loci, as well as 206 and 77 loci under putative balan-cing selection, with 74 common loci (Table 3). Consideringthat FST-based outlier tests are vulnerable to false positivesin identifying positive selection when using populationsshowing significant population structure and complicateddemographic history, and also the significant inconsistencybetween the results of outlier tests in terms of positive se-lection (Table 3), we only took the outliers under putativebalancing selection across all locations into consideration.In total, 343 and 209 loci under putative positive and bal-ancing selection, respectively, and 70 loci associated withlatitudinal gradients, were retained for further analysis. Outof these loci, four showing latitudinal variations were alsodetected as outliers under putative positive selection acrossnative locations.
Functional annotation of genes under putative selectionMapping against the annotation of the reference genomerevealed that 227 out of 618 outliers (36.7%) were associ-ated with 210 unique genes, showing no significant devi-ation from the null hypothesis that 39.8% of all examinedloci could hit the genomic region of a gene in the genome.A total of 154, 60 and 27 genes were revealed to be relatedto putative positive selection, balancing selection and latitu-dinal gradients, respectively (Additional file 11: Table S4).Fifty-one and 17 genes were consistently suggested to becandidates under putative positive and balancing selection,respectively, by two different FST-based outlier tests. Out ofthe 618 outliers, 35 (5.7%) were detected in the codingsequences, also showing no deviation from the null hypoth-esis that 5.6% of all examined loci could hit the codingsequences of a gene in the genome. Fifteen (42.9%) were re-vealed to cause amino-acid substitutions in known proteins,within which 13 and 2 were associated with putativepositive and balancing selection, respectively (Add-itional file 12: Table S5). This ratio was lower than
that of the null hypothesis of non-synonymous muta-tions in coding sequences (47.4%).GO enrichment revealed that the candidate genes were
related to local adaptations covered a wide range of func-tions in biological processes: biological regulation, cellularprocess, developmental process, metabolic process, pig-mentation and response to stimulus (Additional file 6:Figure S6). Genes involved in positive selection wereenriched into eight KEGG pathways. The most significantpathways included ion transport (seven genes) and regula-tion of transcription (seven genes) (Additional file 13:Table S6). For genes under putative balancing selection,the most significant enriched KEGG pathway was cal-cium ion binding pathway (five genes) and hydrolaseactivity (five genes) (Additional file 13: Table S6). Inter-estingly, genes related to latitudinal gradients weremainly enriched in the integral component of mem-brane category, which includes 10 genes (Table 4 andAdditional file 13: Table S6).
Genome-wide patterns of differentiationDifferent window-sized FST values were calculated alongthe 24 longest scaffolds of the grass carp genome. Using asliding window of 150 kb, some specific genomic regionswere revealed to have higher than average differentiation(Additional file 7: Figure S7). Examination using differentsizes of sliding window (50, 100, 200 and 250 kb) did notchange the results. In order to test if the FST elevated re-gions are due to the non-random distribution of SNPs, thegenome-wide patterns of FST were compared with thoseof SNP density for the same sliding window size. Wefound that the distribution patterns of FST were independ-ent of those of SNP density (Additional file 7: Figure S7aand S7b). Interestingly, we observed that SNPs that wereidentified to be under putative selection occurred muchmore commonly within some specific genomic regionsshowing elevated differentiation, in comparison to theoverall background (e.g., within the four long scaffolds,CI01000000, CI01000004, CI01000005 and CI01000030(Additional file 7: Figure S7c)). The size of the largest‘genomic island’ was approximately 400 Kb in scaffoldCI01000005. Such specific genomic regions were alsoobserved to be independent of SNP density.
Table 3 Results of two FST-based outlier tests, Arlequin and BayeScan for identifying positive and balancing selection across sixnative and three introduced locations, using whole data set and data set reduced by excluding individuals in Nenjiang (10) showingsignificant genetic composition from both the Yangtze and Pearl River Systems. The common loci indicate the loci shared betweentwo corresponding tests
Outlier tests Whole data set Reduced data set Common loci
Positive Balancing Positive Balancing Positive Balancing
Arlequin 352 169 335 206 287 148
BayeScan 206 65 191 77 161 59
Common FST outliers 13 61 11 74 7 58
Shen et al. BMC Genomics (2019) 20:467 Page 9 of 16

DiscussionIn this study, we investigated range-wide populationstructure of native locations and the origins of intro-duced locations of grass carp in South and SoutheastAsia, as well as local selection and genome-wide patternsof differentiation, using 43,310 SNPs covering the wholegenome. This study has important implications for un-derstanding genetic differentiation under diverse envi-ronments for freshwater fish species with a wide rangeof geographical distribution.
Genetic diversity of native and introduced grass carpsIn grass carp, we observed that genetic diversity in theintroduced locations was significantly reduced in com-parison to that in the native locations. This result is con-sistent with a previous study on assessment of geneticdiversity in introduced locations in the USA, Europe andJapan and native locations in the Yangtze River Systemusing mitochondrial DNA [19]. As revealed by demo-graphic analysis, such a decline of genetic diversity ismuch likely caused by founder effects during populationintroduction as well as sequential genetic drift and direc-tional selection. At the first stage of colonization of newhabitats, populations having experienced founder eventsare particularly sensitive to various evolutionary forces.Genetic drift can work as the main evolutionary force,randomly fixing alleles and rapidly driving differentiationbetween the introduced and parental populations [8].Meanwhile, multiple directional selections tend to fixspecific alleles and can also play important roles in the
process of colonization, resulting in continuous loss ofgenetic diversity and increase of population differenti-ation [42]. However, loss of genetic diversity does notnecessarily indicate loss of survival potential in newhabitats [43]. In our previous study, we observed thatAsian seabass (Lates calcarifer) in Australia, which sepa-rated from the population in Southeast Asia 1.5 millionyears ago, lost approximately 60% of genetic diversity,but successfully adapted to and colonized the new con-tinent [44]. Here, we observed that the contemporaryeffective sizes of populations in the introduced locationshave recovered to a considerable level. In addition, thegrass carp has been introduced to over 80 counties foraquaculture and controlling water weeds in water ways[18]. All these data suggest that the grass carps have ahigh capability to adapt to new habitats. Therefore, it isan ideal species for controlling water weeds and aqua-culture in many countries. Certainly, to avoid issues ofbiological invasion, triploid grass carp should be usedfor controlling water weeds.
High gene flow among native grass carp populationsTypically, freshwater fishes are more isolated by variousgeographical factors than marine fishes, and thus have alower level of gene flow [45]. In this study, we observedthat pairwise population genetic differentiation was verylow, consistent with previous studies using microsatel-lites [14, 16]. Considering the geographical isolationamong the three river systems, such results are ratherunexpected. Since the grass carp has been cultured for
Table 4 Annotation of candidate genes under putative selection consistently identified by both outlier tests and Bayenv association tests
Locus Annotation Gene name Overall Fst
428 ENSDARG00000010097 Coagulation factor IXa (F9A) 0.288
3729 ENSDARG00000060016 Nuclear receptor binding SET domain protein 1a (NSD1A) 0.154
8253 ENSDARG00000023445 ATPase, Ca++ transporting, plasma membrane 3b (ATP2B3B) 0.194
46,475 ENSDARG00000058821 Semaphorin 5A (SEMA5A) 0.158
52,319 ENSDARG00000076364 Erythrocyte Membrane protein band 4.1 like 1 (EPB41L1) 0.187
80,064 ENSDARG00000013250 Threonyl-tRNA synthetase (TARS) 0.265
88,973 ENSDARG00000018418 Parathyroid hormone 1 receptor b (PTH1RB) 0.215
92,870 ENSDARG00000005479 Teneurin transmembrane protein 3 (TENM3) 0.179
113,810 ENSDARG00000074636 Centrosomal protein 170B (CEP170B) 0.294
128,568 ENSDARG00000073933 GRB2 associated, regulator of MAPK1-like (GAREML) 0.189
153,644 ENSDARG00000039241 Protein kinase C, alpha (PRKCA) 0.175
217,623 ENSDARG00000003403 Teneurin transmembrane protein 1 (TENM1) 0.223
78,588 ENSDARG00000020057 Bone morphogenetic protein receptor, type II b (BMPR2B) 0.089
309,269 ENSDARG00000028533 Microtubule-actin crosslinking factor 1a (MACF1A) 0.193
18,761 ENSDARG00000037079 Cilia and flagella associated protein 36 (CFAP36) 0.136
154,823 ENSDARG00000043963 si:ch211-241j12.3 0.369
149,896 ENSDARG00000052766 si:ch211-239f4.1 0.083
217,867 ENSDARG00000076998 si:ch73-92i20.1 0.207
Shen et al. BMC Genomics (2019) 20:467 Page 10 of 16

food in China for more than 1300 years [12, 13], thesesurprising results strongly suggest that high gene flowamong the three river systems is not only naturally oc-curring but also by the aquaculture activities. Interest-ingly, the observed pattern of population differentiationdid not conform to isolation-by-distance across thewhole data set. However, after excluding the individualsin Nenjiang location that were suggested to have recentorigins from the Yangtze and Pearl River Systems, theremaining samples showed a strong signal of isolation-by-distance. This result indicates that although human-induced gene flow might have played some role in shapingthe overall population structure of the grass carp, it onlyshowed a significant effect in the Heilongjiang RiverSystem.According to the historical records [12], grass carp
were abundant in both the Yangtze River System and thePearl River System, and were widely captured from thewild as seeds for aquaculture locally. There was no prac-tical need to introduce grass carp between the two riversystems. On the other hand, it is reasonable that geneflow can be high between the two river systems becausethey partially overlap in geography. For these reasons,migration occurred much more naturally, and thus thepopulation differentiation showed a strong pattern ofisolation-by-distance. However, we cannot exclude thepossibility that human activities may have played an im-portant role in the dispersal of grass carp. Such geneflow might be merely induced so randomly that it canalso contribute to a pattern of isolation-by-distance. Incontrast to the Yangtze and the Pearl River systems, thedistribution and culture of grass carps in the Heilong-jiang River System have never been abundant nor con-sidered as a major aquaculture practice according toboth historical records and current official fishery statis-tics [12, 13]. Geographically, the Heilongjiang RiverSystem is completely isolated from the Yangtze and PearlRiver Systems. On the other hand, the Nenjiang locationshowed a signature of admixture from the three studiedriver systems. Hence, the low genetic differentiationbetween this river system and the other river systemsindicates that human-induced dispersal played a moreimportant role than natural gene flow. In fact, grasscarps in the Heilongjiang River System grow slower thanin the other river systems due to low water temperature[46]. Therefore, seeds from the other river systems, par-ticularly from the Yangtze River System, were commonlyintroduced for aquaculture purposes because of geo-graphical adjacency [12]. This is the most likely explan-ation for the low genetic differentiation of grass carpbetween the Heilongjiang River System and the otherriver systems. However, it is clear that the estimates ofgene flow based on genetic data should be cautious be-cause assumptions underlying the methods might not be
consistent with the actual action in the nature, particu-larly for the populations with large spatial distributionand complicated demographic history. Future studiesshould be based on approaches for direct estimation ofdispersal (e.g., small GPS tracker or radio transmittersand marker-assisted migration estimates), which cansubstantially improve the estimates of gene flow.It also should be noted that the genetic status of
Nenjiang in the Heilongjiang River System much likelyhas not been significantly influenced by the recent intro-duction of grass carp from the other river systems.Although ~ 50% of the overall genetic composition ofNenjiang was observed from the Yangtze and Pearl RiverSystems, some individuals still showed completely nativegenetic composition of the Heilongjiang River Systemwhile most of the others showed a large proportion ofgenetic composition from the other two river systems.Such results likely suggest that the introduced grasscarps have not randomly mated with the natives inNenjiang. Interestingly, a significant pattern of isolation-by-distance across native locations can be observedwhen excluding the grass carps in Nenjiang showingsignificant genetic composition from the other river sys-tems. This is also the differentiation pattern among thelocations within the Yangtze and Pearl River Systems.Altogether, our results suggest that the native gene poolof the Heilongjiang River System was still relatively inde-pendent and has not been significantly influenced by theimmigrants from the other river systems. It may also sug-gest that the reproduction and hybridization capacity forthe immigrants were limited in the extreme environmentand due to genomic divergence although this should beexperimentally examined in future studies. Above all, thecurrent population structure should be taken into consid-eration when establishing conservation strategies andutilizing the natural resources for aquaculture, particularlythe grass carps of Heilongjiang River System.
Origins of the introduced grass carpsAs discussed above, we observed significant genetic hetero-geneity both in terms of genetic diversity and differentiationbetween the native and the introduced locations, as well ashistorical population decline in demographic models,suggesting significant founder effects in the introducedlocations. It is likely that the introduction of grass carpswas not initiated under planned programs or that not allthe introduced fish could adapt to the new habitats. Asexpected, we identified significant population structure andalso a clear geographical pattern of differentiation amongthe three river systems in a background of high gene flow,which allows tracing back the origins of the introducedlocations [47]. Interestingly, the ancestral source popula-tions of the introduced locations in Malaysia and SouthAsia were inferred to be an admixture of populations from
Shen et al. BMC Genomics (2019) 20:467 Page 11 of 16

the Yangtze and Pearl River Systems. This was the mostwell-supported among competing scenarios. It was re-corded that grass carp was first introduced into Malaysiafrom Southern China with the large-scale migration ofChinese people in the 1800s [20]. As shown by a historystudy, most of the Chinese people in Southeast Asia werefrom Guangdong and Fujian provinces, which to some ex-tent geographically overlap with the Pearl and YangtzeRiver Systems, respectively. Thus, the Malaysian locationwas likely founded by immigrants from both Guangdongand Fujian provinces. As for the introduced locations inIndia and Nepal, the source origin was also inferred as anadmixture population from both the Yangtze and PearlRiver Systems, although it was recorded to be from HongKong, a city within the Pearl River System. Hong Kongimported almost all its freshwater fish products from main-land China [48] and it has been documented that HongKong has a long history of importing grass carp from theregions of both of the two river systems [48, 49]. Hence, itis likely that grass carp in Hong Kong is also an admixtureof populations between the two river systems.Taken together, our data suggest that the genetic dif-
ferentiation among native populations is high enough toallow tracing the origins of the recently introduced grasscarp (e.g., the populations introduced to Europe andNorth America [13]. These results are valuable forstudying the production and physiological adaptation, aswell as the living environments and habitat preferences,of both native and introduced locations. Such informa-tion can be referenced to construct comprehensiveintroduction plans for aquaculture of the grass carp forfood or for controlling water weeds in water ways in thefuture. It also should be noted that the source popula-tions don’t cover the whole native distribution areas ofgrass carp. Thus, we can not exclude the possibility thatthere are some other source populations that needfurther evaluation.
Local selection across native locationsIt is a great challenge to discriminate local selection fromneutral processes for organisms that have experiencedcomplicated demographic history. Neutral processes cangenerate the same marks on genomic architecture as localadaptation does [50, 51]. In some cases, adaptive traitsshow a specific distribution pattern along environmentalfactor. If the neutral forces are coincidentally varying alongsome specific environmental gradients, the difficulty of dis-entangling the roles of adaptive driving forces of the sameenvironmental gradients would be greatly exacerbated [52].Grass carp is a species with a significant signature of latitu-dinal distribution and a differentiation pattern of isolation-by-distance. Thus, the adaptive traits might vary in parallelwith the pattern of neutral processes along latitude. Theseevolutionary processes limited the potential to identify the
signals of local adaptation [52]. Here, we used concep-tually different approaches to differentiate the signa-tures of local adaptation from the currents of neutralevolutionary processes [51, 53].Grass carp originated from the Yangtze River System
and expanded into the Pearl and Heilongjiang River Sys-tems during the Pleistocene and Pliocene, respectively[12]. As the Pearl and Heilongjiang River Systems coverthe southernmost and the northernmost distributionranges, respectively, such contrasting environments havelikely posed strong selective pressure on the distributionof the grass carp. Such a process of natural selectionprovides important clues to discriminate signals of localadaptation from genome-wide patterns of isolation-by-distance. As discussed above, we found that ~ 50% ofgrass carps in Nenjiang likely originated from both theYangtze and Pearl River Systems, and the recently intro-duced grass carps much likely have not mated randomlywith the natives. Although the native gene pool ofHeilongjiang River System was still relatively independ-ent, the above-mentioned pattern of admixture is likelyto weaken or even disrupt the detection of signals of se-lection in localized populations. Considering the poten-tial adverse influence, only the results, after excludingthe individuals in Nenjiang carrying a large proportionof genetic composition from the other river systems,were taken into consideration for further discussion.In a strong background of isolation-by-distance for the
overall population differentiation, only 409 SNPs weredetected as putative candidates for local adaptation, ac-counting for 1.4% of the total analyzed loci. This ratio isrelatively low, compared to previous studies in fishspecies (2.3–10%, including Atlantic salmon [54] andChinook salmon [55] that showed weak or non-significantgenome-wide patterns of isolation-by-distance. Such re-sults likely suggest that the power to identify loci underselection is low under any high background FST, even if itdoes not correlate with distance. Bayenv revealed that 70SNPs were associated with latitudinal gradients, indicatingclinally adaptive divergence at these loci [56]. Moreover,343 SNPs were identified as putative FST outliers, whichlikely suggest diversifying selection across distinct distri-bution environments of grass carp. Interestingly, no over-lapping loci were identified between these conceptuallydifferent tests, suggesting a complicated demographichistory for the studied grass carp locations. Functionalannotation and enrichment analysis showed that most ofthe enriched biological function categories were commonbetween FST outliers and Bayenv results under putative se-lection, although there were only four shared loci betweenthe two types of data sets. Moreover, two pathways associ-ated with transcription factors were also enriched, imply-ing that transcription factors also likely play importantroles in driving local adaptation. One interesting finding
Shen et al. BMC Genomics (2019) 20:467 Page 12 of 16

of this study is that genes related to latitudinal gradi-ents were mainly enriched in the integral component ofmembrane category, including 10 genes. Previous stud-ies on thermal adaption in arctic and hot-springs fishspecies also suggested that components in membraneplayed an important role in evolutionary adaptation totemperature [57]. These data suggest that the 10 genesin the integral component of membrane category areimportant for thermal adaption. How these genes playan important role in local adaptation remains to furtherstudy by functional analysis of these genes in modelorganism, including zebrafish.
Selective pressures during introduction and colonizationIdentifying genetic variations during population intro-duction and colonization is critical to understanding themechanism of this evolutionary process and developingstrategies for genetic control of biological invasions [10].The grass carp has successfully been introduced to andcolonized new continents, including North America,Australia and Europe, and are destroying the nativespecies in the new habitats [13]. Although phenotypicplasticity can play important roles in rapid adaptation tonovel diverse environments, fluctuations in genetic vari-ations are likely much more important for the invasivespecies in response to rapid changes of selective pres-sures [58]. For introduced populations, founder effects,random genetic drift and directional positive selectiontend to reduce genetic diversity at the whole genomelevel [8]. Nevertheless, many adaptation-related traitsare polygenic and thus the loss of variation at these locimight not influence the fitness as quickly as loss of vari-ation at individual loci does for qualitative traits [58].Nevertheless, founder effects, random genetic drift anddirectional positive selection are strong enough to driveintroduced populations of small population size towardsallopatric divergence [44, 59]. Such rapid populationdifferentiation and the underlying complicated demo-graphic history can generate confusing signals and thusgenerate great challenges to the present statistical ap-proaches to identify the signatures of positive selection[36]. In this study, we found that only 11 out of 28,412loci (0.04%) were consistently detected by both Arlequin(335) and BayeScan (191) to be under putative positiveselection for the introduced locations, much likely sug-gesting a considerable proportion of false positives inthe detected loci. This result does not necessarily suggestpositive selection in the introduced grass carps due tothe low effectiveness of FST-based outlier tests in popula-tions of complicated demographic history [36]. We alsocannot exclude the possibility that genetic changes fit-ting the corresponding positive selections occurred priorto introduction of the studied grass carp, so that the sig-nal of positive selection in the form of FST was disturbed
[10]. In total, the pressure of positive selection in the in-troduced grass carp is still unclear and likely has beensignificantly underestimated.In comparison to directionally positive selection, many
more loci (74, 0.26%) were consistently identified to beunder putative balancing selection by Arlequin (206)and BayeScan (77). In particular, BayeScan showed amore conservative result than Arlequin did, which islikely because the scenarios underlying BayeScan are lesssensitive to the changes of effective population size andimmigration rates among studied locations [36]. In pop-ulations having experienced significant founder events,genetic drift and directional selection, higher genetic di-versity at specific loci is typically maintained by putativebalancing selection. Genes associated with these loci arecritically important for the introduced species to survivein novel environments [9]. We observed that genesunder putative balancing selection were associated withmany functions in grass carp as revealed by GO enrich-ment analysis. However, loci under putative balancingselection have not attracted sufficient attention as muchas the loci under putative positive selection, becausepositive selection seems to be more evidently related tospatial geographic factors and quantized environmentalvariables [60]. Here, we found that one non-synonymousmutation in a hot shock protein family gene, DnaJ(Hsp40) homolog, subfamily B, member 9a (DNAJB9a),was under putative balancing selection within the intro-duced locations of grass carp. This gene plays an import-ant role in disease and stress responses [61].Maintaining a high level of genetic variation at this locusis likely critical to the survival of the species in differentenvironments. Thus, involving a variety of selectivesweeps to maintain beneficial genetic diversity, balancingselection could be just as critical as directional positiveselection to the survival of isolated populations. How-ever, these results should be taken with caution, as lociunder putative selection still suffered from false positivesdue to low effectiveness of outlier tests. Nevertheless, weidentified evidence of both positive and balancing selec-tion on grass carp distributed in diverse environmentalconditions. These evolutionary forces in combinationwith the environment variables should be taken intoaccount when designing introduction strategies for bothbiological control and selective breeding purposes.
Genome-wide patterns of differentiationThe ‘divergence hitchhiking’ scenario of divergence-with-gene-flow, in which specific genomic regions showelevated differentiation than average, has been testifiedin some fish species (e.g., stickleback, Gasterosteus acu-leatus [62], Atlantic cod, Gadus morhua [63] and cichlidspecies [64]. Here, we observed evidence of such a ‘gen-omic islands’ model of divergence-with-gene-flow in the
Shen et al. BMC Genomics (2019) 20:467 Page 13 of 16

grass carp, a freshwater fish species isolated by longgeographic distance but with considerable gene flow. In-dependent of SNP density, the clustering of outlier SNPswithin the specific genomic regions with elevated FST isnot likely to be artifacts resulting from the relativelysmall number and the uneven distribution of markers.Consistent with conclusions in cichlid, stickleback andsome other fish species, the ‘genomic islands’ modelmight be a common pattern of divergence with frequentgene flow [3]. Different from species with high geneflow, grass carps are geographically isolated by long dis-tance with a strong background of isolation-by-distance,and the gene flow among populations is also low. Thepresence of ‘genomic islands’ or divergence hitchhikingof loci under selection is likely to suggest that the pres-sure of natural selection can overwhelm the effects ofrandom genetic drift, mutation, gene flow and popula-tion subdivision [4], and selection sweeps do not workon random, isolated and physically unlinked genes [44].
ConclusionsUsing population genomic approaches, we detected lowbut significant genetic differentiation in native locations ofgrass carp and disentangled the effects of environmentalfactors, demographic history and human activities on con-temporary genetic differentiation. The level of differenti-ation allows tracing the global introduction history of grasscarp. The applications of different approaches identified aset of loci under putative positive and balancing selectionfor the native and introduced locations, respectively. Thelatitudinal distribution of native grass carp likely has anadaptive genetic basis, although the underlying causes re-main to be elucidated. Nevertheless, local adaptation haslikely played important roles in shaping the contemporarypopulation structure of grass carp. Balancing selection isalso likely indispensable to the survival of grass carp duringintroduction so as to adapt to new habitats. Our datashed new lights on population structure, genetic di-versity, sources of introduction and the strong abilityof the grass carp in adapting to diverse environments,which could, in turn, facilitate its aquaculture.
Additional files
Additional file 1: Figure S1. Sampling sites of six native grass carplocations distributed in the three river systems: the Heilongjiang River (H),the Yangtze River (Y) and the Pearl River (P), and three introducedlocations from Malaysia (I), India (I) and Nepal (I). The native andintroduced locations are denoted as black and red solid circles,respectively. Detailed sampling information is listed in Table 1. (Thisfigure is made from Google Maps. No explicit permission is requiredaccording to the guidelines of Google Maps (https://www.google.com/permissions/geoguidelines/). (JPG 1359 kb)
Additional file 2: Figure S2. The overall pattern of isolation-by-distancefor (a) all six native locations, (b) five native locations excluding Nenjiangand (c) all six native locations excluding individuals from Nenjiang (10)
showing significant genetic composition from both the Yangtze and PearlRiver Systems, examined using Mantel tests based on all genotyped SNPs.Genetic distance was estimated as FST/(1-FST), while geographical distancewas the linear distance between sampling localities. (JPG 566 kb)
Additional file 3: Figure S3. A phylogenetic tree showing relationshipsamong all nine locations of grass carp, which was constructed using theNeighbour-Joining approach with bootstrap values over loci for 1000times. (JPG 409 kb)
Additional file 4: Figure S4. Plot for cross-validation errors at each Kvalue for nine grass carp locations. (JPG 357 kb)
Additional file 5: Figure S5. Population structure across nine locationsof grass carp as inferred using Admixture at K = 5. (JPG 80 kb)
Additional file 6: Figure S6. Gene ontology annotations of thecandidate genes under putative selection identified by outlier tests andBayenv association tests in grass carp. Three categories: CellularComponent, Molecular Function and Biological Process, were used tovisualize the potential functions of enriched genes. (JPG 157 kb)
Additional file 7: Figure S7. Genome-wide pattern of differentiation (a)and SNP density (b) calculated using 150 Kb sliding window size. Distributionof SNPs under putative positive selection in four scaffolds of the referencegenome with the greatest number of outlier loci are shown in (c), whereclusters of SNPs under putative positive selection are in shadow.(JPG 1626 kb)
Additional file 8: Table S1. Sampling information of six native andthree introduced locations of grass carp including river systems of origin,numbers of samples, sampling localities and dates, and the annualaverage temperature of each sampling locality. Measures of geneticdiversity including observed heterozygosity (HO), expected heterozygosity(HE) and nucleotide diversity (Π) are also indicated. (DOCX 14 kb)
Additional file 9: Table S2. Pairwise FST values among each pair oflocations of grass carp. Genetic differentiation that was non-significantafter Bonferroni corrections (P < 0.001) is denoted in bold. (DOCX 14 kb)
Additional file 10: Table S3. Parameters used for Diyabc modellingand its distribution for historical demographic parameters of the bestcompeting scenario for two datasets. (DOCX 16 kb)
Additional file 11: Table S4. List of annotated genes under putativeselection identified by outlier tests and Bayenv association tests. (XLSX 20 kb)
Additional file 12: Table S5. Summary of the SNPs associated withlocal selection that are identified to be located in coding sequences ofgenes and showing non-synonymous mutations. Codon variant positionswith the two alternative nucleotides and the corresponding amino acidchange are shown in the “Codon” and “Amino acid” columns, respectively.(DOCX 17 kb)
Additional file 13: Table S6. Enriched KEGG pathways and the genecounts under putative selection identified by outlier tests and Bayenvassociation tests. (XLSX 10 kb)
AbbreviationsBF: Bayes factor; ddRAD-seq: double digest restriction-site associated DNA;GBS: genotyping by sequencing; GO: gene ontology; HWE: Hardy-Weinbergequilibrium; IBD: isolation-by-distance; KEGG: Kyoto Encyclopedia of Genesand Genomes; MAF: minor allele frequency; PCA: principal componentanalysis
AcknowledgementsWe thank Mr. Narayan Prasad Pandit and Mr. Dang Hai Nguyen for samplescollection from Vietnam, India and Nepal respectively.
Authors’ contributionsJL and GHY conceived the study and finalized the manuscript. YS and LWdesigned the experiments. YS, JF and XX carried out the lab experiments. LWand YS performed bioinformatics, molecular data analysis and drafted themanuscript. All authors read and approved the final manuscript.
FundingThis research is supported by the National Key Technology R&D Program of China(2012BAD26B02) and the China Agriculture Research System (CARS-45-03)
Shen et al. BMC Genomics (2019) 20:467 Page 14 of 16

foundations. The funding bodies played no roles in the design of the study,collection, analysis, interpretation of data, or in writing the manuscript.
Availability of data and materialsRaw sequencing reads for this study are available at DDBJ database withBioProject accession no. PRJDB4785. SNP data set can be accessed via emailto the corresponding authors.
Ethics approvalAll handling of fishes was conducted in accordance with the guidelines onthe care and use of animals for scientific purposes set up by the InstitutionalAnimal Care and Use Committee (IACUC) of the Shanghai Ocean University,Shanghai, China. The IACUC has specially approved this study within theproject “Breeding of Grass Carp” (approval number is SHOU-09-007).
Consent for publicationNot applicable.
Competing interestsThe authors declare that they have no competing interests.
Author details1Key Laboratory of Freshwater Aquatic Genetic Resources, Ministry ofAgriculture, Shanghai Ocean University, Shanghai 201306, China. 2MolecularPopulation Genetics & Breeding Group, Temasek Life Sciences Laboratory, 1Research Link, National University of Singapore, Singapore 117604, Republicof Singapore. 3Key Laboratory of Freshwater Fisheries and GermplasmResources Utilization, Ministry of Agriculture, Freshwater Fisheries ResearchCenter, Chinese Academy of Fishery Sciences, Wuxi 214081, China.4Department of Biological Sciences, National University of Singapore, 14Science Drive 4, Singapore 117543, Republic of Singapore. 5School ofBiological Sciences, Nanyang Technological University, 60 Nanyang Drive,Singapore 637551, Republic of Singapore. 6Key Laboratory of Exploration andUtilization of Aquatic Genetic Resources, Ministry of Education, ShanghaiOcean University, Shanghai 201306, China.
Received: 19 December 2018 Accepted: 31 May 2019
References1. Hughes AR, Inouye BD, Johnson MT, Underwood N, Vellend M. Ecological
consequences of genetic diversity. Ecol Lett. 2008;11(6):609–23.2. Shen Y, Yue G. Current status of research on aquaculture genetics and
genomics-information from ISGA 2018. Aquac Fish. 2019;4(2):43–7.3. Feder JL, Egan SP, Nosil P. The genomics of speciation-with-gene-flow.
Trends Genet. 2012;28(7):342–50.4. Feder JL, Nosil P. The efficacy of divergence hitchhiking in generating
genomic islands during ecological speciation. Evolution. 2010;64(6):1729–47.5. Nosil P, Funk DJ, Ortiz-Barrientos D. Divergent selection and heterogeneous
genomic divergence. Mol Ecol. 2009;18(3):375–402.6. Wolf JB, Ellegren H. Making sense of genomic islands of differentiation in
light of speciation. Nat Rev Genet. 2017;18:87–100.7. Allendorf FW. Genetic drift and the loss of alleles versus heterozygosity. Zoo
Biol. 1986;5(2):181–90.8. Clegg SM, Degnan SM, Moritz C, Estoup A, Kikkawa J, Owens IP.
Microevolution in island forms: the roles of drift and directional selection inmorphological divergence of a passerine bird. Evolution. 2002;56(10):2090–9.
9. Delph LF, Kelly JK. On the importance of balancing selection in plants. NewPhytol. 2014;201(1):45–56.
10. Vera M, Díez-del-Molino D, García-Marín JL. Genomic survey providesinsights into the evolutionary changes that occurred during Europeanexpansion of the invasive mosquitofish (Gambusia holbrooki). Mol Ecol.2016;25(5):1089–105.
11. Allendorf FW, Lundquist LL. Introduction: population biology, evolution, andcontrol of invasive species. Conserv Biol. 2003;17(1):24–30.
12. Xie C, Li J, Li D, Shen Y, Gao Y, Zhang Z: Grass carp: the fish that feeds halfof China. Aquaculture in China: Success Stories and Modern Trends 2018:93–115.
13. FAO: Cultured aquatic species information programme Ctenopharyngodonidellus. In. Rome, www.fao.org/fishery/culturedspecies/Ctenopharyngodon_idellus, (accessed 12/2018); 2014.
14. Liu F, Xia JH, Bai ZY, Fu JJ, Li JL, Yue GH. High genetic diversity andsubstantial population differentiation in grass carp (Ctenopharyngodonidella) revealed by microsatellite analysis. Aquaculture. 2009;297(1):51–6.
15. Fu J, Li J, Shen Y, Wang R, Xuan Y, Xu X, Chen Y. Genetic variation analysisof wild populations of grass carp (Ctenopharyngodon idella) usingmicrosatellite markers. Hereditas. 2013;35(2):192–201.
16. Chen Q, Wang C, Lu G, Zhao J, Chapman DC, Zsigmond J, Li S.Microsatellite genetic diversity and differentiation of native and introducedgrass carp populations in three continents. Genetica. 2012;140(4–6):115–23.
17. Li D, Wang S, Shen Y, Meng X, Xu X, Wang R, Li J. A multiplex microsatellitePCR method for evaluating genetic diversity in grass carp(Ctenopharyngodon idellus). Aquaculture and Fisheries. 2019. https://doi.org/10.1016/j.aaf.2018.09.001.
18. CABI: Ctenopharyngodon idella (grass carp), https://www.cabi.org/isc/datasheet/16772. Accessed on the 8th of Dec 2018. 2018.
19. Song X, Li S, Wang C, Xu J, Yang Q. Grass carp (Ctenopharyngodon idellus)genetic structure analysis among native populations in China andintroduced populations in USA, Europe and Japan based on mitochondrialsequence. Acta Hydrobiologica Sinica. 2009;33(4):709–16.
20. Welcomme RL: International introductions of inland aquatic species: Food &Agriculture Organisation of the United Nations. Rome, Italy; 1988.
21. Peterson BK, Weber JN, Kay EH, Fisher HS, Hoekstra HE. Double digestRADseq: an inexpensive method for de novo SNP discovery andgenotyping in model and non-model species. PLoS One. 2012;7(5):e37135.
22. Catchen JM, Amores A, Hohenlohe P, Cresko W, Postlethwait JH. Stacks:building and genotyping loci de novo from short-read sequences. G3. 2011;1(3):171–82.
23. Wang Y, Lu Y, Zhang Y, Ning Z, Li Y, Zhao Q, Lu H, Huang R, Xia X, Feng Q. Thedraft genome of the grass carp (Ctenopharyngodon idellus) provides insightsinto its evolution and vegetarian adaptation. Nat Genet. 2015;47(6):625–31.
24. Li H, Durbin R. Fast and accurate long-read alignment with burrows–wheeler transform. Bioinformatics. 2010;26(5):589–95.
25. Hohenlohe PA, Bassham S, Etter PD, Stiffler N, Johnson EA, Cresko WA.Population genomics of parallel adaptation in threespine stickleback usingsequenced RAD tags. PLoS Genet. 2010;6(2):e1000862.
26. Raymond M, Rousset F. GENEPOP (version 1.2): population geneticssoftware for exact tests and ecumenicism. J Hered. 1995;86(3):248–9.
27. Excoffier L, Lischer HE. Arlequin suite ver 3.5: a new series of programs toperform population genetics analyses under Linux and windows. Mol EcolResour. 2010;10(3):564–7.
28. Price AL, Patterson NJ, Plenge RM, Weinblatt ME, Shadick NA, Reich D.Principal components analysis corrects for stratification in genome-wideassociation studies. Nat Genet. 2006;38(8):904–9.
29. Bohonak A. IBD (isolation by distance): a program for analyses of isolationby distance. J Hered. 2002;93(2):153–4.
30. Alexander DH, Novembre J, Lange K. Fast model-based estimation ofancestry in unrelated individuals. Genome Res. 2009;19(9):1655–64.
31. Takezaki N, Nei M, Tamura K. POPTREE2: software for constructing populationtrees from allele frequency data and computing other population statisticswith windows interface. Mol Biol Evol. 2010;27(4):747–52.
32. Beaumont MA, Zhang W, Balding DJ. Approximate Bayesian computation inpopulation genetics. Genetics. 2002;162(4):2025–35.
33. Cornuet J-M, Pudlo P, Veyssier J, Dehne-Garcia A, Gautier M, Leblois R, MarinJ-M, Estoup A. DIYABC v2. 0: a software to make approximate Bayesiancomputation inferences about population history using single nucleotidepolymorphism, DNA sequence and microsatellite data. Bioinformatics. 2014;30(8):1187–9.
34. Danecek P, Auton A, Abecasis G, Albers CA, Banks E, DePristo MA,Handsaker RE, Lunter G, Marth GT, Sherry ST. The variant call format andVCFtools. Bioinformatics. 2011;27(15):2156–8.
35. Coop G, Witonsky D, Di Rienzo A, Pritchard JK. Using environmentalcorrelations to identify loci underlying local adaptation. Genetics. 2010;185(4):1411–23.
36. Foll M, Gaggiotti O. A genome-scan method to identify selected lociappropriate for both dominant and codominant markers: a Bayesianperspective. Genetics. 2008;180(2):977–93.
37. Excoffier L, Hofer T, Foll M. Detecting loci under selection in a hierarchicallystructured population. Heredity. 2009;103(4):285–98.
38. Conesa A, Götz S, García-Gómez JM, Terol J, Talón M, Robles M. Blast2GO: auniversal tool for annotation, visualization and analysis in functionalgenomics research. Bioinformatics. 2005;21(18):3674–6.
Shen et al. BMC Genomics (2019) 20:467 Page 15 of 16

39. Ye J, Fang L, Zheng H, Zhang Y, Chen J, Zhang Z, Wang J, Li S, Li R, BolundL. WEGO: a web tool for plotting GO annotations. Nucleic Acids Res. 2006;34(suppl(2):293–7.
40. Kanehisa M, Goto S. KEGG: Kyoto encyclopedia of genes and genomes.Nucleic Acids Res. 2000;28(1):27–30.
41. Huang DW, Sherman BT, Lempicki RA. Systematic and integrative analysis of largegene lists using DAVID bioinformatics resources. Nat Protoc. 2009;4(1):44–57.
42. Mueller JC, Edelaar P, Baños-Villalba A, Carrete M, Potti J, Blas J, Tella JL,Kempenaers B. Selection on a behaviour-related gene during the first stagesof the biological invasion pathway. Mol Ecol. 2017;26(21):6110–21.
43. Puzey JR, Willis JH, Kelly JK. Population structure and local selection yieldhigh genomic variation in Mimulus guttatus. Mol Ecol. 2017;26(2):519–35.
44. Wang L, Wan ZY, Lim HS, Yue GH. Genetic variability, local selection anddemographic history: genomic evidence of evolving towards allopatricspeciation in Asian seabass. Mol Ecol. 2016;25(15):3605–21.
45. Ward R, Woodwark M, Skibinski D. A comparison of genetic diversity levelsin marine, freshwater, and anadromous fishes. J Fish Biol. 1994;44(2):213–32.
46. Cui Y, Chen S, Wang S: Effect of temperature on the energy budget of thegrass carp, Ctenopharyngodon idellus. Oceanologia et Limnologia Sinica1995, 26(2):169–174.
47. Cornuet J-M, Piry S, Luikart G, Estoup A, Solignac M. New methodsemploying multilocus genotypes to select or exclude populations as originsof individuals. Genetics. 1999;153(4):1989–2000.
48. Hong Kong: The facts-agriculture and fisheries, http://www.gov.hk/en/about/abouthk/factsheets/docs/agriculture.pdf
49. Choi WM, Lam CL, Mo WY, Wong M. The use of food wastes as feedingredients for culturing grass carp (Ctenopharyngodon idellus) in HongKong. Environ Sci Pollut Res. 2016;23(8):7178–85.
50. McKown AD, Guy RD, Klápště J, Geraldes A, Friedmann M, Cronk QC, El-Kassaby YA, Mansfield SD, Douglas CJ. Geographical and environmentalgradients shape phenotypic trait variation and genetic structure in Populustrichocarpa. New Phytol. 2014;201(4):1263–76.
51. Wang L, Liu S, Zhuang Z, Guo L, Meng Z, Lin H. Population genetic studiesrevealed local adaptation in a high gene-flow marine fish, the small yellowcroaker (Larimichthys polyactis). PLoS One. 2013;8(12):e83493.
52. McKay JK, Latta RG. Adaptive population divergence: markers, QTL andtraits. Trends Ecol Evol. 2002;17(6):285–91.
53. Hansen MM, Meier K, Mensberg KLD. Identifying footprints of selection instocked brown trout populations: a spatio-temporal approach. Mol Ecol.2010;19(9):1787–800.
54. Bourret V, Kent MP, Primmer CR, Vasemägi A, Karlsson S, Hindar K,McGinnity P, Verspoor E, Bernatchez L, Lien S. SNP-array revealsgenome-wide patterns of geographical and potential adaptivedivergence across the natural range of Atlantic salmon (Salmo salar).Mol Ecol. 2013;22(3):532–51.
55. Larson WA, Seeb LW, Everett MV, Waples RK, Templin WD, Seeb JE.Genotyping by sequencing resolves shallow population structure to informconservation of Chinook salmon (Oncorhynchus tshawytscha). Evol Appl.2014;7(3):355–69.
56. Vasemägi A. The adaptive hypothesis of clinal variation revisited: single-locus clinesas a result of spatially restricted gene flow. Genetics. 2006;173(4):2411–4.
57. Cossins A, Prosser C. Evolutionary adaptation of membranes to temperature.Proc Natl Acad Sci. 1978;75(4):2040–3.
58. Stephan W. Signatures of positive selection: from selective sweeps atindividual loci to subtle allele frequency changes in polygenic adaptation.Mol Ecol. 2016;25(1):79–88.
59. Pereira RJ, Barreto FS, Pierce NT, Carneiro M, Burton RS. Transcriptome-wide patternsof divergence during allopatric evolution. Mol Ecol. 2016;25(7):1478–93.
60. Forester BR, Jones MR, Joost S, Landguth EL, Lasky JR. Detecting spatialgenetic signatures of local adaptation in heterogeneous landscapes. MolEcol. 2016;25(1):104–20.
61. Volchuk A, Ron D. The endoplasmic reticulum stress response in thepancreatic β-cell. Diabetes Obes Metab. 2010;12(s2):48–57.
62. Via S. Divergence hitchhiking and the spread of genomic isolation duringecological speciation-with-gene-flow. Philos Trans R Soc B Biol Sci. 2012;367(1587):451–60.
63. Hemmer-Hansen J, Nielsen EE, Therkildsen NO, Taylor MI, Ogden R, GeffenAJ, Bekkevold D, Helyar S, Pampoulie C, Johansen T. A genomic islandlinked to ecotype divergence in Atlantic cod. Mol Ecol. 2013;22(10):2653–67.
64. Malinsky M, Challis RJ, Tyers AM, Schiffels S, Terai Y, Ngatunga BP, MiskaEA, Durbin R, Genner MJ, Turner GF. Genomic islands of speciation
separate cichlid ecomorphs in an east African crater lake. Science. 2015;350(6267):1493–8.
Publisher’s NoteSpringer Nature remains neutral with regard to jurisdictional claims inpublished maps and institutional affiliations.
Shen et al. BMC Genomics (2019) 20:467 Page 16 of 16