portfolio additional estimates statements 2008-09 · bills (no. 3 and no. 4) 2008-09. in this sense...
TRANSCRIPT

PORTFOLIO ADDITIONAL ESTIMATES STATEMENTS 2008-09 TREASURY PORTFOLIO EXPLANATIONS OF ADDITIONAL ESTIMATES 2008-09

© Commonwealth of Australia 2008
ISBN 978-0-642-74494-4
This work is copyright. Apart from any use as permitted under the Copyright Act 1968, no part may be reproduced by any process without prior written permission from the Commonwealth. Requests and inquiries concerning reproduction and rights should be addressed to the:
Commonwealth Copyright Administration Attorney-General’s Department Robert Garran Offices National Circuit BARTON ACT 2600
Or posted at Website: www.ag.gov.au/cca
Printed by CanPrint Communications Pty Ltd
TREASURER PO BOX 6022
PARLIAMENT HOUSE CANBERRA ACT 2600
Telephone: 02 6277 7340 Facsimile: 02 6273 3420
www.treasurer.gov.au
President of the Senate Australian Senate Parliament House CANBERRA ACT 2600 Speaker House of Representatives Parliament House CANBERRA ACT 2600 Dear Mr President Dear Mr Speaker I hereby submit the Portfolio Additional Estimates Statements in support of the 2008-09 Additional Estimates for the Treasury portfolio. These statements have been developed, and are submitted to the Parliament, as a statement on the additional funding requirements being sought for the portfolio.
I present these statements to provide accountability to the Parliament and, through it, the public.
Yours sincerely
WAYNE SWAN

iv
ABBREVIATIONS AND CONVENTIONS
(a) The following notations may be used:
- nil $m $ million
(b) Figures in tables and in the text may be rounded. Discrepancies in tables between totals and sums of components are due to rounding.
ENQUIRIES
Should you have any enquiries regarding this publication please contact Ms Nicole Scott in the Department of the Treasury on (02) 6263 2111.
A copy of this document can be located on the Australian Government Budget website at: http://www.budget.gov.au.

v
USER GUIDE The purpose of the Portfolio Additional Estimates Statements (PAES), like that of the Portfolio Budget Statements, is to inform Senators and Members of Parliament and the public of the proposed allocation of resources to Government outcomes by agencies within the portfolio. However, unlike the Portfolio Budget Statements, the PAES summarise only the changes in resourcing by outcome since the Budget, that is, they update the resourcing for the agency. The PAES include an agency resource statement, in addition to the information on new measures and the Appropriation Bills.
The PAES facilitate understanding of the proposed appropriations in Appropriation Bills (No. 3 and No. 4) 2008-09. In this sense the PAES is declared by the Additional Estimates Appropriation Bills to be a ‘relevant document’ to the interpretation of the Bills according to section 15AB of the Acts Interpretation Act 1901.
Whereas the Mid-Year Economic and Fiscal Outlook 2008-09 is a mid-year budget report which provides updated information to allow the assessment of the Government’s fiscal performance against its fiscal strategy, the PAES update the most recent budget appropriations for agencies within the portfolio.

User Guide
vi
STRUCTURE OF THE PORTFOLIO ADDITIONAL ESTIMATES STATEMENTS
The PAES are presented in three parts with subsections.
User guide
Provides an introduction explaining the purpose of the PAES.
Portfolio overview
Provides an overview of the portfolio, including a chart that outlines the outcomes for agencies in the portfolio.
Agency additional estimates statements
A statement (under the name of the agency) for each agency affected by additional estimates.
Section 1: Agency overview and resources
This section details the total resources available to an agency, the impact of any measures since Budget, and impact on Appropriation Bills No. 3 and No. 4.
Section 2: Revisions to outcomes and planned performance
This section details changes to Government outcomes and/or changes to the planned performance of agency output groups.
Section 3: Explanatory tables and budgeted financial statements
This section contains updated explanatory tables on special account flows and staffing levels and revisions to the budgeted financial statements.
Glossary Explains key terms relevant to the portfolio.

vii
CONTENTS
Portfolio Overview ........................................................................................................ 3
Agency Additional Estimates Statements
Department of the Treasury ............................................................................................ 7 Australian Bureau of Statistics ......................................................................................25 Australian Competition and Consumer Commission ....................................................37 Australian Prudential Regulation Authority ...................................................................53 Australian Securities and Investments Commission .....................................................73 Office of the Auditing and Assurance Standards Board ...............................................93 Office of the Australian Accounting Standards Board.................................................107 Portfolio glossary.........................................................................................................121


PORTFOLIO OVERVIEW


3
PORTFOLIO OVERVIEW
The Office of the Auditing and Assurance Standards Board (AUASB) and the Office of the Australian Accounting Standards Board (AASB) have transferred governance arrangements from the Commonwealth Authorities and Companies Act 1997 framework to the Financial Management and Accountability Act 1997 framework from 1 July 2008.
This has resulted in both the AUASB and AASB now being appropriated directly from Government and will now report as separate agencies within the Treasury portfolio.
Details about the AUASB and AASB appear in their respective sections in the Portfolio Additional Estimates Statements.
There has been no other change to the portfolio overview from that included in the Portfolio Budget Statements 2008-09.
ADDITIONAL ESTIMATES AND VARIATIONS — PORTFOLIO LEVEL
Additional estimates are being sought for the Department of the Treasury, the Australian Bureau of Statistics, the Australian Competition and Consumer Commission, the Australian Prudential Regulation Authority, the Australian Securities and Investments Commission, the AUASB and the AASB. Explanations of additional estimates for these agencies are detailed in their respective section in the Portfolio Additional Estimates Statements.
There are no additional estimates for the Australian Office of Financial Management, the Australian Taxation Office, the Commonwealth Grants Commission, the Corporations and Markets Advisory Committee, the Inspector-General of Taxation, the National Competition Council, the Productivity Commission or the Royal Australian Mint.

Portfolio Overview
4
Figure 1: The Treasury portfolio structure and outcomes Portfolio Minister - Treasurer
The Hon Wayne Swan MPAssistant Treasurer and Minister for Competition Policy and Consumer Affairs
The Hon Chris Bowen MPMinister for Superannuation and Corporate Law
Senator the Hon Nick Sherry
Department of the TreasurySecretary: Dr Ken Henry AC
Outcome 1: Sound macroeconomic environmentOutcome 2: Effective government spending arrangements
Outcome 3: Effective taxation and retirement income arrangementsOutcome 4: Well functioning markets
Australian Bureau of StatisticsStatistician: Mr Brian Pink
Informed decision making, research and discussion within governments and the community basedon the provision of a high quality, objective and responsive national statistical service
Australian Competition and Consumer CommissionChairperson: Mr Graeme Samuel
To enhance social and economic welfare of the Australian community by fostering competitive,efficient, fair and informed Australian markets
Australian Office of Financial ManagementChief Executive Officer: Mr Neil Hyden
To enhance the Commonwealth’s capacity to manage its net debt portfolio, offering the prospect of savings indebt servicing costs and an improvement in the net worth of the Commonwealth over time
Australian Prudential Regulation AuthorityChairman: Dr John Laker
To enhance public confidence in Australia’s financial institutions through a framework of prudential regulationwhich balances financial safety and efficiency, competition, contestability and competitive neutrality
Australian Securities and Investments CommissionChairman: Mr Tony D'Aloisio
A fair and efficient market characterised by integrity and transparency and supporting confident and informedparticipation of investors and consumers
Australian Taxation OfficeCommissioner: Mr Michael D'Ascenzo
Effectively managed and shaped systems that support and fund services for Australians and give effect to social and economic policy through the tax, superannuation, excise and other related systems
Commonwealth Grants CommissionSecretary: Mr John Spasojevic
Fiscal equalisation between the States, the Australian Capital Territory and the Northern Territoryis achieved through the distribution, by Government, of GST revenue and Health Care Grants
Corporations and Markets Advisory CommitteeConvenor: Mr Richard St John
A fair and efficient market characterised by integrity and transparency and supporting confident andinformed participation of investors and consumers

Portfolio Overview
5
Figure 1: The Treasury portfolio structure and outcomes (continued) Inspector-General of Taxation
Inspector-General: Mr Ali NorooziImproved administration of the tax laws for the benefit of all taxpayers
National Competition CouncilActing President: Mr David Crawford
The achievement of effective and fair competition reforms and better use of Australia’s infrastructurefor the benefit of the community
Office of the Australian Accounting Standards BoardActing Chairman: Mr Bruce Porter
The formulation and making of accounting standards that are used by Australian entities to prepare financial reports and enable users of these reports to make informed decisions
Office of the Auditing and Assurance Standards BoardChairman: Ms Merran Kelsall
The formulation and making of auditing and assurance standards that are used by auditors of Australian entity financial reports or for other auditing and assurance engagements
Productivity CommissionChairman: Mr Gary Banks AO
Well-informed policy decision-making and public understanding on matters relating to Australia’s productivity and living standards, based on independent and transparent analysis from a community-wide perspective
Royal Australian MintChief Executive Officer: Ms Janine Murphy
Manufacture and sale of circulating coins, to meet the coinage needs of the Australian economy, and collector coins and other minted products for Australia and foreign countries


7
DEPARTMENT OF THE TREASURY
Section 1: Agency overview and resources............................................................... 9 1.1 Strategic direction ................................................................................................. 9 1.2 Agency resource statement ................................................................................10 1.3 Agency measures table ......................................................................................12 1.4 Additional estimates and variations ....................................................................12 1.5 Breakdown of additional estimates by Appropriation Bill ....................................14
Section 2: Revisions to agency outcomes and planned performance..................15 2.1 Outcomes and performance information ............................................................15
Section 3: Explanatory tables and budgeted financial statements .......................16 3.1 Explanatory tables ..............................................................................................16 3.2 Budgeted financial statements............................................................................17


9
DEPARTMENT OF THE TREASURY
Section 1: Agency overview and resources
1.1 STRATEGIC DIRECTION
There has been no significant change to the strategic direction of the Department of the Treasury from that outlined in the Portfolio Budget Statements 2008-09 (pages 13-15).
The Department of the Treasury is seeking an additional $0.7 million in departmental outputs through Appropriation Bill (No. 3) 2008-09. This relates to: an additional $2.5 million for the global financial crisis – additional funding for regulators and the Treasury measure; $1.0 million for the Council of Australian Governments - implementing a national approach to the regulation of consumer credit measure; $0.3 million to assist in the implementation of operation sunlight measure; and offset by a reduction of $3.1 million to be transferred to equity injections as part of a reallocation of funds for Standard Business Reporting. The reallocation will have no net impact on the Budget.
The Department of the Treasury is also seeking an additional $11.8 million in equity injections through Appropriation Bill (No. 4) 2008-09 as part of a reallocation of funds for Standard Business Reporting from the Australian Bureau of Statistics, the Australian Prudential Regulation Authority and the Australian Securities and Investments Commission. The reallocation will have no net impact on the Budget.
The Department of the Treasury is also seeking an additional $3.2 million for payments to the States and Territories through Appropriation Bill (No. 4) 2008-09 for Standard Business Reporting. This is a movement of funds from 2007-08.
The Department of the Treasury is also seeking an additional $4.0 million for administered assets and liabilities through Appropriation Bill (No. 4) 2008-09 for payments in relation to the HIH assistance scheme ($4.0 million) and subscriptions to international financial institutions ($0.05 million).

Agency Additional Estimates Statements — Treasury
10
1.2 AGENCY RESOURCE STATEMENT
Table 1.1 outlines the total resourcing available from all sources for the 2008-09 Budget year, including variations through Appropriation Bills No. 3 and No. 4, special appropriations and special accounts.
Table 1.1: Department of the Treasury resource statement — additional estimates for 2008-09 as at Additional Estimates December 2008
Estimate Proposed Total Totalas at + additional = estimate available
Budget estimates at Additional appropriationEstimates
2008-09 2008-09 2008-09 2007-08$'000 $'000 $'000 $'000
Ordinary annual servicesDepartmental outputs
Prior year amounts available 71,450 - 71,450 - Departmental outputs 144,143 1 728 2 144,871 150,844 Receipts from other sources (s31) 10,818 - 10,818 11,144 Total departmental outputs 226,411 728 227,139 161,988
Administered expensesOutcome 4 - Housing Loan Insurance
Company Limited - payments inrespect of insurance claims 5,000 - 5,000 5,000
Total administered expenses 5,000 - 5,000 5,000 Total ordinary annual services A 231,411 728 232,139 166,988 Other servicesDepartmental non-operating
Equity injections 9,541 11,763 3 21,304 8,978 Previous years' outputs - - - 1,820 Total departmental non-operating 9,541 11,763 21,304 10,798
Administered expensesOutcome 2 - Additional First Home
Owners Scheme 2,413 - 2,413 - Outcome 2 - Crude oil excise -
condensate 72,300 - 72,300 80,000 Outcome 4 - Standard Business
Reporting - payments to StateRevenue Offices 7,120 3,150 3 10,270 3,240
Outcome 4 - Compensation - companies regulation - - - 173,868
Total administered expenses 81,833 3,150 84,983 257,108 Administered non-operating
Administered assets and liabilitiesSubscriptions to international
financial institutions 3,053 45 3 3,098 3,654 Payments in relation to the HIH
Assistance Scheme 76,791 3,951 3 80,742 50,119 Total administered non-operating 79,844 3,996 83,840 53,773
Total other services B 171,218 18,909 190,127 321,679 Total available annual
appropriations (A + B) 402,629 19,637 422,266 488,667

Agency Additional Estimates Statements — Treasury
11
Table 1.1: Department of the Treasury resource statement — additional estimates for 2008-09 as at Additional Estimates December 2008 (continued)
Estimate Proposed Total Totalas at + additional = estimate available
Budget estimates at Additional appropriationEstimates
2008-09 2008-09 2008-09 2007-08$'000 $'000 $'000 $'000
Special appropriationsInternational Monetary Agreements
Act 1947 21,816 1,434 23,250 31,050 A New Tax System (Commonwealth-
State Financial Arrangements)Act 1999 45,280,000 (1,670,002) 43,609,998 42,673,196
Appropriation (HIH Assistance)Act 2001 - - - 11,017
Appropriation (Economic SecurityStrategy) Act (No. 2) 2008 - 1,184,883 - 1,184,883
Total special appropriations C 45,301,816 (483,685) 43,633,248 43,900,146 Total appropriations (A + B + C) 45,704,445 (464,048) 44,055,514 44,388,813 Special Accounts
Opening balance 3,580 (2,000) 1,580 3,580 Non-appropriation receipts to
special accounts 1,809 (180) 1,629 1,809 Total special accounts D 5,389 (2,180) 3,209 5,389
Total resourcing (A + B + C + D) 45,709,834 (466,228) 44,058,723 44,394,202 Less receipts from other sources
creditied to special accounts 1,809 - - 1,809 Total net resourcing for the Treasury 45,708,025 (466,228) 44,058,723 44,392,393 1. Includes transfer of $2.303 million under section 32 of the Financial Management and Accountability
Act 1997 to the Office of the Auditing and Assurance Standards Board and the Office of the Australian Accounting Standards Board.
2. Appropriation Bill (No. 3) 2008-09. 3. Appropriation Bill (No. 4) 2008-09.

Agency Additional Estimates Statements — Treasury
12
1.3 AGENCY MEASURES TABLE
Table 1.2 summarises new Government measures taken since the 2008-09 Budget.
Table 1.2: Agency measures since Budget Output Group 2008-09 2009-10 2010-11 2011-12
$'000 $'000 $'000 $'000
Expense measures Global financial crisis - additional
funding for regulators andthe Treasury
Departmental outputs1 1.1 2,500 5,000 - -
Council of Australian Governments -implementing a nationalapproach to the regulation of consumer credit
Departmental outputs1 4.1 1,022 1,033 802 673
Implementation of operation sunlightDepartmental outputs 4.1 306 - - -
Total expense measures 3,828 6,033 802 673 1. Details of these measures appear in the Mid-Year Economic and Fiscal Outlook 2008-09 on
pages 184 and 185.
1.4 ADDITIONAL ESTIMATES AND VARIATIONS
Table 1.3 details the additional estimates and variations resulting from new measures since the 2008-09 Budget in Appropriation Bills No. 3 and No. 4. Table 1.4 details additional estimates or variations from other variations.
Table 1.3: Additional estimates and variations to outcomes from measures since 2008-09 Budget
Output Group 2008-09 2009-10 2010-11 2011-12impacted $'000 $'000 $'000 $'000
Outcome 1Increase in estimates (departmental)Global financial crisis - additional
funding for regulators andthe Treasury 1.1 2,500 5,000 - -
Outcome 4Increase in estimates (departmental)Council of Australian Governments -
implementing a nationalapproach to the regulation of consumer credit 4.1 1,022 1,033 802 673
Implementation of operation sunlight 4.1 306 - - - Net impact on estimates
for measures (departmental) 3,828 6,033 802 673

Agency Additional Estimates Statements — Treasury
13
Table 1.4: Additional estimates and variations to outcomes from other variations Output Group 2008-09 2009-10 2010-11 2011-12
impacted $'000 $'000 $'000 $'000Outcome 1Increase in estimates (administered)
Subscriptions to international financialinstitutions (capital) 1.1 45 - - -
Net impact on estimates for outcome 1 (administered) 45 - - -
Outcome 4Increase in estimates (departmental)
Standard Business Reporting (capital) 4.1 11,763 - - - Decrease in estimates (departmental)
Standard Business Reporting (expense) 4.1 (3,100) - - - Net impact on estimates
for outcome 4 (departmental) 8,663 - - - Increase in estimates (administered)
Standard Business Reporting (expense) 4.1 3,150 - - - Payments in relation to the HIH
Assistance Scheme (capital) 4.1 3,951 (21,570) (16,765) (14,765) Net impact on estimates
for outcome 4 (administered) 7,101 (21,570) (16,765) (14,765)

Agency Additional Estimates Statements — Treasury
14
1.5 BREAKDOWN OF ADDITIONAL ESTIMATES BY APPROPRIATION BILL
The following tables detail the additional estimates sought for the Department of the Treasury through Appropriation Bills No. 3 and No. 4.
Table 1.5: Appropriation Bill (No. 3) 2008-09 2007-08 2008-09 2008-09 2008-09 Additional Reduced
available Budget1 Budget2 revised estimates estimates$'000 $'000 $'000 $'000 $'000 $'000
ADMINISTERED ITEMSOutcome 4Well functioning markets 5,000 5,000 5,000 5,000 - - Total 5,000 5,000 5,000 5,000 - - DEPARTMENTAL OUTPUTSOutcome 1Sound macroeconomic environment 28,515 27,320 27,320 29,820 2,500 - Outcome 2Effective government spending
arrangements 20,082 21,356 21,356 21,356 - - Outcome 3Effective taxation and retirement
income arrangements 42,208 46,980 46,980 46,980 - - Outcome 4Well functioning markets 60,039 50,790 48,487 46,715 (1,772) - Total 150,844 146,446 144,143 144,871 728 - Total administered and
departmental 155,844 151,446 149,143 149,871 728 - 1. Estimate as shown in the Portfolio Budget Statements 2008-09. 2. Includes transfer of $2.303 million under section 32 of the Financial Management and Accountability
Act 1997 to the Office of the Auditing and Assurance Standards Board and the Office of the Australian Accounting Standards Board.
Table 1.6: Appropriation Bill (No. 4) 2008-09 2007-08 2008-09 2008-09 Additional Reduced
available Budget revised estimates estimates$'000 $'000 $'000 $'000 $'000
PAYMENTS TO STATES, ACT, NTAND LOCAL GOVERNMENT
Outcome 4Well functioning markets 3,240 7,120 10,270 3,150 - OTHER ADMINISTERED ITEMSNon-operating
Equity injections 8,978 9,541 21,304 11,763 - Previous years' outputs 1,820 - - - - Administered assets and liabilities 53,773 79,844 83,840 3,996 -
Total non-operating 64,571 89,385 105,144 15,759 - Total 67,811 96,505 115,414 18,909 -

15
Section 2: Revisions to agency outcomes and planned performance
2.1 OUTCOMES AND PERFORMANCE INFORMATION
There has been no change to outcomes and performance information for the Department of the Treasury from that included in the Portfolio Budget Statements 2008-09 (pages 20-34).

Agency Additional Estimates Statements — Treasury
16
Section 3: Explanatory tables and budgeted financial statements
3.1 EXPLANATORY TABLES
3.1.1 Estimates of special account flows
Special accounts provide a means to set aside and record amounts used for specified purposes. Table 3.1.1 shows the expected additions (receipts) and reductions (payments) for each account used by the Department of the Treasury. The corresponding table in the Portfolio Budget Statements 2008-09 is Table 3.1.3.
Table 3.1.1: Estimates of special account flows Opening Closingbalance Receipts Payments Adjustments balance2008-09 2008-09 2008-09 2008-09 2008-092007-08 2007-08 2007-08 2007-08 2007-08
Outcome $'000 $'000 $'000 $'000 $'000Actuarial Services Special 4 1,580 1,629 1,629 - 1,580
Account 1,580 1,629 1,629 - 1,580
Other Trust Moneys All - - - - - Account - - - - -
Services for otherGovernments and All - - - - - Non-Agency Bodies Account - - - - -
Total special accounts 2008-09 Budget estimate 1,580 1,629 1,629 - 1,580
Total special accounts2007-08 estimate actual 1,580 1,629 1,629 - 1,580
Note: Lloyd’s Deposit Trust Special Account was transferred to Australian Prudential Regulation Authority from 23 May 2008. This was previously reported by the Department of the Treasury.
3.1.2 Estimates of variations to Average Staffing Level
Changes in Average Staffing Level (ASL) are presented in the Portfolio Additional Estimates Statements at the whole of agency level to demonstrate any movements since Budget. The ASL figures for Budget were reported in agency Portfolio Budget Statements 2008-09 in each outcome resourcing table.
Table 3.1.2: Average Staffing Level 2008-09 2008-09Budget Revised Variation
Department of the Treasury 920 928 8Total 920 928 8

Agency Additional Estimates Statements — Treasury
17
3.2 BUDGETED FINANCIAL STATEMENTS
3.2.1 Analysis of budgeted financial statements
The Department of the Treasury is budgeting towards a departmental breakeven operating result for 2008-09.
The Department of the Treasury has a sound financial position and currently has sufficient cash reserves to fund provisions and payables, and asset replacement, as they fall due.
3.2.2 Budgeted financial statements
Table 3.2.1: Budgeted departmental income statement (for the period ended 30 June)
Actual Revised Forward Forward Forwardbudget estimate estimate estimate
2007-08 2008-09 2009-10 2010-11 2011-12$'000 $'000 $'000 $'000 $'000
INCOMERevenue
Revenues from Government 149,315 144,871 154,977 137,012 135,092 Goods and services 7,666 9,644 9,547 9,204 9,369 Other 824 824 823 824 824
Total revenue 157,805 155,339 165,347 147,040 145,285
GainsOther 360 350 351 351 351
Total gains 360 350 351 351 351 Total income 158,165 155,689 165,698 147,391 145,636
EXPENSEEmployees 101,143 107,240 111,786 104,212 104,332 Suppliers 40,403 42,154 43,804 31,766 29,928 Depreciation and amortisation 3,344 4,355 8,168 9,473 9,436 Grants 4,625 1,805 1,805 1,805 1,805 Finance costs 160 135 135 135 135
Total expenses 149,675 155,689 165,698 147,391 145,636
Net surplus or (deficit) attributable to the Australian Government 8,490 - - - -
Prepared on an Australian Accounting Standards basis.

Agency Additional Estimates Statements — Treasury
18
Table 3.2.2: Budgeted departmental balance sheet (as at 30 June)
Actual Revised Forward Forward Forwardbudget estimate estimate estimate
2007-08 2008-09 2009-10 2010-11 2011-12$'000 $'000 $'000 $'000 $'000
ASSETSFinancial assets
Cash and cash equivalents 2,270 2,270 2,270 2,270 2,270 Receivables 73,469 63,898 65,423 69,332 72,268
Total financial assets 75,739 66,168 67,693 71,602 74,538
Non-financial assetsLand and buildings 10,442 11,366 10,816 10,266 9,716 Infrastructure, plant and equipment 7,067 8,120 9,290 10,486 9,719 Intangibles 788 32,107 41,461 37,842 36,223 Other 1,443 1,490 1,539 1,589 1,589
Total non-financial assets 19,740 53,083 63,106 60,183 57,247 Total assets 95,479 119,251 130,799 131,785 131,785
LIABILITIESPayables
Suppliers 2,789 2,832 2,876 2,921 2,921 Other payables 4,098 4,169 4,243 4,319 4,319
Total payables 6,887 7,001 7,119 7,240 7,240
Interest bearing liabilitiesLeases 890 890 890 890 890
Total interest bearing liabilities 890 890 890 890 890
ProvisionsEmployees 34,696 37,050 37,863 38,728 38,728
Total provisions 34,696 37,050 37,863 38,728 38,728 Total liabilities 42,473 44,941 45,872 46,858 46,858
EQUITYParent entity interest
Contributed equity 12,939 34,243 44,860 44,860 44,860 Reserves 5,276 5,276 5,276 5,276 5,276 Retained surpluses or
accumulated deficits 34,791 34,791 34,791 34,791 34,791 Total equity 53,006 74,310 84,927 84,927 84,927
Current assets 77,182 67,658 69,232 73,191 76,127 Non-current assets 18,297 51,593 61,567 58,594 55,658 Current liabilities 33,030 35,952 36,697 37,486 37,486 Non-current liabilities 9,443 8,989 9,175 9,372 9,372 Prepared on an Australian Accounting Standards basis.

Agency Additional Estimates Statements — Treasury
19
Table 3.2.3: Budgeted departmental statement of cash flows (for the period ended 30 June)
Actual Revised Forward Forward Forwardbudget estimate estimate estimate
2007-08 2008-09 2009-10 2010-11 2011-12$'000 $'000 $'000 $'000 $'000
OPERATING ACTIVITIESCash received
Goods and services 11,966 9,584 9,485 9,141 9,369 Appropriations 132,002 154,609 157,091 138,075 132,156 Other 1,653 792 790 790 824
Total cash received 145,621 164,985 167,366 148,006 142,349
Cash usedEmployees 100,278 105,578 111,664 104,058 105,038 Suppliers 43,267 41,120 46,237 35,508 28,871 Grants 4,625 1,805 1,805 1,805 1,805 Other 1,625 135 135 135 135
Total cash used 149,795 148,638 159,841 141,506 135,849 Net cash from or (used by)
operating activities (4,174) 16,347 7,525 6,500 6,500
INVESTING ACTIVITIESCash received
Proceeds from sales of property,plant and equipment 35 - - - -
Total cash received 35 - - - -
Cash usedPurchase of property, plant
and equipment 4,037 37,651 18,142 6,500 6,500 Total cash used 4,037 37,651 18,142 6,500 6,500 Net cash from or (used by)
investing activities (4,002) (37,651) (18,142) (6,500) (6,500)
FINANCING ACTIVITIESCash received
Appropriations - contributed equity 8,978 21,304 10,617 - - Total cash received 8,978 21,304 10,617 - -
Cash usedOther 788 - - - -
Total cash used 788 - - - - Net cash from or (used by)
financing activities 8,190 21,304 10,617 - - Net increase or (decrease)
in cash held 14 - - - - Cash at the beginning of
the reporting period 2,256 2,270 2,270 2,270 2,270 Cash at the end of the
reporting period 2,270 2,270 2,270 2,270 2,270 Prepared on an Australian Accounting Standards basis.

Agency Additional Estimates Statements — Treasury
20
Table 3.2.4: Departmental statement of changes in equity — summary of movement (Budget 2008-09)
Accumulated Asset Other Contributed Totalresults revaluation reserves equity/ equity
reserve capital$'000 $'000 $'000 $'000 $'000
Opening balance as at 1 July 2008Balance carried forward from
previous period 34,791 5,276 - 12,939 53,006 Adjusted opening balance 34,791 5,276 - 12,939 53,006
Transactions with ownersContribution by owners
Appropriation (equity injection) - - - 21,304 21,304 Sub-total transactions with owners - - - 21,304 21,304
Estimated closing balanceas at 30 June 2009 34,791 5,276 - 34,243 74,310
Prepared on an Australian Accounting Standards basis.

Agency Additional Estimates Statements — Treasury
21
Table 3.2.5: Schedule of budgeted income and expenses administered on behalf of government (for the period ended 30 June)
Actual Revised Forward Forward Forwardbudget estimate estimate estimate
2007-08 2008-09 2009-10 2010-11 2011-12$'000 $'000 $'000 $'000 $'000
INCOME ADMINISTERED ONBEHALF OF GOVERNMENT
RevenueNon-taxation
Revenue from Government 42,652,315 44,884,401 46,711,498 48,831,616 51,251,616 Goods and services 600,200 631,200 620,600 626,800 631,700 Interest 3,652 3,118 2,988 2,988 2,988 Dividends 1,084,822 1,403,000 2,402,000 1,994,000 2,097,000 Other sources of non-taxation
revenues 68,980 60,536 1,950 1,950 1,950 Total non-taxation 44,409,969 46,982,255 49,739,036 51,457,354 53,985,254 Total revenues administered
on behalf of Government 44,409,969 46,982,255 49,739,036 51,457,354 53,985,254
GainsNet foreign exchange gains 67,519 63,447 - - -
Total gains administeredon behalf of Government 67,519 63,447 - - -
Total income administeredon behalf of Government 67,519 63,447 - - -
EXPENSES ADMINISTERED ONBEHALF OF GOVERNMENTGrants 42,627,153 44,860,151 46,687,982 48,808,100 51,228,100 Interest 28,738 23,250 22,516 22,516 22,516 Other (203) 1,000 1,000 1,000 1,000
Total expenses administeredon behalf of Government 42,655,688 44,884,401 46,711,498 48,831,616 51,251,616
Prepared on an Australian Accounting Standards basis.

Agency Additional Estimates Statements — Treasury
22
Table 3.2.6: Schedule of budgeted assets and liabilities administered on behalf of government (as at 30 June)
Actual Revised Forward Forward Forwardbudget estimate estimate estimate
2007-08 2008-09 2009-10 2010-11 2011-12$'000 $'000 $'000 $'000 $'000
ASSETS ADMINISTERED ON BEHALF OF GOVERNMENT
Financial assetsCash and cash equivalents 10,213 10,213 10,213 10,213 10,213 Receivables 1,418 574 500,574 574 574 Investments 17,273,877 17,846,264 17,846,264 17,846,264 17,846,264
Total financial assets 17,285,508 17,857,051 18,357,051 17,857,051 17,857,051
Non-financial assetsOther 1,833 1,833 1,833 1,833 1,833
Total non-financial assets 1,833 1,833 1,833 1,833 1,833 Total assets administered
on behalf of Government 17,287,341 17,858,884 18,358,884 17,858,884 17,858,884
LIABILITIES ADMINISTERED ON BEHALF OF GOVERNMENT
Interest bearing liabilitiesLoans 3,881,382 4,309,837 4,309,837 4,309,837 4,309,837 Other 796,724 880,511 880,511 880,511 880,511
Total interest bearing liabilities 4,678,106 5,190,348 5,190,348 5,190,348 5,190,348
ProvisionsSuppliers 241 241 241 241 241 Other provisions 385 - - - -
Total provisions 626 241 241 241 241
PayablesGrants and subsidies 146,908 63,666 60,250 60,250 59,250 Other payables 3,929 3,752 3,752 3,752 3,752
Total payables 150,837 67,418 64,002 64,002 63,002 Total liabilities administered
on behalf of Government 4,829,569 5,258,007 5,254,591 5,254,591 5,253,591 Prepared on an Australian Accounting Standards basis.

Agency Additional Estimates Statements — Treasury
23
Table 3.2.7: Schedule of budgeted administered cash flows (for the period ended 30 June)
Actual Revised Forward Forward Forwardbudget estimate estimate estimate
2007-08 2008-09 2009-10 2010-11 2011-12$'000 $'000 $'000 $'000 $'000
OPERATING ACTIVITIESCash received
Rendering of services 600,200 631,200 620,600 626,800 631,700 Interest 3,961 3,215 2,988 2,988 2,988 Dividends 1,084,822 1,403,000 1,902,000 2,494,000 2,097,000 Other 61,848 60,898 1,950 1,950 1,950
Total cash received 1,750,831 2,098,313 2,527,538 3,125,738 2,733,638
Cash usedGrant payments 42,627,153 44,860,151 46,687,982 48,808,100 51,228,100 Interest paid 30,729 23,427 22,516 22,516 22,516 Other 39,621 81,742 4,416 1,000 2,000
Total cash used 42,697,503 44,965,320 46,714,914 48,831,616 51,252,616 Net cash from
operating activities (40,946,672) (42,867,007) (44,187,376) (45,705,878) (48,518,978)
INVESTING ACTIVITIESCash used
Purchase of equity instruments 1,105 3,098 - - - Total cash used 1,105 3,098 - - - Net cash from
investing activities (1,105) (3,098) - - -
FINANCING ACTIVITIESCash received
Other 312,875 - - - - Total cash received 312,875 - - - - Net cash from
financing activities 312,875 - - - -
Net increase or (decrease) in cash heldCash at beginning of reporting period 13,168 10,213 10,213 10,213 10,213 Cash from Official Public Account
for appropriations 42,695,095 44,968,418 46,714,914 48,831,616 51,252,616 Cash to Official Public Account 2,063,148 2,098,313 2,527,538 3,125,738 2,733,638
Cash at end of reporting period 10,213 10,213 10,213 10,213 10,213 Prepared on an Australian Accounting Standards basis.


25
AUSTRALIAN BUREAU OF STATISTICS
Section 1: Agency overview and resources.............................................................27 1.1 Strategic direction ...............................................................................................27 1.2 Agency resource statement ................................................................................28 1.3 Agency measures table ......................................................................................29 1.4 Additional Estimates and Variations ...................................................................29 1.5 Breakdown of additional estimates by Appropriation Bill ....................................30
Section 2: Revisions to agency outcomes and planned performance..................31 2.1 Outcomes and performance information ............................................................31
Section 3: Explanatory tables and budgeted financial statements .......................32 3.1 Explanatory tables ..............................................................................................32 3.2 Budgeted financial statements............................................................................32


27
AUSTRALIAN BUREAU OF STATISTICS
Section 1: Agency overview and resources
1.1 STRATEGIC DIRECTION
There has been no significant change to the strategic direction of the Australian Bureau of Statistics (ABS) from that outlined in the Portfolio Budget Statements 2008-09 (pages 47-48).
The ABS is seeking an additional $1.0 million in departmental outputs through Appropriation Bill (No. 3) 2008-09. This relates to $0.1 million for the Commonwealth Spatial Data Integration program measure and $0.8 million as part of a reallocation of funds for Standard Business Reporting. The reallocation will have no net impact on the Budget.
There is also a reduction of $2.7 million in 2008-09 for equity injections as part of a reallocation of funds for Standard Business Reporting. The reallocation will have no net impact on the Budget.

Agency Additional Estimates Statements — ABS
28
1.2 AGENCY RESOURCE STATEMENT
Table 1.1 outlines the total resourcing available from all sources for the 2008-09 Budget year, including variations through Appropriation Bills No. 3 and No. 4 and special accounts.
Table 1.1: Australian Bureau of Statistics resource statement — additional estimates for 2008-09 as at Additional Estimates December 2008
Estimate Proposed Total Totalas at + additional = estimate available
Budget estimates at Additional appropriationEstimates
2008-09 2008-09 2008-09 2007-08$'000 $'000 $'000 $'000
Ordinary annual servicesDepartmental outputs
Prior year amounts available 7,734 - 7,734 - Departmental outputs 282,775 982 1 283,757 302,260 Receipts from other sources (s31) 17,960 5,260 23,220 23,872
Total ordinary annual services A 308,469 6,242 314,711 326,132 Other servicesDepartmental non-operating
Equity injections 5,365 (2,692) 2,673 7,377 Previous years' outputs - - - 608
Total other services B 5,365 (2,692) 2,673 7,985 Total available annual
appropriations (A + B) 313,834 3,550 317,384 334,117 Special accounts
Opening balance 112 - 112 110 Non-appropriation receipts to
special accounts 6 - 6 4 Total special accounts C 118 - 118 114 Total resourcing (A + B + C) 313,952 3,550 317,502 334,231
Less receipts from other sourcescredited to special accounts 6 - 6 4
Total net resourcing for the ABS 313,946 3,550 317,496 334,227 1. Appropriation Bill (No. 3) 2008-09.

Agency Additional Estimates Statements — ABS
29
1.3 AGENCY MEASURES TABLE
Table 1.2 summarises new Government measures taken since the 2008-09 Budget.
Table 1.2: Agency measures since Budget Output Group 2008-09 2009-10 2010-11 2011-12
$'000 $'000 $'000 $'000
Expense measures Commonwealth Spatial Data
Integration programDepartmental outputs 1.1 144 265 - -
Total expense measures 144 265 - -
1.4 ADDITIONAL ESTIMATES AND VARIATIONS
The following tables detail the changes to the resourcing for the ABS at Additional Estimates, by outcome. Table 1.3 details the additional estimates resulting from new measures since the 2008-09 Budget. Table 1.4 details additional estimates or variations from other variations.
Table 1.3: Additional estimates and variations to outcomes from measures since 2008-09 Budget
Output Group 2008-09 2009-10 2010-11 2011-12impacted $'000 $'000 $'000 $'000
Outcome 1Increase in estimates (departmental)Commonwealth Spatial Data
Integration program 1.1 144 265 - - Net impact on estimates
for measures (departmental) 144 265 - -
Table 1.4: Additional estimates and variations to outcomes from other variations Output Group 2008-09 2009-10 2010-11 2011-12
impacted $'000 $'000 $'000 $'000Outcome 1Increase in estimates (departmental)
Standard Business Reporting (expense) 1.1 838 - - - Decrease in estimates (departmental)
Standard Business Reporting (capital) 1.1 (2,692) (651) - - Net impact on estimates
for outcome 1 (departmental) (1,854) (651) - -

Agency Additional Estimates Statements — ABS
30
1.5 BREAKDOWN OF ADDITIONAL ESTIMATES BY APPROPRIATION BILL
The following tables detail the additional estimates sought for the ABS through Appropriation Bills No. 3 and No. 4.
Table 1.5: Appropriation Bill (No. 3) 2008-09 2007-08 2008-09 2008-09 Additional Reduced
available Budget revised estimates estimates$'000 $'000 $'000 $'000 $'000
DEPARTMENTAL OUTPUTSOutcome 1Informed decision making, research anddiscussion within governments andthe community based on the provisionof a high quality, objective andresponsive national statistical service 302,260 282,775 283,757 982 - Total 302,260 282,775 283,757 982 -
Table 1.6: Appropriation Bill (No. 4) 2008-09 2007-08 2008-09 2008-09 Additional Reduced
available Budget revised estimates estimates$'000 $'000 $'000 $'000 $'000
Non-operatingEquity injections 6,501 5,365 2,673 - (2,692)
Total 6,501 5,365 2,673 - (2,692)

Agency Additional Estimates Statements — ABS
31
Section 2: Revisions to agency outcomes and planned performance
2.1 OUTCOMES AND PERFORMANCE INFORMATION
There has been no change to outcomes and performance information for the ABS from that included in the Portfolio Budget Statements 2008-09 (pages 50-53).

Agency Additional Estimates Statements — ABS
32
Section 3: Explanatory tables and budgeted financial statements
3.1 EXPLANATORY TABLES
3.1.1 Estimates of special account flows
There has been no change to special account flows from that included in the Portfolio Budget Statements 2008-09 (page 55).
3.1.2 Estimates of variations to Average Staffing Level
There has been no change to the Average Staffing Level from that included in the Portfolio Budget Statements 2008-09 (page 51).
3.2 BUDGETED FINANCIAL STATEMENTS
3.2.1 Analysis of budgeted financial statements
An analysis of the ABS’s budgeted financial statements, as reflected in the budgeted departmental financial statements for 2008-09, is provided below.
The ABS is budgeting for a break even result for 2008-09. The actual operating result for 2007-08 was a $1.5 million deficit.
Total income is estimated to be $307.0 million, an increase of $6.1 million from the Portfolio Budget Statements 2008-09 due to an increase in appropriation revenue of $1.0 million and an increase in other income of $5.3 million.
The ABS’s non financial assets and equity injections have decreased for the reallocation of Standard Business Reporting capital funding to the Department of the Treasury.

Agency Additional Estimates Statements — ABS
33
3.2.2 Budgeted financial statements
Table 3.2.1: Budgeted departmental income statement (for the period ended 30 June)
Actual Revised Forward Forward Forwardbudget estimate estimate estimate
2007-08 2008-09 2009-10 2010-11 2011-12$'000 $'000 $'000 $'000 $'000
INCOMERevenue
Revenues from Government 302,260 283,757 300,148 353,845 468,669 Goods and services 25,599 23,000 19,000 18,500 18,500 Other 461 - - - -
Total revenue 328,320 306,757 319,148 372,345 487,169
GainsNet gains from sale of assets 43 100 100 100 100 Other 169 120 120 120 120
Total gains 212 220 220 220 220 Total income 328,532 306,977 319,368 372,565 487,389
EXPENSEEmployees 220,471 206,712 198,255 225,451 324,585 Suppliers 73,081 70,009 89,420 111,485 124,650 Depreciation and amortisation 30,763 29,542 31,263 35,284 37,680 Finance costs 351 261 167 65 - Write-down of assets and
impairment of assets 5,167 - - - - Other 186 453 263 280 474
Total expenses 330,019 306,977 319,368 372,565 487,389
Net surplus or (deficit) attributable to the Australian Government (1,487) - - - -
Prepared on an Australian Accounting Standards basis.

Agency Additional Estimates Statements — ABS
34
Table 3.2.2: Budgeted departmental balance sheet (as at 30 June)
Actual Revised Forward Forward Forwardbudget estimate estimate estimate
2007-08 2008-09 2009-10 2010-11 2011-12$'000 $'000 $'000 $'000 $'000
ASSETSFinancial assets
Cash and cash equivalents 6,806 5,128 5,133 5,138 5,138 Receivables 21,951 18,791 14,907 7,020 13,023 Accrued revenues 368 673 556 541 541
Total financial assets 29,125 24,592 20,596 12,699 18,702
Non-financial assetsInfrastructure, plant and equipment 50,414 49,711 45,528 49,559 48,171 Inventories 38 38 48 73 73 Intangibles 95,577 96,236 106,256 112,612 115,068 Other non-financial assets 6,905 7,169 9,168 9,491 6,511
Total non-financial assets 152,934 153,154 161,000 171,735 169,823 Total assets 182,059 177,746 181,596 184,434 188,525
LIABILITIESPayables
Other payables 8,562 9,082 9,522 10,867 9,013 Total payables 8,562 9,082 9,522 10,867 9,013
Interest bearing liabilitiesLoans 4,821 3,308 1,699 - - Other interest bearing liabilities 26,257 24,967 23,256 20,923 17,932
Total interest bearing liabilities 31,078 28,275 24,955 20,923 17,932
ProvisionsEmployees 72,246 68,395 71,715 76,416 85,306 Other provisions 3,420 2,567 2,595 2,374 2,422
Total provisions 75,666 70,962 74,310 78,790 87,728 Total liabilities 115,306 108,319 108,787 110,580 114,673 EQUITY
Contributed equity 20,534 23,207 26,590 27,635 27,635 Reserves 18,243 18,243 18,243 18,243 18,243 Retained surpluses or
accumulated deficits 27,976 27,977 27,976 27,976 27,974 Total equity 66,753 69,427 72,809 73,854 73,852
Current assets 36,068 31,799 29,812 22,263 25,286 Non-current assets 145,991 145,947 151,784 162,171 163,239 Current liabilities 84,228 80,044 83,832 89,657 96,741 Non-current liabilities 31,078 28,275 24,955 20,923 17,932 Prepared on an Australian Accounting Standards basis.

Agency Additional Estimates Statements — ABS
35
Table 3.2.3: Budgeted departmental statement of cash flows (for the period ended 30 June)
Actual Revised Forward Forward Forwardbudget estimate estimate estimate
2007-08 2008-09 2009-10 2010-11 2011-12$'000 $'000 $'000 $'000 $'000
OPERATING ACTIVITIESCash received
Goods and services 27,964 23,221 18,737 18,472 18,500 Appropriations 289,918 289,102 307,177 361,555 462,687 Net GST received 11,381 7,420 8,945 9,951 9,479 Other cash received - - 110 23 -
Total cash received 329,263 319,743 334,969 390,001 490,666
Cash usedEmployees 215,918 215,932 200,645 224,501 321,305 Suppliers 73,108 65,715 89,933 108,439 120,737 Financing costs 351 261 167 65 - Net GST paid 11,308 7,603 9,251 9,780 9,500 Other cash used - 881 263 280 476
Total cash used 300,685 290,392 300,259 343,065 452,018 Net cash from or (used by)
operating activities 28,578 29,351 34,710 46,936 38,648
INVESTING ACTIVITIESCash received
Proceeds from sales of property,plant and equipment 239 100 100 100 100
Total cash received 239 100 100 100 100
Cash usedPurchase of property, plant
and equipment 33,523 32,289 36,579 46,377 38,748 Total cash used 33,523 32,289 36,579 46,377 38,748 Net cash from or (used by)
investing activities (33,284) (32,189) (36,479) (46,277) (38,648)
FINANCING ACTIVITIESCash received
Appropriations - contributed equity 6,501 2,673 3,383 1,045 - Total cash received 6,501 2,673 3,383 1,045 -
Cash usedRepayments of debt 1,424 1,513 1,609 1,699 -
Total cash used 1,424 1,513 1,609 1,699 - Net cash from or (used by)
financing activities 5,077 1,160 1,774 (654) - Net increase or (decrease)
in cash held 371 (1,678) 5 5 - Cash at the beginning of
the reporting period 6,435 6,806 5,128 5,133 5,138 Cash at the end of the
reporting period 6,806 5,128 5,133 5,138 5,138 Prepared on an Australian Accounting Standards basis.

Agency Additional Estimates Statements — ABS
36
Table 3.2.4: Departmental statement of changes in equity — summary of movement (Budget 2008-09)
Accumulated Asset Contributed Totalresults revaluation equity/ equity
reserve capital$'000 $'000 $'000 $'000
Opening balance as at 1 July 2008Balance carried forward from
previous period 27,976 18,243 20,534 66,753 Adjusted opening balance 27,976 18,243 20,534 66,753
Transactions with ownersContribution by owners
Appropriation (equity injection) - - 2,673 2,673 Sub-total transactions with owners - - 2,673 2,673
Estimated closing balanceas at 30 June 2009 27,976 18,243 23,207 69,426
Prepared on an Australian Accounting Standards basis.
Table 3.2.5: Schedule of budgeted income and expenses administered on behalf of government (for the period ended 30 June) The ABS does not have any administered funds.
Table 3.2.6: Schedule of budgeted assets and liabilities administered on behalf of government (as at 30 June) The ABS does not have any administered funds.
Table 3.2.7: Schedule of budgeted administered cash flows (for the period ended 30 June) The ABS does not have any administered funds.

37
AUSTRALIAN COMPETITION AND CONSUMER COMMISSION
Section 1: Agency overview and resources.............................................................39 1.1 Strategic direction ...............................................................................................39 1.2 Agency resource statement ................................................................................40 1.3 Agency measures table ......................................................................................41 1.4 Additional estimates and variations ....................................................................41 1.5 Breakdown of additional estimates by appropriation bill.....................................42
Section 2: Revisions to agency outcomes and planned performance..................43 2.1 Outcomes and performance information ............................................................43
Section 3: Explanatory tables and budgeted financial statements .......................44 3.1 Explanatory tables ..............................................................................................44 3.2 Budgeted financial statements............................................................................44


39
AUSTRALIAN COMPETITION AND CONSUMER COMMISSION
Section 1: Agency overview and resources
1.1 STRATEGIC DIRECTION
There has been no significant change to the strategic direction of the Australian Competition and Consumer Commission (ACCC) from that included in the Portfolio Budget Statements 2008-09 (pages 65-66).
The ACCC is seeking an additional $5.0 million in equity injections through Appropriation Bill (No. 4) 2008-09 for the Litigation Contingency Fund.
The ACCC is also reducing appropriations by $4.0 million as legislation to provide for criminal sanctions for price fixing and market sharing (cartel conduct) has not been enacted.

Agency Additional Estimates Statements — ACCC
40
1.2 AGENCY RESOURCE STATEMENT
Table 1.1 outlines the total resourcing available from all sources for the 2008-09 Budget year, including variations through Appropriation Bills No. 3 and No. 4 and special accounts.
Table 1.1: Australian Competition and Consumer Commission resource statement — additional estimates for 2008-09 as at Additional Estimates December 2008
Estimate Proposed Total Total as at + additional = estimate available
Budget estimates at Additional appropriation Estimates
2008-09 2008-09 2008-09 2007-08 $'000 $'000 $'000 $'000
Ordinary annual servicesDepartmental outputs
Prior year amounts available 19,867 - 19,867 - Departmental outputs 139,227 (4,000) 135,227 115,358 Receipts from other sources (s31) 500 - 500 500
Total ordinary annual services A 159,594 (4,000) 155,594 115,858 Other servicesDepartmental non-operating
Prior year amounts available 17,420 - 17,420 - Equity injections 1,299 5,000 1 6,299 1,073 Previous years' outputs 2,948 - 2,948 -
Total other services B 21,667 5,000 26,667 1,073 Total available annual
appropriations (A + B) 181,261 1,000 182,261 116,931 Special accounts
Opening balance 52 - 52 52 Appropriation Receipts 15 - 15 203
Total special accounts C 67 - 67 255 Total resourcing (A + B + C) 181,328 1,000 182,328 117,186
Less receipts from other sourcescredited to special accounts 15 - 15 203
Total net resourcing for the ACCC 181,313 1,000 182,313 116,983 1. Appropriation Bill (No. 4) 2008-09.
Third party drawdowns from and on behalf of other agencies Estimate at Estimate at
Budget AdditionalEstimates
2008-09 2008-09$'000 $'000
Payments made on behalf of the National Competition Council (NCC) 2,781 2,781 Note: The ACCC provides financial services to the NCC and has drawdown access to manage the NCC’s finances.

Agency Additional Estimates Statements — ACCC
41
1.3 AGENCY MEASURES TABLE
Table 1.2: Agency measures since Budget The ACCC does not have any measures since the 2008-09 Budget.
1.4 ADDITIONAL ESTIMATES AND VARIATIONS
Table 1.3 details the additional estimates and variations resulting from new measures since the 2008-09 Budget. Table 1.4 details additional estimates or variations from other variations.
Table 1.3: Additional estimates and variations to outcomes from measures since 2008-09 Budget The ACCC does not have any additional estimates from measures since the 2008-09 Budget.
Table 1.4: Additional estimates and variations to outcomes from other variations Output Group 2008-09 2009-10 2010-11 2011-12
impacted $'000 $'000 $'000 $'000Outcome 1Increase in estimates (departmental)
Litigation Contingency Fund 1.1 5,000 - - - Decrease in estimates (departmental)
Criminal Cartel enforcement 1.1 (4,000) - - - Net impact on estimates
for outcome 1 1,000 - - -

Agency Additional Estimates Statements — ACCC
42
1.5 BREAKDOWN OF ADDITIONAL ESTIMATES BY APPROPRIATION BILL
The following tables detail the additional estimates sought for the ACCC through Appropriation Bills No. 3 and No. 4.
Table 1.5: Appropriation Bill (No. 3) 2008-09 2007-08 2008-09 2008-09 Additional Reduced
available Budget revised estimates estimates$'000 $'000 $'000 $'000 $'000
DEPARTMENTAL OUTPUTSOutcome 1To enhance social and economic welfare of the Australian community by fostering competitive, efficient, fair and informed Australian markets 115,358 139,227 135,227 - (4,000) Total 115,358 139,227 135,227 - (4,000)
Table 1.6: Appropriation Bill (No. 4) 2008-09 2007-08 2008-09 2008-09 Additional Reduced
available Budget revised estimates estimates$'000 $'000 $'000 $'000 $'000
Non-operatingEquity injections 1,073 1,299 6,299 5,000 - Previous years' outputs - 2,948 2,948 - -
Total 1,073 4,247 9,247 5,000 -

Agency Additional Estimates Statements — ACCC
43
Section 2: Revisions to agency outcomes and planned performance
2.1 OUTCOMES AND PERFORMANCE INFORMATION
There has been no change to outcomes and performance information for the ACCC from that included in the Portfolio Budget Statements 2008-09 (pages 69-74).

Agency Additional Estimates Statements — ACCC
44
Section 3: Explanatory tables and budgeted financial statements
Section 3 presents budgeted financial statements which provide a snapshot of the ACCC’s finances for the budget year 2008-09.
3.1 EXPLANATORY TABLES
3.1.1 Estimates of special account flows There has been no change to special account flows from that included in the Portfolio Budget Statements 2008-09 (page 76).
3.1.2 Estimates of variations to Average Staffing Level There has been no change to the Average Staffing Level from that included in the Portfolio Budget Statements 2008-09 (page 71).
3.2 BUDGETED FINANCIAL STATEMENTS
3.2.1 Analysis of budgeted financial statements An analysis of the ACCC’s budgeted financial statements, as reflected in the budgeted departmental financial statements and administered schedules for 2008-09, is provided below.
Departmental
Income statement
The ACCC is budgeting for a break even result for 2008-09. The actual operating result for 2007-08 was a $5.2 million deficit.
Operating revenues
Total revenue in 2008-09 is estimated to be $135.8 million, an increase of $16.9 million from the 2007-08 actual. The increase is primarily as a result of the net increase in funding from measures disclosed in the 2008-09 Budget ($14.1 million) (details are provided in Table 1.2 of the Portfolio Budget Statements 2008-09) and measures disclosed in the 2006-07 Budget for the Australian Energy Regulator (AER) in the 2008-09 forward year.

Agency Additional Estimates Statements — ACCC
45
Operating expenses
Total expenses in 2008-09 are estimated to be $135.8 million. This is an increase of $11.7 million from the 2007-08 actual. The increase is primarily due to the measures disclosed in the 2008-09 Budget ($14.1 million) (details are provided in Table 1.2 of the Portfolio Budget Statements 2008-09), and the full year impact of initiatives funded in 2006-07 for the AER and in 2007-08 for Water Regulatory initiatives.
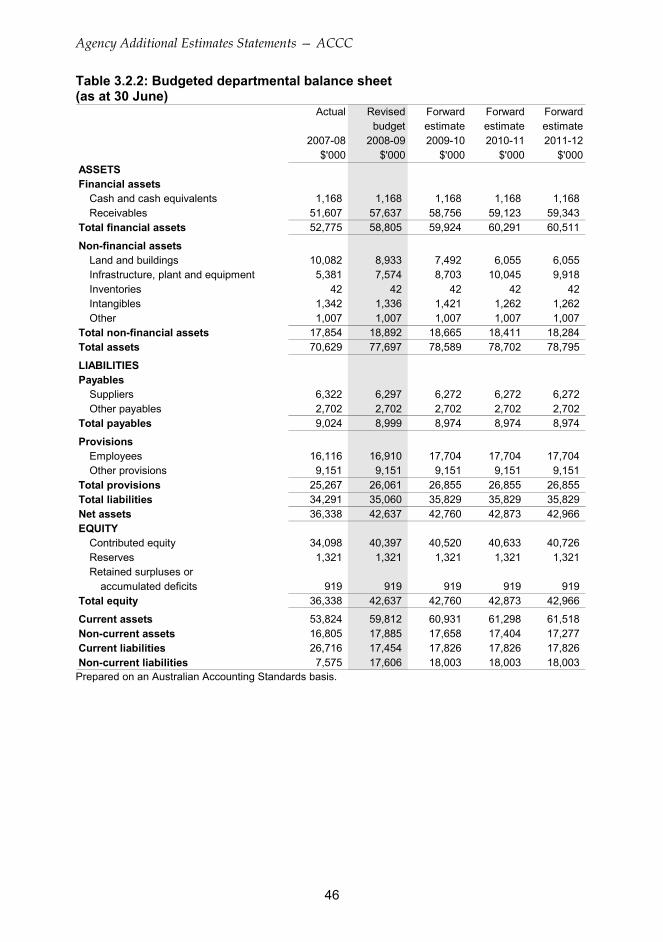
Balance sheet
The ACCC’s budgeted net asset position of $42.6 million represents an increase of $6.3 million from the 2007-08 actual. The increase is attributable to an equity injection associated with the Litigation Contingency Fund.
The total assets are expected to increase by $7.1 million to $77.7 million reflecting a projected increase in receivables and infrastructure, plant and equipment.
The ACCC’s primary liability continues to be accrued employee leave entitlements of $16.9 million. The liability is expected to increase by approximately $0.8 million during 2008-09.
3.2.2 Budgeted financial statements Departmental financial statements Table 3.2.1: Budgeted departmental income statement (for the period ended 30 June)
Actual Revised Forward Forward Forwardbudget estimate estimate estimate
2007-08 2008-09 2009-10 2010-11 2011-12$'000 $'000 $'000 $'000 $'000
INCOMERevenue
Revenues from Government 118,306 135,227 137,818 136,261 132,962 Goods and services 492 500 500 500 500
Total revenue 118,798 135,727 138,318 136,761 133,462
GainsOther 105 75 75 75 75
Total gains 105 75 75 75 75 Total income 118,903 135,802 138,393 136,836 133,537
EXPENSEEmployees 60,642 73,121 73,180 72,290 70,873 Suppliers 52,081 59,151 61,594 60,885 58,990 Depreciation and amortisation 2,120 3,530 3,619 3,661 3,674 Finance costs 111 - - - - Write- down and impairment of asset 47 - - - - Net losses from sale of assets 83 - - - - Other 8,969 - - - -
Total expenses 124,053 135,802 138,393 136,836 133,537
Net surplus or (deficit) attributable to the Australian Government (5,150) - - - -
Prepared on an Australian Accounting Standards basis.
Agency Additional Estimates Statements — ACCC
46
Table 3.2.2: Budgeted departmental balance sheet (as at 30 June)
Actual Revised Forward Forward Forwardbudget estimate estimate estimate
2007-08 2008-09 2009-10 2010-11 2011-12$'000 $'000 $'000 $'000 $'000
ASSETSFinancial assets
Cash and cash equivalents 1,168 1,168 1,168 1,168 1,168 Receivables 51,607 57,637 58,756 59,123 59,343
Total financial assets 52,775 58,805 59,924 60,291 60,511
Non-financial assetsLand and buildings 10,082 8,933 7,492 6,055 6,055 Infrastructure, plant and equipment 5,381 7,574 8,703 10,045 9,918 Inventories 42 42 42 42 42 Intangibles 1,342 1,336 1,421 1,262 1,262 Other 1,007 1,007 1,007 1,007 1,007
Total non-financial assets 17,854 18,892 18,665 18,411 18,284 Total assets 70,629 77,697 78,589 78,702 78,795
LIABILITIESPayables
Suppliers 6,322 6,297 6,272 6,272 6,272 Other payables 2,702 2,702 2,702 2,702 2,702
Total payables 9,024 8,999 8,974 8,974 8,974
ProvisionsEmployees 16,116 16,910 17,704 17,704 17,704 Other provisions 9,151 9,151 9,151 9,151 9,151
Total provisions 25,267 26,061 26,855 26,855 26,855 Total liabilities 34,291 35,060 35,829 35,829 35,829 Net assets 36,338 42,637 42,760 42,873 42,966 EQUITY
Contributed equity 34,098 40,397 40,520 40,633 40,726 Reserves 1,321 1,321 1,321 1,321 1,321 Retained surpluses or
accumulated deficits 919 919 919 919 919 Total equity 36,338 42,637 42,760 42,873 42,966
Current assets 53,824 59,812 60,931 61,298 61,518 Non-current assets 16,805 17,885 17,658 17,404 17,277 Current liabilities 26,716 17,454 17,826 17,826 17,826 Non-current liabilities 7,575 17,606 18,003 18,003 18,003 Prepared on an Australian Accounting Standards basis.

Agency Additional Estimates Statements — ACCC
47
Table 3.2.3: Budgeted departmental statement of cash flows (for the period ended 30 June)
Actual Revised Forward Forward Forwardbudget estimate estimate estimate
2007-08 2008-09 2009-10 2010-11 2011-12$'000 $'000 $'000 $'000 $'000
OPERATING ACTIVITIESCash received
Goods and services 437 500 500 500 500 Appropriations 112,160 134,197 136,699 135,894 132,742 Net GST received 5,688 - - - -
Total cash received 118,285 134,697 137,199 136,394 133,242
Cash usedEmployees 58,305 72,327 72,386 72,290 70,873 Suppliers 55,274 59,101 61,544 60,810 58,915 Other cash used 2,617 - - - -
Total cash used 116,196 131,428 133,930 133,100 129,788 Net cash from or (used by)
operating activities 2,089 3,269 3,269 3,294 3,454
INVESTING ACTIVITIESCash received
Proceeds from sales of property,plant and equipment 33 - - - -
Total cash received 33 - - - -
Cash usedPurchase of property, plant
and equipment 9,555 4,568 3,392 3,407 3,547 Total cash used 9,555 4,568 3,392 3,407 3,547 Net cash from or (used by)
investing activities (9,522) (4,568) (3,392) (3,407) (3,547) FINANCING ACTIVITIESCash received
Appropriations - contributed equity 7,593 1,299 123 113 93 Net cash from or (used by)
financing activities 7,593 1,299 123 113 93 Net increase or (decrease)
in cash held 160 - - - - Cash at the beginning of
the reporting period 1,008 1,168 1,168 1,168 1,168 Cash at the end of the
reporting period 1,168 1,168 1,168 1,168 1,168 Prepared on an Australian Accounting Standards basis.

Agency Additional Estimates Statements — ACCC
48
Table 3.2.4: Departmental statement of changes in equity — summary of movement (Budget 2008-09)
Accumulated Asset Other Contributed Totalresults revaluation reserves equity/ equity
reserve capital$'000 $'000 $'000 $'000 $'000
Opening balance as at 1 July 2008Balance carried forward from
previous period 919 1,321 - 34,098 36,338 Adjusted opening balance 919 1,321 - 34,098 36,338
Transactions with ownersContribution by owners
Appropriation (equity injection) - - - 6,299 6,299 Sub-total transactions with owners - - - 6,299 6,299
Estimated closing balanceas at 30 June 2009 919 1,321 - 40,397 42,637
Prepared on Australian Accounting Standards basis.
Schedule of administered activity
Table 3.2.5: Schedule of budgeted income and expenses administered on behalf of government (for the period ended 30 June)
Actual Revised Forward Forward Forwardbudget estimate estimate estimate
2007-08 2008-09 2009-10 2010-11 2011-12$'000 $'000 $'000 $'000 $'000
INCOME ADMINISTERED ONBEHALF OF GOVERNMENT
RevenueNon-taxation
Other fines 62,198 10,000 10,000 10,000 10,000 Total non-taxation 62,198 10,000 10,000 10,000 10,000 Total revenues administered
on behalf of Government 62,198 10,000 10,000 10,000 10,000
EXPENSES ADMINISTERED ONBEHALF OF GOVERNMENTWrite down and impairment of assets 10,872 - - - -
Total expenses administeredon behalf of Government 10,872 - - - -
Prepared on an Australian Accounting Standards basis.

Agency Additional Estimates Statements — ACCC
49
Table 3.2.6: Schedule of budgeted assets and liabilities administered on behalf of government (as at 30 June)
Actual Revised Forward Forward Forwardbudget estimate estimate estimate
2007-08 2008-09 2009-10 2010-11 2011-12$'000 $'000 $'000 $'000 $'000
ASSETS ADMINISTERED ON BEHALF OF GOVERNMENT
Financial assetsCash and cash equivalents 151 151 151 151 151 Receivables 5,988 5,988 5,988 5,988 5,988
Total assets administered on behalf of Government 6,139 6,139 6,139 6,139 6,139
LIABILITIES ADMINISTERED ON BEHALF OF GOVERNMENT
PayablesSuppliers 2 2 2 2 2
Total liabilities administeredon behalf of Government 2 2 2 2 2
Prepared on an Australian Accounting Standards basis.
Table 3.2.7: Schedule of budgeted administered cash flows (for the period ended 30 June)
Actual Revised Forward Forward Forwardbudget estimate estimate estimate
2007-08 2008-09 2009-10 2010-11 2011-12$'000 $'000 $'000 $'000 $'000
OPERATING ACTIVITIESCash received
Other taxes, fees and fines 47,835 10,000 10,000 10,000 10,000 Total cash received 47,835 10,000 10,000 10,000 10,000
Cash usedTo official public account 47,689 10,000 10,000 10,000 10,000
Total cash used 47,689 10,000 10,000 10,000 10,000 Net cash from
operating activities 146 - - - -
Net increase or (decrease) in cash heldCash at beginning of reporting period 5 151 151 151 151
Cash at end of reporting period 151 151 151 151 151 Prepared on an Australian Accounting Standards basis.

Agency Additional Estimates Statements — ACCC
50
Notes to the financial statements Accounting policy
The budgeted financial statements have been prepared on an accrual accounting basis, having regard to Statements of Accounting Concepts, and in accordance with:
• the Finance Minister’s Orders;
• Australian Accounting Standards Board; and
• International Financial Reporting Standards.
Departmental and administered items
Agency assets, liabilities, revenues and expenses are those items that are controlled by the ACCC that are used by the ACCC in producing its outputs and include:
• computers, plant and equipment, and building fit out used in providing goods and services;
• liabilities for employee entitlements;
• revenue from appropriations or independent sources in payment for outputs; and
• employee, supplier and depreciation expenses incurred in providing agency outputs.
Administered items are those items incurred in providing programs that are controlled by the Government and managed, or oversighted, by the ACCC on behalf of the Government. Administered revenues include fees and fines.
Departmental revenue
Revenue from government represents the purchase of outputs from the ACCC by the government and is recognised to the extent that it has been received into the ACCC’s bank account.
Revenue from other sources, representing sales from goods and services, is recognised at the time that it is imposed on customers.
Departmental expenses — employees
Payments and net increases in entitlements to employees for services rendered in the financial year.

Agency Additional Estimates Statements — ACCC
51
Departmental expenses — suppliers
Payments to suppliers for goods and services used in providing agency outputs.
Departmental expenses — depreciation and amortisation
Depreciable property, plant and equipment, buildings and intangible assets are written-off to their estimated residual values over their estimated useful life, using the straight-line calculation method.
Departmental assets — financial assets
The primary financial asset relates to receivables. Financial assets are used to fund the ACCC’s capital program, employee entitlements, creditors and to provide working capital.
Departmental assets — non-financial assets
These items represent future benefits that the ACCC will consume in producing outputs. The reported value represents the purchase paid less depreciation incurred to date in using the asset.
Departmental liabilities — provisions and payables
Provision has been made for the ACCC’s liability for employee entitlements arising from services rendered by employees. This liability includes unpaid annual leave and long service leave.
Provision has also been made for unpaid expenses as at balance date.


53
AUSTRALIAN PRUDENTIAL REGULATION AUTHORITY
Section 1: Agency overview and resources.............................................................55 1.1 Strategic direction ...............................................................................................55 1.2 Agency resource statement ................................................................................56 1.3 Agency measures table ......................................................................................57 1.4 Additional estimates and variations ....................................................................57 1.5 Breakdown of additional estimates by Appropriation Bill ....................................58
Section 2: Revisions to agency outcomes and planned performance..................59 2.1 Outcomes and performance information ............................................................59
Section 3: Explanatory tables and budgeted financial statements .......................60 3.1 Explanatory tables ..............................................................................................60 3.2 Budgeted financial statements............................................................................61


55
AUSTRALIAN PRUDENTIAL REGULATION AUTHORITY
Section 1: Agency overview and resources
1.1 STRATEGIC DIRECTION
There has been no significant change to the strategic direction of the Australian Prudential Regulation Authority (APRA) from that outlined in the Portfolio Budget Statements 2008-09 (pages 107-108).
APRA is seeking an additional $8.3 million through Appropriation Bill (No. 3) 2008-09. This relates to an additional $9.0 million for the global financial crisis – additional funding for regulators and the Treasury measure; $0.4 million for a reversal of the 2007-08 efficiency dividend; and offset by a reduction of $1.1 million to be transferred to the Department of the Treasury as part of a reallocation of funds for Standard Business Reporting. The reallocation will have no net impact on the Budget.
There is also a reduction of $1.0 million in 2008-09 for equity injections as part of a reallocation of funds for Standard Business Reporting. The reallocation will have no net impact on the Budget.

Agency Additional Estimates Statements — APRA
56
1.2 AGENCY RESOURCE STATEMENT
Table 1.1 outlines the total resourcing available from all sources for the 2008-09 Budget year, including variations through Appropriation Bill No. 3, equity injections and special accounts.
Table 1.1: Australian Prudential Regulation Authority resource statement — additional estimates for 2008-09 as at Additional Estimates December 2008
Estimate Proposed Total Totalas at + additional = estimate available
Budget estimates at Additional appropriationEstimates
2008-09 2008-09 2008-09 2007-08$'000 $'000 $'000 $'000
Ordinary annual servicesDepartmental outputs
Departmental outputs 5,036 8,336 1 13,372 2,840Total ordinary annual services A 5,036 8,336 13,372 2,840Other servicesDepartmental non-operating
Equity injections 1,865 (965) 900 - Total departmental non-operating 1,865 (965) 900 -
Administered non-operatingAdministered assets and liabilities 500 - 500 -
Total administered non-operating 500 - 500 - Total other services B 2,365 (965) 1,400 - Total available annual
appropriations (A + B) 7,401 7,371 14,772 2,840Total appropriations excluding
special accounts 7,401 7,371 14,772 2,840Special accounts
Opening balance 31,350 - 31,350 46,606Non-appropriation receipts to
special accounts 93,185 - 93,185 78,790Total special accounts C 124,535 - 124,535 125,396Total net resourcing for
APRA (A + B + C) 131,936 7,371 139,307 128,236 1. Appropriation Bill (No. 3) 2008-09.

Agency Additional Estimates Statements — APRA
57
1.3 AGENCY MEASURES TABLE
Table 1.2 summarises new Government measures taken since the 2008-09 Budget.
Table 1.2: Australian Prudential Regulation Authority 2008-09 measure since Budget
Output Group 2008-09 2009-10 2010-11 2011-12$'000 $'000 $'000 $'000
Expense measuresGlobal financial crisis - additional
funding for regulators and the Treasury
Departmental outputs 1.1 9,000 18,500 9,000 9,000 Total measures 9,000 18,500 9,000 9,000 Note: Details of this measure appear in the Mid-Year Economic and Fiscal Outlook 2008-09 on page 185.
1.4 ADDITIONAL ESTIMATES AND VARIATIONS
Table 1.3 details the additional estimates and variations resulting from new measures since the 2008-09 Budget in Appropriation Bill No. 3. Table 1.4 details additional estimates or variations from other variations.
Table 1.3: Additional estimates and variations to outcomes from measures since 2008-09 Budget
Output Group 2008-09 2009-10 2010-11 2011-12impacted $'000 $'000 $'000 $'000
Outcome 1Increase in estimates (departmental)
Global financial crisis - additionalfunding for regulators and the Treasury 1.1 9,000 18,500 9,000 9,000
Net impact on estimates for outcome 1 (departmental) 9,000 18,500 9,000 9,000
Table 1.4: Additional estimates and variations to outcomes from other variations Output Group 2008-09 2009-10 2010-11 2011-12
impacted $'000 $'000 $'000 $'000Outcome 1Increase in estimates (departmental)
Reversal of 2007-08 efficiency dividend 1.1 427 - - - Decrease in estimates (departmental)
Standard Business Reporting (expense) 1.1 (1,091) (1,330) - - Standard Business Reporting (capital) 1.1 (965) (222) - -
Net impact on estimates for outcome 1 (departmental) (1,629) (1,552) - -

Agency Additional Estimates Statements — APRA
58
1.5 BREAKDOWN OF ADDITIONAL ESTIMATES BY APPROPRIATION BILL
The following tables detail the additional estimates sought for APRA through Appropriation Bills No. 3 and No. 4.
Table 1.5: Appropriation Bill (No. 3) 2008-09 2007-08 2008-09 2008-09 Additional Reducedavailable Budget revised estimates estimates
$'000 $'000 $'000 $'000 $'000
DEPARTMENTAL OUTPUTSOutcome 1To enhance public confidence in Australia's financial institutions througha framework of prudential regulationwhich balances financial safety andefficiency, competition, contestabilityand competitive neutrality 2,840 5,036 13,372 8,336 - Total 2,840 5,036 13,372 8,336 -
Table 1.6: Appropriation Bill (No. 4) 2008-09 2007-08 2008-09 2008-09 Additional Reducedavailable Budget revised estimates estimates
$'000 $'000 $'000 $'000 $'000Non-operating
Equity injections - 1,865 900 - (965) Total non-operating - 1,865 900 - (965)

Agency Additional Estimates Statements — APRA
59
Section 2: Revisions to agency outcomes and planned performance
2.1 OUTCOMES AND PERFORMANCE INFORMATION
There has been no change to outcomes and performance information for APRA from that included in the Portfolio Budget Statements 2008-09 (pages 111-114).

Agency Additional Estimates Statements — APRA
60
Section 3: Explanatory tables and budgeted financial statements
3.1 EXPLANATORY TABLES
3.1.1 Estimates of special account flows Special accounts provide a means to set aside and record amounts used for specified purposes. Table 3.1.1 shows the expected additions (receipts) and reductions (payments) for each account used by APRA. The corresponding table in the Portfolio Budget Statements 2008-09 is Table 3.1.3.
Table 3.1.1: Estimates of special account flows Opening Closingbalance Receipts Payments Adjustments balance2008-09 2008-09 2008-09 2008-09 2008-092007-08 2007-08 2007-08 2007-08 2007-08
Outcome $'000 $'000 $'000 $'000 $'000Australian Prudential
Regulation Authority 1 31,350 107,957 108,778 - 30,529 Special Account 46,606 81,630 96,886 - 31,350
Services for Other Entities andTrust Moneys - AustralianPrudential Regulation 1 - - - - - Authority Special Account - - - - -
Lloyd's Deposit Trust Special 1 2,000 180 180 - 2,000 Account 2,000 180 180 - 2,000
Superannuation Protection 1 - - - - - Account - - - - -
Total special accounts2008-09 Budget estimate 33,350 108,137 108,958 - 32,529
Total special accounts2007-08 estimate actual 48,606 81,810 97,066 - 33,350
Note: Lloyd’s Deposit Trust Special Account was transferred to APRA from 23 May 2008. This was previously reported by the Department of the Treasury.

Agency Additional Estimates Statements — APRA
61
3.1.2 Estimates of variations to Average Staffing Level Changes in Average Staffing Level (ASL) are presented in the Portfolio Additional Estimates Statements at the whole of agency level to demonstrate any movements since Budget.
Table 3.1.2: Average Staffing Level 2008-09 2008-09Budget Revised Variation
Outcome 1To enhance public confidence in Australia's financial institutions througha framework of prudential regulationwhich balances financial safety andefficiency, competition, contestabilityand competitive neutrality 570 585 15Total 570 585 15
3.2 BUDGETED FINANCIAL STATEMENTS
3.2.1 Analysis of budgeted financial statements Budgeted departmental income statement
The budgeted departmental income statement (refer Table 3.2.1) shows an increase in 2008-09 appropriations from $98.7 million, as disclosed in the Portfolio Budget Statements 2008-09, to $107.1 million; an $8.4 million change. The increase reflects the impacts of additional estimates, as shown in Tables 1.3 and 1.4.
$45.5 million is sought across 2008-09 and the forward estimates to meet the government’s budget measure for the global financial crisis — additional funding for regulators and the Treasury.
APRA’s funding to support its contribution to Standard Business Reporting (SBR) has been reduced by $1.1 million, and is fully offset by a corresponding reduction in 2008-09 related SBR expenditure.
Budgeted departmental balance sheet
The budgeted departmental balance sheet (Table 3.2.2) shows that APRA will maintain sufficient financial assets to meet all employee and supplier commitments as and when they fall due.
Continued investment in core supervisory and corporate infrastructure, coupled with investment in SBR, will see non-financial asset balances increase in 2008-09 and beyond.

Agency Additional Estimates Statements — APRA
62
Contributed equity increases over 2008-09 and 2009-10 reflect government equity injections for SBR.
Retained surpluses are budgeted to maintain general reserves at a level sufficient to accommodate unforeseen business needs which may arise from supervision of at-risk institutions.
Budgeted departmental statement of cash flows
The budget departmental statement of cash flows (Table 3.2.3) reflects the increase in 2008-09 appropriations as detailed in Tables 1.3 and 1.4.
Departmental statement of changes in equity — summary of movement
Table 3.2.4 shows the expected changes in equity between 2007-08 and 2008-09. Note that the opening 2008-09 position is some $3.4 million higher than that reflected in the Portfolio Budget Statements 2008-09 reflecting asset revaluations completed in the last quarter of 2007-08.
The main item of change across 2008-09 will be the reduced equity injection related to SBR.

Agency Additional Estimates Statements — APRA
63
3.2.2 Budgeted financial statements
Departmental financial statements
Table 3.2.1: Budgeted departmental income statement (for the period ended 30 June)
Actual Budget Forward Forward Forwardestimate estimate estimate estimate
2007-08 2008-09 2009-10 2010-11 2011-12$'000 $'000 $'000 $'000 $'000
INCOMERevenue
Revenues from Government 81,497 104,512 115,250 105,394 105,268 Goods and services 6,478 2,495 2,495 2,495 2,495 Other 221 50 50 50 50
Total income 88,196 107,057 117,795 107,939 107,813
EXPENSEEmployees 68,217 73,733 80,722 78,596 78,596 Suppliers 30,043 29,545 33,289 25,583 25,300 Depreciation and amortisation 3,199 3,246 3,684 3,684 3,917
Total expenses 101,459 106,524 117,695 107,863 107,813
Net surplus or (deficit) attributable to the Australian Government (13,263) 533 100 76 -
Prepared on an Australian Accounting Standards basis.

Agency Additional Estimates Statements — APRA
64
Table 3.2.2: Budgeted departmental balance sheet (as at 30 June)
Actual Budget Forward Forward Forwardestimate estimate estimate estimate
2007-08 2008-09 2009-10 2010-11 2011-12$'000 $'000 $'000 $'000 $'000
ASSETSFinancial assets
Cash 31,350 30,529 30,126 29,710 26,319 Receivables 4,163 4,372 4,854 4,401 4,513 Accrued revenues - 500 450 450 450
Total financial assets 35,513 35,402 35,430 34,561 31,283
Non-financial assetsInfrastructure, plant and equipment 7,527 8,923 9,616 9,767 10,121 Intangibles 4,897 5,755 6,364 6,706 9,743 Other 1,571 1,601 1,634 1,667 1,700
Total non-financial assets 13,995 16,279 17,615 18,140 21,564 Total assets 49,508 51,680 53,045 52,701 52,846
LIABILITIESProvisions
Employees 19,677 20,286 20,604 20,042 20,042 Other 1,935 1,972 2,013 2,053 2,095
Total provisions 21,612 22,258 22,618 22,095 22,136
PayablesSuppliers 4,915 5,008 5,114 5,216 5,320
Total payables 4,915 5,008 5,114 5,216 5,320 Total liabilities 26,527 27,266 27,731 27,311 27,457 EQUITYParent entity interest
Contributed equity 3,155 4,055 4,855 4,855 4,855 Reserves 9,809 9,809 9,809 9,809 9,809 Retained surpluses or
accumulated deficits 10,017 10,550 10,650 10,726 10,726 Total equity 22,981 24,414 25,314 25,390 25,390
Current assets 37,084 37,003 37,064 36,228 32,983 Non-current assets 12,424 14,678 15,981 16,473 19,863 Current liabilities 21,305 21,702 22,077 21,787 21,923 Non-current liabilities 5,222 5,564 5,654 5,524 5,534 Prepared on an Australian Accounting Standards basis.

Agency Additional Estimates Statements — APRA
65
Table 3.2.3: Budgeted departmental statement of cash flows (for the period ended 30 June)
Actual Budget Forward Forward Forwardestimate estimate estimate estimate
2007-08 2008-09 2009-10 2010-11 2011-12$'000 $'000 $'000 $'000 $'000
OPERATING ACTIVITIESCash received
Goods and services 5,529 2,495 2,495 2,495 2,495 Appropriations 81,298 104,512 115,250 105,394 105,268 Other 1,242 50 50 50 50
Total cash received 88,069 107,057 117,795 107,939 107,813
Cash usedEmployees 65,638 73,733 80,722 78,596 78,596 Suppliers 32,985 29,545 33,289 25,583 25,300
Total cash used 98,623 103,278 114,011 104,179 103,896 Net cash from or (used by)
operating activities (10,554) 3,779 3,784 3,760 3,917
INVESTING ACTIVITIESCash used
Purchase of property, plant and equipment (4,722) (5,500) (4,987) (4,176) (7,308)
Net cash from or (used by) investing activities (4,722) (5,500) (4,987) (4,176) (7,308)
FINANCING ACTIVITIESCash received
Appropriations - contributed equity - 900 800 - - Total cash received - 900 800 - -
Net increase or (decrease)in cash held (15,276) (821) (404) (416) (3,391) Cash at the beginning of
the reporting period 46,626 31,350 30,529 30,126 29,710 Cash at the end of the
reporting period 31,350 30,529 30,126 29,710 26,319 Prepared on an Australian Accounting Standards basis.

Agency Additional Estimates Statements — APRA
66
Table 3.2.4: Departmental statement of changes in equity — summary of movement (Budget 2008-09)
Retained Asset Other Contributed Totalearnings revaluation reserves equity/ equity
reserve capital$'000 $'000 $'000 $'000 $'000
Opening balance as at 1 July 2008Balance carried forward from
previous period 10,017 3,809 6,000 3,155 22,981 Adjusted opening balance 10,017 3,809 6,000 3,155 22,981
Income and expenseNet operating result 533 - - - 533
Total income and expensesrecognised directly in equity 533 - - - 533
Transactions with ownersContribution by owners
Appropriation (equity injection) - - - 900 900 Sub-total transactions with owners - - - 900 900
Estimated closing balanceas at 30 June 2009 10,550 3,809 6,000 4,055 24,414
Prepared on an Australian Accounting Standards basis.
Schedule of administered activity Schedule of budgeted income and expenses administered on behalf of government
The schedule of budgeted income and expenses administered on behalf of government (Table 3.2.5) shows the amounts APRA collects in supervisory levies from the finance industry on behalf of the government under the Financial Institutions Supervisory Levies Collection Act 1998. In addition to the amount required to fund APRA, the levies also include amounts to fund the activities of the Australian Taxation Office (ATO) for unclaimed moneys and lost member functions and the Australian Securities and Investments Commission (ASIC) for consumer protection and market integrity functions. The expenses shown are an estimate of the amount of levies and penalties that will be waived or written off in the year.
Schedule of budgeted assets and liabilities administered on behalf of government
Table 3.2.6 refers to amounts of administered income that may not have been collected at year end. The balance at 30 June 2008 reflected disputed levies which have subsequently been resolved and collected.
Schedule of budgeted administered cash flows
As indicated in the schedule of budgeted administered cash flows (Table 3.2.7), the cash collected is swept daily from the APRA account to the Official Public Account, from which APRA, in turn, draws down the amounts appropriated to it by the Parliament, and applies these as shown in Table 3.2.3.

Agency Additional Estimates Statements — APRA
67
APRA does not administer any non financial assets on behalf of the government.
Table 3.2.5: Schedule of budgeted income and expenses administered on behalf of government (for the period ended 30 June)
Actual Budget Forward Forward Forwardestimate estimate estimate estimate
2007-08 2008-09 2009-10 2010-11 2011-12$'000 $'000 $'000 $'000 $'000
INCOME ADMINISTERED ONBEHALF OF GOVERNMENT
RevenueNon-taxation
Other sources of non-taxationrevenues 103,760 125,512 135,150 125,294 125,168
Total income administeredon behalf of Government 103,760 125,512 135,150 125,294 125,168
EXPENSES ADMINISTERED ONBEHALF OF GOVERNMENTWaivers and write-offs 195 500 500 500 500
Total expenses administeredon behalf of Government 195 500 500 500 500
Prepared on an Australian Accounting Standards basis.
Table 3.2.6: Schedule of budgeted assets and liabilities administered on behalf of government (as at 30 June)
Actual Budget Forward Forward Forwardestimate estimate estimate estimate
2007-08 2008-09 2009-10 2010-11 2011-12$'000 $'000 $'000 $'000 $'000
ASSETS ADMINISTERED ON BEHALF OF GOVERNMENT
Financial assetsReceivables 838 150 150 150 150
Total financial assets 838 150 150 150 150
Total assets administered on behalf of Government 838 150 150 150 150
Prepared on an Australian Accounting Standards basis.

Agency Additional Estimates Statements — APRA
68
Table 3.2.7: Schedule of budgeted administered cash flows (for the period ended 30 June)
Actual Budget Forward Forward Forwardestimate estimate estimate estimate
2007-08 2008-09 2009-10 2010-11 2011-12$'000 $'000 $'000 $'000 $'000
OPERATING ACTIVITIESCash or equivalents receivedTransfer from Official Public Account 682 500 500 500 500
Administered Revenue 103,760 125,512 135,150 125,294 125,168 Total cash or equivalents received 104,442 126,012 135,650 125,794 125,668
Cash or equivalents usedCash to Official Public Account 104,691 125,512 135,150 125,294 125,168 Administered Expenses 195 500 500 500 500
Total cash or equivalents used 104,886 126,012 135,650 125,794 125,668 Net cash or equivalents from or
(used by) operating activities (444) - - - -
Net increase or (decrease) in cash or equivalents held (444) - - - - Cash or equivalents at
beginning of reporting period 1,281 837 837 837 837 Cash or equivalents at
end of reporting period 837 837 837 837 837 Net cash from or (used by)
investing activities - - - - -
FINANCING ACTIVITIESCash used
Cash to Official Public Account (102,023) (106,190) (106,204) (107,459) (106,117) Net cash from or (used by)
financing activities (102,023) (106,190) (106,204) (107,459) (106,117) Prepared on an Australian Accounting Standards basis.

Agency Additional Estimates Statements — APRA
69
Notes to the financial statements Basis of accounting
The financial statements have been prepared on an accrual basis in accordance with historical cost convention.
Departmental Budgeted departmental statement of financial performance
Revenues from Government
APRA is funded by a special appropriation for levies and late payment penalties collected under the Financial Institutions Supervisory Levies Collection Act 1998. The revenue reported by APRA is net of the levies retained in the Official Public Account to fund ASIC for consumer protection and market integrity functions, and the ATO, for unclaimed moneys and lost member functions.
Other revenue
Revenue from rendering of specific services is recognised by reference to the stage of completion of contracts or other agreements. Revenue from licence fees is recognised on receipt of the application and licence fee.
Note that current period reported revenue may include amounts for past years’ levies and penalties as legislative restrictions require the lodgement of annual returns by institutions to APRA before billing can occur.
Depreciation and amortisation
APRA’s depreciation expense remains in balance with the capital program aimed at maintaining APRA’s processes and infrastructure to an appropriate standard.
Budgeted departmental statement of financial position
Financial assets
Receivables include levies invoiced but still outstanding at the financial year end and accrued revenues, being fees prorated over the periods to which they relate.
All accounts receivable are recorded at their estimated recoverable amount.
Non-financial assets
Non-financial assets include leasehold improvements, furniture and fittings, computer hardware and office equipment. All of the foregoing assets are shown at fair value. Intangible assets comprise capitalised software, including works in progress and are shown at cost. APRA does not own any land or buildings.
Other non-financial assets include prepayments.

Agency Additional Estimates Statements — APRA
70
Provisions and payables
Provisions and payables represent liabilities for miscellaneous accruals and employee benefits, including accrued salary and leave entitlements, provisions for making good leased premises and payments to trade creditors.
Equity
Contributed equity of $3.1 million at 30 June 2008 represented the net value of assets and liabilities transferred from the Reserve Bank of Australia and the Insurance and Superannuation Commission on the formation of APRA on 1 July 1998, less an amount of $2.1 million returned to the Consolidated Revenue Fund as a return of unused appropriation in 2004-05. Contributed equity is planned to increase by $0.9 million in 2008-09 and $0.8 million in 2009-10 reflecting capital injections related to SBR (Table 3.2.4).
Budgeted departmental statement of cash flows
Cash received from operating activities includes the appropriation for levies collected from industry less amounts collected on behalf of the ATO and ASIC, cash from industry fees and charges and government funding of special measures.
Administered Schedule of budgeted revenues and expenses administered on behalf of Government
Revenues
Non-taxation revenues are the levies and late payment penalties collected under the Financial Institutions Supervisory Levies Collection Act 1998. The revenue reported in this statement is higher than that reported by APRA in the budgeted agency statement of financial position reflecting the amount retained in the Official Public Account to fund ASIC and ATO activities described above.
Note that current period reported revenue may include amounts for past years’ levies and penalties as legislative restrictions require the lodgement of annual returns by institutions to APRA before billing can occur.
Expenses
Actual waivers and write-offs are the net position after adjusting for movements in doubtful debt provisions.
Schedule of budgeted assets and liabilities administered on behalf of Government
Financial assets
The financial assets include levy debt invoiced and still outstanding at year end.

Agency Additional Estimates Statements — APRA
71
Schedule of budgeted administered cash flows
All cash collected by APRA for levies, late lodgement and late payment penalties under the Financial Institutions Supervisory Levies Collection Act 1998 is transferred to the Official Public Account at the close of business each day.


73
AUSTRALIAN SECURITIES AND INVESTMENTS COMMISSION
Section 1: Agency overview and resources.............................................................75 1.1 Strategic direction ...............................................................................................75 1.2 Agency resource statement ................................................................................76 1.3 Agency measures table ......................................................................................77 1.4 Additional estimates and variations ....................................................................78 1.5 Breakdown of additional estimates by Appropriation Bill ....................................79
Section 2: Revisions to agency outcomes and planned performance..................80 2.1 Outcomes and performance information ............................................................80
Section 3: Explanatory tables and budgeted financial statements .......................81 3.1 Explanatory tables ..............................................................................................81 3.2 Budgeted financial statements............................................................................82


75
AUSTRALIAN SECURITIES AND INVESTMENTS COMMISSION
Section 1: Agency overview and resources
1.1 STRATEGIC DIRECTION
There has been no significant change to the strategic direction for the Australian Securities and Investments Commission (ASIC) from that included in the Portfolio Budget Statements 2008-09 (pages 127-128).
ASIC is seeking an additional $11.2 million in departmental outputs through Appropriation Bill (No. 3) 2008-09. This relates to: an additional $1.6 million for the Council of Australian Governments – implementing a national approach to the regulation of consumer credit measure; $10.0 million for the global financial crisis – additional funding for regulators and the Treasury measure; $1.0 million for the Australian Business Number and Business Name Registration project; and offset by a reduction of $1.4 million to be transferred to the Department of the Treasury as part of a reallocation of funds for Standard Business Reporting. The reallocation will have no net impact on the Budget.
ASIC is also seeking an additional $3.5 million in equity injections through Appropriation Bill (No. 4) 2008-09. This relates to: an additional $0.8 million for the Council of Australian Governments – implementing a national approach to the regulation of consumer credit measure; $2.9 million for the Australian Business Number and Business Name Registration project; and offset by a reduction of $0.2 million to be transferred to the Department of the Treasury as part of a reallocation of funds for Standard Business Reporting. The reallocation will have no net impact on the Budget.

Agency Additional Estimates Statements — ASIC
76
1.2 AGENCY RESOURCE STATEMENT
Table 1.1 outlines the total resourcing available from all sources for the 2008-09 Budget year, including variations through Appropriation Bills No. 3 and No. 4, special appropriations and special accounts.
Table 1.1: Australian Securities and Investments Commission resource statement — additional estimates for 2008-09 as at Additional Estimates December 2008
Estimate as at Proposed Total TotalBudget + additional = estimate available
estimates at Additional appropriationEstimates
2008-09 2008-09 2008-09 2007-08$'000 $'000 $'000 $'000
Ordinary annual servicesDepartmental outputs
Prior year amounts available 46,741 - 46,741 - Departmental outputs 298,963 11,163 1 310,126 292,173Receipts from other sources (s31) 8,287 - 8,287 9,645Total departmental outputs 353,991 11,163 365,154 301,818
Administered expensesOutcome 1 - Assetless Administration Fund 3,424 - 3,424 5,206Total administered expenses 3,424 - 3,424 5,206
Total ordinary annual services A 357,415 11,163 368,578 307,024Other servicesDepartmental non-operating
Prior year amounts available 19,096 - 19,096 - Equity injections 17,117 3,478 2 20,595 38,758
Total other services B 36,213 3,478 39,691 38,758Total available annual
appropriations (A + B) 393,628 14,641 408,269 345,782Special appropriations
Special appropriations limitedby amount
Banking Act 1959 21,780 - 21,780 24,315Life Insurance Act 1995 2,760 - 2,760 5,105
Total special appropriations C 24,540 - 24,540 29,420Total appropriations excluding
special accounts (A + B + C) 418,168 14,641 432,809 375,202Special accounts
Opening balance 255,458 - 255,458 255,458Appropriation receipts 30,000 - 30,000 30,000Non-appropriation receipts to special accounts 38,000 11,601 49,601 49,601
Total special accounts D 323,458 11,601 335,059 335,059Total resourcing (A + B + C + D) 741,626 26,242 767,868 710,261
Less appropriations drawn fromannual appropriations aboveand credited to special accounts 30,000 - 30,000 30,000
Total net resourcing for ASIC 711,626 26,242 737,868 680,261 1. Appropriation Bill (No. 3) 2008-09. 2. Appropriation Bill (No. 4) 2008-09.

Agency Additional Estimates Statements — ASIC
77
1.3 AGENCY MEASURES TABLE
Table 1.2 summarises new Government measures taken since the 2008-09 Budget.
Table 1.2: Agency measures since Budget Output Group 2008-09 2009-10 2010-11 2011-12
$'000 $'000 $'000 $'000
Expense measures Council of Australian Governments -
implementing a national approach tothe regulation of consumer credit
Departmental outputs 1.1 1,622 12,742 25,555 25,950 Global financial crisis - additional
funding for regulators and theTreasury
Departmental outputs 1.1 10,000 20,000 - - Total expense measures 11,622 32,742 25,555 25,950 Related capital Council of Australian Governments -
implementing a national approach tothe regulation of consumer credit
Departmental capital 1.1 800 - - - Total related capital 800 - - -
Note: Details of these measures appear in the Mid-Year Economic and Fiscal Outlook 2008-09 on pages 184 and 185.

Agency Additional Estimates Statements — ASIC
78
1.4 ADDITIONAL ESTIMATES AND VARIATIONS
Table 1.3 details the additional estimates and variations resulting from new measures since the 2008-09 Budget in Appropriation Bills No. 3 and No. 4. Table 1.4 details additional estimates or variations from other variations.
Table 1.3: Additional estimates and variations to outcomes from measures since the 2008-09 Budget
Output Group 2008-09 2009-10 2010-11 2011-12impacted $'000 $'000 $'000 $'000
Outcome 1Increase in estimates (departmental)Expense measuresCouncil of Australian Governments -
implementing a national approach to theregulation of consumer credit 1.1 1,622 12,742 25,555 25,950
Global financial crisis - additional funding for regulators and the Treasury 1.1 10,000 20,000 - -
Total expense measures 11,622 32,742 25,555 25,950 Related capitalCouncil of Australian Governments -
implementing a national approach to theregulation of consumer credit 1.1 800 - - -
Total related capital 800 - - - Net impact on estimates
for measures (departmental) 12,422 32,742 25,555 25,950
Table 1.4: Additional estimates and variations to outcomes from other variations Output Group 2008-09 2009-10 2010-11 2011-12
impacted $'000 $'000 $'000 $'000Outcome 1Increase in estimates (departmental)
Australian Business Number andBusiness Name Registrationproject (expense) 1.1 951 - - -
Australian Business Number andBusiness Name Registrationproject (capital) 1.1 2,857 - - -
Decrease in estimates (departmental)Standard Business Reporting (expense) 1.1 (1,410) (1,628) - - Standard Business Reporting (capital) 1.1 (179) 472 - -
Net impact on estimates for outcome 1 (departmental) 2,219 (1,156) - -
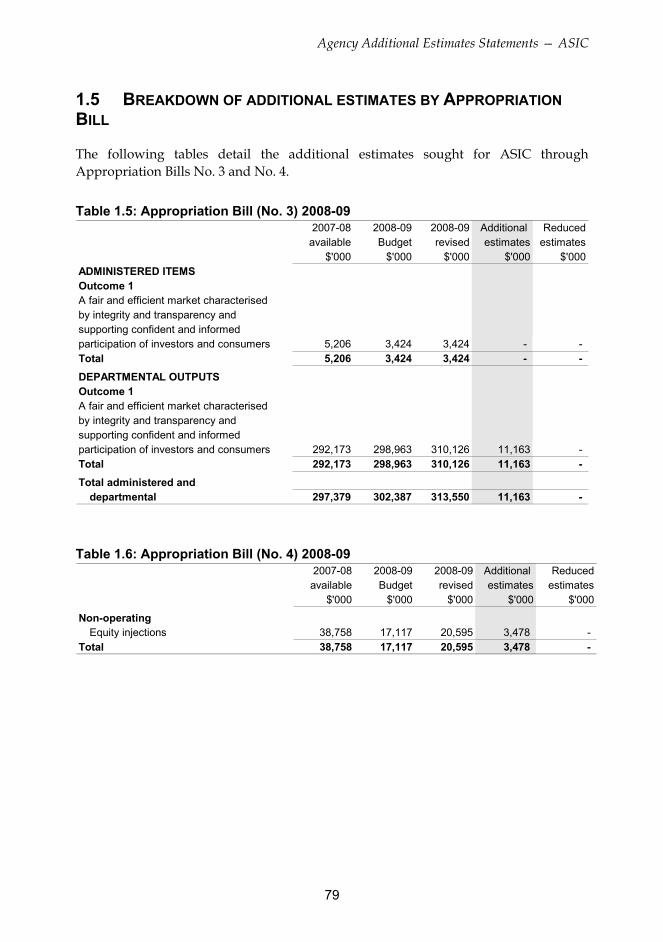
Agency Additional Estimates Statements — ASIC
79
1.5 BREAKDOWN OF ADDITIONAL ESTIMATES BY APPROPRIATION BILL
The following tables detail the additional estimates sought for ASIC through Appropriation Bills No. 3 and No. 4.
Table 1.5: Appropriation Bill (No. 3) 2008-09 2007-08 2008-09 2008-09 Additional Reduced
available Budget revised estimates estimates$'000 $'000 $'000 $'000 $'000
ADMINISTERED ITEMSOutcome 1A fair and efficient market characterised by integrity and transparency andsupporting confident and informed participation of investors and consumers 5,206 3,424 3,424 - - Total 5,206 3,424 3,424 - - DEPARTMENTAL OUTPUTSOutcome 1A fair and efficient market characterised by integrity and transparency andsupporting confident and informed participation of investors and consumers 292,173 298,963 310,126 11,163 - Total 292,173 298,963 310,126 11,163 - Total administered and
departmental 297,379 302,387 313,550 11,163 -
Table 1.6: Appropriation Bill (No. 4) 2008-09 2007-08 2008-09 2008-09 Additional Reducedavailable Budget revised estimates estimates
$'000 $'000 $'000 $'000 $'000
Non-operatingEquity injections 38,758 17,117 20,595 3,478 -
Total 38,758 17,117 20,595 3,478 -

Agency Additional Estimates Statements — ASIC
80
Section 2: Revisions to agency outcomes and planned performance
2.1 OUTCOMES AND PERFORMANCE INFORMATION
There has been no change to outcomes and performance information for ASIC from that included in the Portfolio Budget Statements 2008-09 (pages 132–139).

Agency Additional Estimates Statements — ASIC
81
Section 3: Explanatory tables and budgeted financial statements
3.1 EXPLANATORY TABLES
3.1.1 Estimates of special account flows Special accounts provide a means to set aside and record amounts used for specified purposes. Table 3.1.1 shows the expected additions (receipts) and reductions (payments) for each account used by ASIC. The corresponding table in the Portfolio Budget Statements 2008-09 is Table 3.1.3.
Table 3.1.1: Estimates of special account flows Opening Closingbalance Receipts Payments Adjustments balance2008-09 2008-09 2008-09 2008-09 2008-092007-08 2007-08 2007-08 2007-08 2007-08
Outcome $'000 $'000 $'000 $'000 $'000
Companies and unclaimed 1 223,640 48,500 31,000 - 241,140 Moneys Special Account 206,281 56,585 39,226 - 223,640
Deregistered Companies 1 4,636 966 5,299 - 303 Special Account - 4,649 13 - 4,636
Enforcement Special 1 26,635 30,000 30,000 - 26,635 Account 13,863 30,000 17,399 171 26,635
Investigations, Legal Proceedings, Settlements and Court Orders Special 1 124 3 100 - 27 Account 260 130 266 - 124
Other Trust Moneys 1 - 132 132 - - Account - - - - -
Security Deposits 1 423 - 423 - - Special Account 443 - 20 - 423
Services for otherGovernments and 1 - - - - - Non-Agency Bodies Account - - - - -
Total special accounts 2008-09 Budget estimate 255,458 79,601 66,954 - 268,105
Total special accounts2007-08 actual 220,847 91,364 56,924 171 255,458

Agency Additional Estimates Statements — ASIC
82
3.1.2 Estimates of variations to Average Staffing Level Changes in Average Staffing Level (ASL) are presented in the Portfolio Additional Estimates Statements at the whole of agency level to demonstrate any movements since Budget.
Table 3.1.2: Average Staffing Level 2008-09 2008-09Budget Revised Variation
Outcome 1A fair and efficient market characterised by integrity and transparency andsupporting confident and informed participation of investors and consumers 1,685 1,794 109Total 1,685 1,794 109
3.2 BUDGETED FINANCIAL STATEMENTS
3.2.1 Analysis of budgeted financial statements Departmental financial statements
Budgeted departmental income statement
ASIC is currently budgeting for a break-even operating result for 2008-09 and for the remainder of the forward estimates.
Revenues from government for 2008-09 are $310.1 million, which is an increase of $11.2 million from the Portfolio Budget Statements 2008-09. This is comprised of $1.6 million for the Council of Australian Governments — implementing a national approach to the regulation of consumer credit measure; $10.0 million for the global financial crisis — additional funding for regulators and the Treasury measure; $1.0 million for the Australian Business Number and Business Name Registration project, less $1.4 million to be transferred to the Department of the Treasury as part of a reallocation of funds for Standard Business Reporting.
Total revenues and expenses are estimated to be $317.5 million for 2008-09. The expenditure will be used to fund activities that contribute towards achieving ASIC’s output objectives.
Budgeted departmental balance sheet
This statement shows the financial position of ASIC. It helps decision makers to track the management of ASIC’s assets and liabilities.
ASIC’s budgeted equity (or net asset position) for 2008-09 is $93.4 million. This includes capital funding of $17.4 million received in 2008-09.

Agency Additional Estimates Statements — ASIC
83
Budgeted departmental statement of cash flows
The budgeted statement of cash flows provides important information on the extent and nature of cash flows by categorising them into expected cash flows from operating activities, investing activities and financing activities.
Departmental statement of changes in equity — summary of movement
This statement shows the changes in the equity position of ASIC. It helps decision makers to track the management of ASIC’s equity.
Schedule of administered activity
Schedule of budgeted income and expenses administered on behalf of government
The schedule of budgeted income and expenses administered on behalf of government shows the revenue and expenses associated with the collection of revenue under the Corporations Act 2001 and ASIC’s responsibilities in administering unclaimed moneys under the Banking Act 1959 and the Life Insurance Act 1995.
Other non-taxation revenue represents the amount of fees and charges budgeted to be levied under the Corporations Act 2001 and estimated receipts of unclaimed moneys under the Banking Act 1959 and the Life Insurance Act 1995.
Expenses represent budgeted payments of unclaimed moneys, refund of overpaid fees and charges levied under the Corporations Act 2001, bad debt expense and payments to registered insolvency practitioners to investigate breaches of directors’ duties and fraudulent conduct.
Schedule of budgeted assets and liabilities administered on behalf of government
The amount shown for receivables in 2008-09 and in the forward estimates is the estimated amount of fees and charges under the Corporations Act 2001 remaining unpaid at 30 June.
The amounts shown in other payables for 2008-09 and the forward estimates represent the estimated amount of refunds relating to the over payments of annual review and other fees under the Corporations Act 2001.
Schedule of budgeted administered cash flows
Budgeted administered cash flows, provide important information on the extent and nature of cash flows by categorising them into expected cash flows from operating activities, investing activities and financing activities.

Agency Additional Estimates Statements — ASIC
84
Table 3.2.1: Budgeted departmental income statement (for the period ended 30 June)
Actual Revised Forward Forward Forwardbudget estimate estimate estimate
2007-08 2008-09 2009-10 2010-11 2011-12$'000 $'000 $'000 $'000 $'000
INCOMERevenue
Revenues from Government 282,218 310,126 331,828 302,733 305,660 Sale of services 4,370 4,000 4,080 4,162 4,244 Interest 6 - - - - Other 5,269 3,241 3,305 3,371 3,438
Total revenue 291,863 317,367 339,213 310,266 313,342
GainsOther 126 126 126 126 126
Total gains 126 126 126 126 126 Total income 291,989 317,493 339,339 310,392 313,468
EXPENSEEmployees 164,676 180,628 195,713 175,309 177,248 Suppliers 92,930 105,503 108,762 103,428 104,565 Depreciation and amortisation 15,554 30,862 34,364 31,155 31,155 Finance costs 306 500 500 500 500 Write-down of assets and
impairment of assets 334 - - - - Net losses from sale of assets 6 - - - -
Total expenses 273,806 317,493 339,339 310,392 313,468 Net surplus or (deficit) attributable
to the Australian Government 18,183 - - - - Prepared on an Australian Accounting Standards basis.

Agency Additional Estimates Statements — ASIC
85
Table 3.2.2: Budgeted departmental balance sheet (as at 30 June)
Actual Revised Forward Forward Forwardbudget estimate estimate estimate
2007-08 2008-09 2009-10 2010-11 2011-12$'000 $'000 $'000 $'000 $'000
ASSETSFinancial assets
Cash and cash equivalents 8,415 4,128 4,302 4,161 4,202 Receivables 115,660 47,412 42,873 48,853 52,028
Total financial assets 124,075 51,540 47,175 53,014 56,230
Non-financial assetsLeasehold improvements 24,303 41,815 54,860 54,152 53,723 Plant and equipment 6,792 25,173 23,472 24,380 34,014 Intangibles 18,742 56,244 57,030 48,475 35,815 Other 2,686 3,146 3,237 3,099 3,133
Total non-financial assets 52,523 126,378 138,599 130,106 126,685 Total assets 176,598 177,918 185,774 183,120 182,915
LIABILITIESPayables
Suppliers 20,678 17,334 17,970 17,003 17,242 Other payables 24,996 13,132 11,218 10,308 9,097
Total payables 45,674 30,466 29,188 27,311 26,339
Interest bearing liabilitiesLeases 188 - - - -
Total interest bearing liabilities 188 - - - -
ProvisionsEmployees 43,636 46,953 48,639 47,621 48,125 Other provisions 11,150 7,118 7,346 7,587 7,850
Total provisions 54,786 54,071 55,985 55,208 55,975 Total liabilities 100,648 84,537 85,173 82,519 82,314 EQUITY
Contributed equity 59,354 76,785 84,005 84,005 84,005 Reserves 8,900 8,900 8,900 8,900 8,900 Retained surpluses or
accumulated deficits 7,696 7,696 7,696 7,696 7,696 Total equity 75,950 93,381 100,601 100,601 100,601
Current assets 126,761 54,686 50,412 56,113 59,363 Non-current assets 49,837 123,232 135,362 127,007 123,552 Current liabilities 77,784 64,123 65,173 62,961 63,024 Non-current liabilities 22,864 20,414 20,000 19,558 19,290 Prepared on an Australian Accounting Standards basis.

Agency Additional Estimates Statements — ASIC
86
Table 3.2.3: Budgeted departmental statement of cash flows (for the period ended 30 June)
Actual Revised Forward Forward Forwardbudget estimate estimate estimate
2007-08 2008-09 2009-10 2010-11 2011-12$'000 $'000 $'000 $'000 $'000
OPERATING ACTIVITIESCash received
Services 4,761 5,046 4,046 4,126 4,208 Appropriations 245,376 365,289 336,668 297,056 302,788 Interest 6 - - - - Net GST received 8,996 18,860 14,667 13,403 13,373 Other cash received 5,946 3,241 1,742 1,808 3,438
Total cash received 265,085 392,436 357,123 316,393 323,807
Cash usedEmployees 154,999 183,851 194,027 176,027 176,744 Suppliers 102,878 125,663 123,176 117,707 119,322 Financing costs 40 190 - - - Return of court costs to Government 171 - - - - Transfer to the Official Public Account 45,206 - - - -
Total cash used 303,294 309,704 317,203 293,734 296,066 Net cash from or (used by)
operating activities (38,209) 82,732 39,920 22,659 27,741
INVESTING ACTIVITIESCash used
Purchase of property, plant and equipment 17,732 104,257 46,494 22,800 27,700
Total cash used 17,732 104,257 46,494 22,800 27,700 Net cash from or (used by)
investing activities (17,732) (104,257) (46,494) (22,800) (27,700) FINANCING ACTIVITIESCash received
Appropriations - contributed equity 13,390 17,431 6,748 - - Total cash received 13,390 17,431 6,748 - -
Cash usedRepayment of finance lease principal 694 193 - - -
Total cash used 694 193 - - - Net cash from or (used by)
financing activities 12,696 17,238 6,748 - - Net increase or (decrease)
in cash held (43,245) (4,287) 174 (141) 41 Cash at the beginning of
the reporting period 51,660 8,415 4,128 4,302 4,161 Cash at the end of the
reporting period 8,415 4,128 4,302 4,161 4,202 Prepared on an Australian Accounting Standards basis.

Agency Additional Estimates Statements — ASIC
87
Table 3.2.4: Departmental statement of changes in equity — summary of movement (Budget 2008-09)
Accumulated Asset Other Contributed Totalresults revaluation reserves equity/ equity
reserve capital$'000 $'000 $'000 $'000 $'000
Opening balance as at 1 July 2008Balance carried forward from
previous period 7,696 8,900 - 59,354 75,950 Adjusted opening balance 7,696 8,900 - 59,354 75,950
Transactions with ownersContribution by owners
Appropriation (equity injection) - - - 17,431 17,431 Sub-total transactions with owners - - - 17,431 17,431
Estimated closing balanceas at 30 June 2009 7,696 8,900 - 76,785 93,381
Prepared on an Australian Accounting Standards basis.
Schedule of administered activity
Table 3.2.5: Schedule of budgeted income and expenses administered on behalf of government (for the period ended 30 June)
Actual Revised Forward Forward Forwardbudget estimate estimate estimate
2007-08 2008-09 2009-10 2010-11 2011-12$'000 $'000 $'000 $'000 $'000
INCOME ADMINISTERED ONBEHALF OF GOVERNMENT
RevenueNon-taxation
Other sources of non-taxationrevenues 589,855 609,440 617,358 625,357 633,439
Total income administeredon behalf of Government 589,855 609,440 617,358 625,357 633,439
EXPENSES ADMINISTERED ONBEHALF OF GOVERNMENTSuppliers 966 3,424 3,451 3,512 3,560 Write down and impairment of assets 22,506 22,555 22,826 23,100 23,376 Other 29,445 24,540 25,190 25,860 26,540
Total expenses administeredon behalf of Government 52,917 50,519 51,467 52,472 53,476
Prepared on an Australian Accounting Standards basis.

Agency Additional Estimates Statements — ASIC
88
Table 3.2.6: Schedule of budgeted assets and liabilities administered on behalf of government (as at 30 June)
Actual Revised Forward Forward Forwardbudget estimate estimate estimate
2007-08 2008-09 2009-10 2010-11 2011-12$'000 $'000 $'000 $'000 $'000
ASSETS ADMINISTERED ON BEHALF OF GOVERNMENT
Financial assetsCash and cash equivalents 3,064 5,052 4,652 4,651 4,650 Receivables 83,059 88,816 96,981 104,768 112,577
Total financial assets 86,123 93,868 101,633 109,419 117,227
Total assets administered on behalf of Government 86,123 93,868 101,633 109,419 117,227
LIABILITIES ADMINISTERED ON BEHALF OF GOVERNMENT
PayablesSuppliers 446 446 446 446 446 Other payables 4,397 4,397 4,397 4,397 4,397
Total payables 4,843 4,843 4,843 4,843 4,843
Total liabilities administeredon behalf of Government 4,843 4,843 4,843 4,843 4,843
Prepared on an Australian Accounting Standards basis.

Agency Additional Estimates Statements — ASIC
89
Table 3.2.7: Schedule of budgeted administered cash flows (for the period ended 30 June)
Actual Revised Forward Forward Forwardbudget estimate estimate estimate
2007-08 2008-09 2009-10 2010-11 2011-12$'000 $'000 $'000 $'000 $'000
OPERATING ACTIVITIESCash received
Net GST received 116 313 313 319 322 Other 561,700 580,931 586,062 594,162 601,942
Total cash received 561,816 581,244 586,375 594,481 602,264
Cash usedSuppliers 1,411 3,737 3,764 3,831 3,882 Other 29,420 24,343 24,885 25,552 26,228
Total cash used 30,831 28,080 28,649 29,383 30,110 Net cash from
operating activities 530,985 553,164 557,726 565,098 572,154
FINANCING ACTIVITIESCash received
Cash from Official Public Account 35,028 33,964 34,641 35,372 36,100 Total cash received 35,028 33,964 34,641 35,372 36,100
Cash usedCash to Official Public Account 565,455 585,140 592,767 600,471 608,255
Total cash used 565,455 585,140 592,767 600,471 608,255 Net cash from
financing activities (530,427) (551,176) (558,126) (565,099) (572,155)
Net increase or (decrease) in cash held 558 1,988 (400) (1) (1) Cash at beginning of reporting period 2,506 3,064 5,052 4,652 4,651
Cash at end of reporting period 3,064 5,052 4,652 4,651 4,650 Prepared on an Australian Accounting Standards basis.

Agency Additional Estimates Statements — ASIC
90
Notes to the financial statements Basis of accounting
The budgeted financial statements have been prepared on an Australian Accounting Standards basis.
Budgeted agency financial statements
Under the Australian Government’s accrual budgeting framework, and consistent with Australian Accounting Standards, transactions that agencies control (departmental transactions) are separately budgeted for and reported on from transactions that agencies do not have control over (administered transactions). This ensures that agencies are only held fully accountable for the transactions over which they have control.
Departmental items are those assets, liabilities, revenues and expenses in relation to an agency or authority that are controlled by the agency. Departmental expenses include employee and supplier expenses and other administrative costs, which are incurred by the agency in providing its goods and services.
Administered items are revenues, expenses, assets and liabilities that are managed by an agency or authority on behalf of the Australian Government according to set government directions. Administered expenses and administered revenues include fees, fines and expenses that have been earmarked for a specific purpose by the government.
Appropriations in the accrual budgeting framework
Under the Australian Government’s accrual budgeting framework, separate annual appropriations are provided for:
• departmental price of outputs appropriations representing the Australian Government’s purchase of outputs from agencies;
• departmental capital appropriations for investments by the Australian Government for either additional equity or loans in agencies;
• administered expense appropriations for the estimated administered expenses relating to an existing outcome or a new outcome; and
• administered capital appropriations for increases in administered equity through funding non-expense administered payments.

Agency Additional Estimates Statements — ASIC
91
Departmental
Asset valuation
ASIC has adopted fair value as a basis for valuing its leasehold improvements and plant and equipment. Valuation is conducted with sufficient frequency to ensure that the carrying amounts of assets do not differ materially from the assets fair values as at the reporting date.
Asset recognition threshold
Purchases of property, plant and equipment are recognised initially at cost in the balance sheet, except for purchases costing less than $2,000, which are expensed in the year of acquisition.
Leases
A distinction is made between finance leases, which effectively transfer from the lessor to the lessee substantially all the risks and benefits incidental to ownership of leased non-current assets, and operating leases under which the lessor effectively retains substantially all such risks and benefits.
Where a non-current asset is acquired by means of a finance lease, the asset is capitalised at the lower of fair value or the present value of minimum lease payments at the inception of the lease and a liability recognised for the same amount. Leased assets are amortised over the period of the lease. Lease payments are allocated between the principal component and the interest expense.
Operating lease payments are charged to the income statement on a basis that is representative of the pattern of benefits derived from the lease assets.
Depreciation and amortisation
Computer equipment is depreciated using the declining-balance method whilst, for all other plant and equipment, the straight-line method of depreciation is applied. Leasehold improvements are amortised on a straight-line basis over the lesser of the estimated life of the improvements or the unexpired period of the lease.
Depreciation/amortisation rates (useful lives) are reviewed at each balance date and necessary adjustments are recognised.
Receivables
A provision is raised for any doubtful debts based on a review of the collectability of all outstanding accounts as at year-end.
Bad debts are written off during the year in which they are identified.

Agency Additional Estimates Statements — ASIC
92
Provisions and payables
Provisions and payables represent liabilities for miscellaneous accruals and employee benefits, including accrued salary and leave entitlements, provisions for making-good leased premises and lease incentives. No provision for sick leave is required as all sick leave is non-vesting.
Administered
Schedule of budgeted revenues and expenses administered on behalf of government
Revenues
Non-taxation revenues are predominately comprised of Corporations Act 2001 fees and charges and collections of unclaimed moneys under the Banking Act 1959 and the Life Insurance Act 1995.
Write down and impairment of assets
Write down and impairment of assets represents waivers and write-offs of Corporations Law fees.
Schedule of budgeted assets and liabilities administered on behalf of government
Financial assets
The financial assets include Corporations Law debt invoiced and still outstanding at year-end.
Schedule of budgeted administered cash flows
All cash collected by ASIC for Corporations Law revenue, is transferred to the Official Public Account at the close of business each day. Cash collected for Banking Act 1959 unclaimed moneys and Life Insurance Act 1995 unclaimed moneys is transferred to the Official Public Account when received.

93
OFFICE OF THE AUDITING AND ASSURANCE STANDARDS BOARD
Section 1: Agency overview and resources.............................................................95 1.1 Strategic direction ...............................................................................................95 1.2 Agency resource statement ................................................................................96 1.3 Agency measures table ......................................................................................96 1.4 Additional estimates and variations ....................................................................97 1.5 Breakdown of additional estimates by Appropriation Bill ....................................98
Section 2: Outcomes and planned performance .....................................................99 2.1 Outcomes and performance information ............................................................99
Section 3: Explanatory tables and budgeted financial statements .....................102 3.1 Explanatory tables ............................................................................................102 3.2 Budgeted financial statements..........................................................................103


95
OFFICE OF THE AUDITING AND ASSURANCE STANDARDS BOARD
Section 1: Agency overview and resources
1.1 STRATEGIC DIRECTION
The Office of the Auditing and Assurance Standards Board (AUASB) is an Australian Government agency under the Australian Securities and Investments Commission Act 2001. The AUASB transferred governance arrangements from the Commonwealth Authorities and Companies Act 1997 framework to the Financial Management and Accountability Act 1997 framework from 1 July 2008.
The functions of the AUASB are to:
• make auditing standards under section 336 of the Corporations Act 2001 for the purposes of the corporations legislation;
• formulate auditing and assurance standards for other purposes;
• formulate guidance on auditing and assurance matters; and
• participate in and contribute to the development of a single set of auditing standards for world-wide use; and to advance and promote the main objectives of part 12 of the Australian Securities and Investments Commission Act 2001.
The vision of the AUASB is to be recognised as a leading national auditing and assurance standards setting body that develops high quality auditing and assurance standards and guidance in the public interest.
The mission of the AUASB is to develop, in the public interest, high quality auditing and assurance standards and related guidance as a means to enhance the relevance, reliability and timeliness of information provided to users of audit and assurance services.
Key strategies during 2008-09 include:
• developing auditing and assurance standards and guidance;
• identify emerging auditing and assurance issues;

Agency Additional Estimates Statements —AUASB
96
• contribute to and influence the development of international auditing standards; and
• promote awareness and understanding of the AUASB role and work program, auditor responsibilities, and the role of auditing and assurance services.
1.2 AGENCY RESOURCE STATEMENT
Table 1.1 outlines the total resourcing available from all sources. The table summarises how resources will be applied to the AUASB.
Table 1.1: Auditing and Assurance Standards Board resource statement — additional estimates for 2008-09 as at Additional Estimates December 2008
Estimate Estimate Proposed Total as at as at additional estimate
Budget1 Budget2 + estimates = at Additional Estimates
2008-09 2008-09 2008-09 2008-09$'000 $'000 $'000 $'000
Ordinary annual servicesDepartmental outputs
Departmental outputs - 1,078 41 3 1,119 Receipts from other sources (s31) - 927 - 927
Total ordinary annual services A - 2,005 41 2,046 Other servicesDepartmental non-operating
Equity injections - - 579 4 579 Total other services B - - 579 579 Special accounts
Opening balance - - - - Non-appropriation receipts - 900 - 900
Total special accounts C - 900 - 900 Total resourcing (A + B + C) - 2,905 620 3,525
Less receipts from other sourcescredited to special accounts - 900 - 900
Total net resourcing for AUASB - 2,005 620 2,625 1. The AUASB did not receive a separate appropriation in the 2008-09 Budget. 2. Appropriation was transferred from the Department of the Treasury to the AUASB under section 32 of
the Financial Management and Accountability Act 1997. 3. Appropriation Bill (No. 3) 2008-09. 4. Appropriation Bill (No. 4) 2008-09.
1.3 AGENCY MEASURES TABLE
Table 1.2: Agency measures since Budget The AUASB does not have any measures since the 2008-09 Budget.

Agency Additional Estimates Statements —AUASB
97
1.4 ADDITIONAL ESTIMATES AND VARIATIONS
Table 1.4 details the additional estimates and variations sought as a result of the AUASB transferring governance arrangements from the Commonwealth Authorities and Companies Act 1997 framework to the Financial Management and Accountability Act 1997 framework through Appropriation Bills No. 3 and No. 4.
Table 1.3: Additional estimates and variations to outcomes from measures since 2008-09 Budget The AUASB does not have any additional estimates or variations as a result of Budget measures.
Table 1.4: Additional estimates and variations to outcomes from other variations Output Group 2008-09 2009-10 2010-11 2011-12
impacted $'000 $'000 $'000 $'000Outcome 1Increase in estimates (departmental)
Interest revenue forgone as aresult of becoming an agencysubject to the FinancialManagement and AccountabilityAct 1997 1.1 41 41 41 41
Equity injection equivalent to thecash at bank amount as aresult of becoming an agencysubject to the FinancialManagement and AccountabilityAct 1997 1.1 579 - - -
Net impact on estimates for outcome 1 (departmental) 620 41 41 41

Agency Additional Estimates Statements —AUASB
98
1.5 BREAKDOWN OF ADDITIONAL ESTIMATES BY APPROPRIATION BILL
Table 1.5 details the additional estimates sought for the AUASB through Appropriation Bill No. 3. Table 1.6 details the additional estimates sought for the AUASB through Appropriation Bill No. 4.
Table 1.5: Appropriation Bill (No. 3) 2008-09 2008-09 2008-09 2008-09 Additional ReducedBudget1 Budget2 revised estimates estimates
$'000 $'000 $'000 $'000 $'000DEPARTMENTAL OUTPUTSOutcome 1The formulation and making of auditing and assurance standards that are used by auditors of Australian entity financial reports or for other auditing and assurance engagements - 1,078 1,119 41 - Total - 1,078 1,119 41 - 1. The AUASB did not receive a separate appropriation in the 2008-09 Budget. 2. Appropriation was transferred from the Department of the Treasury to the AUASB under section 32 of
the Financial Management and Accountability Act 1997.
Table 1.6: Appropriation Bill (No. 4) 2008-09 2008-09 2008-09 2008-09 Additional ReducedBudget1 Budget2 revised estimates estimates
$'000 $'000 $'000 $'000 $'000Non-operating
Equity injections - - 579 579 - Total - - 579 579 - 1. The AUASB did not receive a separate appropriation in the 2008-09 Budget. 2. Appropriation was transferred from the Department of the Treasury to the AUASB under section 32 of
the Financial Management and Accountability Act 1997.

Agency Additional Estimates Statements —AUASB
99
Section 2: Outcomes and planned performance
2.1 OUTCOMES AND PERFORMANCE INFORMATION
The Australian Government requires agencies to measure their intended and actual performance in terms of outcomes. Government outcomes are the results, impacts or consequences of actions by the Government on the Australian community.
The AUASB’s outcome is described below, specifying the performance indicators and targets used to assess and monitor the performance of the AUASB in achieving government outcomes.
2.1.1 Outcome 1: The formulation and making of auditing and assurance standards that are used by auditors of Australian entity financial reports or for other auditing and assurance engagements Outcome 1 strategy
The key strategies to achieve Outcome 1 are:
• making auditing standards under section 336 of the Corporations Act 2001 and for related guidance for use by Australian auditors who are undertaking audit engagements for the purposes of the Corporations legislation (Output 1.1.1);
• formulating auditing and assurance standards and related guidance for use by Australian auditors who are undertaking auditing or assurance engagements for purposes other than the purposes of the Corporations legislation (Output 1.1.2); and
• to provide Australian participation in, and contribution to, the development of a single set of auditing standards for world-wide use (Output 1.1.3).
The AUASB will continue its role in the development of auditing and assurance standards guidance, identifying emerging auditing and assurance issues and contributing to and influence the development of international auditing standards.

Agency Additional Estimates Statements —AUASB
100
Contributions to Outcome 1
Output Group 1.1 — Auditing and Assurance Standards Board
Components of Output Group 1.1 AUASB are:
• Output 1.1.1 — making auditing standards under section 336 of the Corporations Act 2001 and related guidance for use by Australian auditors who are undertaking audit engagements for the purposes of Corporations legislation.
• Output 1.1.2 — formulating auditing and assurance standards and related guidance for use by Australian auditors who are undertaking auditing or assurance engagements for purposes other than for the purposes of the Corporations legislation.
• Output 1.1.3 — to provide Australian participation in, and contribution to, the development of a single set of auditing standards for world-wide use.
Output 1.1.1 — making auditing standards under section 336 of the Corporations Act 2001 and related guidance for use by Australian auditors who are undertaking audit engagements for the purposes of Corporations legislation.
Output 1.1.1 reflects the AUASB’s role in the development of standards that are legally enforceable under the Corporations Act. This output involves:
• monitoring the International Assurance and Accounting Standards Board (IAASB) and other international standard setters’ activities;
• issuing exposure drafts of proposed auditing standards for public comment;
• issuing auditing standards;
• issuing amending auditing standards;
• assessing the regulatory impact of proposed standards; and
• issuing related guidance statement on auditing and assurance matters.
Key performance indicators 2008-09 target
Issuing auditing standards of the highest quality that are consistent with those developed by the IAASB, subject to revision:
• for Australian legal and regulatory requirements;
• to a form suitable as a legal instrument; and
• allowing for any additional Australian public interest considerations.
Develop a set of revised and redrafted legally enforceable auditing standards based on the ‘clarity’ versions of International Standards on Auditing.
Develop amending auditing standards as required on a timely basis.
Output 1.1.2 — formulating auditing and assurance standards and related guidance for use by Australian auditors who are undertaking auditing or assurance engagements for purposes other than the purposes of Corporations legislation.
Output 1.1.2 reflects the AUASB’s role in the development of auditing standards for other purposes. This output involves:
• issuing assurance standards and auditing standards for other purposes.

Agency Additional Estimates Statements —AUASB
101
Contributions to Outcome 1 (continued)
Key performance indicators 2008-09 target
Revising existing assurance standards.
Developing new assurance standards.
Revise and issue assurance standards for other purposes as required on a timely basis.
Output 1.1.3 — to provide Australian participation in, and contribution to, the development of a single set of auditing standards for world-wide use.
Output 1.1.3 reflects the AUASB’s role in the development of global auditing standards. This output involves:
• contributing to the development of international auditing and assurance standards.
Key performance indicators 2008-09 target
Contribute to and influence the development of international auditing and assurance standards that will result in a single set of robust and high quality standards for world-wide use.
Respond to all significant IAASB exposure drafts.
Monitor IAASB activities.
Provide technical support to IAASB member.
Provide technical assistance for IAASB projects.
Identify emerging auditing and assurance issues of public interest and address as appropriate on a timely basis.
Monitor the activities of other National Standards Setters.
Participate in the work of the IAASB National Standards Setters forum.
Participate in the work of the Trans-Tasman Accounting and Auditing Standards Advisory Group.

Agency Additional Estimates Statements —AUASB
102
Section 3: Explanatory tables and budgeted financial statements
3.1 EXPLANATORY TABLES
3.1.1 Estimates of special account flows Special accounts provide a means to set aside and record amounts used for specified purposes. Table 3.1.1 shows the expected additions (receipts) and reductions (payments) for each account used by the AUASB.
Table 3.1.1: Estimates of special account flows Opening Closingbalance Receipts Payments Adjustments balance2008-09 2008-09 2008-09 2008-09 2008-092007-08 2007-08 2007-08 2007-08 2007-08
Outcome $'000 $'000 $'000 $'000 $'000Office of the Auditing and
Assurance Standards Board 1 - 900 900 - - Special Account - - - - -
Office of the Auditing andAssurance Standards BoardServices for Other Entitiesand Trust Moneys Special 1 - - - - - Account - - - - -
Total special accounts 2008-09 Budget estimate - 900 900 - -
Total special accounts2007-08 estimate actual - - - - -
3.1.2 Estimates of variations to Average Staffing Level Table 3.1.2 provides the Average Staffing Level for the AUASB.
Table 3.1.2: Average Staffing Level 2008-09 2008-09Budget Revised Variation
Outcome 1The formulation and making of auditing and assurance standards that are used by auditors of Australian entity financial reports or for other auditing and assurance engagements 9 9 - Total 9 9 -

Agency Additional Estimates Statements —AUASB
103
3.2 BUDGETED FINANCIAL STATEMENTS
Departmental financial statements Table 3.2.1: Budgeted departmental income statement (for the period ended 30 June)
Actual Budget Forward Forward Forwardestimates estimate estimate estimate
2007-08 2008-09 2009-10 2010-11 2011-12$'000 $'000 $'000 $'000 $'000
INCOMERevenue
Revenues from Government 1,379 1,119 1,128 1,167 1,230 Goods and services 26 28 29 30 31 Interest 41 - - - - Other1 900 900 900 900 900
Total revenue 2,346 2,047 2,057 2,097 2,161
EXPENSEEmployees 1,426 1,287 1,269 1,279 1,313 Suppliers 775 701 729 758 789 Depreciation and amortisation 59 59 59 59 59 Finance costs 3 - - - -
Total expenses 2,263 2,047 2,057 2,096 2,161
Net surplus or (deficit) attributable to the Australian Government 83 - - - -
1. Estimates for other revenue for 2009-10 and onwards are yet to be confirmed. Prepared on an Australian Accounting Standards basis.

Agency Additional Estimates Statements —AUASB
104
Table 3.2.2: Budgeted departmental balance sheet (as at 30 June)
Actual Budget Forward Forward Forwardestimate estimate estimate estimate
2007-08 2008-09 2009-10 2010-11 2011-12$'000 $'000 $'000 $'000 $'000
ASSETSFinancial assets
Cash and cash equivalents 579 579 579 579 579 Receivables 285 344 403 462 521
Total financial assets 864 923 982 1,041 1,100
Non-financial assetsInfrastructure, plant and equipment 309 250 191 132 73 Intangibles 10 10 10 10 10 Other non-financial assets 49 49 49 49 49
Total non-financial assets 368 309 250 191 132 Total assets 1,232 1,232 1,232 1,232 1,232
LIABILITIESPayables
Other payables 374 374 374 374 374 Total payables 374 374 374 374 374
ProvisionsEmployees 271 371 371 371 371 Other provisions 61 61 61 61 61
Total provisions 332 432 432 432 432 Total liabilities 706 806 806 806 806 EQUITYParent entity interest
Retained surpluses or accumulated deficits 526 426 426 426 426
Total equity 526 426 426 426 426
Current assets 870 923 982 1,041 1,100 Non-current assets 362 309 250 191 132 Current liabilities 336 545 545 545 545 Non-current liabilities 370 61 61 61 61 Prepared on an Australian Accounting Standards basis.

Agency Additional Estimates Statements —AUASB
105
Table 3.2.3: Budgeted departmental statement of cash flows (for the period ended 30 June)
Actual Budget Forward Forward Forwardestimate estimate estimate estimate
2007-08 2008-09 2009-10 2010-11 2011-12$'000 $'000 $'000 $'000 $'000
OPERATING ACTIVITIESCash received
Goods and services - 28 29 30 31 Appropriations - 1,059 1,069 1,108 1,171 Interest 41 - - - - Net GST received 93 - - - - Other cash received1 2,435 900 900 900 900
Total cash received 2,569 1,987 1,998 2,038 2,102
Cash usedEmployees 1,408 1,286 1,269 1,280 1,313 Suppliers 979 701 729 758 789 Net GST paid 101 - - - -
Total cash used 2,488 1,987 1,998 2,038 2,102 Net cash from or (used by)
operating activities 81 - - - -
INVESTING ACTIVITIESCash used
Purchase of property, plant and equipment 9 - - - -
Total cash used 9 - - - - Net cash from or (used by)
investing activities (9) - - - - Net increase or (decrease)
in cash held 72 - - - - Cash at the beginning of
the reporting period 507 579 579 579 579 Cash at the end of the
reporting period 579 579 579 579 579 1. Estimates for other cash received for 2009-10 and onwards are yet to be confirmed. Prepared on an Australian Accounting Standards basis.

Agency Additional Estimates Statements —AUASB
106
Table 3.2.4: Departmental statement of changes in equity — summary of movement (Budget 2008-09)
Retained Asset Other Contributed Totalearnings revaluation reserves equity/ equity
reserve capital$'000 $'000 $'000 $'000 $'000
Opening balance as at 1 July 2008Balance carried forward from
previous period 526 - - - 526 Adjusted opening balance 526 - - - 526
Transactions with ownersContribution by owners
Actuarial losses (100) - - - (100) Sub-total transactions with owners (100) - - - (100)
Estimated closing balanceas at 30 June 2009 426 - - - 426
Prepared on an Australian Accounting Standards basis. Table 3.2.5: Schedule of budgeted income and expenses administered on behalf of government (for the period ended 30 June)
The AUASB does not have any administered funds.
Table 3.2.6: Schedule of budgeted assets and liabilities administered on behalf of government (as at 30 June)
The AUASB does not have any administered funds.
Table 3.2.7: Schedule of budgeted administered cash flows (for the period ended 30 June)
The AUASB does not have any administered funds.

107
OFFICE OF THE AUSTRALIAN ACCOUNTING STANDARDS BOARD
Section 1: Agency overview and resources...........................................................109 1.1 Strategic direction .............................................................................................109 1.2 Agency resource statement ..............................................................................110 1.3 Agency measures table ....................................................................................111 1.4 Additional estimates and variations ..................................................................111 1.5 Breakdown of additional estimates by Appropriation Bill ..................................112
Section 2: Outcomes and planned performance ...................................................113 2.1 Outcomes and performance information ..........................................................113
Section 3: Explanatory tables and budgeted financial statements .....................116 3.1 Explanatory tables ............................................................................................116 3.2 Budgeted financial statements..........................................................................117


109
OFFICE OF THE AUSTRALIAN ACCOUNTING STANDARDS BOARD
Section 1: Agency overview and resources
1.1 STRATEGIC DIRECTION
The Office of the Australian Accounting Standards Board (AASB) is an Australian Government agency under the Australian Securities and Investments Commission Act 2001. The AASB transferred governance arrangements from the Commonwealth Authorities and Companies Act 1997 framework to the Financial Management and Accountability Act 1997 framework from 1 July 2008.
The functions of the AASB are to:
• develop a conceptual framework for the purpose of evaluating proposed accounting standards and international standards;
• make accounting standards under section 334 of the Corporations Act 2001 for the purposes of the corporations legislation;
• formulate accounting standards for other purposes;
• participate in and contribute to the development of a single set of accounting standard for world-wide use; and
• facilitate the Australian economy by reducing the cost of capital, enabling Australian entities to compete effectively overseas, leaving accounting standards that are clearly stated and easily to understand, and to maintain investor confidence in the Australian economy (including its capital markets).
The vision of the AASB is to build on its reputation as a leading national standard setter and be recognised as a global centre of excellence, delivering a truly distinctive contribution to the development of high quality financial reporting standards.
The mission of the AASB is to develop and maintain high quality financial reporting standards for all sectors of the Australian economy and contribute, through leadership and talent, to the development of global financial reporting standards and be recognised as facilitating the inclusion of the Australian community in the activity of global standard setting.

Agency Additional Estimates Statements — AASB
110
Key priorities during 2008-09 include:
• issue Australian equivalents to the International Accounting Standards Board (IASB) standards, exposure drafts, invitations to comment and interpretations;
• retain a transaction neutral policy of standard setting;
• participate in ongoing IASB and International Public Sector Accounting Standards Board (IPSASB) research projects including extractive activities for the IASB and conceptual framework and service concessions for the IPSASB;
• issue an exposure draft and standard on superannuation entity accounting; and
• establish a policy on the use of the IPSASB standards in Australia.
1.2 AGENCY RESOURCE STATEMENT
Table 1.1 outlines the total resourcing available from all sources. The table summarises how resources will be applied to the AASB.
Table 1.1: Australian Accounting Standards Board resource statement — additional estimates for 2008-09 as at Additional Estimates December 2008
Total Estimate Estimate Proposed estimate
as at as at + additional = at Additional Budget1 Budget2 estimates Estimates2008-09 2008-09 2008-09 2008-09
$'000 $'000 $'000 $'000
Ordinary annual servicesDepartmental outputs
Departmental outputs - 1,225 269 3 1,494 Receipts from other sources (s31) - 3,101 - 3,101
Total ordinary annual services A - 4,326 269 4,595 Other servicesDepartmental non-operating
Equity injections - - 3,688 4 3,688 Total other services B - - 3,688 3,688 Special accounts
Opening balance - - - - Appropriation receipts - 700 - 700
Total special accounts C - 700 - 700 Total resourcing (A + B + C) - 5,026 3,957 8,983
Less receipts from other sourcescredited to special accounts - 700 - 700
Total net resourcing for AASB - 4,326 3,957 8,283 1. The AASB did not receive a separate appropriation in the 2008-09 Budget. 2. Appropriation was transferred from the Department of the Treasury to the AASB under section 32 of the
Financial Management and Accountability Act 1997. 3. Appropriation Bill (No. 3) 2008-09. 4. Appropriation Bill (No. 4) 2008-09.

Agency Additional Estimates Statements — AASB
111
1.3 AGENCY MEASURES TABLE
Table 1.2: Agency measures since Budget
The AASB does not have any measures since the 2008-09 Budget.
1.4 ADDITIONAL ESTIMATES AND VARIATIONS
Table 1.4 details the additional estimates and variations sought as a result of the AASB transferring governance arrangements from the Commonwealth Authorities and Companies Act 1997 framework to the Financial Management and Accountability Act 1997 framework through Appropriation Bills No. 3 and No. 4.
Table 1.3: Additional estimates and variations to outcomes from measures since 2008-09 Budget
The AASB does not have any additional estimates or variations as a result of Budget measures.
Table 1.4: Additional estimates and variations to outcomes from other variations Output Group 2008-09 2009-10 2010-11 2011-12
impacted $'000 $'000 $'000 $'000Outcome 1Increase in estimates (departmental)
Interest revenue forgone as aresult of becoming an agencysubject to the FinancialManagement and AccountabilityAct 1997 1.1 269 269 269 269
Equity injection equivalent to thecash at bank amount as aresult of becoming an agencysubject to the FinancialManagement and AccountabilityAct 1997 1.1 3,688 - - -
Net impact on estimates for outcome 1 (departmental) 3,957 269 269 269

Agency Additional Estimates Statements — AASB
112
1.5 BREAKDOWN OF ADDITIONAL ESTIMATES BY APPROPRIATION BILL
Table 1.5 details the additional estimates sought for the AASB through Appropriation Bill No. 3. Table 1.6 details the additional estimates sought for the AASB through Appropriation Bill No. 4.
Table 1.5: Appropriation Bill (No. 3) 2008-09 2008-09 2008-09 2008-09 Additional ReducedBudget1 Budget2 revised estimates estimates
$'000 $'000 $'000 $'000 $'000DEPARTMENTAL OUTPUTSOutcome 1The formulation and making of accounting standards that are used by Australian entities to prepare financial reports and enable users of these reports to make informed decisions - 1,225 1,494 269 - Total - 1,225 1,494 269 -
1. The AASB did not receive a separate appropriation in the 2008-09 Budget. 2. Appropriation was transferred from the Department of the Treasury to the AASB under section 32 of the
Financial Management and Accountability Act 1997.
Table 1.6: Appropriation Bill (No. 4) 2008-09 2008-09 2008-09 2008-09 Additional ReducedBudget1 Budget2 revised estimates estimates
$'000 $'000 $'000 $'000 $'000Non-operating
Equity injections - - 3,688 3,688 - Total - - 3,688 3,688 -
1. The AASB did not receive a separate appropriation in the 2008-09 Budget. 2. Appropriation was transferred from the Department of the Treasury to the AASB under section 32 of the
Financial Management and Accountability Act 1997.

Agency Additional Estimates Statements — AASB
113
Section 2: Outcomes and planned performance
2.1 OUTCOMES AND PERFORMANCE INFORMATION
The Australian Government requires agencies to measure their intended and actual performance in terms of outcomes. Government outcomes are the results, impacts or consequences of actions by the Government on the Australian community.
The AASB’s outcome is described below, specifying the performance indicators and targets used to assess and monitor the performance of the AASB in achieving government outcomes.
2.1.1 Outcome 1: The formulation and making of accounting standards that are used by Australian entities to prepare financial reports and enable users of these reports to make informed decisions Outcome 1 strategy
The key strategies to achieve Outcome 1 are:
• to make accounting standards under section 334 of the Corporations Act 2001 for the purposes of the financial reporting requirements of the Corporations legislation and providing guidance on the interpretation of those standards (Output 1.1.1);
• formulating accounting standards for purposes of financial reporting by Australian entities that are not subject to the reporting requirements of the Corporations legislation and providing guidance on the interpretation of those standards (Output 1.1.2); and
• to provide Australian participation in, and contribution to, the development of a single set of accounting standards for world-wide use (Output 1.1.3).
The AASB will continue its role in the development of legally enforceable accounting standards, the development of accounting standards for non corporation’s legislation entities and the development of global accounting standards.

Agency Additional Estimates Statements — AASB
114
Contributions to Outcome 1
Output Group 1.1 — Australian Accounting Standards Board
Components of Output Group 1.1 are:
• Output 1.1.1 — making accounting standards under section 334 of the Corporations Act 2001 for the purposes of the financial reporting requirements of the Corporations legislation and providing guidance on the interpretation of those standards;
• Output 1.1.2 — formulating accounting standards for purposes of financial reporting by Australian entities that are not subject to the reporting requirements of the Corporations legislation and providing guidance on the interpretation of those standards; and
• Output 1.1.3 — to provide Australian participation in, and contribution to, the development of a single set of accounting standards for world-wide use.
Output 1.1.1 — making accounting standards under section 334 of the Corporations Act 2001 for the purposes of the financial reporting requirements of the Corporations legislation and providing guidance on the interpretation of those standards
Output 1.1.1 reflects the AASB’s role in the development of legally enforceable accounting standards. This output involves:
• issuing Australian standards;
• amending existing standards; and
• developing standards setting expertise.
Key performance indicators 2008-09 target
Convert each standard and standard amendment developed by the IASB, into Australian Law.
Each converted IASB standard and standard amendment must accord with:
• Australian legislative drafting protocols; and
• Federal Register of Legislative Instruments requirements.
Prepare and publish compiled versions of standards.
Compilations are lodged on the:
• Federal Register of Legislative Instruments; and
• The AASB website.
Issue exposure drafts. Obtain stakeholder feedback.
Provide feedback to the IASB.
Output 1.1.2 — formulating accounting standards for purposes of financial reporting by Australian entities that are not subject to reporting requirements of the Corporations legislation and providing guidance on the interpretation of those standards.
Output 1.1.2 — reflects the AASB’s role in the development of accounting standards for non corporations legislation entities. This output involves:
• developing accounting standards for the public sector and non-Corporations Act entities.

Agency Additional Estimates Statements — AASB
115
Contributions to Outcome 1 (continued)
Key performance indicators 2008-09 target
Issue Australian accounting standards. Update the AASB website within three days of finalising any standard.
Prepare and publish compiled versions of standards.
Update the AASB website within three days of finalising any compiled standard.
Output 1.1.3 — to provide Australian participation in, and contribution to, the development of a single set of accounting standards for world-wide use.
Output 1.1.3 — reflects the AASB’s role in the development of global accounting standards. This output involves:
• contributing to the development of International Financial Reporting Standards, International Public Sector Accounting Standards and participation in various international forums.
Key performance indicators 2008-09 target
Participate in international standards setting and other research projects.
Respond to all significant IASB and IPSASB exposure drafts; and
Undertake research and prepare draft accounting standards on behalf of the IASB and IPSASB.
Maintain close working relationships with equivalent organisations in other jurisdictions.
Host and/or attend National Standards Setters meetings; and
Participate in the work of the Trans-Tasman Accounting and Auditing Standards Advisory Group.
Develop personnel with experience in standard setting.
Provide developmental opportunities for accounting professionals, including recent graduates.

Agency Additional Estimates Statements — AASB
116
Section 3: Explanatory tables and budgeted financial statements
3.1 EXPLANATORY TABLES
3.1.1 Estimates of special account flows Special accounts provide a means to set aside and record amounts used for specified purposes. Table 3.1.1 shows the expected additions (receipts) and reductions (payments) for each account used by the AASB.
Table 3.1.1: Estimates of special account flows Opening Closingbalance Receipts Payments Adjustments balance2008-09 2008-09 2008-09 2008-09 2008-092007-08 2007-08 2007-08 2007-08 2007-08
Outcome $'000 $'000 $'000 $'000 $'000Office of the Australian
Accounting Standards Board 1 - 700 700 - - Special Account - - - - -
Office of the AustralianAccounting Standards BoardServices for Other Entitiesand Trust Moneys Special 1 - - - - - Account - - - - -
Total special accounts 2008-09 Budget estimate - 700 700 - -
Total special accounts2007-08 estimate actual - - - - -
3.1.2 Estimates of variations to Average Staffing Level Table 3.1.2 provides the Average Staffing Level for the AASB.
Table 3.1.2: Average Staffing Level 2008-09 2008-09Budget Revised Variation
Outcome 1The formulation and making of accounting standards that are used by Australian entities to prepare financial reports and enable users of these reports to make informed decisions 23 23 - Total 23 23 -

Agency Additional Estimates Statements — AASB
117
3.2 BUDGETED FINANCIAL STATEMENTS
Table 3.2.1: Budgeted departmental income statement (for the period ended 30 June)
Actual Budget Forward Forward Forwardestimate estimate estimate estimate
2007-08 2008-09 2009-10 2010-11 2011-12$'000 $'000 $'000 $'000 $'000
INCOMERevenue
Revenues from Government 2,934 1,494 3,121 3,220 3,385 Goods and services 88 1,901 288 277 266 Interest 269 - - - - Other1 2,023 1,200 1,200 1,200 1,200
Total revenue 5,314 4,595 4,609 4,697 4,851
EXPENSEEmployees 3,127 3,179 3,142 3,177 3,276 Suppliers 1,300 1,270 1,321 1,374 1,429 Grants 200 - - - - Depreciation and amortisation 145 146 146 146 146 Finance costs 5 - - - -
Total expenses 4,777 4,595 4,609 4,697 4,851
Net surplus or (deficit) attributable to the Australian Government 537 - - - -
1. Estimates for other revenue for 2009-10 and onwards are yet to be confirmed. Prepared on an Australian Accounting Standards basis.

Agency Additional Estimates Statements — AASB
118
Table 3.2.2: Budgeted departmental balance sheet (as at 30 June)
Actual Budget Forward Forward Forwardestimate estimate estimate estimate
2007-08 2008-09 2009-10 2010-11 2011-12$'000 $'000 $'000 $'000 $'000
ASSETSFinancial assets
Cash and cash equivalents 3,691 3,691 3,691 3,691 3,691 Receivables 100 246 392 538 684
Total financial assets 3,791 3,937 4,083 4,229 4,375
Non-financial assetsInfrastructure, plant and equipment 687 541 395 249 103 Inventories 3 3 3 3 3 Intangibles 19 19 19 19 19 Other non-financial assets 88 88 88 88 88
Total non-financial assets 797 651 505 359 213 Total assets 4,588 4,588 4,588 4,588 4,588
LIABILITIESPayables
Other payables 639 639 639 639 639 Total payables 639 639 639 639 639
ProvisionsEmployees 1,310 2,310 2,310 2,310 2,310 Other provisions 101 101 101 101 101
Total provisions 1,411 2,411 2,411 2,411 2,411 Total liabilities 2,050 3,050 3,050 3,050 3,050 EQUITYParent entity interest
Retained surpluses or accumulated deficits 2,538 1,538 1,538 1,538 1,538
Total equity 2,538 1,538 1,538 1,538 1,538
Current assets 3,809 3,940 4,086 4,232 4,378 Non-current assets 779 648 502 356 210 Current liabilities 1,434 2,949 2,949 2,949 2,949 Non-current liabilities 616 101 101 101 101 Prepared on an Australian Accounting Standards basis.

Agency Additional Estimates Statements — AASB
119
Table 3.2.3: Budgeted departmental statement of cash flows (for the period ended 30 June)
Actual Budget Forward Forward Forwardestimate estimate estimate estimate
2007-08 2008-09 2009-10 2010-11 2011-12$'000 $'000 $'000 $'000 $'000
OPERATING ACTIVITIESCash received
Goods and services 133 1,901 288 277 266 Appropriations - 1,348 2,975 3,074 3,239 Interest 278 - - - - Net GST received 156 - - - - Other cash received1 4,950 1,200 1,200 1,200 1,200
Total cash received 5,517 4,449 4,463 4,551 4,705
Cash usedEmployees 3,017 3,179 3,142 3,177 3,276 Suppliers 1,591 1,270 1,321 1,374 1,429 Net GST paid 99 - - - - Other cash used 200 - - - -
Total cash used 4,907 4,449 4,463 4,551 4,705 Net cash from or (used by)
operating activities 610 - - - -
INVESTING ACTIVITIESCash used
Purchase of property, plant and equipment 93 - - - -
Net cash from or (used by) investing activities (93) - - - -
Net increase or (decrease)in cash held 517 - - - - Cash at the beginning of
the reporting period 3,174 3,691 3,691 3,691 3,691 Cash at the end of the
reporting period 3,691 3,691 3,691 3,691 3,691 1. Estimates for other cash received for 2009-10 and onwards are yet to be confirmed. Prepared on an Australian Accounting Standards basis.

Agency Additional Estimates Statements — AASB
120
Table 3.2.4: Departmental statement of changes in equity — summary of movement (Budget 2008-09)
Accumulated Asset Other Contributed Totalresults revaluation reserves equity/ equity
reserve capital$'000 $'000 $'000 $'000 $'000
Opening balance as at 1 July 2008Balance carried forward from
previous period 2,538 - - - 2,538 Adjusted opening balance 2,538 - - - 2,538
Transactions with ownersContribution by owners
Actuarial losses (1,000) - - - (1,000) Sub-total transactions with owners (1,000) - - - (1,000)
Estimated closing balanceas at 30 June 2009 1,538 - - - 1,538
Prepared on an Australian Accounting Standards basis.
Table 3.2.5: Schedule of budgeted income and expenses administered on behalf of government (for the period ended 30 June)
The AASB does not have any administered funds.
Table 3.2.6: Schedule of budgeted assets and liabilities administered on behalf of government (as at 30 June)
The AASB does not have any administered funds.
Table 3.2.7: Schedule of budgeted administered cash flows (for the period ended 30 June)
The AASB does not have any administered funds.

121
PORTFOLIO GLOSSARY
Term Meaning
Accrual accounting System of accounting where items are brought to account and included in the financial statements as they are earned or incurred, rather than as they are received or paid.
Accumulated depreciation The aggregate depreciation recorded for a particular depreciating asset.
Administered items Expenses, revenues, assets or liabilities managed by agencies on behalf of the Australian Government. Agencies do not control administered items. Administered expenses include grants, subsidies and benefits. In many cases, administered expenses fund the delivery of third party outputs.
Additional estimates Where amounts appropriated at budget time are insufficient, Parliament may appropriate more funds to portfolios through the Additional Estimates Appropriation Acts.
Appropriation An authorisation by Parliament to spend moneys from the Consolidated Revenue Fund for a particular purpose.
Annual Appropriation Two Appropriation Bills are introduced into Parliament in May and comprise the budget for the financial year beginning 1 July. Further Bills are introduced later in the financial year as part of the additional estimates. Parliamentary departments have their own appropriations.
Capital expenditure Expenditure by an agency on capital projects, for example purchasing a building.
Consolidated Revenue Fund Section 81 of the Commonwealth of Australia Constitution Act 1900 stipulates that all revenue raised or money received by the Commonwealth forms the one Consolidated Revenue Fund (CRF). The CRF is not a bank account. The Official Public Account reflects most of the operations of the CRF.

Portfolio Glossary
122
Departmental items Assets, liabilities, income and expenses that are controlled by the agency in providing its outputs. Departmental items would generally include computers, plant and equipment assets used by agencies in providing goods and services and most employee expenses, supplier costs and other administrative expenses incurred.
Depreciation Apportionment of an asset’s capital value as an expense over its estimated useful life to take account of normal usage, obsolescence, or the passage of time.
Effectiveness indicators Measures the joint or independent contribution of outputs and administered items to the achievement of their specified outcome.
Efficiency indicators Measures the adequacy of an agency’s management of its outputs (and where applicable, administered items). Includes price, quality and quantity indicators. The interrelationship between the three efficiency indicators of any one output should be considered when judging efficiency.
Equity or net assets Residual interest in the assets of an entity after deduction of its liabilities.
Expense Total value of all of the resources consumed in producing goods and services or the loss of future economic benefits in the form of reductions in assets or increases in liabilities of an entity.
Fair value A valuation methodology whereby the amount for which an asset could be exchanged, or a liability settled, between knowledgeable and willing parties in an arm’s length transaction. The fair value can be affected by the conditions of the sale, market conditions and the intentions of the asset holder.

Portfolio Glossary
123
Operating result Equals income less expense.
Outcomes The Government’s objectives in each portfolio area. Outcomes are desired results, impacts or consequences for the Australian community as influenced by the actions of the Australian Government. Actual outcomes are assessments of the end-results or impacts actually achieved.
Output groups A logical aggregation of agency outputs, where useful, and based either on homogeneity, type of product, business line or beneficiary target group. Aggregation of outputs may also be needed for the provision of adequate information for performance monitoring, or based on a materiality test.
Outputs The goods and services produced by agencies on behalf of government for external organisations or individuals. Outputs also include goods and services for other areas of government external to the agency.
Price One of the three key efficiency indicators. The amount the government or the community pays for the delivery of agreed outputs.
Quality One of the three key efficiency indicators. Relates to the characteristics by which customers or stakeholders judge an organisation, product or service. Assessment of quality involves use of information gathered from interested parties to identify differences between user’s expectations and experiences.
Quantity One of the three key efficiency indicators. Examples include: the size of an output; count or volume measures; how many or how much.
Revenue Total value of resources earned or received to cover the production of goods and services.

Portfolio Glossary
124
Special account Balances existing within the Consolidated Revenue Fund (CRF) that are supported by standing appropriations (Financial Management and Accountability Act 1997 (FMA Act), subsection 20 and 21). Special accounts allow money in the CRF to be acknowledged as set-aside (hypothecated) for a particular purpose. Amounts credited to a special account may only be spent for the purposes of the special account. Special accounts can only be established by a written determination of the Minister for Finance and Deregulation (section 20 FMA Act) or through an Act of Parliament (referred to in section 21 of the FMA Act).
Special Appropriations (including Standing Appropriations)
An amount of money appropriated by a particular Act of Parliament for a specific purpose and number of years. For special appropriations the authority to withdraw funds from the Consolidated Revenue Fund does not generally cease at the end of the financial year.
Standing appropriations are a sub-category consisting of ongoing special appropriations — the amount appropriated will depend on circumstances specified in the legislation.