portfolio additional estimates statements 2008-2009 · the paes facilitate understanding of the...
TRANSCRIPT
PORTFOLIO ADDITIONAL ESTIMATES STATEMENTS 2008-09 HUMAN SERVICES PORTFOLIO EXPLANATIONS OF ADDITIONAL ESTIMATES 2008-09

© Commonwealth of Australia 2008
ISBN 978 1742 213989
This work is copyright. Apart from any use as permitted under the Copyright Act 1968, no part may be reproduced by any process without prior written permission from the Commonwealth. Requests and inquiries concerning reproduction and rights should be addressed to the:
Commonwealth Copyright Administration Attorney-General’s Department Robert Garran Offices National Circuit BARTON ACT 2600
Or posted at Website: www.ag.gov.au/cca
CanPrint Communications Pty Ltd
MINISTER PARLIAMENT HOUSE
CANBERRA 2600
President of the Senate Australian Senate Parliament House CANBERRA ACT 2600
Speaker House of Representatives Parliament House CANBERRA ACT 2600
Dear Mr President Dear Mr Speaker
I hereby submit Portfolio Additional Estimates Statements in support of the 2008-09 Additional Estimates for the XXXX Portfolio.
These statements have been developed, and are submitted to the Parliament, as a statement on the funding requirements being sought for the Portfolio.
I present these statements by virtue of my ministerial responsibility for accountability to the Parliament and, through it, the public.
Yours sincerely
Minister

Abbreviations and conventions (a) The following notations may be used:
NEC/nec not elsewhere classified AEST Australian Eastern Standard Time - nil .. not zero, but rounded to zero na not applicable (unless otherwise specified) nfp not for publication $m $ million
(b) Figures in tables and in the text may be rounded. Discrepancies in tables between totals and sums of components are due to rounding.
ENQUIRIES Should you have any enquiries regarding this publication please contact Mr. Chris Dainer, Chief Financial Officer in the Department of Human Services on (02) 6223 4433.
A copy of this document can be located on the Australian Government Budget website at: http://www.budget.gov.au.
iv
USER GUIDE The purpose of the Portfolio Additional Estimates Statements (PAES), like that of the Portfolio Budget Statements, is to inform Senators and Members of Parliament and the public of the proposed allocation of resources to Government outcomes by agencies within the portfolio. However, unlike the Portfolio Budget Statements, the PAES summarise only the changes in resourcing by outcome since the Budget, that is, they update the resourcing for the agency. The PAES include for the first time an Agency Resource Statement, in addition to the information on new measures and the Appropriation Bills.
The PAES facilitate understanding of the proposed appropriations in Appropriation Bills (No. 3 and No. 4) 2008-09. In this sense the PAES is declared by the Additional Estimates Appropriation Bills to be a ‘relevant document’ to the interpretation of the Bills according to section 15AB of the Acts Interpretation Act 1901.
Whereas the Mid-Year Economic and Fiscal Outlook 2008-09 is a mid-year budget report which provides updated information to allow the assessment of the Government’s fiscal performance against its fiscal strategy, the PAES update the most recent budget appropriations for agencies within the portfolio.
v

STRUCTURE OF THE PORTFOLIO ADDITIONAL ESTIMATES STATEMENTS The PAES are presented in three parts with subsections.
User guide
Provides an introduction explaining the purpose of the PAES.
Portfolio overview
Provides an overview of the portfolio, including a chart that outlines the outcomes for agencies in the portfolio.
Agency additional estimates statements
A statement (under the name of the agency) for each agency affected by Additional Estimates.
Section 1: Agency overview and resources
This section details the total resources available to an agency, the impact of any measures since Budget, and impact on Appropriation Bills No. 3 and No. 4.
Section 2: Revisions to outcomes and planned performance
This section details changes to Government outcomes and/or changes to the planned performance of agency output groups.
Section 3: Explanatory tables and budgeted financial statements
This section contains updated explanatory tables on special account flows and staffing levels and revisions to the budgeted financial statements.
Glossary Explains key terms relevant to the Portfolio.
vi

CONTENTS
Human Services Portfolio Overview ...........................................................................3
Department of Human Services...................................................................................9 Centrelink................................................................................................................51 Medicare Australia ..................................................................................................77
Glossary .......................................................................................................................98
vii


PORTFOLIO OVERVIEW


HUMAN SERVICES PORTFOLIO OVERVIEW
MINISTER(S) AND PORTFOLIO RESPONSIBILITIES The Department of Human Services was created on 26 October 2004, as part of the Finance Portfolio, to improve the development and delivery of Government social and health related services to the Australian people.
As a result of the Administrative Arrangements Orders (AAOs) issued on 30 January 2007, the Department of Human Services and its agencies were transferred to a newly created Human Services Portfolio.
The Department of Human Services is the central policy and coordination department of the Portfolio. The Department works with other departments and agencies to develop policy on service delivery, as clarified by the AAOs issued on 25 January 2008, and to ensure the effective, innovative, and efficient implementation of Government service delivery policy. The Department works to ensure early consideration of service delivery issues in the policy development process to improve the quality and cost effectiveness of service delivery by agencies in the Human Services Portfolio.
HUMAN SERVICES AGENCIES
AGENCIES WITHIN HUMAN SERVICES PORTFOLIO The Human Services Portfolio comprises the following General Government Sector entities and Non-Government Sector Entities:
General Government Sector Entities
• The Department of Human Services consists of the Core Department, the Child Support Program and CRS Australia. The Core Department is small and strategic. The role of the department is to direct, coordinate and broker improvements to service delivery and provide policy advice on service delivery matters to government. The Child Support Program ensures that children of separated parents receive financial support from both parents. CRS Australia assists people with an injury or a disability to get a job or return to work by providing individualised vocational rehabilitation, and helping employers to keep their workplaces safe.
• Centrelink delivers a range of government payments and services for retirees, families, carers, parents, people with disabilities, indigenous people, and people from diverse cultural and linguistic backgrounds and provides services at times of major change.
3
Portfolio overview
• Medicare Australia looks after the health of Australians through efficient services and payments such as Medicare, the Pharmaceutical Benefits Scheme, the Australian Childhood Immunisation Register and the Australian Organ Donor Register.
Non-Government Sector Entities (Public Non-Financial Corporations)
• Australian Hearing is one of the largest hearing service providers in the world and is dedicated to helping people manage their hearing impairment so they have a better quality of life. Australian Hearing provides a full range of hearing services for children and young people up to the age of 21, eligible adults and aged pensioners, and most war veterans.
• Health Services Australia is a government business enterprise established in 1997 focusing primarily on occupational health and safety and medical assessments.
As required under Section 12 of the Charter of Budget Honesty Act 1998, non-general government sector entities are not consolidated into the Commonwealth general government sector fiscal estimates. These entities are not reported in the Portfolio Budget Statements.
More comprehensive information on activities undertaken within the Department of Human Services and its agencies is available on the following web site.
http://www.humanservices.gov.au
4

Portfolio overview
Figure 1: Human Services portfolio structure and outcomes
* These agencies are non-general government sector entities and are not consolidated into the Commonwealth general government sector fiscal estimates. Therefore they are not reported in the Portfolio Budget Statements or Portfolio Additional Estimates Statements.
Portfolio Minister for Human ServicesSenator the Hon Joe Ludwig
Department of Human Services(including the Child Support Program and CRS Australia)
Portfolio Secretary: Ms Helen Williams AO
Outcome 1 Effective and efficient delivery of social and health related services, including financial assistance
to the Australian community.
CentrelinkChief Executive Officer:
Mr Finn Pratt, PSM
Outcome 1 Access to Government services that effectively support: self sufficiency through participation in
employment, education, training and the community; families and people in need; and integrity of
Government outlays in these areas.
Medicare AustraliaChief Executive Officer: A/g Ms Philippa Godwin
Outcome 1 Improving Australia's health through payments
and information.
Australian Hearing*Managing Director: Mr Steven Grundy
Health Services Australia*Managing Director: Mr Stan Macionis
5

AGENCY ADDITIONAL ESTIMATES STATEMENTS
Department of Human Services...................................................................................9
Centrelink.....................................................................................................................51
Medicare Australia ......................................................................................................77
7


DEPARTMENT OF HUMAN SERVICES
Section 1: Agency overview and resources............................................................11 1.1 Strategic direction .........................................................................................11 1.2 Agency resource statement ..........................................................................12 1.3 Agency measures table ................................................................................14 1.4 Additional estimates and variations ..............................................................15 1.5 Breakdown of additional estimates by appropriation bill...............................17
Section 2: Revisions to agency outcomes and planned performance.................19 2.1 Outcomes and performance information ......................................................19
Section 3: Explanatory tables and budgeted financial statements ......................21 3.1 Explanatory tables ........................................................................................21 3.2 Budgeted financial statements......................................................................22
Budgeted financial statements – Core Department......................................33 Budgeted financial statements – Child Support Program.............................40 Budgeted financial statements – CRS Australia...........................................47
9


Agency Additional Estimates Statements — DHS
DEPARTMENT OF HUMAN SERVICES
Section 1: Agency overview and resources
1.1 STRATEGIC DIRECTION
The Department of Human Services was created on 26 October 2004 to achieve improved governance, clearer accountability and better performance in government service delivery.
It is committed to achieving best value for money in service delivery while emphasising innovation and continuous improvement, and to working across service delivery agencies and government as a whole to achieve these objectives.
The Core Department works in partnership with the Child Support Program and CRS Australia (both of which are part of the Department) and with the other four agencies that form the Human Services Portfolio; Australian Hearing, Centrelink, Health Services Australia Group and Medicare Australia.
The Department of Human Services’ key strategies are set out below:
• Consider community requirements when reviewing services offered by service delivery agencies, to promote simplicity and innovation.
• Work in partnership with human services agencies and external stakeholders to strengthen community confidence in service delivery.
• Partner with other government agencies to develop and influence policy and devise appropriate service delivery mechanisms.
• Work to ensure that Australians are able to access government services in an efficient, effective and contemporary way.
• Balance individuals’ preference for service delivery with the risks to taxpayer funds caused by fraud and incorrect payment.
• Work with the service delivery agencies to deliver value for money in service provision, and sound and sustainable financial and governance arrangements.
11

Agency Additional Estimates Statements — DHS
1.2 AGENCY RESOURCE STATEMENT
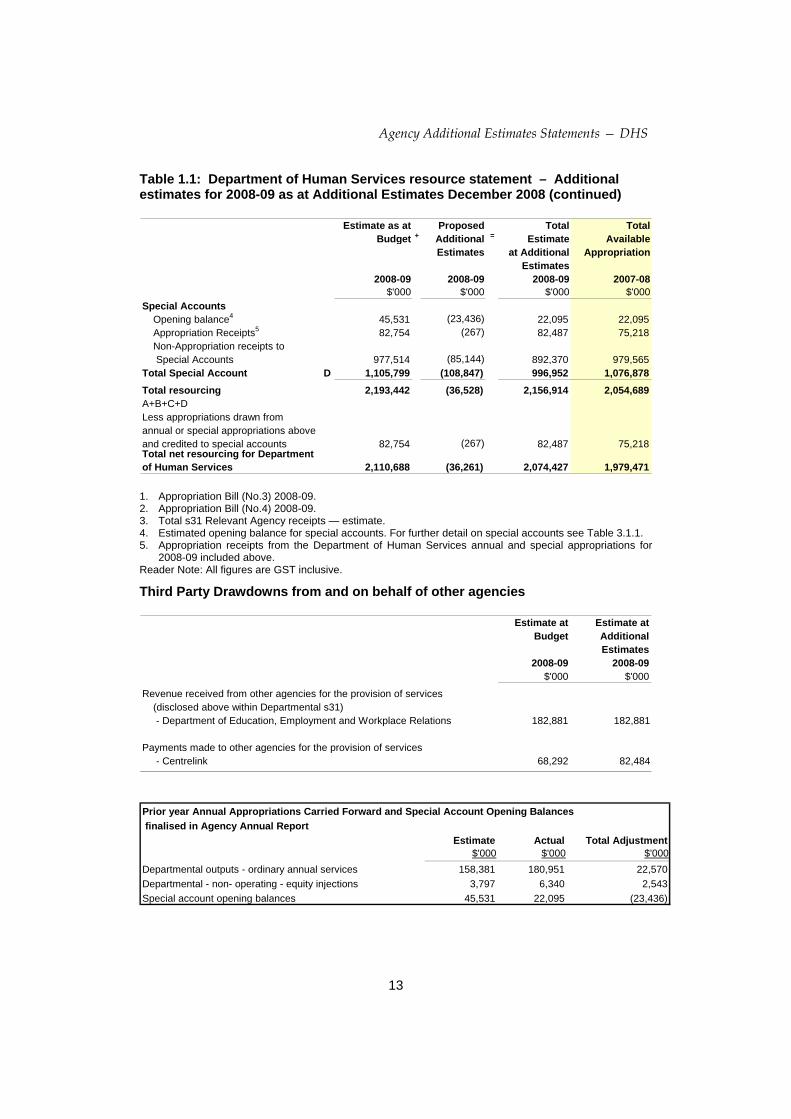
The Agency Resource Statement details the resourcing for Department of Human Services at Additional Estimates. Table 1.1 outlines the total resourcing available from all sources for the 2008-09 Budget year, including variations through Appropriation Bills No.3 and No.4, special appropriations and special accounts.
Table 1.1: Department of Human Services resource statement – Additional estimates for 2008-09 as at Additional Estimates December 2008
Estimate as at Proposed Total TotalBudget + Additional = Estimate Available
Estimates at Additional AppropriationEstimates
2008-09 2008-09 2008-09 2007-08$'000 $'000 $'000 $'000
Ordinary Annual ServicesDepartmental outputs
Departmental outputs 655,041 22,368 1 677,409 528,164s31 Relevant agency receipts3 211,621 5,889 217,510 208,023Total 866,662 28,257 894,919 736,187
Administered expensesJob Capacity 130,052 39,000 1 169,052 147,118Child Support AnnualAppropriation 3,690 (12) 1 3,678 3,531Total 133,742 38,988 172,730 150,649
Total ordinary annual services A 1,000,404 67,245 1,067,649 886,836
Departmental non-operatingEquity injections 8,175 - 8,175 9,877Previous years' outputs - 5,329 2 5,329 5,429Total 8,175 5,329 13,504 15,306
Total other services B 8,175 5,329 13,504 15,306Total Available Annual
Appropriations 1,008,579 72,574 1,081,153 902,142Special AppropriationsSpecial Appropriations limited
by criteria/entitlementChild Support (Registration andCollection) Act 1988 Child Support s77 - Short falls in CSA Trust 79,014 (255) 78,759 75,619 Child Support s78 - Unexplained Remittances 50 - 50 50
Total Special Appropriations C 79,064 (255) 78,809 75,669Total Appropriations excluding
Special Accounts 1,087,643 72,319 1,159,962 977,811
12
Agency Additional Estimates Statements — DHS
Table 1.1: Department of Human Services resource statement – Additional estimates for 2008-09 as at Additional Estimates December 2008 (continued)
Estimate as at Proposed Total TotalBudget + Additional = Estimate Available
Estimates at Additional AppropriationEstimates
2008-09 2008-09 2008-09 2007-08$'000 $'000 $'000 $'000
Special AccountsOpening balance4 45,531 (23,436) 22,095 22,095Appropriation Receipts5 82,754 (267) 82,487 75,218Non-Appropriation receipts to Special Accounts 977,514 (85,144) 892,370 979,565
Total Special Account D 1,105,799 (108,847) 996,952 1,076,878Total resourcing 2,193,442 (36,528) 2,156,914 2,054,689A+B+C+DLess appropriations drawn fromannual or special appropriations aboveand credited to special accounts 82,754 (267) 82,487 75,218Total net resourcing for Department of Human Services 2,110,688 (36,261) 2,074,427 1,979,471 1. Appropriation Bill (No.3) 2008-09. 2. Appropriation Bill (No.4) 2008-09. 3. Total s31 Relevant Agency receipts — estimate. 4. Estimated opening balance for special accounts. For further detail on special accounts see Table 3.1.1. 5. Appropriation receipts from the Department of Human Services annual and special appropriations for
2008-09 included above. Reader Note: All figures are GST inclusive.
Third Party Drawdowns from and on behalf of other agencies
Estimate at Estimate atBudget Additional
Estimates2008-09 2008-09
$'000 $'000
Revenue received from other agencies for the provision of services(disclosed above within Departmental s31) - Department of Education, Employment and Workplace Relations 182,881 182,881
Payments made to other agencies for the provision of services - Centrelink 68,292 82,484
Prior year Annual Appropriations Carried Forward and Special Account Opening Balances finalised in Agency Annual Report
Estimate Actual Total Adjustment$'000 $'000 $'000
Departmental outputs - ordinary annual services 158,381 180,951 22,570Departmental - non- operating - equity injections 3,797 6,340 2,543Special account opening balances 45,531 22,095 (23,436)
13

Agency Additional Estimates Statements — DHS
1.3 AGENCY MEASURES TABLE
Table 1.2 summarises new Government measures taken since the 2008-09 Budget. The table is split into revenue, expense and capital measures, with the affected output group identified.
Table 1.2: Agency Measures since Budget Output Group 2008-09 2009-10 2010-11 2011-12
$'000 $'000 $'000 $'000
Expense measures Job Capacity Assessments - additional funding 1.1 39,000 - - - Job Capacity Assessments - increased fees 1.1 - 2,887 2,864 2,841 Job Capacity Assessments - improved administration savings 1.1 - (3,876) (9,397) (9,397)A New Model for Delivery of Disability Employment Services 1.1 - 138 294 294
Administered Expenses 39,000 (851) (6,239) (6,262)
Income Management Extension - Cape York 1.1 154 233 201 60 Payment Delivery - Enhanced Arrangements 1.1 7,030 844 - - Strategic Fraud and Compliance 1.1 310 667 674 681 Implementation of Operation Sunlight 1.1 183 - - - Commonwealth Spatial Data Integration 1.1 658 1,510 - - Job Capacity Assessments - improved administration 1.1 235 1,049 442 372 A New Model for Delivery of Disability Employment Services 1.1 - 554 115 116 Child Support - Amendment of the Family Law Act 1975 1.2 1,077 275 - - Income Reconciliation Program 1.2 8,044 - - -
Departmental outputs 17,691 5,132 1,432 1,229
Total 56,691 4,281 (4,807) (5,033) Total expense measures Administered 39,000 (851) (6,239) (6,262)
Departmental 17,691 5,132 1,432 1,229 Total 56,691 4,281 (4,807) (5,033)
Prepared on a Government Financial Statistics (fiscal) basis
14

Agency Additional Estimates Statements — DHS
1.4 ADDITIONAL ESTIMATES AND VARIATIONS
The following tables detail the changes to the resourcing for Department of Human Services at Additional Estimates, by outcome. Table 1.3 details the Additional Estimates and variations resulting from new measures since the 2008-09 Budget in Appropriation Bills No.3 and No.4. Table 1.4 details Additional Estimates or variations through other factors, such as parameter adjustments.
Table 1.3: Additional estimates and variations to outcomes from measures since 2008-09 Budget
Output Group 2008-09 2009-10 2010-11 2011-12Impacted ($'000) ($'000) ($'000) ($'000)
Outcome 1Increase in estimates (administered)Job Capacity Assessments - additional funding 1.1 39,000 - - - Job Capacity Assessments - increased fees 1.1 - 2,887 2,864 2,841 Job Capacity Assessments - improved administration savings 1.1 - (3,876) (9,397) (9,397)
A New Model for Delivery of Disability Employment Services 1.1 - 138 294 294
Net impact on estimates for Outcome 1 (administered) 39,000 (851) (6,239) (6,262)
Increase in estimates (departmental)Income Management Extension - Cape York 1.1 154 233 201 60 Strategic Fraud and Compliance 1.1 310 667 674 681 Payment Delivery - Enhanced Arrangements 1.1 7,030 844 - - Implementation of Operation Sunlight 1.1 183 - - - Commonwealth Spatial Data Integration 1.1 658 1,510 - - Job Capacity Assessments - improved administration 1.1 235 1,079 529 458
A New Model for Delivery of Disability Employment Services 1.1 - 554 115 116
Child Support - Amendment of the Family Law Act 1975 1.2 1,077 275 - - Income Reconciliation Program 1.2 8,044 - - -
Net impact on estimates for Outcome 1 (departmental) 17,691 5,162 1,519 1,315
15

Agency Additional Estimates Statements — DHS
Table 1.4: Additional estimates and variations to outcomes from other variations Output Group 2008-09 2009-10 2010-11 2011-12
Impacted ($'000) ($'000) ($'000) ($'000)Outcome 1Decrease in estimates (administered)
Child Support - annual appropriation 1.2 (12) (12) (13) (13)Child Support - special appropriations 1.2 (255) (267) (278) (284)
Net impact on estimates for Outcome 1 (administered) (267) (279) (291) (297)
Increase in estimates (departmental)Parameter adjustments - Core 1.1 - 87 109 125Parameter adjustments - Child Support 1.2 - 2,260 2,722 3,187Child Support Funding Agreement - Caseload adjustments 1.2 4,677 5,824 6,189 5,734
Net impact on estimates for Outcome 1 (departmental) 4,677 8,171 9,020 9,046
16
Agency Additional Estimates Statements — DHS
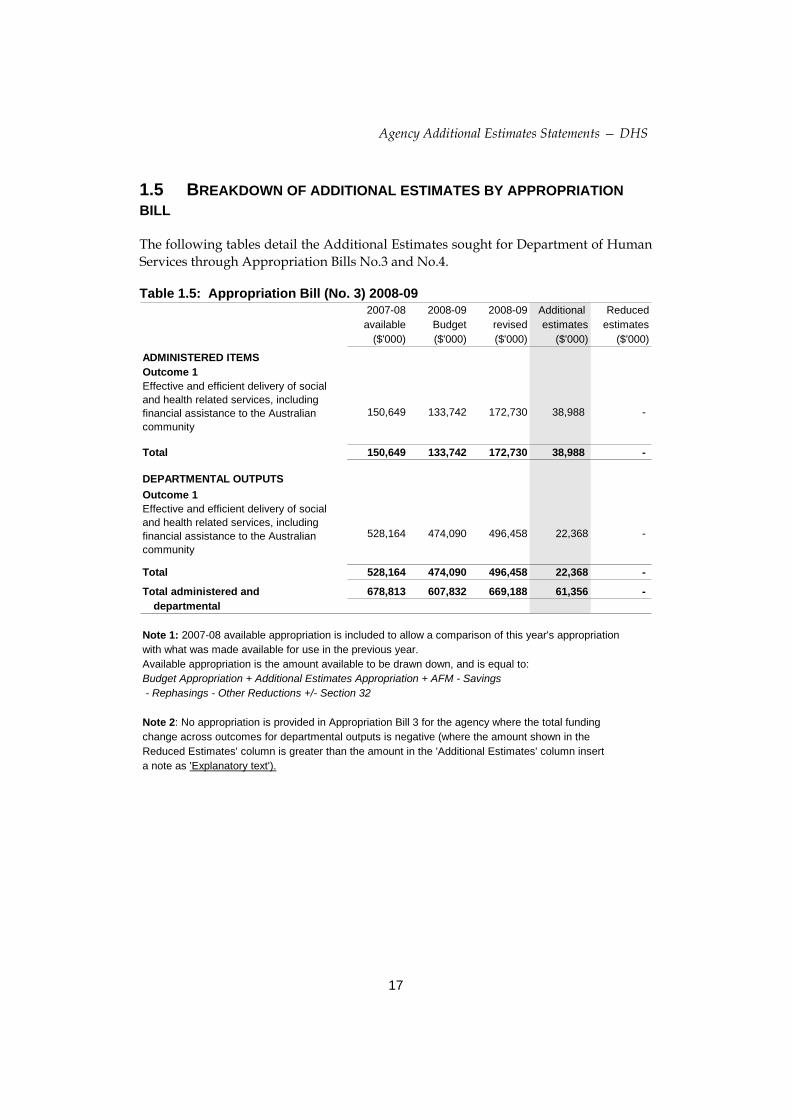
1.5 BREAKDOWN OF ADDITIONAL ESTIMATES BY APPROPRIATION BILL
The following tables detail the Additional Estimates sought for Department of Human Services through Appropriation Bills No.3 and No.4.
Table 1.5: Appropriation Bill (No. 3) 2008-09 2007-08 2008-09 2008-09 Additional Reduced
available Budget revised estimates estimates($'000) ($'000) ($'000) ($'000) ($'000)
ADMINISTERED ITEMSOutcome 1Effective and efficient delivery of social and health related services, including financial assistance to the Australian community
150,649 133,742 172,730 38,988 -
Total 150,649 133,742 172,730 38,988 -
DEPARTMENTAL OUTPUTSOutcome 1Effective and efficient delivery of social and health related services, including financial assistance to the Australian community
528,164 474,090 496,458 22,368 -
Total 528,164 474,090 496,458 22,368 -
Total administered and 678,813 607,832 669,188 61,356 - departmental
Note 1: 2007-08 available appropriation is included to allow a comparison of this year's appropriationwith what was made available for use in the previous year. Available appropriation is the amount available to be drawn down, and is equal to:Budget Appropriation + Additional Estimates Appropriation + AFM - Savings - Rephasings - Other Reductions +/- Section 32
Note 2: No appropriation is provided in Appropriation Bill 3 for the agency where the total fundingchange across outcomes for departmental outputs is negative (where the amount shown in the Reduced Estimates' column is greater than the amount in the 'Additional Estimates' column inserta note as 'Explanatory text').
17
Agency Additional Estimates Statements — DHS
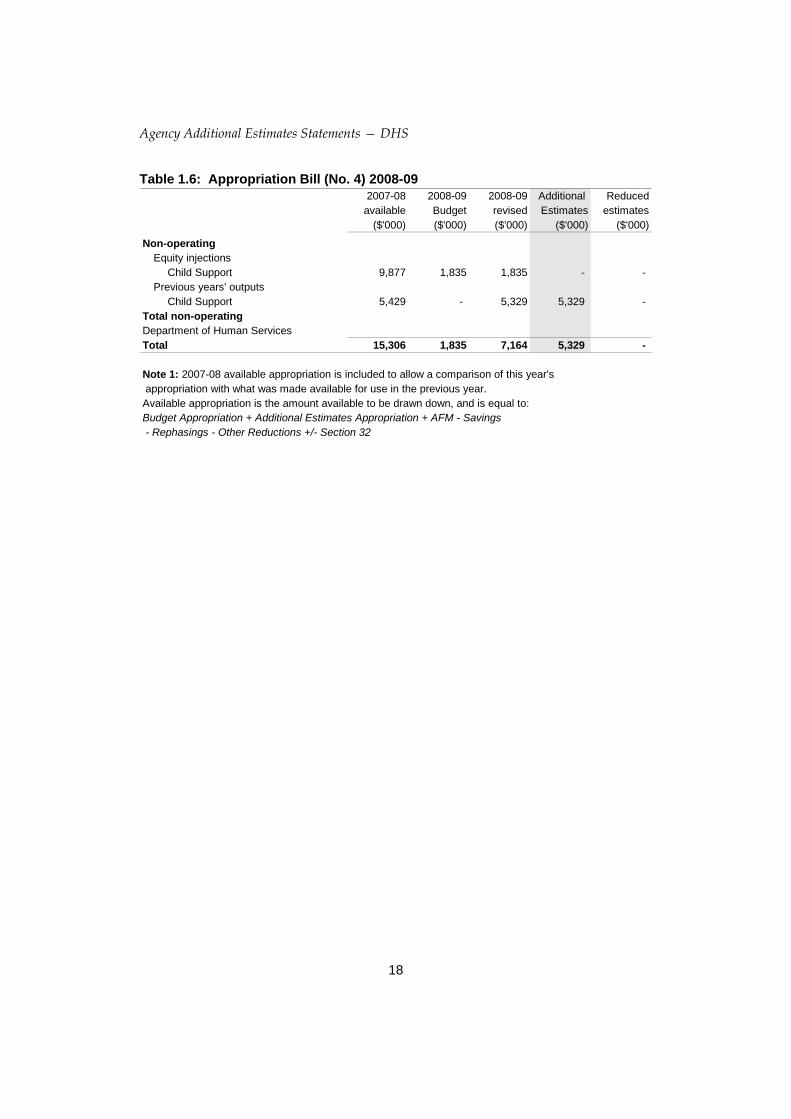
Table 1.6: Appropriation Bill (No. 4) 2008-09 2007-08 2008-09 2008-09 Additional Reduced
available Budget revised Estimates estimates($'000) ($'000) ($'000) ($'000) ($'000)
Non-operatingEquity injections
Child Support 9,877 1,835 1,835 - - Previous years' outputs
Child Support 5,429 - 5,329 5,329 - Total non-operatingDepartment of Human ServicesTotal 15,306 1,835 7,164 5,329 -
Note 1: 2007-08 available appropriation is included to allow a comparison of this year's appropriation with what was made available for use in the previous year. Available appropriation is the amount available to be drawn down, and is equal to:Budget Appropriation + Additional Estimates Appropriation + AFM - Savings - Rephasings - Other Reductions +/- Section 32
18

Agency Additional Estimates Statements — DHS
Section 2: Revisions to agency outcomes and planned performance
2.1 OUTCOMES AND PERFORMANCE INFORMATION
No changes have been made to Department of Human Services’ outcome structure and output group for 2008-09. Complete details of Department of Human Service’s Outcomes and Performance information can be found in the 2008-09 Portfolio Budget Statements. Apart from slight changes to the performance targets of the Child Support Program which are provided in Table 2.1, there is no performance targets change made to the Core Department and CRS Australia.
OUTCOME 1
Table 2.1: Performance information for outputs groups affected by additional estimates — outcome 1
Output 2: Child Support Program The Child Support Program (CSP) supports separated parents to resolve their child support issues by providing assessment, registration, collection and disbursement services taking into account their individual circumstances. CSP also offers assistance to parents to connect to support services when they need assistance with broader issues affecting their lives and their children. The Child Support Scheme is designed to ensure that both parents contribute to the cost of their children, according to their capacity. The scheme is expected to transfer almost $2.8 billion between parents for the benefit of just over 1.1 million children in 2008-09.
Output 2: Child Support Program
Delivery of child support assessment, registration, collection and disbursement services.
Annual Appropriation $454.073 million
Revenues from other sources (s.31) for - Child Support Program Special Accounts $1.940 million.
19

Agency Additional Estimates Statements — DHS
Key Performance Indicators 2008-09 Target
Quality Increased customer satisfaction with CSP's service
(Greater than 5.75) (This is a 7-point scale)
Cost Cost per case
Cost per dollar transferred
(estimate: $545)
(estimate: 16 cents)
Effectiveness (Adequacy)
Total amount transferred between parents
(estimate: $ 2.8 billion)
Effectiveness (independence)
Child support CSP collect collection rate.
Percentage of Private collect cases to total active cases (CSP and Private collect cases)
(estimate: 91.5 per cent)
(estimate 52.0 percent)
Price The price of CSP's outputs in 2008-09 $456.013 million
20

Agency Additional Estimates Statements — DHS
Section 3: Explanatory tables and budgeted financial statements
3.1 EXPLANATORY TABLES 3.1.1 Estimates of special account flows
Special accounts provide a means to set aside and record amounts used for specified purposes. Table 3.1.1 shows the expected additions (receipts) and reductions (payments) for each account used by Department of Human Services. The corresponding table in the 2008-09 PB Statements is Table 3.1.3.
Table 3.1.1: Estimates of special account flows Opening Closingbalance Receipts Payments Adjustments balance2008-09 2008-09 2008-09 2008-09 2008-092007-08 2007-08 2007-08 2007-08 2007-08
Outcome $'000 $'000 $'000 $'000 $'000Child Support Trust - Child 22,095 974,857 972,761 2,096 24,191 Support Act 1988 (A) 1 40,282 1,054,783 1,072,970 (18,187) 22,095
Other Trust Monies (D) 1 - - - - - 46 - 46 (46) -
Total special accounts 2008-09 Budget estimate 22,095 974,857 972,761 2,096 24,191
Total special accounts2007-08 actual 40,328 1,054,783 1,073,016 (18,233) 22,095
(A) = Administered(D) = Departmental
3.1.2 Estimates of variations to Average Staffing Level
Changes in Average Staff Level (ASL) are presented in the Portfolio Additional Estimates Statements at the whole of agency level to demonstrate any movements since Budget. The ASL figures for Budget were reported in agency PB Statements in each Outcome Resourcing Table.
Table 3.1.2: Average Staffing Level (ASL)
2008-09 2008-09Budget Revised Variation
Outcome 1Core Department 145 160 15 Child Support Program 3,520 3,675 155 CRS Australia 1,748 1,748 - Total 5,413 5,583 170
21
Agency Additional Estimates Statements — DHS
3.2 BUDGETED FINANCIAL STATEMENTS 3.2.1 Analysis of budgeted financial statements – Departmental
Budgeted departmental income statement (see Table 3.2.1) The Department is budgeting for an operating surplus of $1.9 million in 2008-09, consistent with the operating result as budgeted for at the 2008-09 Budget.
The key revenue movements from the 2008-09 Budget are increases in appropriation revenue of $22.4 million, including additional funding of $17.7 million for the Department for new measures that were agreed since the Budget and an additional $4.7 million funding for the Child Support Program for caseload adjustments.
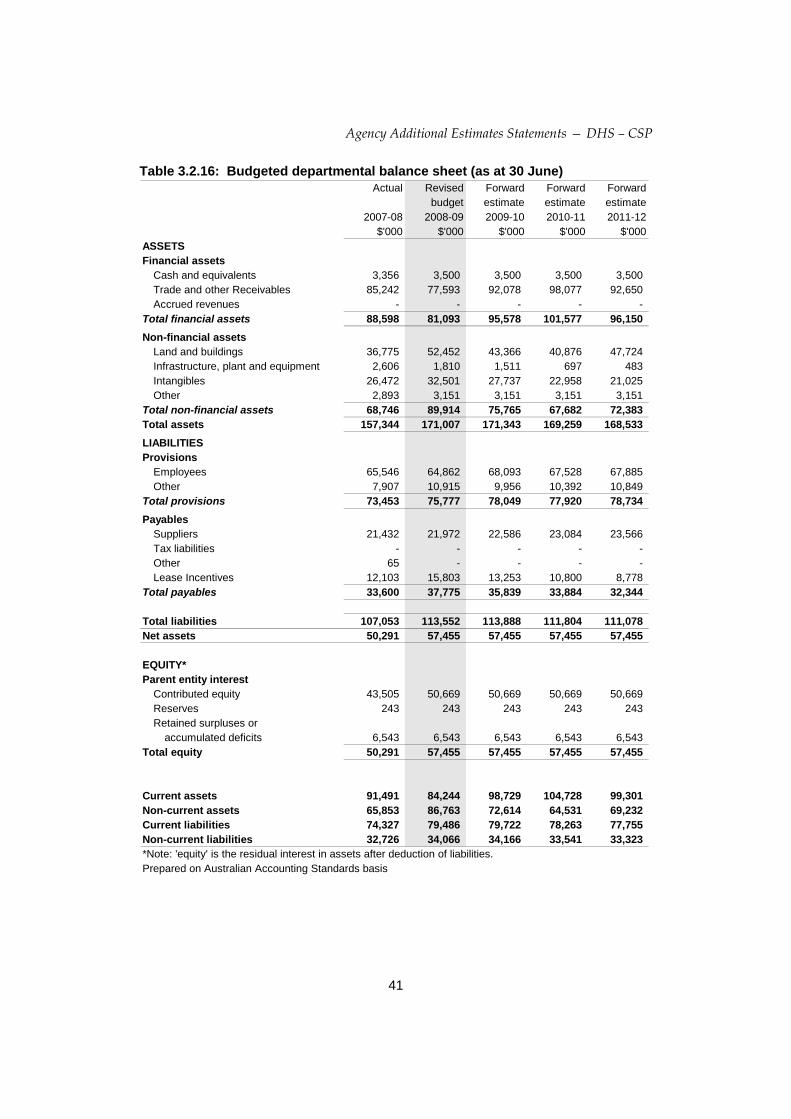
Budgeted departmental balance sheet (see Table 3.2.2) The Department’s estimated net asset position as at 30 June 2008 has increased by $16.4 million at Budget to $145.4 million. Overall, variations across the balance sheet categories are mainly due to the flow on effect of actual results for 2007-08 impacting the budgeted balance sheet.
Financial assets have increased by $22.5 million to $206.1 million from the 2008-09 Budget. The main increases were in receivables ($26.3m).
Lease incentives liabilities have increased by $5.6 million since the Budget, reflecting mainly increases in new leases incentives for Child Support Program.
3.2.1 Analysis of budgeted financial statements – Administered
Schedule of budgeted income and expenses administered on behalf of government (see Table 3.2.5) Revenues administered on behalf of the government have increased by $19.8 million to $1,199.7 million since the 2008-09 Budget. The increase is predominantly due to the revision in Child Support Program revenue based on forecasted caseload.
Expenses have increased by a total of $58.0 million since the Budget. This increase is predominantly due to estimated increase in Job Capacity Assessments expenses, and changes in Child Support Program activity.
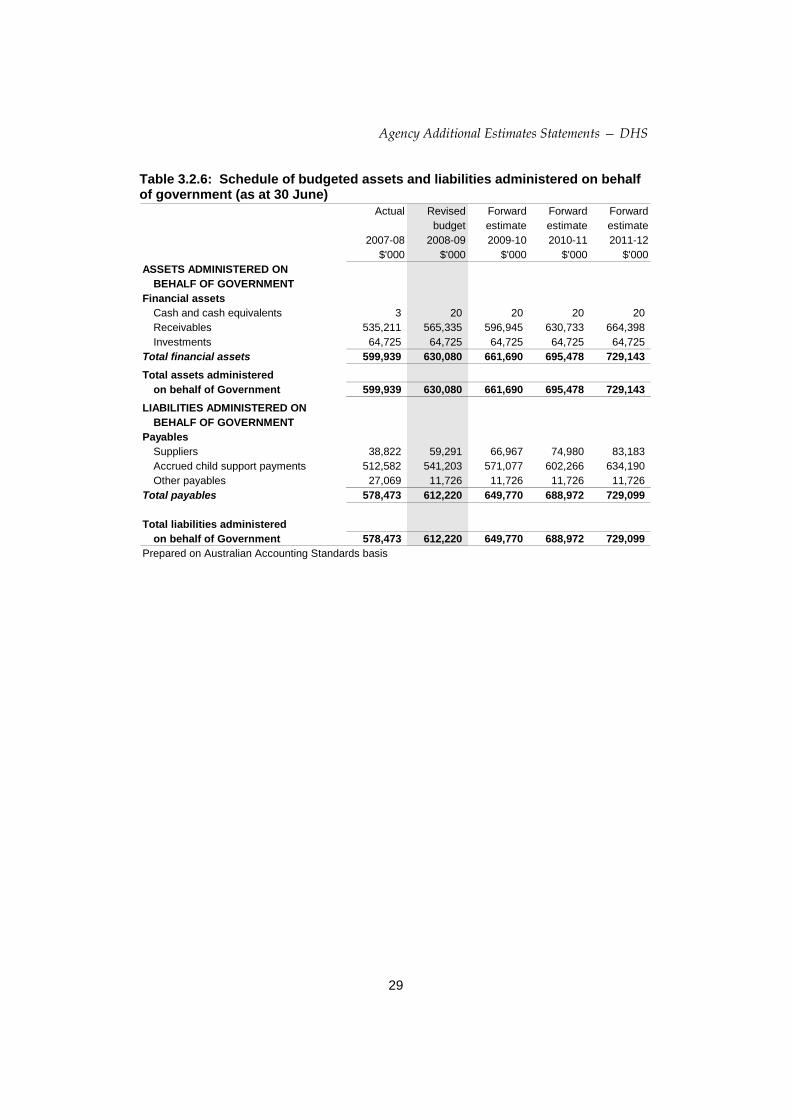
Schedule of budgeted assets and liabilities administered on behalf of government (see Table 3.2.6) The significant movements on the assets and liabilities administered on behalf of government are mostly due to the revision of CSP’s budget estimates due to revisions to forecasted caseload and flow on effect from 2007-08 actual results.
22

Agency Additional Estimates Statements — DHS
BUDGETED FINANCIAL STATEMENTS - CONSOLIDATED
Departmental financial statements
Budgeted departmental income statement (see Table 3.2.1) The statement represents the expected financial results for the Department of Human Services by identifying total revenue and expenses.
Budgeted departmental balance sheet (see Table 3.2.2) The statement represents the financial position of the Department of Human Services.
Budgeted departmental statement of cash flows (see Table 3.2.3) The statement represents the nature and extent of expected cash flows for the Department of Human Services resulting from operating, investing and financing activities.
Departmental statement of changes in equity — summary of movement (see Table 3.2.4) The statement represents movements in accumulated results, capital contributions and reserves during the budget year for the Department of Human Services.
Schedule of administered activity
Schedule of budgeted income and expenses administered on behalf of government (see Table 3.2.5) The statement represents the expected financial results for the Department of Human Services by identifying total administered revenue and expenses.
Schedule of budgeted assets and liabilities administered on behalf of government (see Table 3.2.6) The statement represents the financial position of assets and liabilities administered by the Department of Human Services on behalf of the Government.
Schedule of budgeted administered cash flows (see Table 3.2.7) The statement represents the nature and extent of expected cash flows for the Department of Human Services resulting from administered operating, investing and financing activities.
23

Agency Additional Estimates Statements — DHS
3.2.2 Budgeted financial statements
Departmental financial statements
Table 3.2.1: Budgeted departmental income statement (for the period ended 30 June)
Actual Revised Forward Forward Forwardbudget estimate estimate estimate
2007-08 2008-09 2009-10 2010-11 2011-12$'000 $'000 $'000 $'000 $'000
INCOMERevenue
Revenues from Government 528,425 496,458 442,285 449,884 456,750 Goods and services 184,331 211,421 203,686 199,284 198,150 Revenue from sale of assets 58 - - - - Other 1,733 500 500 500 500
Total revenue 714,547 708,379 646,471 649,668 655,400
Total income 714,547 708,379 646,471 649,668 655,400 EXPENSE
Employees 430,334 420,084 379,700 384,654 385,433 Suppliers 242,691 255,955 233,377 235,103 240,922 Depreciation and amortisation 23,991 28,715 30,351 26,273 25,392 Finance costs (21) 237 382 330 346 Write-down of assets and - - - - -
impairment of assets 7,275 58 58 58 58 Losses from sale of assets 19 - - - -
Total expenses 704,289 705,049 643,868 646,418 652,151
Surplus (Deficit) before income tax 10,258 3,330 2,603 3,250 3,249 Income tax expense 230 1,389 1,389 1,389 1,389
Surplus (deficit) attributable to the Australian Government 10,028 1,941 1,214 1,861 1,860
Prepared on Australian Accounting Standards basis
24

Agency Additional Estimates Statements — DHS
Table 3.2.2: Budgeted departmental balance sheet (as at 30 June) Actual Revised Forward Forward Forward
budget estimate estimate estimate2007-08 2008-09 2009-10 2010-11 2011-12
$'000 $'000 $'000 $'000 $'000ASSETSFinancial assets
Cash and equivalents 12,172 12,219 8,679 8,620 10,227 Trade and other Receivables 198,595 191,987 207,508 214,446 209,300 Accrued revenues 1,831 1,931 1,931 2,431 2,431
Total financial assets 212,598 206,137 218,118 225,497 221,958 Non-financial assets
Land and buildings 46,176 61,700 52,574 50,101 56,938 Infrastructure, plant and equipment 6,076 5,168 4,932 4,034 3,834 Intangibles 27,681 33,353 28,588 23,809 21,877 Other 4,324 4,583 4,583 4,583 4,583
Total non-financial assets 84,257 104,804 90,677 82,527 87,232 Total assets 296,855 310,941 308,795 308,024 309,190 LIABILITIESProvisions
Employees 100,732 97,908 99,200 99,488 99,875 Other 10,300 13,308 12,349 12,785 13,242
Total provisions 111,032 111,216 111,549 112,273 113,117 Payables
Suppliers 30,176 31,398 30,456 29,553 30,039 Tax liabilities 359 359 359 359 359 Other 5,992 6,127 5,927 5,927 5,927 Lease Incentives 12,697 16,397 13,847 11,394 9,372
Total payables 49,224 54,281 50,589 47,233 45,697
Total liabilities 160,256 165,497 162,138 159,506 158,814 Net assets 136,599 145,444 146,657 148,518 150,376
EQUITY*Parent entity interest
Contributed equity 90,539 97,443 97,443 97,443 97,443 Reserves 2,582 2,582 2,582 2,582 2,582 Retained surpluses or
accumulated deficits 43,478 45,419 46,632 48,493 50,351 Total equity 136,599 145,444 146,657 148,518 150,376
Current assets 216,870 210,720 222,701 230,080 226,541 Non-current assets 79,985 100,221 86,094 77,944 82,649 Current liabilities 119,981 119,797 117,442 115,363 114,883 Non-current liabilities 40,275 45,700 44,696 44,143 43,931
*Note: 'equity' is the residual interest in assets after deduction of liabilities.Prepared on Australian Accounting Standards basis
25

Agency Additional Estimates Statements — DHS
Table 3.2.3: Budgeted departmental statement of cash flows (for the period ended 30 June)
Actual Revised Forward Forward Forwardbudget estimate estimate estimate
2007-08 2008-09 2009-10 2010-11 2011-12$'000 $'000 $'000 $'000 $'000
OPERATING ACTIVITIESCash received
Goods and services 204,988 209,181 201,746 196,844 196,211 Appropriations 490,624 498,886 427,082 443,315 462,458 Net GST received 11,950 48,780 44,135 44,285 45,836 Other cash received 3,035 8,329 2,440 2,440 2,440
Total cash received 710,597 765,176 675,402 686,884 706,945 Cash used
Employees 414,553 423,073 380,560 384,581 385,422 Suppliers 273,006 257,513 237,508 240,197 244,313 Competitive neutrality payments 1,849 1,189 1,189 1,189 1,189 Cash to the Official Public Account - - - - - Net GST paid - 48,780 44,135 44,284 45,834 Other - 111 116 86 -
Total cash used 689,408 730,666 663,508 670,337 676,758 Net cash from or (used by)
operating activities 21,189 34,510 11,894 16,547 30,187 INVESTING ACTIVITIESCash received
Proceeds from sales of property,plant and equipment - - - - -
Total cash received 61 - - - - Cash used
Purchase of property, plant and equipment 30,749 29,406 7,060 11,954 20,479
Purchase of intangibles 15,323 15,757 7,650 4,650 8,100 Cash transferred to the Official
Public Account 11,700 - - - - Other - - 724 - -
Total cash used 57,772 45,163 15,434 16,604 28,579 Net cash from or (used by)
investing activities (57,711) (45,163) (15,434) (16,604) (28,579)
FINANCING ACTIVITIESCash received
Appropriations - contributed equity 35,343 10,701 - - - Total cash received 35,343 10,701 - - - Net cash from or (used by)
financing activities 35,343 10,701 - - -
Net increase or (decrease)in cash held (1,179) 48 (3,540) (57) 1,608 Cash at the beginning of
the reporting period 13,351 12,172 12,219 8,677 8,620 Cash at the end of the
reporting period 12,172 12,219 8,679 8,620 10,227 Prepared on Australian Accounting Standards basis
26

Agency Additional Estimates Statements — DHS
Table 3.2.4: Departmental statement of changes in equity — summary of movement (Budget 2008-09)
Accumulated Asset Other Contributed Totalresults revaluation reserves equity/ equity
reserve capital$'000 $'000 $'000 $'000 $'000
Opening balance as at 1 July 2008Balance carried forward from
previous period 43,478 - 2,582 90,279 136,339 Adjustment for changes in
accounting policies - - - - - Adjusted opening balance 43,478 - 2,582 90,279 136,339
Surplus (deficit) for the period 1,941 - - - 1,941
Total income and expensesrecognised directly in equity 1,941 - - - 1,941
Transactions with ownersContribution by owners
Appropriation (equity injection) - - - 1,835 1,835 Other: Previous Year's Outputs
-Child Support funding agreement - - - 5,329 5,329 Sub-total transactions with owners - - - 7,164 7,164
Estimated closing balanceas at 30 June 2009 45,419 - 2,582 97,443 145,444
Prepared on Australian Accounting Standards basis
27

Agency Additional Estimates Statements — DHS
Schedule of administered activity
Table 3.2.5: Schedule of budgeted income and expenses administered on behalf of government (for the period ended 30 June)
Actual Revised Forward Forward Forwardbudget estimate estimate estimate
2007-08 2008-09 2009-10 2010-11 2011-12$'000 $'000 $'000 $'000 $'000
INCOME ADMINISTERED ONBEHALF OF GOVERNMENT
RevenueTaxation
Other taxes, fees and fines 70,875 77,426 80,866 84,425 86,417 Total taxation 70,875 77,426 80,866 84,425 86,417 Non-taxation
Dividends 15,176 11,425 14,440 18,031 18,031 Competitive neutrality revenue 10,035 4,765 5,381 6,441 6,441 Other sources of non-taxation
revenues 1,059,007 1,106,085 1,155,228 1,206,070 1,234,523 Total non-taxation 1,084,218 1,122,275 1,175,049 1,230,542 1,258,995 Total revenues administered
on behalf of Government 1,155,093 1,199,701 1,255,915 1,314,967 1,345,412
Total income administeredon behalf of Government 1,155,093 1,199,701 1,255,915 1,314,967 1,345,412
EXPENSES ADMINISTERED ONBEHALF OF GOVERNMENTPersonal benefits (5) - - - - Suppliers 147,463 169,052 129,202 123,837 123,837 Write down and impairment of assets 96,595 96,476 101,861 106,344 108,853 Child support Payments 1,031,559 1,079,402 1,127,341 1,176,955 1,204,722
Total expenses administeredon behalf of Government 1,275,612 1,344,930 1,358,404 1,407,136 1,437,412
Prepared on Australian Accounting Standards basis
28
Agency Additional Estimates Statements — DHS
Table 3.2.6: Schedule of budgeted assets and liabilities administered on behalf of government (as at 30 June)
Actual Revised Forward Forward Forwardbudget estimate estimate estimate
2007-08 2008-09 2009-10 2010-11 2011-12$'000 $'000 $'000 $'000 $'000
ASSETS ADMINISTERED ON BEHALF OF GOVERNMENT
Financial assetsCash and cash equivalents 3 20 20 20 20 Receivables 535,211 565,335 596,945 630,733 664,398 Investments 64,725 64,725 64,725 64,725 64,725
Total financial assets 599,939 630,080 661,690 695,478 729,143 Total assets administered
on behalf of Government 599,939 630,080 661,690 695,478 729,143 LIABILITIES ADMINISTERED ON
BEHALF OF GOVERNMENTPayables
Suppliers 38,822 59,291 66,967 74,980 83,183 Accrued child support payments 512,582 541,203 571,077 602,266 634,190 Other payables 27,069 11,726 11,726 11,726 11,726
Total payables 578,473 612,220 649,770 688,972 729,099
Total liabilities administeredon behalf of Government 578,473 612,220 649,770 688,972 729,099
Prepared on Australian Accounting Standards basis
29

Agency Additional Estimates Statements — DHS
Table 3.2.7: Schedule of budgeted administered cash flows (for the period ended 30 June)
Actual Revised Forward Forward Forwardbudget estimate estimate estimate
2007-08 2008-09 2009-10 2010-11 2011-12$'000 $'000 $'000 $'000 $'000
OPERATING ACTIVITIESCash received
Other taxes, fees and fines 5,485 6,194 6,469 6,754 6,913 Cash from the Official Public Account 1,159,183 1,219,834 1,226,668 1,269,603 1,296,634 Dividends 15,773 11,525 13,140 16,231 16,231 Competitive neutrality revenue 10,305 3,514 5,424 6,087 6,087 Net GST received 14,396 16,905 12,906 12,353 12,354 Other 1,017,987 1,058,063 1,102,729 1,151,260 1,178,420
Total cash received 2,223,129 2,316,035 2,367,336 2,462,288 2,516,639 Cash used
Personal benefits 34 - - - - Suppliers 146,330 169,052 129,202 123,837 123,837 Net GST paid 14,595 16,905 12,906 12,353 12,354 Cash to the Official Public Account 1,063,987 1,078,209 1,128,968 1,181,592 1,208,941 Other 998,224 1,051,852 1,096,260 1,144,506 1,171,507
Total cash used 2,223,170 2,316,018 2,367,336 2,462,288 2,516,639 Net cash from or (used by)
operating activities (41) 17 - - -
Net increase or (decrease) in cash held (41) 17 - - - Cash at beginning of reporting period 44 3 20 20 20
Cash at end of reporting period 3 20 20 20 20 Prepared on Australian Accounting Standards basis
30

Agency Additional Estimates Statements — DHS
NOTES TO THE FINANCIAL STATEMENTS Basis of accounting The budgeted financial statements have been prepared on an accruals basis, having regard to Statements of Accounting Concepts, and in accordance with:
• Australian Equivalents to International Financial Reporting Standards (AEIFRS);
• the Finance Minister’s Orders;
• authoritative pronouncements of the Australian Accounting Standards Boards; and
• the Consensus Views of the Urgent Issues Group.
The statements have been prepared on an accrual basis and are in accordance with the historical cost convention, except for certain assets which are at valuation.
Assets and liabilities are recognised in the Balance Sheet when and only when it is probable that future economic benefits will flow and the amounts of the assets or liabilities can be reliably measured.
Revenues and expenses are recognised in the Income Statement when and only when the flow or consumption or loss of economic benefits can be reliably measured.
The continued existence of the Department of Human Services in its present form and functions is dependent on government policy and ongoing business.
Departmental and Administered items The department’s assets, liabilities, revenues and expenses are those items controlled by the department that are used in producing outputs, and include:
• computers, plant and equipment used in providing goods and services;
• liabilities for employee entitlements;
• revenue from appropriations or independent sources in payment for outputs; and
• employee, supplier and depreciation expenses incurred in providing departmental outputs.
Administered items are those items controlled by the government and managed, or oversighted, by the department on behalf of the government.
31

Agency Additional Estimates Statements — DHS
Revenue Appropriations from government are revenues relating to the core operating activities of the department. CRS Australia receives revenue from the provision of services. A small amount of revenue will be from resources received free of charge.
Employee expenses Employee expenses consist of salaries, leave entitlements, fringe benefits tax, redundancy expenses, superannuation and workers compensation insurance.
Suppliers Suppliers expenses consist of property operating costs, information technology and systems development costs, professional development and administrative costs.
Cash Cash includes notes and coins held and any deposits held with a bank or financial institution.
Assets Infrastructure, plant and equipment comprises office fit-out and office equipment. Other assets are prepayments.
Asset valuation Australian Government agencies are required to use the fair value basis to measure property, plant and equipment. Fair value essentially reflects the current market value of an asset.
Liabilities Employee liabilities are provisions for recreation leave, long service leave and accrued salaries.
Suppliers are creditors (usually invoices on hand, but not yet due for payment).
ADDITIONAL DISCLOSURE To provide additional disclosure, separate agency budget information for the Core Department, Child Support Program and CRS Australia is provided as follows:
• Core Department Table 3.2.8 – Table 3.2.14
• CSP Table 3.2.15 – Table 3.2.21
• CRS Australia Table 3.2.22 – Table 3.2.26
32

Agency Additional Estimates Statements — DHS – Core Department
BUDGETED FINANCIAL STATEMENTS – CORE DEPARTMENT
Table 3.2.8: Budgeted departmental income statement (for the period ended 30 June)
Actual Revised Forward Forward Forwardbudget estimate estimate estimate
2007-08 2008-09 2009-10 2010-11 2011-12$'000 $'000 $'000 $'000 $'000
INCOMERevenue
Revenues from Government 62,250 42,385 22,713 20,212 19,838 Goods and services 1,500 - - - - Revenue from sale of assetsOther 417 - - - -
Total revenue 64,167 42,385 22,713 20,212 19,838
Total income 64,167 42,385 22,713 20,212 19,838 EXPENSE
Employees 27,066 21,245 14,682 13,838 13,649 Suppliers 23,957 20,620 7,586 6,054 5,938 Depreciation and amortisation 1,072 520 445 320 251 Finance costs - - - - - Write-down of assets and
impairment of assets 197 - - - - Losses from sale of assets 1 - - - -
Total expenses 52,293 42,385 22,713 20,212 19,838
Surplus (Deficit) before income tax 11,874 - - - - Income tax expense - - - - -
Surplus (deficit) attributable to the Australian Government 11,874 - - - -
Prepared on Australian Accounting Standards basis
33

Agency Additional Estimates Statements — DHS – Core Department
Table 3.2.9: Budgeted departmental balance sheet (as at 30 June) Actual Revised Forward Forward Forward
budget estimate estimate estimate2007-08 2008-09 2009-10 2010-11 2011-12
$'000 $'000 $'000 $'000 $'000ASSETSFinancial assets
Cash and equivalents 1,042 1,101 1,430 658 658 Trade and other Receivables 28,908 29,949 30,983 31,922 32,203 Accrued revenues - - - - -
Total financial assets 29,950 31,050 32,413 32,580 32,861 Non-financial assets
Land and buildings 1,270 879 601 380 130 Infrastructure, plant and equipment 1,714 1,586 1,633 1,534 1,534 Intangibles 259 257 256 256 257 Other 111 112 112 112 112
Total non-financial assets 3,354 2,834 2,602 2,282 2,033 Total assets 33,304 33,884 35,015 34,862 34,894 LIABILITIESProvisions
Employees 7,942 8,518 9,023 9,877 9,907 Other 246 246 246 246 246
Total provisions 8,188 8,764 9,269 10,123 10,153 Payables
Suppliers 3,156 3,420 4,046 3,039 3,043 Tax liabilities - - - - - Other 48 48 48 48 48 Lease Incentives - - - - -
Total payables 3,204 3,468 4,094 3,087 3,091
Total liabilities 11,392 12,232 13,363 13,210 13,244 Net assets 21,912 21,652 21,652 21,652 21,650 EQUITY*Parent entity interest
Contributed equity 3,487 3,227 3,227 3,227 3,227 Reserves - - - - - Retained surpluses or
accumulated deficits 18,425 18,425 18,425 18,425 18,423 Total equity 21,912 21,652 21,652 21,652 21,650
Current assets 30,061 31,162 32,525 32,692 32,973 Non-current assets 3,243 2,722 2,490 2,170 1,921 Current liabilities 10,502 10,528 11,558 11,235 11,263 Non-current liabilities 890 1,704 1,805 1,975 1,981 *Note: 'equity' is the residual interest in assets after deduction of liabilities.Prepared on Australian Accounting Standards basis
34

Agency Additional Estimates Statements — DHS – Core Department
Table 3.2.10: Budgeted departmental statement of cash flows (for the period ended 30 June)
Actual Revised Forward Forward Forwardbudget estimate estimate estimate
2007-08 2008-09 2009-10 2010-11 2011-12$'000 $'000 $'000 $'000 $'000
OPERATING ACTIVITIESCash received
Goods and services 1,775 - - - - Appropriations 55,150 41,350 21,690 19,285 19,735 Net GST received 4,298 1,306 750 591 414 Other cash received - - - - -
Total cash received 61,223 42,656 22,440 19,876 20,149 Cash used
Employees 26,280 20,634 14,188 13,000 13,796 Suppliers 33,654 20,396 6,958 7,057 5,938 Competitive neutrality payments - - - - - Cash to the Official Public Account - - - - - Net GST paid - 1,306 750 591 414 Other - - - - -
Total cash used 59,934 42,336 21,896 20,648 20,148 Net cash from or (used by)
operating activities 1,289 320 544 (772) 1 INVESTING ACTIVITIESCash received
Proceeds from sales of property,plant and equipment 1 - - - -
Total cash received 1 - - - - Cash used
Purchase of property, plant and equipment 2,672 - 215 - -
Purchase of intangibles 217 - - - - Cash transferred to the Official
Public Account - - - - - Other - - - - -
Total cash used 2,889 - 215 - - Net cash from or (used by)
investing activities (2,888) - (215) - -
FINANCING ACTIVITIESCash received
Appropriations - contributed equity 2,450 (260) - - - Total cash received 2,450 (260) - - - Net cash from or (used by)
financing activities 2,450 (260) - - -
Net increase or (decrease)in cash held 851 60 329 (772) 1 Cash at the beginning of
the reporting period 191 1,042 1,101 1,430 658 Cash at the end of the
reporting period 1,042 1,101 1,430 658 658 Prepared on Australian Accounting Standards basis
35

Agency Additional Estimates Statements — DHS – Core Department
Table 3.2.11: Departmental statement of changes in equity — summary of movement (Budget 2008-09)
Accumulated Asset Other Contributed Totalresults revaluation reserves equity/ equity
reserve capital$'000 $'000 $'000 $'000 $'000
Opening balance as at 1 July 2008Balance carried forward from
previous period 18,425 - - 3,227 21,652 Adjustment for changes in
accounting policies - - - - - Adjusted opening balance 18,425 - - 3,227 21,652
Surplus (deficit) for the period - - - - -
Total income and expensesrecognised directly in equity - - - - -
Transactions with ownersContribution by owners
Appropriation (equity injection) - - - - - Other: Previous Year's Outputs
-Child Support funding agreement - - - - - Sub-total transactions with owners - - - - -
Estimated closing balanceas at 30 June 2009 18,425 - - 3,227 21,652
Prepared on Australian Accounting Standards basis
36

Agency Additional Estimates Statements — DHS – Core Department
Table 3.2.12: Schedule of budgeted income and expenses administered on behalf of government (for the period ended 30 June)
Actual Revised Forward Forward Forwardbudget estimate estimate estimate
2007-08 2008-09 2009-10 2010-11 2011-12$'000 $'000 $'000 $'000 $'000
INCOME ADMINISTERED ONBEHALF OF GOVERNMENT
RevenueTaxation
Other taxes, fees and fines - - - - - Total taxation - - - - -
Non-taxationDividends 15,176 11,425 14,440 18,031 18,031 Competitive neutrality revenue 10,035 4,765 5,381 6,441 6,441 Other sources of non-taxation
revenues - - - - - Total non-taxation 25,211 16,190 19,821 24,472 24,472 Total revenues administered
on behalf of Government 25,211 16,190 19,821 24,472 24,472
Total income administeredon behalf of Government 25,211 16,190 19,821 24,472 24,472
EXPENSES ADMINISTERED ONBEHALF OF GOVERNMENTPersonal benefits - - - - - Suppliers 147,463 169,052 129,202 123,837 123,837 Write down and impairment of assets - - - - - Child support Payments - - - - -
Total expenses administeredon behalf of Government 147,463 169,052 129,202 123,837 123,837
Prepared on Australian Accounting Standards basis
37

Agency Additional Estimates Statements — DHS – Core Department
Table 3.2.13: Schedule of budgeted assets and liabilities administered on behalf of government (as at 30 June)
Actual Revised Forward Forward Forwardbudget estimate estimate estimate
2007-08 2008-09 2009-10 2010-11 2011-12$'000 $'000 $'000 $'000 $'000
ASSETS ADMINISTERED ON BEHALF OF GOVERNMENT
Financial assetsCash and cash equivalents - - - - - Receivables 10,756 11,907 12,013 12,910 12,910 Investments 64,725 64,725 64,725 64,725 64,725
Total financial assets 75,481 76,632 76,738 77,635 77,635 Total assets administered
on behalf of Government 75,481 76,632 76,738 77,635 77,635 LIABILITIES ADMINISTERED ON
BEHALF OF GOVERNMENTPayables Suppliers 13,820 13,820 13,820 13,820 13,820
Accrued child support payments - - - - - Other payables - - - - -
Total payables 13,820 13,820 13,820 13,820 13,820
Total liabilities administeredon behalf of Government 13,820 13,820 13,820 13,820 13,820
Prepared on Australian Accounting Standards basis
38

Agency Additional Estimates Statements — DHS – Core Department
Table 3.2.14: Schedule of budgeted administered cash flows (for the period ended 30 June)
Actual Revised Forward Forward Forwardbudget estimate estimate estimate
2007-08 2008-09 2009-10 2010-11 2011-12$'000 $'000 $'000 $'000 $'000
OPERATING ACTIVITIESCash received
Other taxes fees, and fines - - - - - Cash from the Official Public Account 160,924 169,052 129,202 123,837 123,837 Dividends 15,773 11,525 13,140 16,231 16,231 Competitive neutrality revenue 10,305 3,514 5,424 6,087 6,087 Net GST received 14,396 16,905 12,906 12,353 12,354 Other - - - - -
Total cash received 201,398 200,996 160,672 158,508 158,509 Cash used
Personal benefits - - - - - Suppliers 146,330 169,052 129,202 123,837 123,837 Net GST paid 14,595 16,905 12,906 12,353 12,354 Cash to the Official Public Account 40,473 15,039 18,564 22,318 22,318 Other - - - - -
Total cash used 201,398 200,996 160,672 158,508 158,509 Net cash from or (used by)
operating activities - - - - -
Net increase or (decrease) in cash held - - - - - Cash at beginning of reporting period - - - - -
Cash at end of reporting period - - - - - Prepared on Australian Accounting Standards basis
39

Agency Additional Estimates Statements — DHS – CSP
BUDGETED FINANCIAL STATEMENTS – CHILD SUPPORT PROGRAM
Table 3.2.15: Budgeted departmental income statement (for the period ended 30 June)
Actual Revised Forward Forward Forwardbudget estimate estimate estimate
2007-08 2008-09 2009-10 2010-11 2011-12$'000 $'000 $'000 $'000 $'000
INCOMERevenue
Revenues from Government 466,175 454,073 419,572 429,672 436,912 Goods and services 2,090 1,940 1,940 1,940 1,940 Revenue from sale of assetsOther 672 - - - -
Total revenue 468,937 456,013 421,512 431,612 438,852
Total income 468,937 456,013 421,512 431,612 438,852 EXPENSE
Employees 280,782 274,959 244,016 252,451 254,154 Suppliers 166,754 159,522 154,108 159,778 166,111 Depreciation and amortisation 19,868 21,295 23,006 19,053 18,241 Finance costs (49) 237 382 330 346 Write-down of assets and
impairment of assets 6,795 - - - - Losses from sale of assets 18 - - - -
Total expenses 474,168 456,013 421,512 431,612 438,852
Surplus (Deficit) before income tax (5,231) - - - - Income tax expense - - - - -
Surplus (deficit) attributable to the Australian Government (5,231) - - - -
Prepared on Australian Accounting Standards basis
40
Agency Additional Estimates Statements — DHS – CSP
Table 3.2.16: Budgeted departmental balance sheet (as at 30 June) Actual Revised Forward Forward Forward
budget estimate estimate estimate2007-08 2008-09 2009-10 2010-11 2011-12
$'000 $'000 $'000 $'000 $'000ASSETSFinancial assets
Cash and equivalents 3,356 3,500 3,500 3,500 3,500 Trade and other Receivables 85,242 77,593 92,078 98,077 92,650 Accrued revenues - - - - -
Total financial assets 88,598 81,093 95,578 101,577 96,150 Non-financial assets
Land and buildings 36,775 52,452 43,366 40,876 47,724 Infrastructure, plant and equipment 2,606 1,810 1,511 697 483 Intangibles 26,472 32,501 27,737 22,958 21,025 Other 2,893 3,151 3,151 3,151 3,151
Total non-financial assets 68,746 89,914 75,765 67,682 72,383 Total assets 157,344 171,007 171,343 169,259 168,533 LIABILITIESProvisions
Employees 65,546 64,862 68,093 67,528 67,885 Other 7,907 10,915 9,956 10,392 10,849
Total provisions 73,453 75,777 78,049 77,920 78,734 Payables
Suppliers 21,432 21,972 22,586 23,084 23,566 Tax liabilities - - - - - Other 65 - - - - Lease Incentives 12,103 15,803 13,253 10,800 8,778
Total payables 33,600 37,775 35,839 33,884 32,344
Total liabilities 107,053 113,552 113,888 111,804 111,078 Net assets 50,291 57,455 57,455 57,455 57,455
EQUITY*Parent entity interest
Contributed equity 43,505 50,669 50,669 50,669 50,669 Reserves 243 243 243 243 243 Retained surpluses or
accumulated deficits 6,543 6,543 6,543 6,543 6,543 Total equity 50,291 57,455 57,455 57,455 57,455
Current assets 91,491 84,244 98,729 104,728 99,301 Non-current assets 65,853 86,763 72,614 64,531 69,232 Current liabilities 74,327 79,486 79,722 78,263 77,755 Non-current liabilities 32,726 34,066 34,166 33,541 33,323 *Note: 'equity' is the residual interest in assets after deduction of liabilities.Prepared on Australian Accounting Standards basis
41
Agency Additional Estimates Statements — DHS – CSP
Table 3.2.17: Budgeted departmental statement of cash flows (for the period ended 30 June)
Actual Revised Forward Forward Forwardbudget estimate estimate estimate
2007-08 2008-09 2009-10 2010-11 2011-12$'000 $'000 $'000 $'000 $'000
OPERATING ACTIVITIESCash received
Goods and services - - - - - Appropriations 435,474 457,536 405,392 424,030 442,723 Net GST received 19,477 20,052 16,498 17,296 19,088 Other cash received 2,828 7,829 1,940 1,940 1,940
Total cash received 457,779 485,417 423,830 443,266 463,751 Cash used
Employees 269,783 275,644 240,926 253,016 253,796 Suppliers 180,524 160,899 156,706 161,899 167,925 Competitive neutrality payments - - - - - Cash to the Official Public Account - - - - - Net GST paid - 20,052 16,498 17,296 19,086 Other 111 116 86 -
Total cash used 450,307 456,706 414,246 432,297 440,807 Net cash from or (used by)
operating activities 7,472 28,711 9,584 10,969 22,944 INVESTING ACTIVITIESCash received
Proceeds from sales of property,plant and equipment 1 - - - -
Total cash received 1 - - - - Cash used
Purchase of property, plant and equipment 25,619 23,771 1,210 6,319 14,844
Purchase of intangibles 14,835 15,757 7,650 4,650 8,100 Cash transferred to the Official
Public Account - - - - - Other - - 724 - -
Total cash used 40,454 39,528 9,584 10,969 22,944 Net cash from or (used by)
investing activities (40,453) (39,528) (9,584) (10,969) (22,944)
FINANCING ACTIVITIESCash received
Appropriations - contributed equity 32,893 10,961 - - - Total cash received 32,893 10,961 - - - Net cash from or (used by)
financing activities 32,893 10,961 - - -
Net increase or (decrease)in cash held (88) 144 - - - Cash at the beginning of
the reporting period 3,444 3,356 3,500 3,500 3,500 Cash at the end of the
reporting period 3,356 3,500 3,500 3,500 3,500 Prepared on Australian Accounting Standards basis
42
Agency Additional Estimates Statements — DHS – CSP
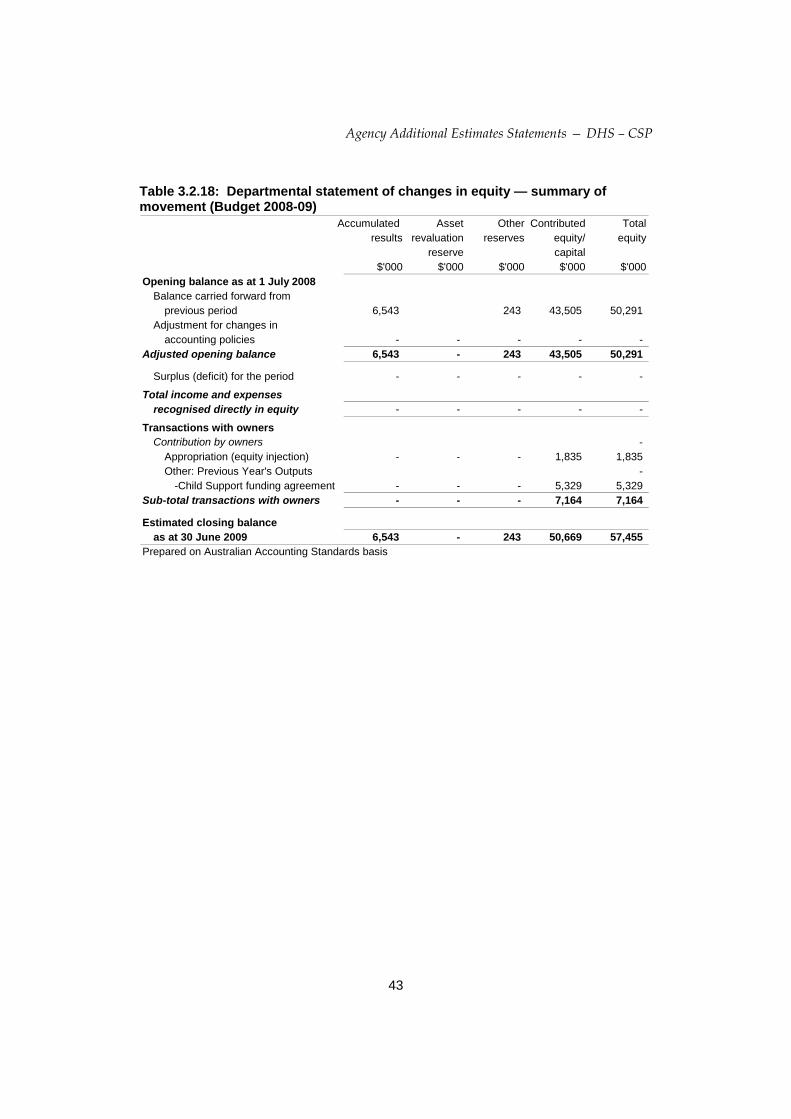
Table 3.2.18: Departmental statement of changes in equity — summary of movement (Budget 2008-09)
Accumulated Asset Other Contributed Totalresults revaluation reserves equity/ equity
reserve capital$'000 $'000 $'000 $'000 $'000
Opening balance as at 1 July 2008Balance carried forward from
previous period 6,543 243 43,505 50,291 Adjustment for changes in
accounting policies - - - - - Adjusted opening balance 6,543 - 243 43,505 50,291
Surplus (deficit) for the period - - - - -
Total income and expensesrecognised directly in equity - - - - -
Transactions with ownersContribution by owners -
Appropriation (equity injection) - - - 1,835 1,835 Other: Previous Year's Outputs -
-Child Support funding agreement - - - 5,329 5,329 Sub-total transactions with owners - - - 7,164 7,164
Estimated closing balanceas at 30 June 2009 6,543 - 243 50,669 57,455
Prepared on Australian Accounting Standards basis
43

Agency Additional Estimates Statements — DHS – CSP
Table 3.2.19: Schedule of budgeted income and expenses administered on behalf of government (for the period ended 30 June)
Actual Revised Forward Forward Forwardbudget estimate estimate estimate
2007-08 2008-09 2009-10 2010-11 2011-12$'000 $'000 $'000 $'000 $'000
INCOME ADMINISTERED ONBEHALF OF GOVERNMENT
RevenueTaxation
Other taxes, fees and fines 70,875 77,426 80,866 84,425 86,417 Total taxation 70,875 77,426 80,866 84,425 86,417 Non-taxation
Dividends - - - - - Competitive neutrality revenue - - - - - Other sources of non-taxation
revenues 1,059,007 1,106,085 1,155,228 1,206,070 1,234,523 Total non-taxation 1,059,007 1,106,085 1,155,228 1,206,070 1,234,523 Total revenues administered
on behalf of Government 1,129,882 1,183,511 1,236,094 1,290,495 1,320,940
Total income administeredon behalf of Government 1,129,882 1,183,511 1,236,094 1,290,495 1,320,940
EXPENSES ADMINISTERED ONBEHALF OF GOVERNMENTPersonal benefits (5) - - - - Suppliers - - - - - Write down and impairment of assets 96,595 96,476 101,861 106,344 108,853 Child Support Payments 1,031,559 1,079,402 1,127,341 1,176,955 1,204,722
Total expenses administeredon behalf of Government 1,128,149 1,175,878 1,229,202 1,283,299 1,313,575
Prepared on Australian Accounting Standards basis
44
Agency Additional Estimates Statements — DHS – CSP
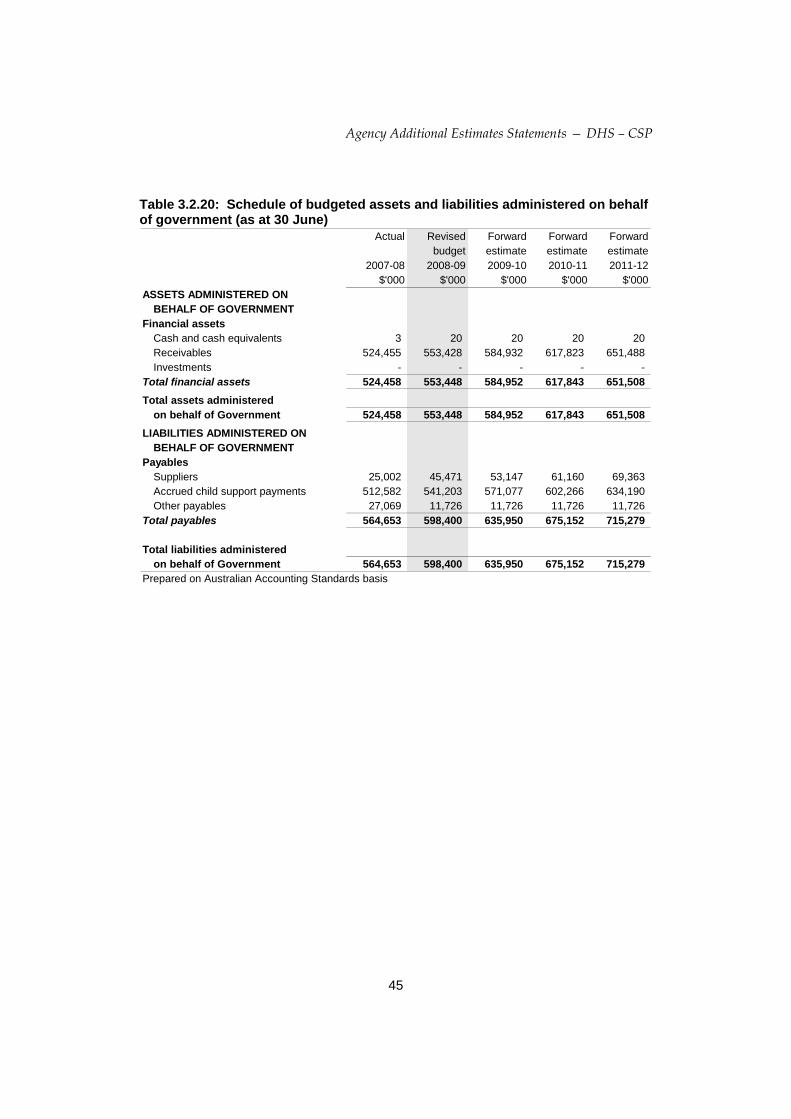
Table 3.2.20: Schedule of budgeted assets and liabilities administered on behalf of government (as at 30 June)
Actual Revised Forward Forward Forwardbudget estimate estimate estimate
2007-08 2008-09 2009-10 2010-11 2011-12$'000 $'000 $'000 $'000 $'000
ASSETS ADMINISTERED ON BEHALF OF GOVERNMENT
Financial assetsCash and cash equivalents 3 20 20 20 20 Receivables 524,455 553,428 584,932 617,823 651,488 Investments - - - - -
Total financial assets 524,458 553,448 584,952 617,843 651,508 Total assets administered
on behalf of Government 524,458 553,448 584,952 617,843 651,508 LIABILITIES ADMINISTERED ON
BEHALF OF GOVERNMENTPayables
Suppliers 25,002 45,471 53,147 61,160 69,363 Accrued child support payments 512,582 541,203 571,077 602,266 634,190 Other payables 27,069 11,726 11,726 11,726 11,726
Total payables 564,653 598,400 635,950 675,152 715,279
Total liabilities administeredon behalf of Government 564,653 598,400 635,950 675,152 715,279
Prepared on Australian Accounting Standards basis
45
Agency Additional Estimates Statements — DHS – CSP
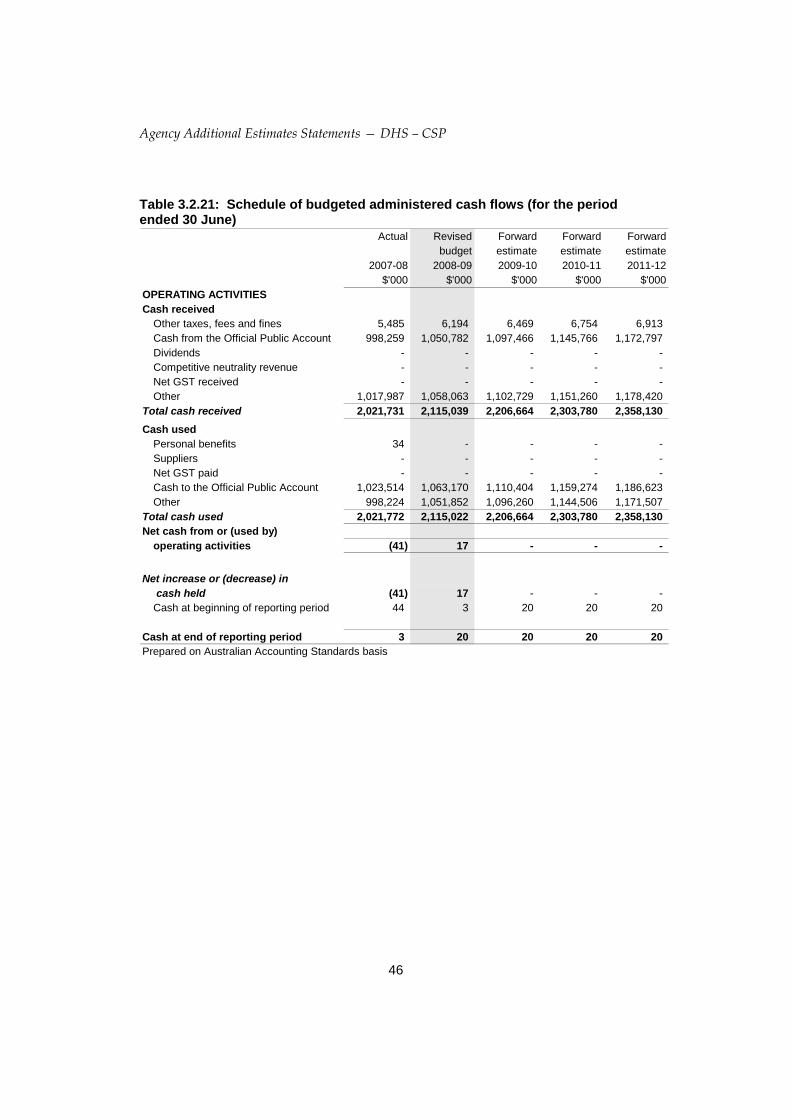
Table 3.2.21: Schedule of budgeted administered cash flows (for the period ended 30 June)
Actual Revised Forward Forward Forwardbudget estimate estimate estimate
2007-08 2008-09 2009-10 2010-11 2011-12$'000 $'000 $'000 $'000 $'000
OPERATING ACTIVITIESCash received
Other taxes, fees and fines 5,485 6,194 6,469 6,754 6,913 Cash from the Official Public Account 998,259 1,050,782 1,097,466 1,145,766 1,172,797 Dividends - - - - - Competitive neutrality revenue - - - - - Net GST received - - - - - Other 1,017,987 1,058,063 1,102,729 1,151,260 1,178,420
Total cash received 2,021,731 2,115,039 2,206,664 2,303,780 2,358,130 Cash used
Personal benefits 34 - - - - Suppliers - - - - - Net GST paid - - - - - Cash to the Official Public Account 1,023,514 1,063,170 1,110,404 1,159,274 1,186,623 Other 998,224 1,051,852 1,096,260 1,144,506 1,171,507
Total cash used 2,021,772 2,115,022 2,206,664 2,303,780 2,358,130 Net cash from or (used by)
operating activities (41) 17 - - -
Net increase or (decrease) in cash held (41) 17 - - - Cash at beginning of reporting period 44 3 20 20 20
Cash at end of reporting period 3 20 20 20 20 Prepared on Australian Accounting Standards basis
46

Agency Additional Estimates Statements — DHS – CRS Australia
BUDGETED FINANCIAL STATEMENTS – CRS AUSTRALIA Table 3.2.22: Budgeted departmental income statement (for the period ended 30 June)
Actual Revised Forward Forward Forwardbudget estimate estimate estimate
2007-08 2008-09 2009-10 2010-11 2011-12$'000 $'000 $'000 $'000 $'000
INCOMERevenue
Revenues from Government - - - - - Goods and services 182,283 209,481 201,746 197,344 196,210 Revenue from sale of assets 58 - - - - Other 644 500 500 500 500
Total revenue 182,985 209,981 202,246 197,844 196,710
Total income 182,985 209,981 202,246 197,844 196,710 EXPENSE
Employees 122,486 123,880 121,002 118,365 117,630 Suppliers 53,522 75,813 71,683 69,271 68,873 Depreciation and amortisation 3,051 6,900 6,900 6,900 6,900 Finance costs 28 - - - - Write-down of assets and
impairment of assets 283 58 58 58 58 Losses from sale of assets - - - - -
Total expenses 179,370 206,651 199,643 194,594 193,461
Surplus (Deficit) before income tax 3,615 3,330 2,603 3,250 3,249 Income tax expense 230 1,389 1,389 1,389 1,389
Surplus (deficit) attributable to the Australian Government 3,385 1,941 1,214 1,861 1,860
Prepared on Australian Accounting Standards basis
47

Agency Additional Estimates Statements — DHS – CRS Australia
Table 3.2.23: Budgeted departmental balance sheet (as at 30 June) Actual Revised Forward Forward Forward
budget estimate estimate estimate2007-08 2008-09 2009-10 2010-11 2011-12
$'000 $'000 $'000 $'000 $'000ASSETSFinancial assets
Cash and equivalents 7,774 7,618 3,749 4,462 6,069 Trade and other Receivables 84,458 84,458 84,460 84,460 84,460 Accrued revenues 1,831 1,931 1,931 2,431 2,431
Total financial assets 94,063 94,007 90,140 91,353 92,960 Non-financial assets
Land and buildings 8,131 8,369 8,607 8,845 9,084 Infrastructure, plant and equipment 1,756 1,772 1,788 1,803 1,817 Intangibles 950 595 595 595 595 Other 1,320 1,320 1,320 1,320 1,320
Total non-financial assets 12,157 12,056 12,310 12,563 12,816 Total assets 106,220 106,063 102,450 103,916 105,776 LIABILITIESProvisions
Employees 27,244 24,528 22,084 22,083 22,083 Other 2,147 2,147 2,147 2,147 2,147
Total provisions 29,391 26,675 24,231 24,230 24,230 Payables
Suppliers 5,601 6,019 3,837 3,443 3,443 Tax liabilities 359 359 359 359 359 Other 5,879 6,079 5,879 5,879 5,879 Lease Incentives 594 594 594 594 594
Total payables 12,433 13,051 10,669 10,275 10,275
Total liabilities 41,824 39,726 34,900 34,505 34,505 Net assets 64,396 66,337 67,550 69,411 71,271
EQUITY*Parent entity interest
Contributed equity 43,547 43,547 43,547 43,547 43,547 Reserves 2,339 2,339 2,339 2,339 2,339 Retained surpluses or
accumulated deficits 18,510 20,451 21,664 23,525 25,385 Total equity 64,396 66,337 67,550 69,411 71,271
Current assets 95,331 95,327 91,460 92,673 94,280 Non-current assets 10,889 10,736 10,990 11,243 11,496 Current liabilities 35,165 29,795 26,175 25,879 25,879 Non-current liabilities 6,659 9,931 8,725 8,626 8,626 *Note: 'equity' is the residual interest in assets after deduction of liabilities.Prepared on Australian Accounting Standards basis
48

Agency Additional Estimates Statements — DHS – CRS Australia
Table 3.2.24: Budgeted departmental statement of cash flows (for the period ended 30 June)
Actual Revised Forward Forward Forwardbudget estimate estimate estimate
2007-08 2008-09 2009-10 2010-11 2011-12$'000 $'000 $'000 $'000 $'000
OPERATING ACTIVITIESCash received
Goods and services 203,213 209,181 201,746 196,844 196,211 Appropriations - - - - - Net GST received (11,825) 27,422 26,887 26,398 26,334 Other cash received 207 500 500 500 500
Total cash received 191,595 237,103 229,133 223,742 223,045 Cash used
Employees 118,490 126,795 125,446 118,565 117,830 Suppliers 58,828 76,218 73,844 71,241 70,450 Competitive neutrality payments 1,849 1,189 1,189 1,189 1,189 Cash to the Official Public Account - - - - - Net GST paid - 27,422 26,887 26,397 26,334 Other - - - - -
Total cash used 179,167 231,624 227,366 217,392 215,803 Net cash from or (used by)
operating activities 12,428 5,479 1,766 6,350 7,242 INVESTING ACTIVITIESCash received
Proceeds from sales of property,plant and equipment 59 - - - -
Total cash received 59 - - - - Cash used
Purchase of property, plant and equipment 2,458 5,635 5,635 5,635 5,635
Purchase of intangibles 271 - - - - Cash transferred to the Official
Public Account 11,700 - - - - Other - - - - -
Total cash used 14,429 5,635 5,635 5,635 5,635 Net cash from or (used by)
investing activities (14,370) (5,635) (5,635) (5,635) (5,635)
FINANCING ACTIVITIESCash received
Appropriations - contributed equity - - - - - Total cash received - - - - - Net cash from or (used by)
financing activities - - - - -
Net increase or (decrease)in cash held (1,942) (156) (3,869) 715 1,607 Cash at the beginning of
the reporting period 9,716 7,774 7,618 3,747 4,462 Cash at the end of the
reporting period 7,774 7,618 3,749 4,462 6,069 Prepared on Australian Accounting Standards basis
49

Agency Additional Estimates Statements — DHS – CRS Australia
Table 3.2.25: Departmental statement of changes in equity — summary of movement (Budget 2008-09)
Accumulated Asset Other Contributed Totalresults revaluation reserves equity/ equity
reserve capital$'000 $'000 $'000 $'000 $'000
Opening balance as at 1 July 2008Balance carried forward from
previous period 18,510 2,339 43,547 64,396 Adjustment for changes in
accounting policies - - - - - Adjusted opening balance 18,510 - 2,339 43,547 64,396
Surplus (deficit) for the period 1,941 - - - 1,941
Total income and expensesrecognised directly in equity 1,941 - - - 1,941
Transactions with ownersContribution by owners
Appropriation (equity injection) - - - - - Other: Previous Year's Outputs
- funding agreement - - - - - Sub-total transactions with owners - - - - -
Estimated closing balanceas at 30 June 2009 20,451 - 2,339 43,547 66,337
Prepared on Australian Accounting Standards basis
50

CENTRELINK
Section 1: Agency overview and resources............................................................53 1.1 Strategic direction .........................................................................................53 1.2 Agency resource statement ..........................................................................56 1.3 Agency measures table ................................................................................58 1.4 Additional estimates and variations ..............................................................60 1.5 Breakdown of additional estimates by appropriation bill...............................64
Section 2: Revisions to agency outcomes and planned performance.................66 2.1 Outcomes and performance information ......................................................66
Section 3: Explanatory tables and budgeted financial statements ......................67 3.1 Explanatory tables ........................................................................................67 3.2 Budgeted financial statements......................................................................69
51


CENTRELINK
Section 1: Agency overview and resources
1.1 STRATEGIC DIRECTION
Centrelink’s Purpose is:
Serving Australia by assisting people to become self-sufficient and supporting those in need.
Centrelink provides services on behalf of more than 20 organisations. Centrelink delivers information, payments and services detailed in Business Partnership Agreements or similar arrangements. Centrelink has Business Partnership Agreements in place with the following Policy Departments:
• Australian Government Department of Families, Housing, Community Services and Indigenous Affairs (FaHCSIA);
• Australian Government Department of Education, Employment and Workplace Relations (DEEWR);
• Australian Government Department of Agriculture, Fisheries and Forestry (DAFF); and
• Australian Government Department of Health and Ageing (DoHA).
Centrelink acts in partnership with other levels of government and the broader Australian community and distributes payments to Australian families, communities and individuals. These payments include income support and family assistance payments and payments under a range of rural assistance measures. The outcomes relate to Government welfare priorities.
53
Agency Additional Estimates Statements - Centrelink
Centrelink’s Strategic Themes specify the high level of focus that integrates issues, opportunities and information from the internal and external environment. A Theme is a succinct statement that provides a medium to long-term focus for Centrelink’s strategic implementation efforts.
Centrelink’s Strategic Themes are:
• Building confidence in Centrelink
To provide assurance to Government, clients and customers that services are fairly, effectively and efficiently delivered.
• Strengthening our customer focus in line with Government direction
To build and leverage our strong customer focus when delivering government policies and agendas.
• Developing a networked organisation
To link with others inside and outside the organisation to provide quality outcomes and seamless service for customers.
• Building capability for Government
To have the right resources and underlying capability to progress the Government’s agenda on an ongoing basis and in times of crisis.
• Demonstrating value for money
To be accountable for the efficient use of resources and ensuring the best service offer at the best price.
54

Agency Additional Estimates Statements - Centrelink
Centrelink’s Strategic Priorities reflect the most important things at an organisational level that need to be done. These are variable and current and for this reason are reviewed regularly. Centrelink’s priorities must be understood and progressed to support the Government’s agenda.
Centrelink’s Strategic Priorities for 2008-09 are:
• Build capability and support our people to deliver the Government’s priorities;
• Improve the customer experience;
• Support the Minister and the Department of Human Services to improve service delivery;
• Demonstrate united leadership;
• Prepare for increasing integration with Human Services agencies;
• Ensure effective and efficient delivery of services; and
• Strengthen relationships with local communities.
55

Agency Additional Estimates Statements - Centrelink
1.2 AGENCY RESOURCE STATEMENT
The Agency Resource Statement details the resourcing for Centrelink at Additional Estimates. Table 1.1 outlines the total resourcing available from all sources for the 2008-09 Budget year, including variations through Appropriation Bills No.3 and No.4, special appropriations and special accounts.
Table 1.1: Centrelink resource statement – Additional estimates for 2008-09 as at Additional Estimates December 2008
Estimate Proposed Total Total
as at Budget + Additional = Estimate AvailableEstimates (Additional Appropriation
Estimates)2008-09 2008-09 2008-09 2007-08
$'000 $'000 $'000 $'000Ordinary Annual ServicesDepartmental outputs
Departmental outputs 1 607,171 1,148 608,319 608,799Total 607,171 1,148 608,319 608,799
Total ordinary annual services A 607,171 1,148 608,319 608,799Other servicesDepartmental non-operating
Equity injections 2 3,536 - 3,536 41,460Previous years' outputs 2 - 106 106 2,232Total 3,536 106 3,642 43,692
Total other services B 3,536 106 3,642 43,692Total Available Annual
Appropriations 610,707 1,254 611,961 652,491Special Accounts 3
Opening balance 243,638 74,334 317,972 223,894Appropriation Receipts 610,707 (11,340) 599,367 652,491Non-Appropriation receipts to
Special Accounts 2,215,758 81,002 2,296,760 2,168,588Total Special Account C 3,070,103 143,996 3,214,099 3,044,973Total resourcing 3,680,810 145,250 3,826,060 3,697,464A+B+C
Less appropriations drawn fromannual or special appropriations aboveand credited to special accounts (599,367) (652,491)
Total net resourcing for Centrelink 3,226,693 3,044,973
1 Appropriation Bill (No.3) 2008-092 Appropriation Bill (No.4) 2008-09
Reader note: All figures are GST exclusive.
3 Estimated opening balance for Commonwealth Social Services Special Accounts. For further information on special accounts see Section 3, Table 3.1.1.
56

Agency Additional Estimates Statements - Centrelink
Table 1.1: Centrelink resource statement – Additional estimates for 2008-09 as at Additional Estimates December 2008 (continued)
Third Party Drawdowns from and on behalf of other agencies
C$'000
entrelink has authority to make the following estimated payments on behalf of other agencies: 1,2,3,4,5
(disclosed in the respective agency's Resource Statement)Department of Families, Housing, Community Services and Indigenous Affairs (FaHCSIA) A New Tax System ( Family Assistance ) (Administration) Act 1999 19,183,682 Social Security (Administration) Act 1999 44,358,986Department of Education, Employment and Workplace Relations (DEEWR) A New Tax System ( Family Assistance Administration) Act 1999 5 2,830,850 Social Security (Adminstration) Act 1999 11,703,528 Social Security Act 1991 1,800,061 Student Assistance Act 1973 235,288Department of Agriculture, Fisheries and Forestry (DAFF)
Farm Household Support Act 1992 (Exceptional Circumstances Relief Payment) 348,727Total 80,461,122
Revenue received from other agencies for the provision of services (disclosed above within Non-Appropriation Receipts) 2,102,869
NOTES: 1. Centrelink's purchaser-provider arrangements with the above agencies (i.e. FaHCSIA, DEEWR, DAFF) include the delivery of payments to customers. 2. Centrelink has no drawdown access to the above agencies' Administered appropriations that are required to be drawn and paid to customers.3. The respective agencies are responsible for the policy, estimates and reporting of these Administered appropriations.4. The figures disclosed above are based on the 2008-09 estimates as provided to Centrelink by the respective agencies.5. The figures disclosed above includes Child Care Benefit program appropriation amounting to $1,970.03m that both Centrelink and DEEWR pays out to the customers on behalf of DEEWR. It is not possible to quantify how much of this appropriation will be paid by Centrelink for FY 2008-09 as this is a transition year in the implementation payment processes.
57

Agency Additional Estimates Statements - Centrelink
1.3 AGENCY MEASURES TABLE
Table 1.2 summarises new Government measures taken since the 2008-09 Budget, with the affected output group identified. The table consists of expense measures only as Centrelink has not had any revenue or capital measures since 2008-09 Budget.
Measures can be found beneath Departmental headings, this stipulates who the Lead Agency is for each measure.
Centrelink will be directly appropriated its transaction funding from 01 July 2009. Table 1.2 has been collated to depict this, that is, all measures that have funding implications in the 2008-09 financial year can be found beneath their respective Lead Agency. For any measure that has funding implications beyond 01 July 2009, the funding is represented as a direct appropriation in Table 1.2, with a footnote advising whom the Lead Agency is.
Table 1.2: Agency Measures since Budget
Output Group 2008-09 2009-10 2010-11 2011-12$'000 $'000 $'000 $'000
D
58
epartment of Families,Housing, Community Services
Expense Measures
Economic Security Strategy - lump sum payment to pensioners, 1.1seniors and carers
Departmental outputs 8,385 - - - - one-off lump sum payment of $1,000 1.1per child to low and middle incomefamilies
Departmental outputs 7,932 - - - Retention of current Fringe Benefit 1.1Tax treatment for family assistancecustomers
Departmental outputs 294 - - - Welfare Reform - Cape York trial 1.1
Departmental outputs 966 - - - Total FaHCSIA expense measures Departmental 17,577 - - -
Department of Innovation, Industry, Science and ResearchExpense MeasuresAdditional 2008-09 Funding for the LPG 1.1Vehicle Scheme
Departmental outputs 2,627 - - - Total DIISR expense measures Departmental 2,627 - - -
Department of Agriculture,Fisheries and ForestryExpense MeasuresSmall block irrigators - exit grant 1.1package
Departmental outputs 3,988 - - - Drought Assistance - Exceptional 1.1Circumstances assistance forprimary producers
Departmental outputs 3,578 - - -

Agency Additional Estimates Statements - Centrelink
Table 1.2: Agency Measures since Budget (continued)
Output Group 2008-09 2009-10 2010-11 2011-12$'000 $'000 $'000 $'000
Drought Assistance - Exceptional 1.1Circumstances assistance forsmall businesses
Departmental outputs 110 - - - Total DAFF expense measures Departmental 7,676 - - -
Direct AppropriationExpense Measures
Economic Security Strategy - one-off lump sum payment of $1,000 1 1.1per child to low and middle incomefamilies
partmental outputs - 602 192 - Welfare Reform - Cape York trial 2 1.1
partmental outputs - 1,320 1,168 682
Family Law Amendments - extension of the removal of the 3 1.1discrimination against same sexcouples for child support
partmental outputs 1,148 250 173 174
Job Capacity Assessments - improved administration 4 1.1
partmental outputs - 5,232 739 657
A New Model for Delivery of Disability 5 1.1Employment Services
Departmental outputs - 2,308 22 - Total Direct Appropriation expensemeasures Departmental 1,148 9,712 2,294 1,513
Departmental 29,028 9,712 2,294 1,513 Total expense measures Total 29,028 9,712 2,294 1,513
Direct AppropriationCapital Measures
Job Capacity Assessments - improved administration 4 1.1
Departmental outputs - 60 - -
Departmental - 60 - - Total capital measures Total - 60 - -
Departmental 29,028 9,772 2,294 1,513 Total of ALL measures Total 29,028 9,772 2,294 1,513
Note 1: The lead agency for measure Economic Security Strategy - one-off lump sum payment of $1,000 per child to low and middle income families is FaHCSIA. The full measure description and package details appear in the 2008-09 Mid Year Economic and Fiscal Outlook under the Department of Families, Housing, Community Services and Indigenous Affairs portfolio.Note 2: The lead agency for measure Welfare Reform - Cape York is FaHCSIA. The full measure description and package details appear in the 2007-08 Mid Year Economic and Fiscal Outlook under the Department of Families, Housing, Community Services and Indigenous Affairs portfolio.
Note 5: The lead agency for measure A New Model for Delivery of Disability Employment Services is DEEWR.
Note 4: The lead agency for measure Job Capacity Assessments - improved administration is DHS.
Note 3: The lead agency for measure Family Law Amendments - extension of the removal of the discrimination against same sex couples for child support is DHS.
De
De
De
De
59

Agency Additional Estimates Statements - Centrelink
1.4 ADDITIONAL ESTIMATES AND VARIATIONS
The following tables detail the changes to the resourcing for Centrelink at Additional Estimates, by outcome. Table 1.3 details the Additional Estimates and variations resulting from new measures since the 2008-09 Budget in Appropriation Bills No.3 and No.4. Table 1.4 details Additional Estimates or variations through other factors, such parameter adjustments.
Table 1.3: Additional estimates and variations to outcomes from measures since 2008-09 Budget Output Group 2008-09 2009-10 2010-11 2011-12
Impacted ($'000) ($'000) ($'000) ($'000)Department of Families,Housing, Community Services and Indigenous AffairsOutcome 1Increase in estimates (departmental)
Economic Security Strategy - lump sum payment to pensioners, seniorsand carers - one-off lump sum payment of $1,000 per 1.1 7,932 - - - child to low and middle income families
Retention of current Fringe Benefit Taxtreatment for family assistance customersWelfare Reform - Cape York trial 1.1 966 - - - Net impact on FaHCSIA estimates for Outcome 1 (departmental)
Department of Innovation, Industry,Science and ResearchOutcome 1Increase in estimates (departmental)Additional 2008-09 funding for the LPGVehicle SchemeNet impact on DIISR estimatesfor Outcome 1 (departmental)
Department of Agriculture,Fisheries and ForestryOutcome 1Increase in estimates (departmental)Small block irrigators - exit grant package 1.1 3,988 - - - Drought Assistance - ExceptionalCircumstances assistance for primaryproducersDrought Assistance - ExceptionalCircumstances assistance for smallbusinessesNet impact on DAFF estimates for Outcome 1 (departmental)
17,577
1.1 3,578 -
7,676
1.1
-
- -
- - -
-
-
-
110
2,627 -
1.1 2,627 - -
- 1.1 8,385 - -
1.1 294 - - -
-
- - -
-
60
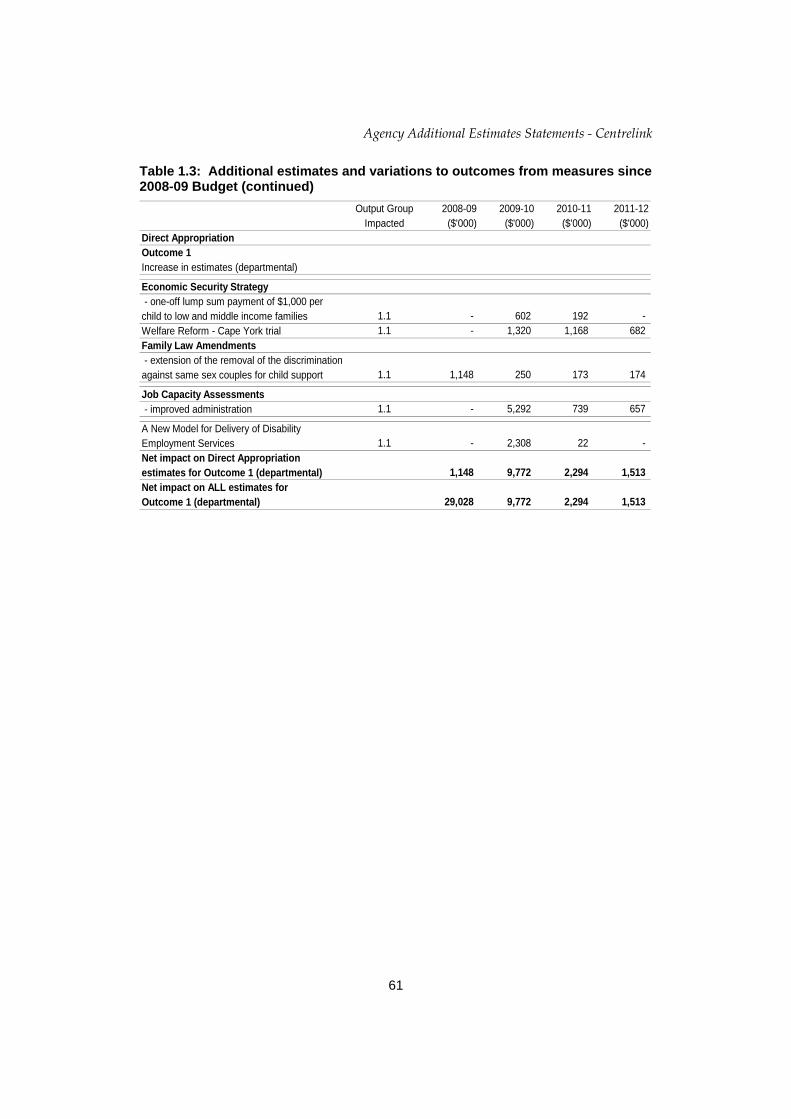
Agency Additional Estimates Statements - Centrelink
Table 1.3: Additional estimates and variations to outcomes from measures since 2008-09 Budget (continued) Output Group 2008-09 2009-10 2010-11 2011-12
Impacted ($'000) ($'000) ($'000) ($'000)Direct AppropriationOutcome 1Increase in estimates (departmental)
Economic Security Strategy - one-off lump sum payment of $1,000 perchild to low and middle income familiesWelfare Reform - Cape York trial 1.1 - 1,320 1,168 682 Family Law Amendments - extension of the removal of the discriminationagainst same sex couples for child support
Job Capacity Assessments - improved administration 1.1 - 5,292 739 657
A New Model for Delivery of DisabilityEmployment Services 1.1Net impact on Direct Appropriationestimates for Outcome 1 (departmental)Net impact on ALL estimates forOutcome 1 (departmental)
- 2,308 22 -
173 174
1.1
1.1 1,148 250
- 602 192 -
1,148 9,772 2,294 1,513
29,028 9,772 2,294 1,513
61

Agency Additional Estimates Statements - Centrelink
Table 1.4: Additional estimates and variations to outcomes from other variations
Hou
Output Group 2008-09 2009-10 2010-11 2011-12Impacted ($'000) ($'000) ($'000) ($'000)
Department of Families,
OutI
No
De
Agen
and WOut
Tra
Ne
De
Out
Sm(es
Agen
for O
sing, Community Servicesand Indigenous Affairs
come 1ncrease in estimates (departmental)
rthern Territory - Income Management- reversal of Budget 2008-09 adjustment
Outcome 1crease in estimates (departmental)
Transfer of appropriations betweencies
Net impact on FaHCSIA estimatesfor Outcome 1 (departmental) 636 (833,492) (810,761) (820,402)
Department of Education, Employmentorkplace Relations
come 1Decrease in estimates (departmental)
nsfer of appropriations betweenAgencies
t impact on DEEWR estimatesfor Outcome 1 (departmental) - (894,767) (906,723) (918,152)
partment of Agriculture, Fisheriesand Forestry
come 1Decrease in estimates (departmental)
all Block Irrigators - exit grant packagetimates adjustment)
Transfer of appropriations betweencies
Net impact on DAFF estimatesutcome 1 (departmental)
1.1636 - - -
(3,315) (3,311)
(810,761) (820,402)
1.1 - (894,767) (906,723) (918,152)
1.1 (1,260) -
1.1 - (833,492)
- -
(3,311) (1,260) (5,790) (3,315)
1.1 - (5,790)
62
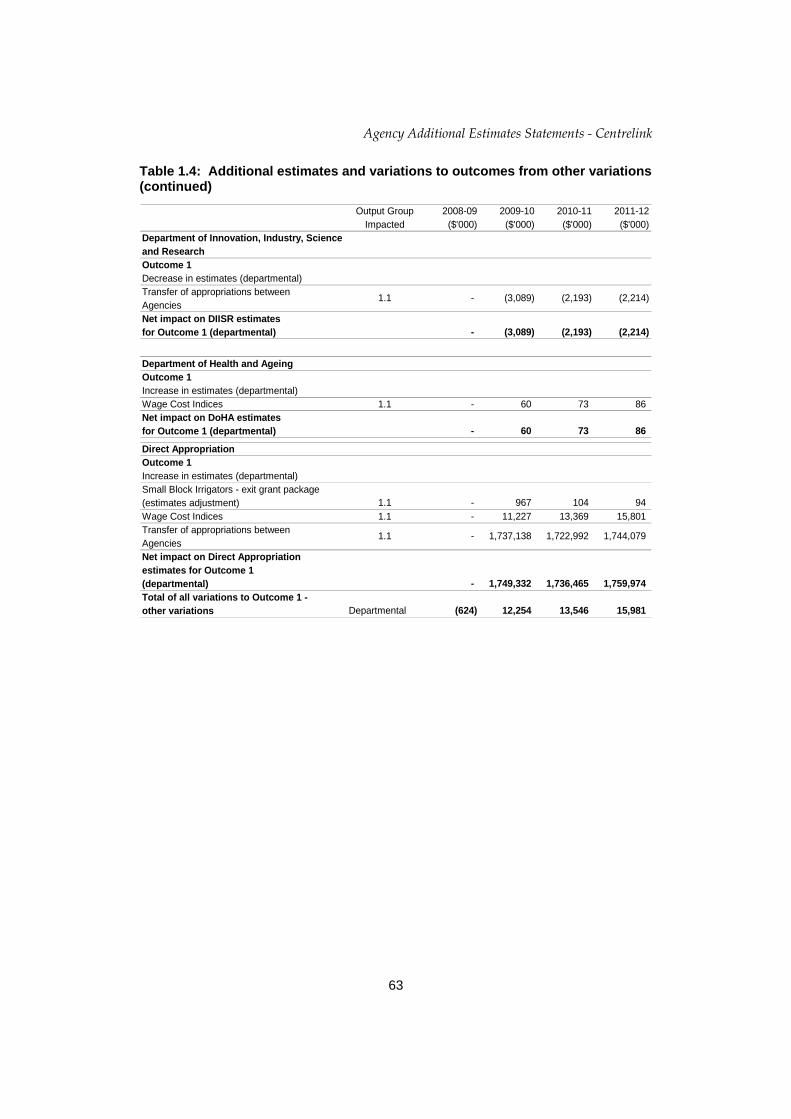
Agency Additional Estimates Statements - Centrelink
Table 1.4: Additional estimates and variations to outcomes from other variations (continued) Output Group 2008-09 2009-10 2010-11 2011-12
Impacted ($'000) ($'000) ($'000) ($'000)Department of Innovation, Industry, Scienceand ResearchOutcome 1Decrease in estimates (departmental)Transfer of appropriations betweenAgenciesNet impact on DIISR estimatesfor Outcome 1 (departmental)
Department of Health and AgeingOutcome 1Increase in estimates (departmental)Wage Cost Indices 1.1 - 60 73 86 Net impact on DoHA estimatesfor Outcome 1 (departmental)
Direct AppropriationOutcome 1Increase in estimates (departmental)Small Block Irrigators - exit grant package(estimates adjustment)Wage Cost Indices 1.1 - 11,227 13,369 15,801 Transfer of appropriations betweenAgenciesNet impact on Direct Appropriation estimates for Outcome 1 (departmental)Total of all variations to Outcome 1 -other variations
(2,214) - (3,089) (2,193)
1,759,974
Departmental (624) 12,254 13,546 15,981
- 1,749,332 1,736,465
86
1.1 - 967 104 94
- 60 73
1.1 - (3,089) (2,193) (2,214)
1,744,079 1.1 - 1,737,138 1,722,992
63
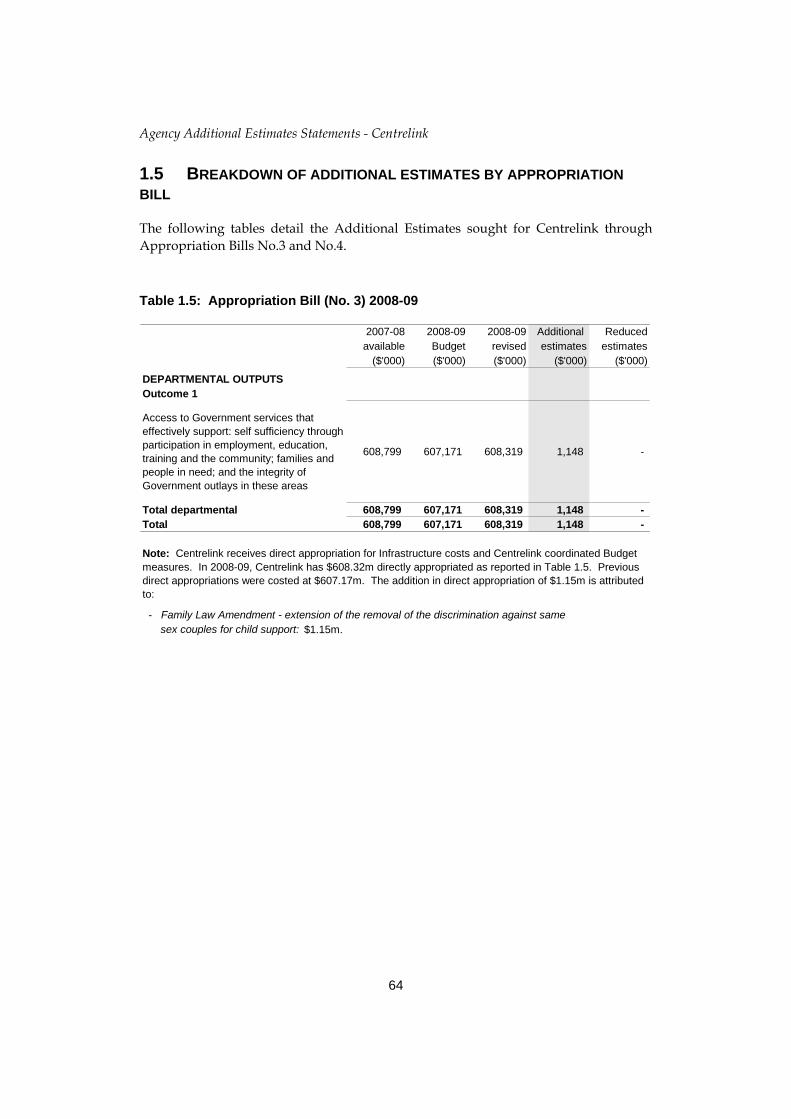
Agency Additional Estimates Statements - Centrelink
1.5 BREAKDOWN OF ADDITIONAL ESTIMATES BY APPROPRIATION BILL
The following tables detail the Additional Estimates sought for Centrelink through Appropriation Bills No.3 and No.4.
Table 1.5: Appropriation Bill (No. 3) 2008-09
2007-08 2008-09 2008-09 Additional Reducedavailable Budget revised estimates estimates
($'000) ($'000) ($'000) ($'000) ($'000)
DEPARTMENTAL OUTPUTSOutcome 1
Access to Government services that effectively support: self sufficiency through participation in employment, education, training and the community; families and people in need; and the integrity of Government outlays in these areas
608,799 607,171 608,319 1,148 -
Total departmental 608,799 607,171 608,319 1,148 - Total 608,799 607,171 608,319 1,148 -
- Family Law Amendment - extension of the removal of the discrimination against same sex couples for child support: $1.15m.
Note: Centrelink receives direct appropriation for Infrastructure costs and Centrelink coordinated Budget measures. In 2008-09, Centrelink has $608.32m directly appropriated as reported in Table 1.5. Previous direct appropriations were costed at $607.17m. The addition in direct appropriation of $1.15m is attributed to:
64

Agency Additional Estimates Statements - Centrelink
Table 1.6: Appropriation Bill (No. 4) 2008-09
2007-08 2008-09 2008-09 Additional Reducedavailable Budget revised Estimates estimates
($'000) ($'000) ($'000) ($'000) ($'000)
Non-operatingEquity injections 41,460 3,536 (9,058) - (12,594) Previous years' outputs 2,232 - 106 106 -
Total non-operating 43,692 3,536 (8,952) 106 (12,594)
Total 43,692 3,536 (8,952) 106 (12,594)
- return of the 07-08 NTER funding received from DEEWR as a result of the 07-08 NTER No Win/ No Loss reconciliation process - $0.87m;
- reduction in departmental equity (Capital Injection) as a result of the 07-08 NTER No Win/No Loss reconciliation process - $11.73m; and
- additional funds requested for the overspend incurred under 07-08 NTER Bill 1 (expense) as a result of the 07-08 NTER No Win/No Loss reconciliation process $0.11m.
Note: Centrelink receives direct appropriations for funding relating to equity injections. In 2008-09, Centrelink has an $8.9m reduction in the equity injection as reported in Table 1.6. The implementation of previous budget measures was costed at $3.54m. The net reduction in equity injection of $12.49m is attributed to the following:
65

Agency Additional Estimates Statements - Centrelink
Section 2: Revisions to agency outcomes and planned performance
2.1 OUTCOMES AND PERFORMANCE INFORMATION
No changes have been made to Centrelink’s Outcome Structure and Output Group. Complete details of Centrelink’s Outcome and Performance Information can be found in 2008-09 Portfolio Budget Statements.
66
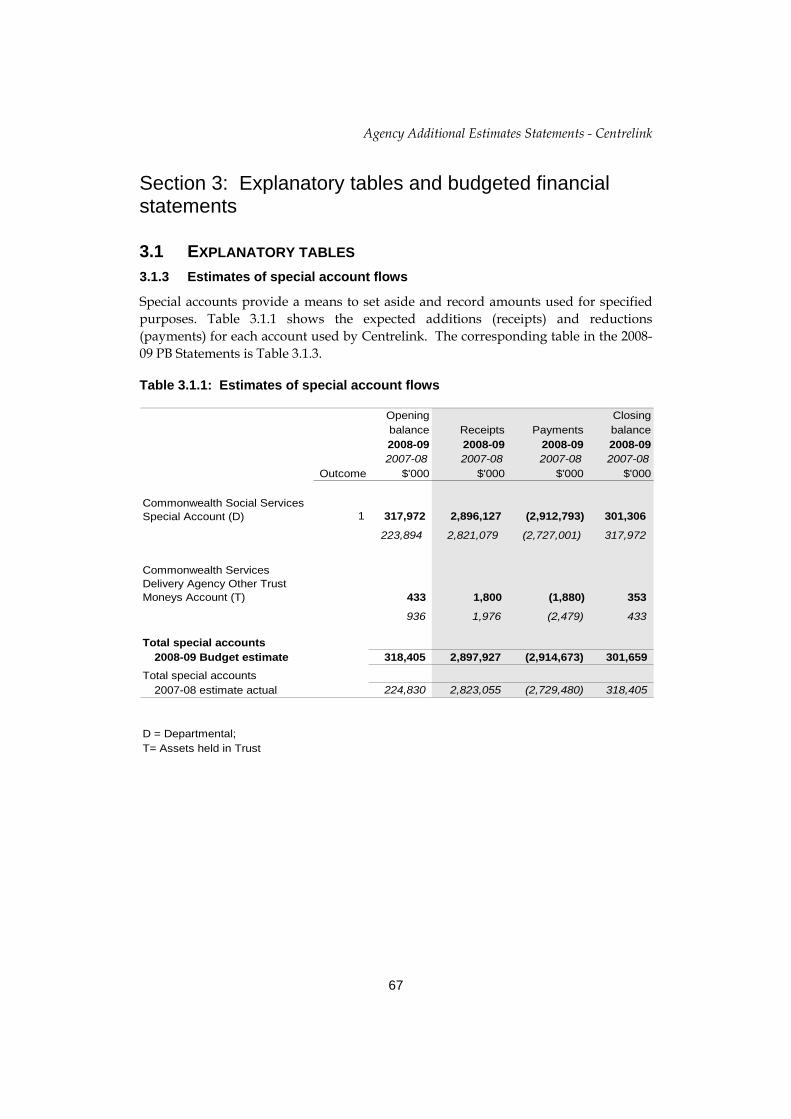
Agency Additional Estimates Statements - Centrelink
Section 3: Explanatory tables and budgeted financial statements
3.1 EXPLANATORY TABLES 3.1.3 Estimates of special account flows
Special accounts provide a means to set aside and record amounts used for specified purposes. Table 3.1.1 shows the expected additions (receipts) and reductions (payments) for each account used by Centrelink. The corresponding table in the 2008-09 PB Statements is Table 3.1.3.
Table 3.1.1: Estimates of special account flows
Opening Closingbalance Receipts Payments balance2008-09 2008-09 2008-09 2008-092007-08 2007-08 2007-08 2007-08
Outcome $'000 $'000 $'000 $'000
Commonwealth Social Services Special Account (D) 1 317,972 2,896,127 (2,912,793) 301,306
223,894 2,821,079 (2,727,001) 317,972
Commonwealth Services Delivery Agency Other Trust Moneys Account (T) 433 1,800 (1,880) 353
936 1,976 (2,479) 433
Total special accounts 2008-09 Budget estimate 318,405 2,897,927 (2,914,673) 301,659
Total special accounts2007-08 estimate actual 224,830 2,823,055 (2,729,480) 318,405
D = Departmental; T= Assets held in Trust
67

Agency Additional Estimates Statements - Centrelink 3.1.4 Estimates of variations to Average Staffing Level
Changes in Average Staff Level (ASL) are presented in the Portfolio Additional Estimates Statements at the whole of agency level to demonstrate any movements since Budget. The ASL figures for Budget were reported in agency PB Statements in each Outcome Resourcing Table.
Table 3.1.2: Average Staffing Level (ASL) 2008-09 2008-09
Budget Revised VariationOutcome 1
Access to Government services that effectively support: self sufficiency through participation in employment, education, training and the community; families and people in need; and the integrity of Government outlays in these areas
24,700 24,700 -
Total 24,700 24,700 -
68

Agency Additional Estimates Statements - Centrelink
3.2 BUDGETED FINANCIAL STATEMENTS 3.2.1 Analysis of budgeted financial statements
The significant differences between resource information presented in the Budget Papers and Portfolio Additional Estimates Statements (PAES) are the result of differences between Australian Accounting Standards (AAS) and Government Finance Statistics (GFS).
These differences mainly comprise of:
• 2007-08 Unearned Revenue recognised in 2008-09 in the Income Statement (AAS);
• GST cash receipts included in the Agency Resource Statement (GFS); and
• Resources Received Free of Charge (AAS).
3.2.2 Budgeted financial statements
Departmental financial statements
Budgeted Income Statement (see table 3.2.1) Centrelink is budgeting for break-even operating results for 2008-09 and for the forward years.
The total income for 2008-09 is estimated to increase by $167.09m from the 2007-08 actual income of $2,658.63m, primarily due to increases in funding from the 2008-09 Budget Estimates and 2008-09 Additional Estimates initiatives.
The 2008-09 expenses are also estimated to increase by $139.56m from the 2007-08 actual expense of $2,686.16m.
Budgeted Balance Sheet (see table 3.2.2) Centrelink’s budgeted net asset position of $306.39m represents an increase of $4.79m from the 30 June 2008 actual position. The increase is mainly due to additional funds to be received from Department of Families, Housing, Community Services and Indigenous Affairs ($13.74m). These funds are part of the 2007-08 NTER Budget initiative reconciliation process relating to work delivered during 2007-08, offset by a net reduction in capital injection of $8.95m, as detailed in Table 1.6 – Appropriation Bill (No 4) 2008-09.
The 2008-09 total assets are expected to decrease by $1.06m. This figure mainly reflects an anticipated reduction in trade and other receivables, cash at bank and prepayments of $18.38m, offset by a net increase in fixed assets of $17.32m.
69
Agency Additional Estimates Statements - Centrelink
Centrelink’s total liabilities are estimated to decrease by approximately $5.85m in 2008-09 due to a decrease in unearned revenue ($29.62m), supplier payables and other provisions ($14.53m), offset by an increase in employee provisions ($38.34m). The primary liability continues to be accrued employee leave entitlements.
70

Agency Additional Estimates Statements - Centrelink
Table 3.2.1: Budgeted departmental income statement (for the period ended 30 June) Actual Revised Forward Forward Forward
budget estimate estimate estimate2007-08 2008-09 2009-10 2010-11 2011-12
$'000 $'000 $'000 $'000 $'000
I
Prepared on Australian Accounting Standards basis.
NCOMEe
Revenues from Government 608,799 608,319 2,308,892 2,290,701 2,320,094 Goods and services 2,045,582 2,213,924 104,397 106,435 100,810 Other 1,026 - - - -
otal revenue 2,655,407 2,822,243 2,413,289 2,397,136 2,420,904
Net gains from sale of assets 534 - - - - Other 2,692 3,481 3,623 3,768 3,919
otal gains 3,226 3,481 3,623 3,768 3,919 otal income 2,658,633 2,825,724 2,416,912 2,400,904 2,424,823 XPENSEEmployees 1,722,726 1,858,123 1,462,063 1,455,263 1,480,155 Suppliers 808,926 811,878 801,260 799,300 800,022 Depreciation and amortisation 140,222 150,223 148,089 140,841 139,146 Write-down of assets and
impairment of assets 14,289 5,500 5,500 5,500 5,500 otal expenses 2,686,163 2,825,724 2,416,912 2,400,904 2,424,823
erating result (27,530) - - - - surplus or (deficit) attributable
to the Australian Government (27,530) - - - -
Revenu
TGains
TTE
TNet opNet
71

Agency Additional Estimates Statements - Centrelink
Table 3.2.2: Budgeted departmental balance sheet (as at 30 June) Actual Revised Forward Forward Forward
budget estimate estimate estimate2007-08 2008-09 2009-10 2010-11 2011-12
$'000 $'000 $'000 $'000 $'000
AS
Prepared on Australian Accounting Standards basis.
SETSnancial assetsCash and cash equivalents 29,972 23,166 22,675 23,607 23,680 Receivables 315,959 306,028 339,603 334,633 399,499
l financial assets 345,931 329,194 362,278 358,240 423,179 nancial assets
Land and buildings 195,903 213,424 230,238 224,101 215,243 Infrastructure, plant and equipment 121,350 142,069 121,137 119,783 103,741 Intangibles 236,065 215,145 216,825 247,043 226,365 Prepayment 47,782 46,141 30,011 30,614 31,241
otal non-financial assets 601,100 616,779 598,211 621,541 576,590 otal assets 947,031 945,973 960,489 979,781 999,769 IABILITIES
yablesSuppliers 57,369 54,140 55,553 57,002 58,489 Other payables 95,637 57,802 59,326 61,385 62,177
otal payables 153,006 111,942 114,879 118,387 120,666 isions
Employees 473,377 511,718 524,185 542,591 562,109 Other provisions 19,044 15,920 12,442 9,820 8,011 al provisions 492,421 527,638 536,627 552,411 570,120
otal liabilities 645,427 639,580 651,506 670,798 690,786
UITYrent entity interestContributed equity 301,041 291,983 294,573 294,573 294,573 Reserves 28,394 28,394 28,394 28,394 28,394 Accumulated deficits (27,831) (13,984) (13,984) (13,984) (13,984)
otal parent entity interest 301,604 306,393 308,983 308,983 308,983
otal equity 301,604 306,393 308,983 308,983 308,983
ets 393,448 375,335 392,289 388,854 454,420 553,583 570,638 568,200 590,927 545,349
urrent liabilities 544,052 491,484 501,606 517,922 535,459 on-current liabilities 101,375 148,096 149,900 152,876 155,327
Fi
TotaNon-fi
TTLPa
TProv
TotT
EQPa
T
T
Current assNon-current assetsCN
72
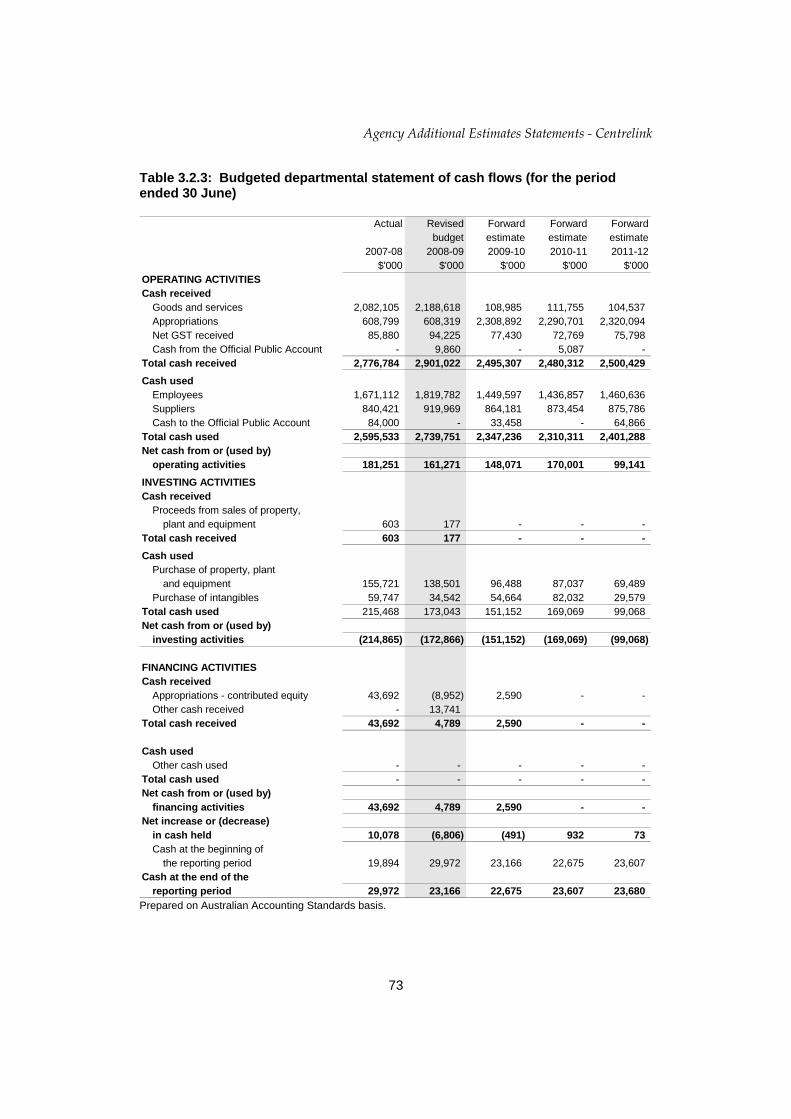
Agency Additional Estimates Statements - Centrelink
Table 3.2.3: Budgeted departmental statement of cash flows (for the period ended 30 June) Actual Revised Forward Forward Forward
budget estimate estimate estimate2007-08 2008-09 2009-10 2010-11 2011-12
$'000 $'000 $'000 $'000 $'000
OPERATING ACTIVITIES
receivedGoods and services 2,082,105 2,188,618 108,985 111,755 104,537 Appropriations 608,799 608,319 2,308,892 2,290,701 2,320,094 Net GST received 85,880 94,225 77,430 72,769 75,798 Cash from the Official Public Account - 9,860 - 5,087 -
otal cash received 2,776,784 2,901,022 2,495,307 2,480,312 2,500,429 used
Employees 1,671,112 1,819,782 1,449,597 1,436,857 1,460,636 Suppliers 840,421 919,969 864,181 873,454 875,786 Cash to the Official Public Account 84,000 - 33,458 - 64,866
otal cash used 2,595,533 2,739,751 2,347,236 2,310,311 2,401,288 sh from or (used by)
operating activities 181,251 161,271 148,071 170,001 99,141 NVESTING ACTIVITIES
receivedProceeds from sales of property,
plant and equipment 603 177 - - - otal cash received 603 177 - - -
usedPurchase of property, plant
and equipment 155,721 138,501 96,488 87,037 69,489 Purchase of intangibles 59,747 34,542 54,664 82,032 29,579
otal cash used 215,468 173,043 151,152 169,069 99,068 sh from or (used by)
investing activities (214,865) (172,866) (151,152) (169,069) (99,068)
INANCING ACTIVITIES received
Appropriations - contributed equity 43,692 (8,952) 2,590 - - Other cash received - 13,741
otal cash received 43,692 4,789 2,590 - -
usedOther cash used - - - - -
otal cash used - - - - - sh from or (used by)
financing activities 43,692 4,789 2,590 - - ncrease or (decrease)
in cash held 10,078 (6,806) (491) 932 73 Cash at the beginning of
the reporting period 19,894 29,972 23,166 22,675 23,607 at the end of the
reporting period 29,972 23,166 22,675 23,607 23,680
Cash
T Cash
T Net ca
I
Cash T
Cash
T
Net ca
F
Cash T
Cash
T Net ca
Net i
Cash
Prepared on Australian Accounting Standards basis.
73

Agency Additional Estimates Statements - Centrelink
Table 3.2.4: Departmental statement of changes in equity — summary of movement (Budget 2008-09) Accumulated Asset Contributed Total
results revaluation equity/ equityreserve capital
$'000 $'000 $'000 $'000
Ope A I T T S Est
ning balance as at 1 July 2008Balance carried forward from
previous period (27,831) 28,394 301,041 301,604 Adjustment for changes in
accounting policies - - - - djusted opening balance (27,831) 28,394 301,041 301,604
ncome and expenseNet operating result - - - -
otal income and expenses - - - - ransactions with ownersContribution by owners
Appropriation (equity injection) 13,847 - (9,058) 4,789 ub-total transactions with owners 13,847 - (9,058) 4,789
imated closing balanceas at 30 June 2009 (13,984) 28,394 291,983 306,393
Prepared on Australian Accounting Standards basis.
74
Agency Additional Estimates Statements - Centrelink
Notes to the financial statements
Departmental
1. Basis of Preparation of the Budgeted Financial Report
The Budgeted Financial Statements have been prepared in accordance with:
• Finance Minister’s Orders (FMOs); and
• Australian Accounting Standards and Interpretations issued by the Australian Accounting Standards Board (AASB) that apply for the reporting period.
Centrelink’s Budgeted Financial Report has been prepared on an accrual basis and is in accordance with the historical cost convention, except for certain assets, which have been recorded at fair value. Except where stated, no allowance is made for the effect of changing prices on the results or the financial position.
Unless an alternative treatment is specifically required by an Accounting Standard or the FMOs, assets and liabilities are recognised in the Balance Sheet when and only when:
• it is probable that future economic benefits will flow to Centrelink; or
• a future sacrifice of economic benefits will be required; and
• the amounts of the assets or liabilities can be reliably measured.
However, assets and liabilities arising under agreements equally proportionately unperformed are not recognised unless required by an Accounting Standard.
Unless an alternative treatment is specifically required by an accounting standard, revenues and expenses are recognised in the Income Statement when and only when the flow, consumption or loss of economic benefits has occurred and can be reliably measured.
75


MEDICARE AUSTRALIA
Section 1: Agency overview and resources............................................................79 1.1 Strategic direction .........................................................................................79 1.2 Agency resource statement ..........................................................................79 1.3 Agency measures table ................................................................................83 1.4 Additional estimates and variations to outcomes .........................................84 1.5 Breakdown of additional estimates by appropriation bill...............................86
Section 2: Revisions to agency outcomes and planned performance.................87 2.1 Outcomes and performance information ......................................................87
Section 3: Explanatory tables and budgeted financial statements ......................87 3.1 Explanatory tables ........................................................................................87 3.2 Budgeted financial statements......................................................................89
77


MEDICARE AUSTRALIA
Section 1: Agency overview and resources
1.1 STRATEGIC DIRECTION
Medicare Australia administers a range of health-related and other programs on behalf of the Australian Government, and plays an integral role in the Australian health sector in particular, by supporting the development of E-Health initiatives.
The objective of Medicare Australia is to work together with our strategic policy partners and stakeholders to improve the health and wellbeing of Australians by delivering information and payment services.
There have been no significant changes to the role of Medicare Australia to that described in the 2008-09 Portfolio Budget Statements. Medicare Australia has not been affected by any Administrative Arrangements Orders and therefore does not have any outputs transferred to or from, other agencies.
Further details can be found in the 2008-09 Portfolio Budget Statements.
1.2 AGENCY RESOURCE STATEMENT
Table 1.1 shows the total resources from all origins for the 2008-09 Budget year. The table summarises how resources will be applied by outcome and by administered and departmental classification.
The total resourcing for Medicare Australia including Special accounts in 2008-09 is $1,105m.
79

Agency Additional Estimates Statements – Medicare Australia Table 1.1: Medicare Australia resource statement – Additional estimates for 2008-09 as at Additional Estimates December 2008
Estimate as at Proposed Total TotalBudget + Additional = Estimate Available
Estimates at Additional AppropriationEstimates
2008-09 2008-09 2008-09 2007-08$'000 $'000 $'000 $'000
Ordinary Annual ServicesDepartmental outputs
Departmental outputs 735,591 - 1,5 735,591 743,339s31 Relevant agency receipts 83,701 5,831 3 89,532 87,213Total 819,292 5,831 825,123 830,552
Administered expensesOutcome 1 6,843 - 1 6,843 1,401Total 6,843 - 6,843 1,401
Total ordinary annual services A 826,135 5,831 831,966 831,953Other servicesDepartmental non-operating
Equity injections 23,045 1,089 2 24,134 21,764Previous years' outputs 16,206 - 16,206 10,784Total 39,251 1,089 40,340 32,548
Total other services B 39,251 1,089 40,340 32,548Total Available Annual
Appropriations 865,386 6,920 872,306 864,501Special AppropriationsTotal Special Appropriations C - - - -
Total Appropriations excluding Special Accounts 865,386 6,920 872,306 864,501
80
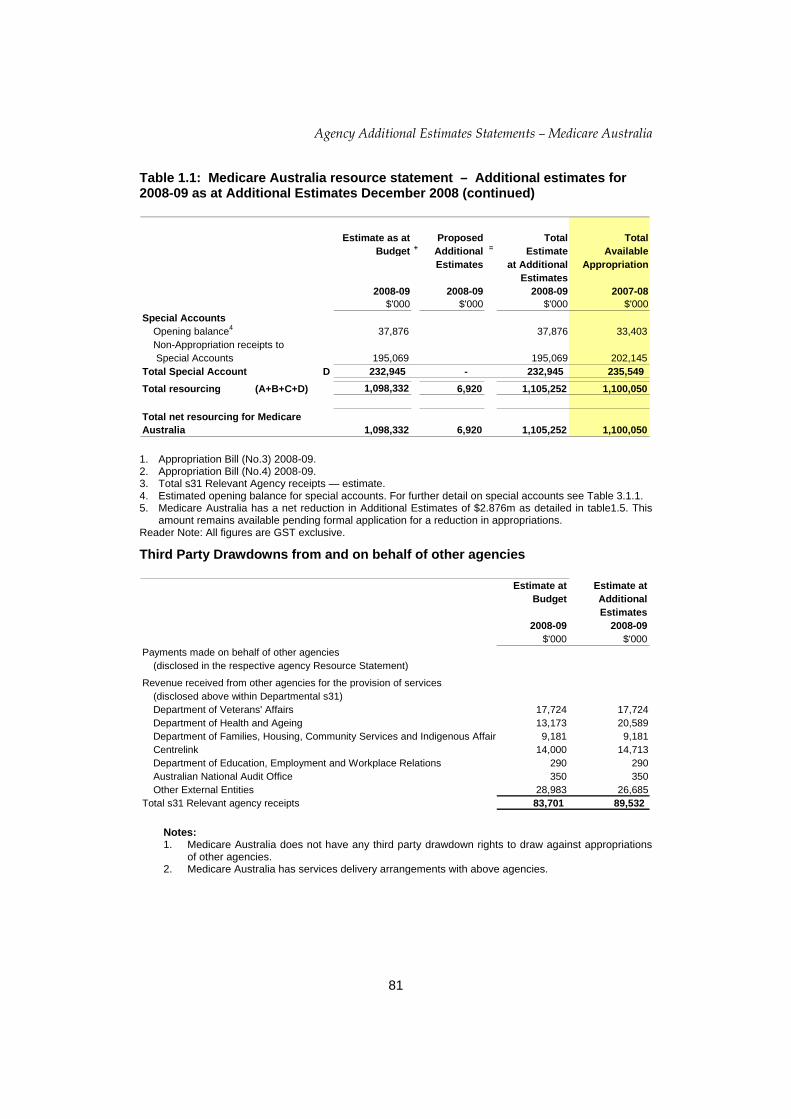
Agency Additional Estimates Statements – Medicare Australia
Table 1.1: Medicare Australia resource statement – Additional estimates for 2008-09 as at Additional Estimates December 2008 (continued)
Estimate as at Proposed Total TotalBudget + Additional = Estimate Available
Estimates at Additional AppropriationEstimates
2008-09 2008-09 2008-09 2007-08$'000 $'000 $'000 $'000
Special AccountsOpening balance4 37,876 37,876 33,403Non-Appropriation receipts to Special Accounts 195,069 195,069 202,145
Total Special Account D 232,945 - 232,945 235,549 Total resourcing (A+B+C+D) 1,098,332 6,920 1,105,252 1,100,050
Total net resourcing for Medicare Australia 1,098,332 6,920 1,105,252 1,100,050 1. Appropriation Bill (No.3) 2008-09. 2. Appropriation Bill (No.4) 2008-09. 3. Total s31 Relevant Agency receipts — estimate. 4. Estimated opening balance for special accounts. For further detail on special accounts see Table 3.1.1. 5. Medicare Australia has a net reduction in Additional Estimates of $2.876m as detailed in table1.5. This
amount remains available pending formal application for a reduction in appropriations. Reader Note: All figures are GST exclusive.
Third Party Drawdowns from and on behalf of other agencies
Estimate at Estimate atBudget Additional
Estimates2008-09 2008-09
$'000 $'000Payments made on behalf of other agencies
(disclosed in the respective agency Resource Statement)
Revenue received from other agencies for the provision of services(disclosed above within Departmental s31)Department of Veterans' Affairs 17,724 17,724Department of Health and Ageing 13,173 20,589Department of Families, Housing, Community Services and Indigenous Affair 9,181 9,181Centrelink 14,000 14,713Department of Education, Employment and Workplace Relations 290 290Australian National Audit Office 350 350Other External Entities 28,983 26,685
Total s31 Relevant agency receipts 83,701 89,532 Notes: 1. Medicare Australia does not have any third party drawdown rights to draw against appropriations
of other agencies. 2. Medicare Australia has services delivery arrangements with above agencies.
81
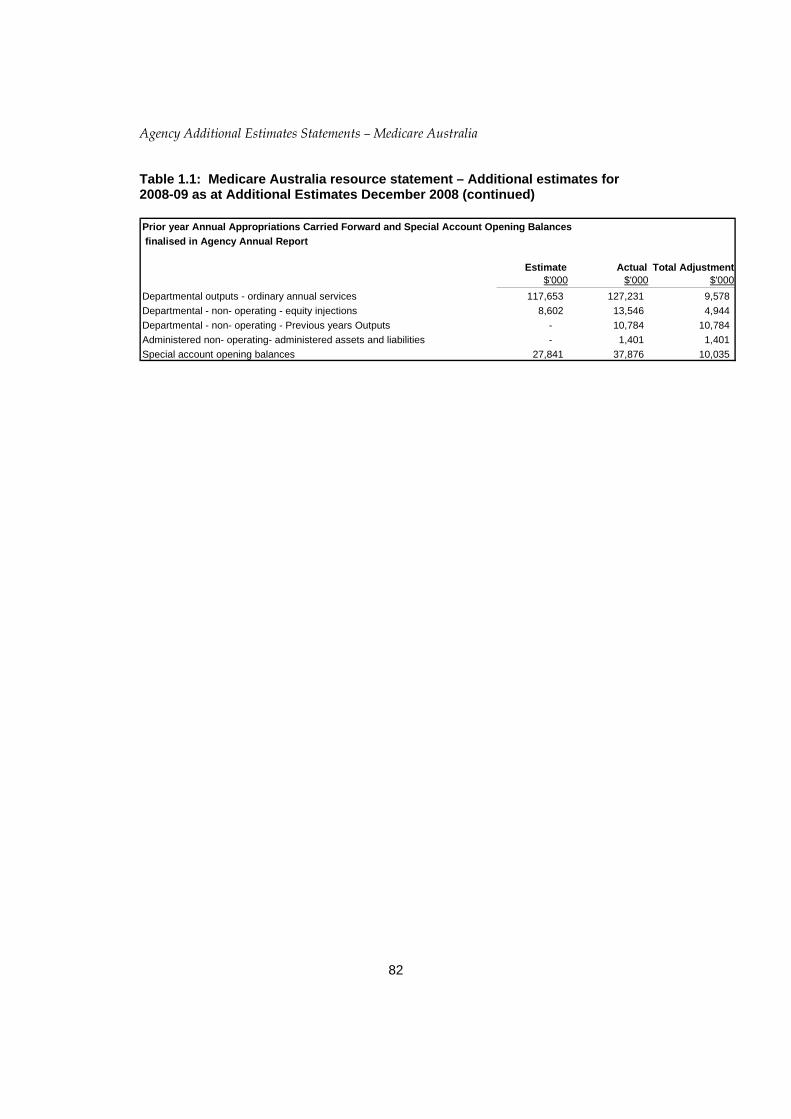
Agency Additional Estimates Statements – Medicare Australia
Table 1.1: Medicare Australia resource statement – Additional estimates for 2008-09 as at Additional Estimates December 2008 (continued)
Prior year Annual Appropriations Carried Forward and Special Account Opening Balances finalised in Agency Annual Report
Estimate Actual Total Adjustment$'000 $'000 $'000
Departmental outputs - ordinary annual services 117,653 127,231 9,578 Departmental - non- operating - equity injections 8,602 13,546 4,944 Departmental - non- operating - Previous years Outputs - 10,784 10,784 Administered non- operating- administered assets and liabilities - 1,401 1,401 Special account opening balances 27,841 37,876 10,035
82
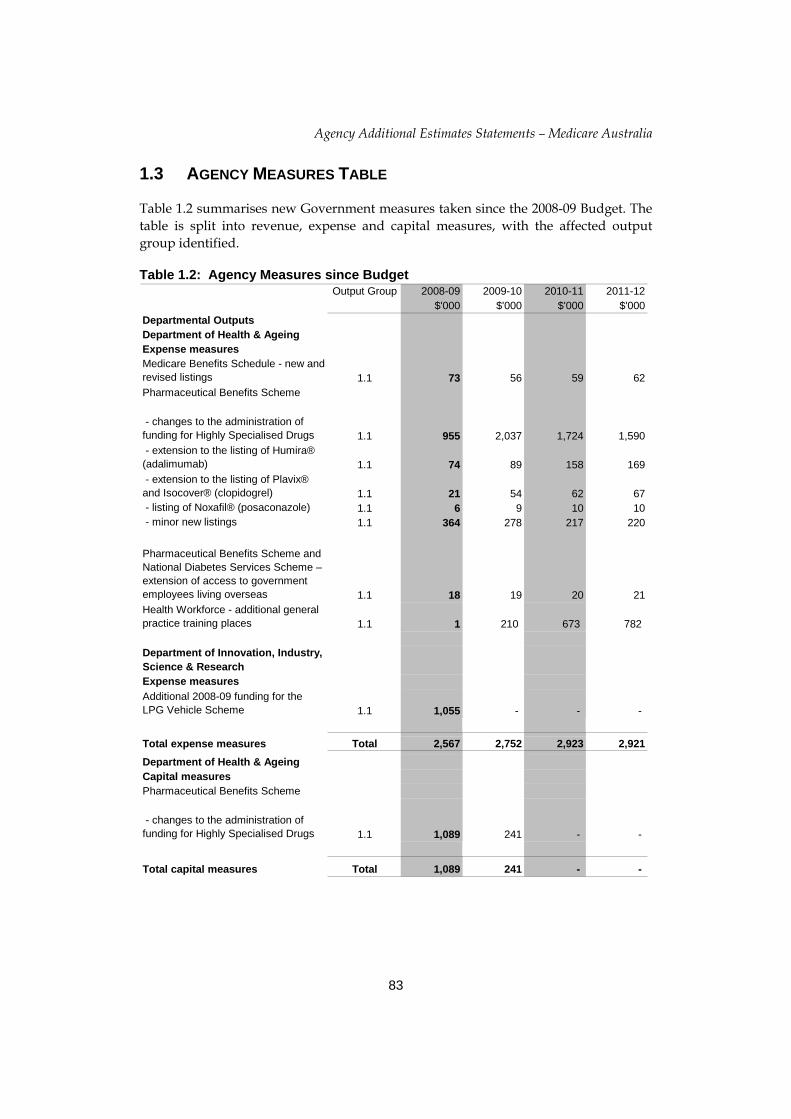
Agency Additional Estimates Statements – Medicare Australia
1.3 AGENCY MEASURES TABLE
Table 1.2 summarises new Government measures taken since the 2008-09 Budget. The table is split into revenue, expense and capital measures, with the affected output group identified.
Table 1.2: Agency Measures since Budget Output Group 2008-09 2009-10 2010-11 2011-12
$'000 $'000 $'000 $'000Departmental OutputsDepartment of Health & AgeingExpense measuresMedicare Benefits Schedule - new and revised listings 1.1 73 56 59 62Pharmaceutical Benefits Scheme
- changes to the administration of funding for Highly Specialised Drugs 1.1 955 2,037 1,724 1,590 - extension to the listing of Humira® (adalimumab) 1.1 74 89 158 169 - extension to the listing of Plavix® and Isocover® (clopidogrel) 1.1 21 54 62 67 - listing of Noxafil® (posaconazole) 1.1 6 9 10 - minor new listings 1.1 364 278 217 220
Pharmaceutical Benefits Scheme and National Diabetes Services Scheme – extension of access to government employees living overseas 1.1 18 19 20 21Health Workforce - additional general practice training places 1.1 1 210 673 782
Department of Innovation, Industry, Science & ResearchExpense measuresAdditional 2008-09 funding for the LPG Vehicle Scheme 1.1 1,055 - - -
Total expense measures Total 2,567 2,752 2,923 2,921Department of Health & AgeingCapital measuresPharmaceutical Benefits Scheme
- changes to the administration of funding for Highly Specialised Drugs 1.1 1,089 241 - -
Total capital measures Total 1,089 241 - -
10
83

Agency Additional Estimates Statements – Medicare Australia
1.4 ADDITIONAL ESTIMATES AND VARIATIONS
The following tables detail the changes to the resourcing for Medicare Australia at Additional Estimates, by outcome. Table 1.3 details the additional estimates and variations resulting from new measures since the 2008-09 Budget in Appropriation Bills No.3 and No.4. Table 1.4 details additional estimates or variations through other factors, such parameter adjustments.
Table 1.3: Additional estimates and variations to outcomes from measures since 2008-09 Budget
Output Group 2008-09 2009-10 2010-11 2011-12Impacted ($'000) ($'000) ($'000) ($'000)
Outcome 1Increase in estimates (departmental)
Medicare Benefits Schedule - new and revised listingsPharmaceutical Benefits Scheme 1.1 73 56 59 6 - changes to the administration of funding for Highly Specialised Drugs 1.1 2,044 2,570 2,070 1,935(adalimumab) 1.1 74 89 158 169
- extension to the listing of Plavix® and Isocover® (clopidogrel) 1.1 21 54 62 6 - listing of Noxafil® (posaconazole) 1.1 6 9 10 10
- minor new listings 1.1 364 278 217 220
Pharmaceutical Benefits Scheme and National Diabetes Services Scheme – extension of access to government employees living overseas 1.1 18 19 20 2Health Workforce - additional general practice training places 1.1 1 210 673 782
Additional 2008-09 funding for the LPG Vehicle Scheme 1.1 1,055 - - -
Net impact on estimates for Outcome 1 (departmental) 3,656 3,285 3,269 3,266
2
7
1
84

Agency Additional Estimates Statements – Medicare Australia
Table 1.4: Additional estimates and variations to outcomes from other variations
Output Group 2008-09 2009-10 2010-11 2011-12Impacted ($'000) ($'000) ($'000) ($'000)
Outcome 1Increase in estimates (departmental)
WCI Adjustment 1.1 2,855 3,569 4,341 Depreciation Expense reduction 1.1
Decrease in estimates (departmental)Change in MBS & PBS transaction volumes 1.1 (5,443) (6,830) (8,997) (11,174)
Net impact on estimates for Outcome 1 (departmental) (5,443) (3,975) (5,428) (6,833)
85
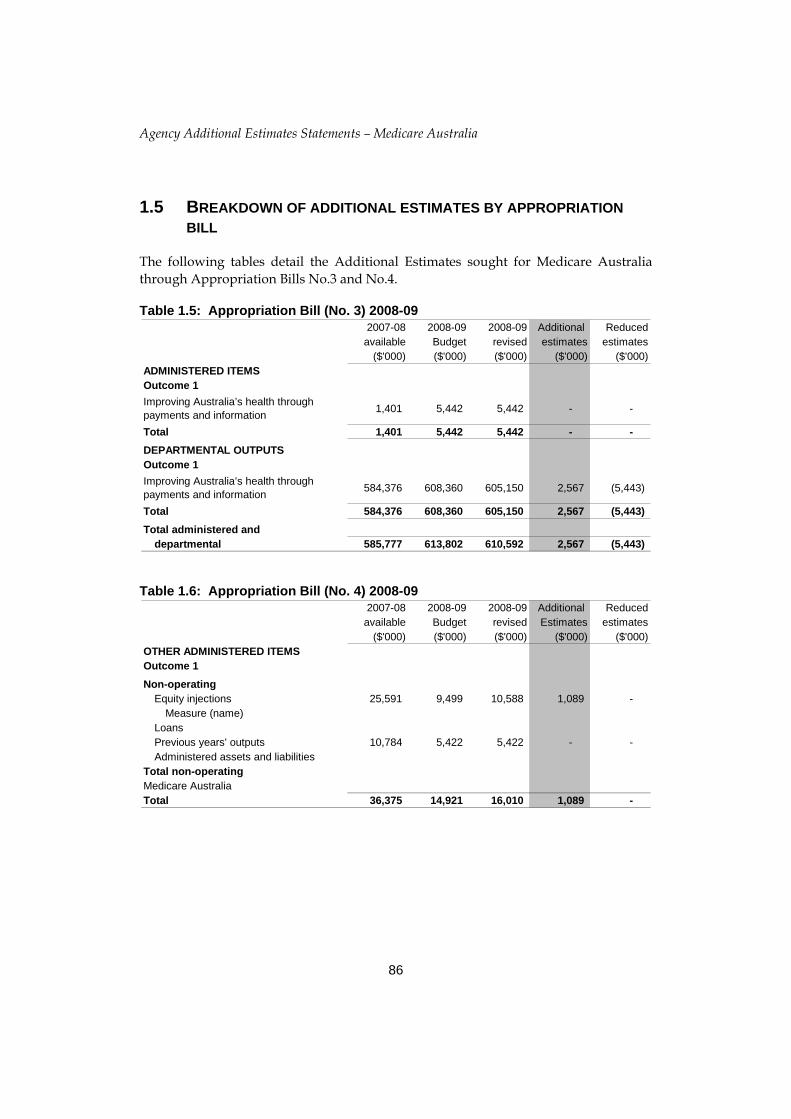
Agency Additional Estimates Statements – Medicare Australia
1.5 BREAKDOWN OF ADDITIONAL ESTIMATES BY APPROPRIATION BILL
The following tables detail the Additional Estimates sought for Medicare Australia through Appropriation Bills No.3 and No.4.
Table 1.5: Appropriation Bill (No. 3) 2008-09 2007-08 2008-09 2008-09 Additional Reduced
available Budget revised estimates estimates($'000) ($'000) ($'000) ($'000) ($'000)
ADMINISTERED ITEMSOutcome 1Improving Australia’s health through payments and information 1,401 5,442 5,442 - -
Total 1,401 5,442 5,442 - - DEPARTMENTAL OUTPUTSOutcome 1Improving Australia’s health through payments and information 584,376 608,360 605,150 2,567 (5,443)
Total 584,376 608,360 605,150 2,567 (5,443) Total administered and
departmental 585,777 613,802 610,592 2,567 (5,443)
Table 1.6: Appropriation Bill (No. 4) 2008-09 2007-08 2008-09 2008-09 Additional Reduced
available Budget revised Estimates estimates($'000) ($'000) ($'000) ($'000) ($'000)
OTHER ADMINISTERED ITEMSOutcome 1Non-operating
Equity injections 25,591 9,499 10,588 1,089 - Measure (name)
LoansPrevious years' outputs 10,784 5,422 5,422 - - Administered assets and liabilities
Total non-operatingMedicare AustraliaTotal 36,375 14,921 16,010 1,089 -
86
Agency Additional Estimates Statements – Medicare Australia
Section 2: Revisions to agency outcomes and planned performance
2.1 OUTCOMES AND PERFORMANCE INFORMATION
No changes have been made to Medicare Australia’s outcome structure and output group. Complete details of Medicare Australia’s Outcomes and Performance information can be found in the 2008-09 Portfolio Budget Statement.
Section 3: Explanatory tables and budgeted financial statements
3.1 EXPLANATORY TABLES 3.1.5 Estimates of special account flows
Special accounts provide a means to set aside and record amounts used for specified purposes. Table 3.1.1 shows the expected additions (receipts) and reductions (payments) for each account used by Medicare Australia. The corresponding table in the 2008-09 PB Statements is Table 3.1.3.
87

Agency Additional Estimates Statements – Medicare Australia Table 3.1.1: Estimates of special account flows
Opening Closingbalance Receipts Payments Adjustments balance2008-09 2008-09 2008-09 2008-09 2008-092007-08 2007-08 2007-08 2007-08 2007-08
Outcome $'000 $'000 $'000 $'000 $'000
Recovery of Compensation for Health Care & Other Services Special Account. (A)1
1 37,876 193,856 175,606 56,126
1 33,403 202,145 197,672 37,876
Other Trust Monies Account. (D)2 1 249 1,213 1,213 249
1 230 1,194 1,175 249
Total special accounts 2008-09 Budget estimate 38,125 195,069 176,819 - 56,375
Total special accounts2007-08 estimate actual 33,633 203,340 198,847 - 38,125
(A) = Administered (D) = Departmental 1. Legal Authority: FMA Act 1997 s20
Purpose – for the receipt of monies following a judgement or settlement, under the Health and Other Services Compensation Act 1995.
2. Legal Authority: FMA Act 1997 s20.
Purpose – for the expenditure of monies temporarily held on trust or otherwise for the benefit of a person other than the Commonwealth
3.1.6 Estimates of variations to Average Staffing Level
Changes in Average Staff Level (ASL) are presented in the Portfolio Additional Estimates Statements at the whole of agency level to demonstrate any movements since Budget. The ASL figures for Budget were reported in agency PB Statements in each Outcome Resourcing Table.
Table 3.1.2: Average Staffing Level (ASL) 2008-09 2008-09Budget Revised Variation
Outcome 1Improving Australia’s health through payments and information 5,286 5,201 (85)
88

Agency Additional Estimates Statements – Medicare Australia
3.2 BUDGETED FINANCIAL STATEMENTS 3.2.1 Analysis of budgeted financial statements
An analysis of Medicare Australia’s budgeted departmental financial statements is provided below.
Budgeted departmental statement of financial performance (see Table 3.2.1) Medicare Australia is budgeting for a breakeven result for 2008-09, compared to an actual 2007-08 result of a $6.3m loss. The departmental revenue estimate for 2008-09 is $696.0m which is an increase of $4.9m from the 2008-09 Budget.
The key revenue movement from the 2008-09 Budget is new expense measures totalling $2.7m, appropriation reductions of $5.4m for changes in Medicare service volumes and an increase in contract revenue of $8.1m.
Budgeted departmental statement of financial position (see Table 3.2.2) There are no material changes to the net asset position from the 2008-09 Budget.
Financial assets have increased by $12.9m to $166.0m from the 2008-09 Budget. The main increases were in accrued revenues ($3.5m), receivables ($5.8m), and cash and cash equivalents ($3.6m).
Non-financial assets have fallen by $17.9m from the 2008-09 Budget, mainly as a result of a decrease in infrastructure, plant and equipment asset of $5.8m to $2.0m, as well as a decrease in intangibles by $13.3m to $51.3m.
Employee provisions remain the main liability, increasing by $5.8m to $96.8m since the 2008-09 Budget.
89

Agency Additional Estimates Statements – Medicare Australia 3.2.2 Budgeted financial statements
Departmental financial statements
Table 3.2.1: Budgeted departmental income statement (for the period ended 30 June)
Actual Revised Forward Forward Forwardbudget estimate estimate estimate
2007-08 2008-09 2009-10 2010-11 2011-12$'000 $'000 $'000 $'000 $'000
INCOMERevenue
Revenues from Government 599,022 605,150 616,534 643,817 678,089 Goods and services 90,676 89,713 67,661 61,284 60,505 Rents 818 800 800 800 800
Total revenue 690,516 695,663 684,995 705,901 739,394 Gains
Net foreign exchange gains 3 - - - - Other 530 350 350 350 350
Total gains 533 350 350 350 350 Total income 691,049 696,013 685,345 706,251 739,744 EXPENSE
Employees 349,511 370,785 353,953 369,460 391,278 Suppliers 286,477 285,897 284,044 292,540 305,066 Depreciation and amortisation 47,838 39,331 47,348 44,251 43,400 Write-down of assets and
impairment of assets 12,130 - - - - Net losses from sale of assets 1,061 - - - - Net foreign exchange losses 3 - - - - Other 306 - - - -
Total expenses 697,326 696,013 685,345 706,251 739,744 Operating result before Income Tax (6,277) - - - -
Income Tax expense - - - - - Net operating result (6,277) - - - -
Net surplus or (deficit) attributable to the Australian Government (6,277) - - - -
Prepared on Australian Accounting Standards basis.
90
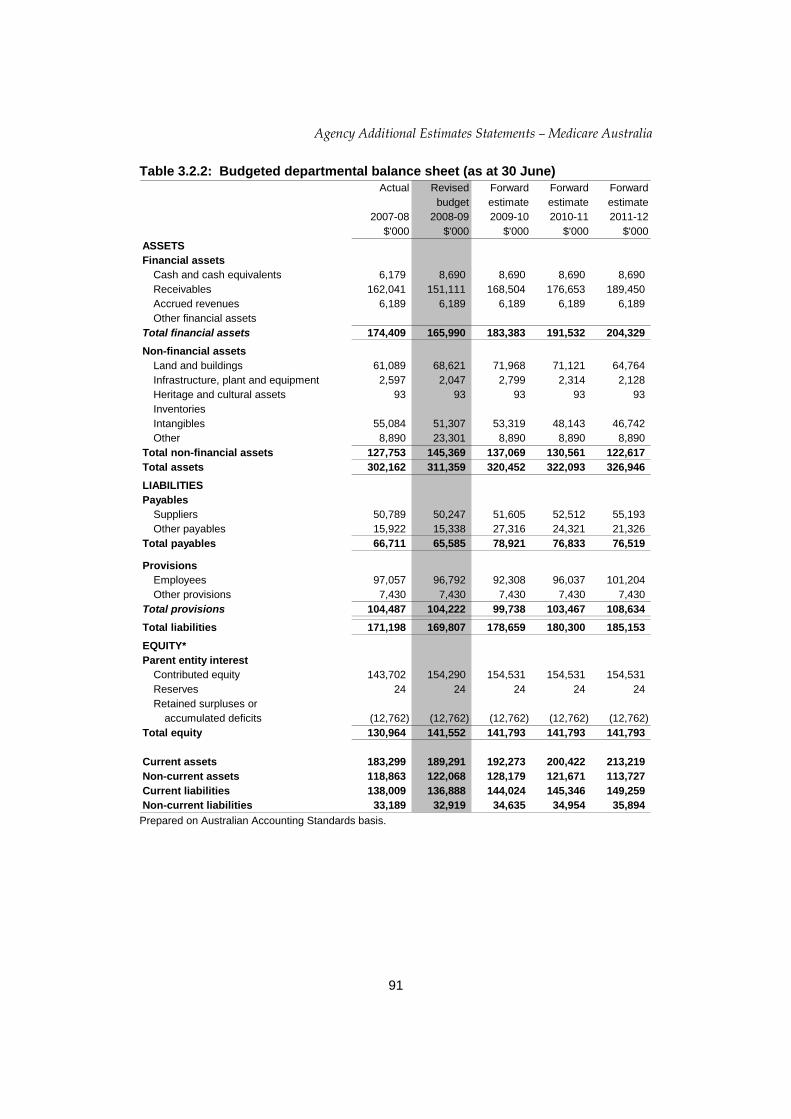
Agency Additional Estimates Statements – Medicare Australia
Table 3.2.2: Budgeted departmental balance sheet (as at 30 June) Actual Revised Forward Forward Forward
budget estimate estimate estimate2007-08 2008-09 2009-10 2010-11 2011-12
$'000 $'000 $'000 $'000 $'000ASSETSFinancial assets
Cash and cash equivalents 6,179 8,690 8,690 8,690 8,690 Receivables 162,041 151,111 168,504 176,653 189,450 Accrued revenues 6,189 6,189 6,189 6,189 6,189 Other financial assets
Total financial assets 174,409 165,990 183,383 191,532 204,329 Non-financial assets
Land and buildings 61,089 68,621 71,968 71,121 64,764 Infrastructure, plant and equipment 2,597 2,047 2,799 2,314 2,128 Heritage and cultural assets 93 93 93 93 93 InventoriesIntangibles 55,084 51,307 53,319 48,143 46,742 Other 8,890 23,301 8,890 8,890 8,890
Total non-financial assets 127,753 145,369 137,069 130,561 122,617 Total assets 302,162 311,359 320,452 322,093 326,946 LIABILITIESPayables
Suppliers 50,789 50,247 51,605 52,512 55,193 Other payables 15,922 15,338 27,316 24,321 21,326
Total payables 66,711 65,585 78,921 76,833 76,519
ProvisionsEmployees 97,057 96,792 92,308 96,037 101,204 Other provisions 7,430 7,430 7,430 7,430 7,430
Total provisions 104,487 104,222 99,738 103,467 108,634 Total liabilities 171,198 169,807 178,659 180,300 185,153 EQUITY*Parent entity interest
Contributed equity 143,702 154,290 154,531 154,531 154,531 Reserves 24 24 24 24 24 Retained surpluses or
accumulated deficits (12,762) (12,762) (12,762) (12,762) (12,762) Total equity 130,964 141,552 141,793 141,793 141,793
Current assets 183,299 189,291 192,273 200,422 213,219 Non-current assets 118,863 122,068 128,179 121,671 113,727 Current liabilities 138,009 136,888 144,024 145,346 149,259 Non-current liabilities 33,189 32,919 34,635 34,954 35,894
Prepared on Australian Accounting Standards basis.
91
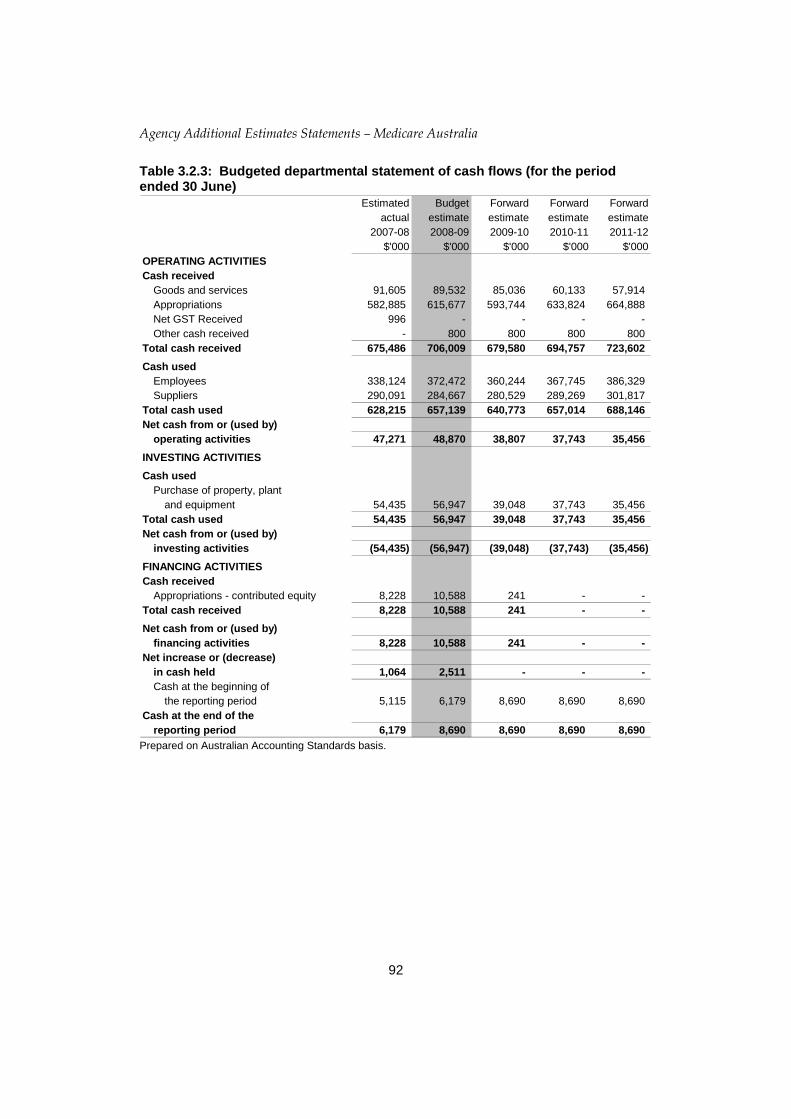
Agency Additional Estimates Statements – Medicare Australia Table 3.2.3: Budgeted departmental statement of cash flows (for the period ended 30 June)
Estimated Budget Forward Forward Forwardactual estimate estimate estimate estimate
2007-08 2008-09 2009-10 2010-11 2011-12$'000 $'000 $'000 $'000 $'000
OPERATING ACTIVITIESCash received
Goods and services 91,605 89,532 85,036 60,133 57,914 Appropriations 582,885 615,677 593,744 633,824 664,888 Net GST Received 996 - - - - Other cash received - 800 800 800 800
Total cash received 675,486 706,009 679,580 694,757 723,602 Cash used
Employees 338,124 372,472 360,244 367,745 386,329 Suppliers 290,091 284,667 280,529 289,269 301,817
Total cash used 628,215 657,139 640,773 657,014 688,146 Net cash from or (used by)
operating activities 47,271 48,870 38,807 37,743 35,456 INVESTING ACTIVITIESCash used
Purchase of property, plant and equipment 54,435 56,947 39,048 37,743 35,456
Total cash used 54,435 56,947 39,048 37,743 35,456 Net cash from or (used by)
investing activities (54,435) (56,947) (39,048) (37,743) (35,456) FINANCING ACTIVITIESCash received
Appropriations - contributed equity 8,228 10,588 241 - - Total cash received 8,228 10,588 241 - - Net cash from or (used by)
financing activities 8,228 10,588 241 - - Net increase or (decrease)
in cash held 1,064 2,511 - - - Cash at the beginning of
the reporting period 5,115 6,179 8,690 8,690 8,690 Cash at the end of the
reporting period 6,179 8,690 8,690 8,690 8,690 Prepared on Australian Accounting Standards basis.
92
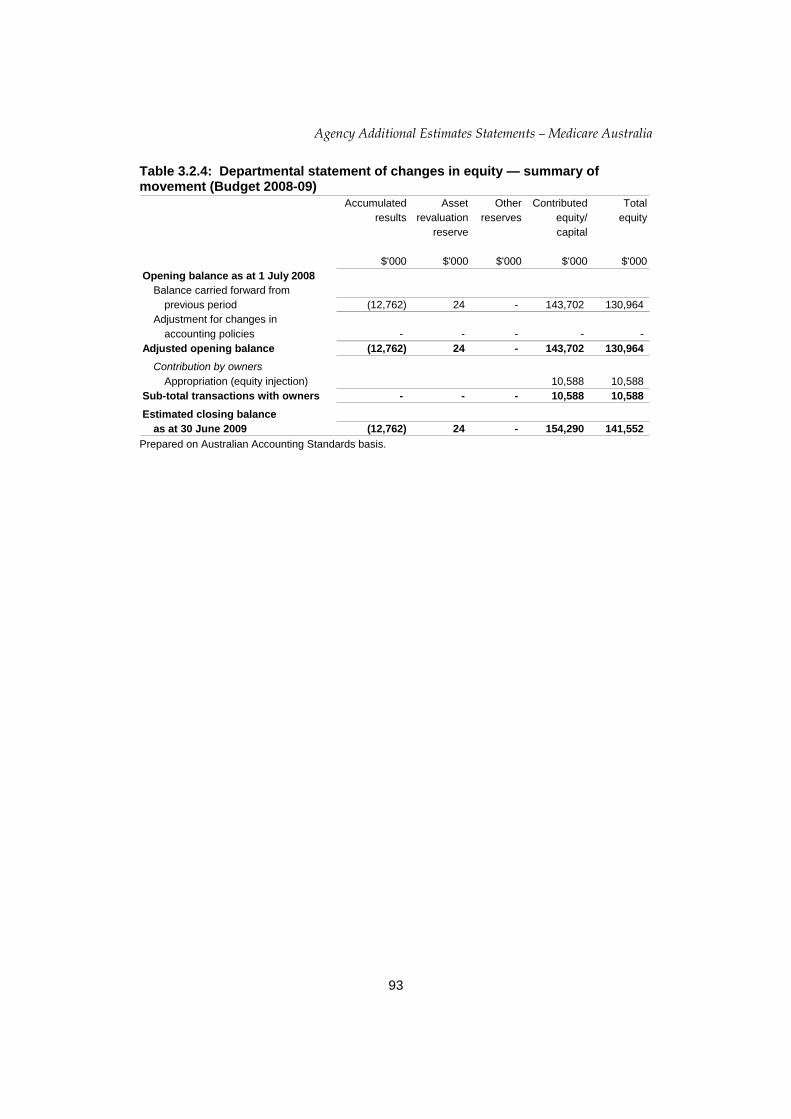
Agency Additional Estimates Statements – Medicare Australia
Table 3.2.4: Departmental statement of changes in equity — summary of movement (Budget 2008-09)
Accumulated Asset Other Contributed Totalresults revaluation reserves equity/ equity
reserve capital
$'000 $'000 $'000 $'000 $'000Opening balance as at 1 July 2008
Balance carried forward fromprevious period (12,762) 24 - 143,702 130,964
Adjustment for changes inaccounting policies - - - - -
Adjusted opening balance (12,762) 24 - 143,702 130,964 Contribution by owners
Appropriation (equity injection) 10,588 10,588 Sub-total transactions with owners - - - 10,588 10,588 Estimated closing balance
as at 30 June 2009 (12,762) 24 - 154,290 141,552 Prepared on Australian Accounting Standards basis.
93

Agency Additional Estimates Statements – Medicare Australia Schedule of administered activity
Table 3.2.5: Schedule of budgeted income and expenses administered on behalf of government (for the period ended 30 June)
Actual Revised Forward Forward Forwardbudget estimate estimate estimate
2007-08 2008-09 2009-10 2010-11 2011-12$'000 $'000 $'000 $'000 $'000
INCOME ADMINISTERED ONBEHALF OF GOVERNMENT
RevenueTaxationTotal taxation - - - - -
Non-taxationTotal non-taxation - - - - - Total revenues administered
on behalf of Government - - - - -
GainsTotal gains administered
on behalf of Government - - - - -
Total income administered - - - - - on behalf of Government
EXPENSES ADMINISTERED ONBEHALF OF GOVERNMENTGrants 1,401 5,442 3,742 - -
Total expenses administeredon behalf of Government 1,401 5,442 3,742 - -
Prepared on Australian Accounting Standards basis.
94

Agency Additional Estimates Statements – Medicare Australia
Table 3.2.6: Schedule of budgeted assets and liabilities administered on behalf of government (as at 30 June)
Actual Revised Forward Forward Forwardbudget estimate estimate estimate
2007-08 2008-09 2009-10 2010-11 2011-12$'000 $'000 $'000 $'000 $'000
ASSETS ADMINISTERED ON BEHALF OF GOVERNMENT
Financial assetsReceivables - 1,266 501 - -
Total financial assets - 1,266 501 - - Total assets administered
on behalf of Government - 1,266 501 - - LIABILITIES ADMINISTERED ON
BEHALF OF GOVERNMENTPayables
Grants 1,401 1,266 501 - - Total payables 1,401 1,266 501 - -
Liabilities included in disposalgroups held for sale - - - - -
Total liabilities administeredon behalf of Government 1,401 1,266 501 - -
Prepared on Australian Accounting Standards basis.
95

Agency Additional Estimates Statements – Medicare Australia
Table 3.2.7: Schedule of budgeted administered cash flows (for the period ended 30 June)
Actual Revised Forward Forward Forwardbudget estimate estimate estimate
2007-08 2008-09 2009-10 2010-11 2011-12$'000 $'000 $'000 $'000 $'000
OPERATING ACTIVITIESTotal cash received - - - - - Cash used
Grant payments - 5,049 4,507 501 - Total cash used - 5,049 4,507 501 - Net cash from or (used by)
operating activities - (5,049) (4,507) (501) -
Net increase or (decrease) in cash held - (5,049) (4,507) (501) - Cash at beginning of reporting period - - - - - Cash from Official Public Account for:
- appropriations - 5,049 4,507 501 - Cash at end of reporting period - - - - - Prepared on Australian Accounting Standards basis.
96

Agency Additional Estimates Statements – Medicare Australia
3.2.3 Notes to the financial statements The financial statements reflect the entries to the Central Budget Management System (CBMS) as at November 2008.
Basis of accounting
Medicare Australia’s budget statements have been prepared in accordance with the Australian Equivalents to International Financial Reporting Standards (AEIFRS) and other Finance guidelines.
Assets and liabilities are recognised in the Balance Sheet when and only when it is probable that future economic benefits will flow and the amounts of the assets or liabilities can be reliably measured.
Revenues and expenses are recognised in the Income Statement when and only when the flow or consumption or loss of economic benefits can be reliably measured.
97

PORTFOLIO GLOSSARY Term Meaning
Accrual accounting System of accounting where items are brought to account and included in the financial statements as they are earned or incurred, rather than as they are received or paid.
Accumulated depreciation The aggregate depreciation recorded for a particular depreciating asset.
Administered items Expenses, revenues, assets or liabilities managed by agencies on behalf of the Commonwealth. Agencies do not control administered items. Administered expenses include grants, subsidies and benefits. In many cases, administered expenses fund the delivery of third party outputs.
Additional estimates Where amounts appropriated at Budget time are insufficient, Parliament may appropriate more funds to portfolios through the Additional Estimates Acts.
Appropriation An authorisation by Parliament to spend moneys from the Consolidated Revenue Fund for a particular purpose.
Annual Appropriation Two appropriation Bills are introduced into Parliament in May and comprise the Budget for the financial year beginning 1 July. Further Bills are introduced later in the financial year as part of the additional estimates. Parliamentary departments have their own appropriations.
Capital expenditure Expenditure by an agency on capital projects, for example purchasing a building.
Consolidated Revenue Fund Section 81 of the Constitution stipulates that all revenue raised or money received by the Commonwealth forms the one consolidated revenue fund (CRF). The CRF is not a bank account. The
98
Glossary
Official Public Account reflects most of the operations of the CRF.
Departmental items Assets, liabilities, revenues and expenses that are controlled by the agency in providing its outputs. Departmental items would generally include computers, plant and equipment assets used by agencies in providing goods and services and most employee expenses, supplier costs and other administrative expenses incurred.
Depreciation Apportionment of an asset’s capital value as an expense over its estimated useful life to take account of normal usage, obsolescence, or the passage of time.
Effectiveness indicators Measures the joint or independent contribution of outputs and administered items to the achievement of their specified outcome.
Efficiency indicators Measures the adequacy of an agency’s management of its outputs (and where applicable, administered items). Includes price, quality and quantity indicators. The interrelationship between the three efficiency indicators of any one output should be considered when judging efficiency.
Equity or net assets Residual interest in the assets of an entity after deduction of its liabilities.
Expense Total value of all of the resources consumed in producing goods and services or the loss of future economic benefits in the form of reductions in assets or increases in liabilities of an entity.
Fair value Valuation methodology: the amount for which an asset could be exchanged, or a liability settled, between knowledgeable and willing parties in an arm’s length transaction. The fair value can be affected by the conditions of the sale, market conditions and the intentions of the asset holder.
Intermediate outcomes More specific medium-term impacts (for example,. trend data, targets or milestones) below the level of the planned outcomes specified in the Budget. A combination of several intermediate outcomes can
99
Glossary
at times be considered as a proxy for determining the achievement of outcomes or progress towards outcomes. (see outcomes)
Operating result Equals revenue less expense.
Outcomes The Government’s objectives in each portfolio area. Outcomes are desired results, impacts or consequences for the Australian community as influenced by the actions of the Australian Government. Actual outcomes are assessments of the end-results or impacts actually achieved.
Output groups A logical aggregation of agency outputs, where useful, and based either on homogeneity, type of product, business line or beneficiary target group. Aggregation of outputs may also be needed for the provision of adequate information for performance monitoring, or based on a materiality test.
Outputs The goods and services produced by agencies on behalf of government for external organisations or individuals. Outputs also include goods and services for other areas of government external to the agency.
Price One of the three key efficiency indicators. The amount the government or the community pays for the delivery of agreed outputs.
Quality One of the three key efficiency indicators. Relates to the characteristics by which customers or stakeholders judge an organisation, product or service. Assessment of quality involves use of information gathered from interested parties to identify differences between user’s expectations and experiences.
Quantity One of the three key efficiency indicators. Examples include: the size of an output; count or volume measures; how many or how much.
Revenue Total value of resources earned or received to cover the production of goods and services.
100
Glossary
Special Account Balances existing within the Consolidated Revenue Fund (CRF) that are supported by standing appropriations (Financial Management and Accountability (FMA) Act 1997, subsection 20 and 21). Special accounts allow money in the CRF to be acknowledged as set-aside (hypothecated) for a particular purpose. Amounts credited to a Special Account may only be spent for the purposes of the Special Account. Special Accounts can only be established by a written determination of the Finance Minister (section 20 FMA Act) or through an Act of Parliament (referred to in section 21 of the FMA Act).
Special Appropriations (including Standing Appropriations)
An amount of money appropriated by a particular Act of Parliament for a specific purpose and number of years. For special appropriations the authority to withdraw funds from the Consolidated Revenue Fund does not generally cease at the end of the financial year.
Standing appropriations are a sub-category consisting of ongoing special appropriations— the amount appropriated will depend on circumstances specified in the legislation.
101