profile of paes recipients and factors that influence paes … · mental health and substance abuse...
TRANSCRIPT

`
San Francisco Department of Human Services County Adult Assistance Programs
Personal Assisted Employment Services Program
Profile of PAES Recipients and
Factors That Influence PAES Outcomes Analysis of PAES Recipients Enrolled Jan 99 - Jun 00
Presented to
Dorothy Enisman, Program Director County Adult Assistance Programs – Department of Human Services
Barbara A. Garcia, MPA, Deputy Director of Health
Community Programs – Department of Public Health
January 31, 2003
Presented by the PAES Analysis Team
Randy Reiter, Ph.D., MPH, Department of Public Health Maria X. Martinez, Department of Public Health
Thomas Neill, Ph.D., Department of Human Services Carol Chapman, M.A., Department of Public Health
Saumitra Sengupta, Ph.D., Department of Public Health
PAES Analysis Team
Randy Reiter, Ph.D., MPH Senior Health Planner and Epidemiologist, Population Health Assessment
San Francisco Department of Public Health
Maria X. Martinez Deputy Director, Community Programs
San Francisco Department of Public Health
Thomas Neill, Ph.D. Manager of Behavioral Health Services, County Adult Assistance Program
San Francisco Department of Human Services
Carol Chapman, M.A. Program Analyst, Community Substance Abuse Services
San Francisco Department of Public Health
Saumitra Sengupta, Ph.D. Research Psychologist, Community Mental Health Services
San Francisco Department of Public Health
With assistance from:
Po Yee Lindahl PAES Program Analyst
San Francisco Department of Public Health
Ann S. Santos Epidemiologist I, Community Substance Abuse Services
San Francisco Department of Public Health
Annette Goldman-Mosqueda Consultant (Focus Groups)
Dan Najjar
Consultant (Programmer Analyst)
A pdf copy of this complete report is available at www.dph.sf.ca.us – select “get reports and data” – select “health assessments and data”

SFDPH/SFDHS – (415) 255-3706 – January 31, 2003 Table of Contents – Page I
Table of Contents

Section Page
SFDPH/SFDHS – (415) 255-3706 – January 31, 2003 Table of Contents – Page II
Introduction ........................................................................................................ 1 Background.............................................................................................................................. 2
Personal Assisted Employment Services (PAES) SSI Pending (SSIP) Program General Assistance (GA) Cash Aid Linked to Medi-Cal (CALM)
Progression through PAES ......................................................................................................... 2 Phase I: The Appraisal Period Phase II: The Employment Plan Phase III: Employment Retention
Purposes of the Analysis............................................................................................................ 3 Goals Objectives Cohort and Time Period
Participant Outcome Measures................................................................................................... 5 Favorable Outcomes
Through Employment Through Other Income Sources
Unfavorable Outcomes Through Non-Compliance Through Transfer to GA Neutral Outcomes
Program Performance Indicator – Favorable Outcome Ratios (FORs)............................................. 6 Employment FOR Other Income FOR Total FOR
Data Presentation..................................................................................................................... 6 Cox Regression Modeling........................................................................................................... 7 Focus Groups ........................................................................................................................... 8 Limitations to Data Elements and Data Collection ........................................................................ 7 Limits to Interpreting Results..................................................................................................... 9
Summary of Findings......................................................................................... 10
PAES Performance ...................................................................................................................11 Employment Histories ..............................................................................................................11 PAES Program Involvement ......................................................................................................12 Demographics .........................................................................................................................13 Housing Status ........................................................................................................................15 Behavioral Health Histories.......................................................................................................16 Joint Effects of Housing and Behavioral Health...........................................................................21
Recommendations
Recommendations for the PAES Program...................................................................................23 Recommendations for the Ongoing Assessment of PAES .............................................................25

Section Page
SFDPH/SFDHS – (415) 255-3706 – January 31, 2003 Table of Contents – Page III
Results of Data Analysis
PAES Program Performance......................................................................................................31 Status of PAES Participants Performance Outcomes Changes in Outcome Status
Employment Histories and PAES Program Involvement ...............................................................34
Part-time Employment Status PAES Program Status
Length of Stay in PAES Employment Services Repeat Episodes in PAES Program
PAES Employment Services PAES Vocational Rehab Services Dental Services PAES-subsidized Behavioral Health Services
Demographics .........................................................................................................................40 Gender Ethnicity / Race Preferred Language Age Other Characteristics
Housing Status ......................................................................................................................44
Behavioral Health Histories.......................................................................................................46 Participants with No Known Behavioral Health Disorders Participants with Known Behavioral Health Disorders Types of Behavioral Health Disorders Mental Health Disorders ...............................................................................................50
Types of Mental Health Disorders Severity of Mental Health Problem: Global Assessment of Functioning Modalities of Mental Health Treatment Received
Substance Abuse Disorders...........................................................................................53 Types and Numbers of Substances in Substance Abuse Disorders
Modalities of Substance Abuse Treatment Methadone Maintenance Number of Substance Abuse Treatment Episodes
Joint Effects of Housing Status and Behavioral Health Histories ...................................................58 Summary Psycho-Social Disability Index
Multivariate Analysis Using the Cox Regression Model .................................................................62

Section Page
SFDPH/SFDHS – (415) 255-3706 – January 31, 2003 Table of Contents – Page IV
Results of Focus Groups
Summary................................................................................................................................65 Summary of Strengths and Barriers Identified Summary of Recommendations Summary Table of Focus Group Results
Strengths, Barriers, Recommendations from Focus Groups..........................................................68 Behavioral Health Housing and Homelessness Job Qualifications Legal Physical Health Contextual Factors Resources Cultural Systems Communication Staff Training
Outreach and Promotion Appendices Methodology – Psycho-Social Disability Index ........................................................................... Appendix 1 Methodology – Data ............................................................................................................... Appendix 2 Methodology – Focus Groups................................................................................................... Appendix 3 Results – Bivariate Analysis – Descriptive Tables ....................................................................... Appendix 4 Results – Focus Group – Strengths Table..................................................................................Appendix 5 Results – Focus Group – Barriers Table .................................................................................... Appendix 6 Results – Focus Group – Recommendations Table ..................................................................... Appendix 7 DSM IV Diagnostic Codes and Classifications Table.................................................................... Appendix 8 CSAS Substance Classifications Table .......................................................................................Appendix 9

SFDPH/SFDHS – (415) 255-3706 – January 31, 2003 Page 1
Introduction
Introduction
SFDPH/SFDHS – (415) 255-3706 – January 31, 2003 Page 2
Background Since the 1930s, the City and County of San Francisco has provided cash subsistence awards to its indigent single adults. Indigent adults are those who have no personal assets and do not qualify for other State or Federal benefits; that is, they have no disability coverage and are not parents of dependent children. These grants are administered by the Department of Human Services (DHS) and, prior to 1998, were known as General Assistance (GA). In 1998, following AFDC welfare reforms and the creation of CalWORKs, the San Francisco Board of Supervisors instituted its own reforms to the GA Program and created the County Adult Assistance Programs (CAAP). The County Adult Assistance Programs (CAAP) ordinance created four primary programs to serve the diverse needs within the former General Assistance population. Built into the programs was the recognition that many welfare recipients want to and can become employed if given the right opportunity, while others with enduring disabilities were unlikely to do so. CAAP Programs include:
1. Personal Assisted Employment Services (PAES) Program – a welfare-to-work program that assists clients in their transition to self-sufficiency. Incentives to participate include an increased grant and an opportunity to access specialty services. Currently the cash grant is $395 per month, although at the time of the cohort period studied in this report, the cash grant was $345.
2. SSI Pending (SSIP) Program – a program allowing clients who are potentially eligible for Social Security benefits to remain on county assistance while their Social Security applications are adjudicated. [Currently $395, formerly $345]
3. General Assistance (GA) – the safety net for indigent individuals who are not eligible for SSI and choose not to engage in employment activities. [Currently $320, formerly $290]
4. Cash Aid Linked to Medi-Cal (CALM) – a program that provides financial support to elderly and disabled immigrants who receive Medi-Cal but are not eligible for Social Security benefits following the limitations enacted by Congress in 1996. [Currently $395, formerly $345]
Progression through PAES Phase I: The Appraisal Period Before an individual becomes a PAES recipient, he or she must attend a four-hour class once weekly for three months. The focus is on soft skill development, e.g., identifying and describing job skills and practicing effective job interview skills. In addition, the classes aim to help recipients improve self-esteem and motivation. The Appraisal Training Program began in December 1998, and the first clients graduated in February 1999. Phase II: The Employment Plan Following completion of the Appraisal Period, recipients begin meeting with employment specialists who help develop plans for moving towards economic self-sufficiency. The employment specialist

Introduction
SFDPH/SFDHS – (415) 255-3706 – January 31, 2003 Page 3
functions as a vocational case manager brokering DHS-subsidized and other-funded vocational services for the recipient including:
1. Vocational assessments, soft skills education, vocational training, and job placement services.
2. Housing Subsidies – recognizing that the lack of affordable housing posed a potential barrier to employment, DHS contracted with the Tenderloin Housing Clinic (THC) to broker housing for homeless clients in single room occupancy hotels and subsidized the rent to meet the fair market value. THC began with 270 available rooms, gradually increasing during the first two years of PAES depending on negotiations to enroll additional hotels. The number of available rooms was adequate until December 2000 when a waiting list of 33 clients was established.
3. Behavioral Health Services, including on-site outpatient therapy for mental health and substance abuse problems, plus off-site intensive services that include residential treatment and methadone maintenance. Employment specialists refer participants to the onsite program and participation is voluntary on the part of the PAES participant. Costs of therapy and counseling are subsidized by DHS.
4. Dental Services and Optical Benefits that are not available elsewhere through DPH are also made available and subsidized by DHS.
PAES clients may remain in this phase for 27 months or until their employment income exceeds a threshold amount, whichever comes first. PAES has an “income disregard program” that gradually decreases the grant amount as a recipient’s income rises. PAES participants stop receiving county benefits through PAES when their income is slightly greater than twice the PAES grant. The current grant is $395 per month and a recipient’s grant is stopped when his or her income exceeds $846. During the evaluation period, the PAES grant was $345 per month and the grant stopped when the participant’s income exceeded $800. Phase III: Employment Retention Once a PAES participant is employed and has not received a cash grant for three months, he or she transfers from the employment specialist to a retention specialist. The goal of retention services is to help employed participants retain employment. For the first 12 months of retention, participants are eligible for the same array of vocational, housing, treatment, dental, and vision services as when they were with an employment specialist (although the cash grants cease). At the end of 12 months supportive vocational counseling may be renewed for an additional 12 months. Retention services were implemented in December 1999 – 11 months after the PAES Program began.
Purpose of the Analysis Research supports a variety of vocational rehabilitation approaches (Bond, et. al. 2001; Cook, 1995; Henry, Barreira, Banks, Brown, & McKay, 2001.), but regardless of the approach, most people with serious behavioral health issues work in part-time entry-level jobs for an average of only six months (Bonds, Drake, Becker & Moueser 1999.). For this reason, DHS work-ordered funds to the Department of Public Health (DPH) to develop behavioral health programs that would

Introduction
SFDPH/SFDHS – (415) 255-3706 – January 31, 2003 Page 4
meet the distinct need of PAES participants. Beginning in January 1999, outpatient therapy for mental health and substance abuse problems was implemented at the PAES program site. Both the Department of Human Services (DHS) and the Department of Public Health (DPH) knew something of the profiles and behavioral health needs of the General Assistance population, but disabilities of PAES participants – i.e., the subset of CAAP clients wishing to transition from welfare-to-work – were not known. In June 2000, DPH and DHS allocated resources to determine if the profile could be developed. A team comprised of both DHS and DPH research, evaluation, and management staff was organized to analyze the available data sets. Work proceeded with the understanding that a cross-departmental data analysis was unprecedented, and the descriptive or predictive qualities of the limited data available could not be guaranteed, but needed to be determined. Goals The goals of the analysis were to:
1. Create profiles of PAES participants, especially regarding behavioral health characteristics 2. Identify associations, if possible, between client characteristics and courses of progress in
PAES 3. Identify characteristics related to program outcomes that can be used in the design of
future programs, services, requests for proposals, and provider contracts 4. Aid both departments in developing specifications for improving their data management
systems Objectives To achieve the goals, the objectives of the analysis were to:
1. Locate existing data sources and determine the extent to which they could be used 2. Define useful data elements from the data available 3. Define stages of progress in PAES 4. Develop outcome measures for PAES participants and the program 5. Develop analytical tools and methods of analysis that consider the effects of history on
the PAES program’s implementation 6. Evaluate PAES participant characteristics, including demographics, behavioral health
histories, service histories, and progress in PAES over time 7. Determine the extent to which any of these characteristics impacted the likelihood of
“success” or “failure” in PAES 8. Recommend ways PAES might provide and monitor services to better meet the needs of
PAES clients 9. Recommend ways DHS might improve data collection and analysis for on-going
performance monitoring of the PAES program Cohort and Time Period 2,930 PAES recipients who were first enrolled in PAES during the 18-month period January 1999 through June 2000 were studied using DHS and DPH data covering the 24-month period January 1999 through December 2000.

Introduction
SFDPH/SFDHS – (415) 255-3706 – January 31, 2003 Page 5
Participant Outcome Measures When a cohort member stopped receiving PAES cash benefits – or was “discontinued,” as is termed by DHS – the Team used monthly CDS records to classify the recipient into the following possible outcomes. The categories reflect DHS goals for PAES clients, as determined from discussion with DHS staff. (See footnote below1 and Appendix 2, Page 5 for codes used to classify outcomes.) 1. Favorable Outcome
a. Favorable Outcome Through Employment – Participants who were discontinued because they had achieved employment and their wages exceeded the DHS eligibility limits (also known as “income threshold”) to receive cash assistance. Attained – Participants who achieved the income threshold during the study period
regardless of their status as of December 2000. Attained, maintained – Participants who achieved the income threshold and were still
so classified as of December 2000. b. Favorable Outcome Through Other Income – Participants who were discontinued because
they reached the monthly income threshold through other income sources, such as Social Security Income, Veteran’s Benefits, or were transferred to SSIP or CALM.
2. Unfavorable Outcome
a. Unfavorable Outcome Through Non-Compliance - Participants who became ineligible due to program noncompliance or fraud. When participants disappeared without notice, they were given this status. However, since it is unknown if these participants were employed or not employed at time of discontinuance, this is a potential source of error inherent in currently available data.
b. Unfavorable Outcome Through Transfer to GA - Participants who transferred to, or back to, General Assistance.
3. Neutral Outcome
Participants who were discontinued because they had become ineligible to receive benefits due to institutionalization, death, departing the county, or otherwise becoming ineligible for PAES for reasons other than those determined favorable or unfavorable as above.
1 Note that: i. Active PAES participants who were receiving cash benefits as of Dec 2000 were not assigned an outcome. ii. An outcome was assigned if the participant was discontinued from the PAES program during the 24-month period. iii. Participants receiving retention services technically remain in PAES, but since their favorable outcomes were established before
entering the retention phase, they were classified as achieving a “Favorable Outcome Due to Employment.” iv. Participants who achieved a favorable outcome at any time during the cohort were kept in this classification in the data system
through the remainder of the cohort time frame, unless their status in CDS was changed (e.g., they re-entered PAES or entered another program in CAAP). Their continuing status was not based on any observation because PAES does not follow-up with participants who have been discontinued and has no information as to later work status unless participants return to DHS.
vi. Part-time employment with wages that did not exceed DHS eligibility was not defined as a program outcome. It was treated as a participant characteristic and analyzed like other characteristics, to see its relation to any of the defined outcome measures.

Introduction
SFDPH/SFDHS – (415) 255-3706 – January 31, 2003 Page 6
Program Performance Indicator – Favorable Outcome Ratios (FORs) In addition to proportions of clients reaching the various outcomes, it is useful to look at the relation of favorable to unfavorable outcomes; that is, of those leaving PAES, what proportion “succeeded?” The FOR, expressed as a percent, shows those with positive outcomes compared to the sum of those with both positive and negative outcomes. The ratio, expressed as a percent, shows those with positive outcomes compared to the sum of those with both positive and negative outcomes.
# Participants with Favorable Outcomes Favorable Outcome Ratio (FOR) =
# with Favorable + Unfavorable Outcomes x 100%
The Favorable Outcome Ratio provides DHS with a benchmark of program success. A Favorable Outcome Ratio over 50% means that more participants are leaving PAES successfully than not. Favorable Outcome Ratios were calculated and reported for those who attained a:
1. Favorable Outcome Through Employment (referred to as the “Employment FOR”) 2. Favorable Outcome Through Other Income (referred to as the “Other Income FOR”) 3. These two ratios combined make up the Total Favorable Outcome Ratio (referred to as the
“Total FOR”) Data Presentation The general approach to data analysis and presentation is to show graphs in the Summary and descriptive tables in the Results Sections. Both compare outcomes and FORs for different populations in the PAES Program. An example is inserted below. Table 6 Achieved Favorable Outcome [FORs] Favorable
Through Through Total Outcome Ratios Gender Participants Employment Other Income Favorable
Total Unfavorable
Outcome Empl Other Total Ref Cohort Subgroup Column A.
% of Total Column E. % of Col A
Column F. % of Col A
Column G. % of Col A
Column H. % of Col A
L. M. N.
1 Male 2,015 69% 452 22.4% 184 9.1% 636 31.6% 656 32.6% 35% 14% 49%1
2 Female 915 31% 229 25.0% 95 10.4% 324 35.4% 233 25.5% 41% 17% 58%2
3 Total 2,930 100% 681 23.2% 279 9.5% 960 32.8% 889 30.3% 37% 15% 52% The tables show the distribution, numbers and percentages of favorable and unfavorable outcomes and FORs for each cohort subgroup. • Lines 1 and 2 show the breakdown of the total (2,015 plus 915 equal 2,930). • Percentages in column A “Participants” reflect each subgroup’s percentage of the Total cohort
(915 is 31% of 2,930). • Percentages in the “Outcome” columns (columns E, F, G, and H) show the percent of
individuals who achieved that outcome for that row (452 is 22.4% of 2,015). This report often refers to the Favorable Outcome Through Employment – the percent of participants who

Introduction
SFDPH/SFDHS – (415) 255-3706 – January 31, 2003 Page 7
achieved this outcome as shown in column E. The report also refers to Unfavorable Outcomes – the percent of participants who achieved this outcome as shown in column H.
• Percentages in columns L, M, and N are the FORs for each row. Note that the Employment FOR (column L) and the Other Income FOR (Column M) are components of the Total FOR (column N) and sum to column N. (35% plus 14% equal 49%)
• Columns with letters as part of the column header refer to similarly labeled, more comprehensive, descriptive tables in Appendix 4.
• Comments addressing specific cells in the table have superscript references and the cells themselves are outlined in bold.
• Since small numbers are not reliable, the Team suppressed the calculation of percentages in the tables for groups with fewer than 60 and for cells based on fewer than 5 individuals. In such cases, the percent cell shows a double (**) or single (*) asterisk, respectively. Numbers of individuals for these groups are still shown, for informational purposes.
In some cases, we comment on differences regarding “Percent Still in PAES” and “Percent who Maintained Outcome Through Employment”. Details of this data are not shown in the Results Sections, but are presented in the expanded tables in Appendix 4. In the Results Sections, comments before the tables are offered on notable distributions of participants in the table. Bulleted comments after the table refer to notable comparisons of outcomes. Where differences among groups are discussed after the tables, those results are statistically significant unless otherwise noted. Significance of inter-group differences was calculated using a “z” test for difference between proportions (JFleiss, Statistical Methods for Rates and Proportions, 2d ed., John Wiley & Sons, 1981.) for comparisons between two groups, or chi-square tests for homogeneity or test for trend for more than two groups (SSelvin, Statistical Analysis of Epidemiological Data, Oxford, 1991.) Cox Regression Modeling When dealing with data involving several variables that can contribute to the outcomes observed (such as housing and behavioral health histories), multivariate modeling is often used to determine which variables significantly affect the outcomes, while statistically “controlling for” the effects of the other variables. The Team applied the Cox Regression method to see which factors affected the outcomes for PAES recipients with behavioral health and homeless histories while controlling for the effects of other factors. (See Appendix 2, Page 11 for more information on this modeling technique.) In the Summary Section of this Report (beginning on Page 10), Cox Regression findings are integrated into the descriptive table findings. In the body of the report, Cox Regression findings are addressed separately within their own section (see Page 62).
Introduction
SFDPH/SFDHS – (415) 255-3706 – January 31, 2003 Page 8
Focus Groups The qualitative component of this study was designed to augment or enhance the analysis of the electronic data files. Focus groups enabled the PAES Analysis Team to explore the subjective experience of participants (and of those who work with them) to provide context for the quantitative analysis. Focus Group members were recruited and asked to identify the personal strengths of participants, barriers to employment, and interventions that they believed would lead participants to more successful transitions to self-sufficiency. In all, 79 individuals participated:
• PAES Employment Specialists (n=32), • PAES Counseling Service Clinicians (n= 8), • Vocational Assessors and Job Placement Specialists (n=2) • Community treatment providers (mental health n=4, substance abuse n=9) • Community vocational training programs (n= 7) • Client Advocates (n=8) • PAES Clients (n=9)
In the Summary section of this report (beginning on Page 10), focus group findings are integrated into the descriptive table findings. In the body of the report, focus group findings are addressed separately within its own section (see Page 65). (See Appendix 3 for methodology used to conduct focus groups.) Limitations to Data Elements and Data Collection The analysis was limited to data available in the three data systems, and from the onset it was known there were reporting flaws. As a result, it is likely that these results reflect: 1. Under-reporting of number of PAES clients with behavioral health problems 2. Under-reporting of employment / Over-reporting of unfavorable outcomes 3. Lack of follow-up data on maintaining employment / Misidentification of last known status 4. Over-counting of mental health treatment / Under-counting of substance abuse treatment Ultimately, lack of staffing resources for the Analysis Team made it impossible to review 2,930 charts or even a significant sampling to quantify the amount of under or over counting in the most of the above categories. (See Appendix 2, Page 8 for more information on limitations of data elements and data collection.)

Introduction
SFDPH/SFDHS – (415) 255-3706 – January 31, 2003 Page 9
Limits to Interpreting Results
This report reflects the analysis of 2,930 participants who entered PAES between January 1999 and June 2000. Because it is not known what part of San Francisco’s indigent population enters CAAP and then PAES, this cohort cannot be taken to represent or reflect all very-low-income single adults in San Francisco. In addition, this study frequently draws associations between characteristics and outcomes.
• Demographic subgroups, for example, were analyzed and their outcomes compared as better or worse than their counterparts. It is assumed that these differences reflect strengths or weaknesses in the program and/or society and not an inherent potential or limitation of any demographic group. This study was not designed to determine why group characteristics (or program characteristics) were more or less successful than others.
• Also, the extent of co-occurrence of certain characteristics in this cohort is reported. Without knowing more about individual histories, the reasons why these characteristics co-occur more or less frequently cannot be generally inferred. In particular, it is unclear why the largest proportion of those who were homeless was comprised of those with substance abuse treatment histories. It may reflect (1) substance abusers being more likely to become homeless, (2) homeless persons being more likely to become substance abusers, (3) a combination of the two, or (4) no causal association.
• Other studies would be needed to determine whether which, if any, of the associations reported here represent causal relationships.

SFDPH/SFDHS – (415) 255-3706 – January 31, 2003 Page 10
Summary of Findings

Summary
# Participants with Favorable Outcomes Favorable Outcome
Ratio (FOR) = # with Favorable + Unfavorable Outcomes
x 100% February 20, 2003 – Page 11
PAES Performance Summary of Overall Program Performance: 1. At the end of the cohort period, the status of the 2,930 participants studied was:
a. 33% were discontinued favorably b. 30% were discontinued unfavorably c. The remaining were still in PAES or their status was unknown or neutral
2. Analysis of the PAES Program Favorable Outcome Ratios (FORs) showed that more participants succeeded in PAES (52% Total FOR) than failed; that is, over half of the reasons for discontinuance were consistent with the goals of the PAES program, due primarily to participants achieving the DHS income threshold through employment (37% Employment FOR), with the remaining through other income (15% Other Income FOR).
Employment Histories Part-Time Employment Status: 1. Half of the cohort participants had part-time employment during their enrollment in PAES,
half did not. Whether an individual came into the PAES program with a part-time job or got one while in PAES, their Employment FOR was five times higher than those who did not reach part-time work. Those without part-time work failed 2.5 times as often as those with.
2. In the Cox Regression modeling that controlled for the effects of multiple factors, part-time employment continued to be the factor most strongly and consistently associated with both higher Favorable Outcomes Through Employment and with lower Unfavorable Outcomes. This held true for the whole cohort and for those parts of the cohort defined by their housing situation, their behavioral health history or whether they entered with part-time work or attained it after entering PAES.
62%
12%
9%
21%
72%
33%
0%
20%
40%
60%
80%
100%
Had PT Employment No PT Employment
Employment FOR Other Income FOR Total FOR
Part Time Employment and FORs
52%
15%
37%
0% 10% 20% 30% 40% 50% 60%
Total FOR
Other IncomeFOR
Employment FOR
Total Cohort Performance - Favorable Outcome Ratios (FOR)

Summary
# Participants with Favorable Outcomes Favorable Outcome
Ratio (FOR) = # with Favorable + Unfavorable Outcomes
x 100% February 20, 2003 – Page 12
PAES Program Involvement 1. Length of Stay in PAES Employment Services:
a. Most (61%) of the participants in the cohort utilized less than one year of employment services. However, the longer participants stayed in PAES, the more they achieved a Favorable Outcome Through Employment. Most of those who dropped out unfavorably did so within their first six months in PAES.
b. Those eligible for other income sources (e.g., SSI) were most often identified during their first six months of the program. From a program perspective, this represents relative efficiency. Early transfers conserve PAES program resources and decreases the time participants wait to receive more comprehensive benefits.
2. Repeat Episodes in PAES Program: Relatively few participants recycled or had repeat
episodes in PAES; 80% had only one PAES episode. However, those with one episode achieved a Favorable Outcome Through Employment three times higher than those with two episodes and five times higher than those with three-plus episodes.
3. Dental Services:
a. Only 9% of PAES participants were identified as having received PAES-subsidized dental treatment. Compared to those who did not receive dental treatment, those who did receive such services had more than twice as many still in PAES and a 50% higher Total FOR. Those not receiving dental services left the program three times more often.
b. In the Cox Regression modeling, receiving dental services was associated with decreased Unfavorable Outcomes for the homeless subgroup, as well as for three of the four behavioral health subgroups.
4. Focus Groups:
a. Selection: Two PAES/PCS staff focus groups recommended that DHS should more clearly define the term "work-ready" and change its rules so that clients can access behavioral health services at the beginning of the GEPS. Some members felt that the process of selecting candidates for the PAES program was oversimplified and the many mitigating factors determining eligibility should be assessed on a case-by-case basis.
b. Assessments: Focus groups recommended providing vocational assessments to all PAES clients and increasing the availability of on-the-job training.
c. Outreach: Focus groups endorsed the need for better outreach, so that the clients are provided with accurate and realistic information regarding PAES Services, and producing a video featuring client success stories. The client and the substance abuse provider groups suggested that paid peer counselors be added to the PAES Counseling Services. The substance abuse service providers suggested that DHS employees who are in recovery reveal this to clients to more effectively serve as models for the process of recovery.
d. Bureaucracy: The most frequently endorsed system issue was the recommendation to streamline the bureaucracy. The client group in addition to five of the seven PAES/PCS staff groups indicated that employment specialist caseloads should be reduced. The client group requested that clients be able to remain with the same employment specialist throughout their tenure in PAES.

Summary
# Participants with Favorable Outcomes Favorable Outcome
Ratio (FOR) = # with Favorable + Unfavorable Outcomes
x 100% February 20, 2003 – Page 13
e. Services: Increased Advocacy: Advocates expressed concern about the sometimes-
adversarial nature of their relationship with the PAES program and strongly emphasized their wish to be integrated into the PAES process with their clients.
Improved Access: Eleven of the twelve groups recommended that access to treatment be improved. Groups endorsed the model of providing emergency drop-in services and 24-hour access to substance abuse treatment and developing integrated one-stop shopping systems to include legal and expanded health services onsite.
f. Communication: Focus groups indicated that communication among the employment specialists, PCS clinicians and vocational assessors is a problem that needs to be solved.
g. Staff Training: The third most frequently cited category by focus groups was staff training; including training PCS clinicians on vocational development and DHS staff on client confidentiality regarding mental health and substance abuse issues. Additional training for PCS staff and employment specialists was suggested to address identified contradictions between harm reduction treatment approach and the expectations of employers that clients be free of substance use.
Demographics 1. Gender:
a. PAES had a higher proportion of males than in CAAP or the general population in San Francisco.
b. Females in PAES had a significantly higher Total FOR than males.
2. Ethnicity/Race:
a. When compared to CAAP recipients or to San Franciscans, Caucasians, Asian/Pacific Islanders and Latinos were under-represented in PAES, whereas African Americans and Russians were over-represented.
b. Russians showed the most notable difference in outcomes with a high Total FOR. In the Cox Regression model, which controlled for part-time employment, being Russian continued to be associated with decreased Unfavorable Outcomes, but was no longer associated with their higher Total
0%10%20%30%40%50%60%70%80%
Males
Female
s
Af.Ameri
cans
Cauca
sians
Russia
ns
Latin
osAPIs
PAESCAAPSF
Distribution of Population
Outcomes by Gender & Ethnicity/Race
49%58%
45% 51%
91%
47%59%
0%
20%
40%
60%
80%
100%
Males
Female
s
Af.Ameri
cans
Cauca
sians
Russia
ns
Latin
osAPIs
Employment FOR Other Income FOR Total FOR

Summary
# Participants with Favorable Outcomes Favorable Outcome
Ratio (FOR) = # with Favorable + Unfavorable Outcomes
x 100% February 20, 2003 – Page 14
FOR. Russians’ higher part-time employment rate (81%) appeared to underlie their higher Total FOR.
3. Language Preference:
a. Compared to CAAP, the percentage of those in PAES who preferred English was comparable (80% in PAES; 79% in CAAP), but was higher for Russian speakers (11% in PAES; 6% in CAAP). Russian speakers, almost the same group identified and discussed under Race/Ethnicity, had higher FORs than the other language preference groups, including English-preference speakers.
b. Focus Groups: Eight of the twelve focus groups identified language (lack of English language skills)
and acculturation issues as significant barriers. While no focus group ranked language in their top three areas of greatest concerns,
four groups, including PAES/PCS staff and mental health providers, rated this area among their top six concerns for clients.
4. Age Group:
The PAES population was older than the overall San Francisco population. Of the PAES population, 33% was over 50 years of age compared to 19% of San Francisco. Participants age 55 and over had fewer outcomes and more often remained in PAES at the end of the cohort period (43% compared to 21% for the rest of the cohort). Their high FORs were due primarily to their low rates of Unfavorable Outcomes – about one-third that of the rest of the cohort.
5. Focus Groups:
a. Job Qualifications: Job qualifications were identified with the second greatest frequency when focus groups were asked to identify strengths. The “lack of” job qualifications was included in the top three areas of greatest barriers to success. Good appearance including good hygiene and good dental health was raised with greater frequency than any other specific characteristic. Education and previous work history were identified with the second and third greatest frequency followed by soft skills, social skills and survival skills. Skills classified as “soft” were endorsed with much greater frequency than technical or hard skills.
b. Legal Issues: Ten of the twelve focus groups identified legal issues as a barrier to success in PAES. Clients placed legal issues among the top three most important barriers. Two groups indicated that drivers’ license revocation posed a barrier to employment. One group identified child support arrears as an issue.
c. Physical Health: Four focus groups identified physical health issues as a barrier to employment. Two groups, mental health and substance abuse providers, ranked this area in the top three barriers and client advocates ranked this area as the fourth most important issue facing clients.
d. Contextual Issues: Issues including general factors such as discrimination, unhealthy environment, and “culture of dependence” that many clients face was the third most frequently cited area of concern in focus groups. Eight groups identified discrimination and six groups identified unhealthy environment indicating a broad level of staff and participant concern for these two issues.

Summary
# Participants with Favorable Outcomes Favorable Outcome
Ratio (FOR) = # with Favorable + Unfavorable Outcomes
x 100% February 20, 2003 – Page 15
15%
54% 44%12%
16%16%
27%
71%60%
0%
20%
40%
60%
80%
100%
Remained Homeless Housing Subsidized Entered HousedEmployment FOR Other Income FOR Total FOR
Outcome by Housing Status
e. Resources: In terms of strengths, the category of resources was endorsed with the third greatest frequency. In this area, having family or community support was identified most frequently, followed by transportation.
Housing Status 1. Homelessness:
a. Over a third of PAES participants were homeless when they entered the program – a far higher proportion than that of the whole San Francisco population (estimated to be in the range of 1-2%). The homeless did worse on all measures with lower FORs and higher Unfavorable Outcomes.
b. Focus Groups: Every group identified adequate and stable housing as relevant to success in PAES. This category was ranked among the top three most important issues that form a
barrier to success by nine of the twelve focus groups. 2. Housing Subsidies:
b. Of the 1,113 participants entering PAES homeless, one-third transitioned into PAES-subsidized housing, and two-thirds remained homeless. Those with housing subsidies did better on all measures with nearly four times higher Employment FOR and five times higher rate of maintaining employment and twice as many remaining in PAES compared to those continuing to be homeless.
c. In the Cox Regression modeling, housing subsidies were associated with decreased Unfavorable Outcomes for most of the cohort subgroups.

Summary
# Participants with Favorable Outcomes Favorable Outcome
Ratio (FOR) = # with Favorable + Unfavorable Outcomes
x 100% February 20, 2003 – Page 16
Behavioral Health Histories 1. Treatment Histories:
a. Half of the PAES participants had a history of behavioral health treatment with DPH during the 9½-year period reviewed. 33% of the Total PAES cohort received recent1 services – over four times as high as San Francisco adults who received DPH services during the same time period.
b. Of the PAES group receiving concurrent services, 42% obtained their treatment from the DHS-subsidized PAES Counseling Service (PCS). Most striking was the finding that PCS was able to reach and provide first-time services to 170 participants (42% of the 405 in PCS; 18% of the 966 receiving concurrent treatment).
c. Focus Groups: Behavioral health was a broad area of concern for focus groups that included many
specific personality characteristics including "insufficient motivation," "bad attitude," “poor impulse control,” and “blaming others” as well as the more general categories of mental health and substance abuse.
Although many had differing views on how dependence on alcohol and substance use affects one’s ability to work, every focus group rated substance abuse, mental health or behavioral health among the top three barriers faced by PAES recipients.
2. Types of Behavioral Health Disorders:
a. Half the cohort (1,476) had a history of treatment with DPH. 31% of the cohort had a history of substance abuse only (i.e., they had no mental health treatment history), 8% had mental health treatment only, and 11% had history of treatment for both disorders.
b. Achieving a Favorable Outcome Through Employment was not significantly different for subgroups with known behavioral health histories. However, those with mental health only disorders transferred to other incomes three times as often as those with substance abuse only disorders – a reflection of the SSI eligibility criteria disallowing substance abuse diagnoses as a basis for disability.
c. Participants with known behavioral health disorders who achieved a Favorable Outcome Through Employment (n259) more often lost this status by the end of the study time period than participants who did not have
1 “Recent” refers to the time period one year prior to entering PAES and/or concurrent with PAES.
No Known Behavioral
Health History50%
Substance Abuse Only
31%
Both11%
Mental Health Only
8%
PAES Cohort by Known Behavioral Health History

Summary
# Participants with Favorable Outcomes Favorable Outcome
Ratio (FOR) = # with Favorable + Unfavorable Outcomes
x 100% February 20, 2003 – Page 17
45%28% 25% 32%
10%
13% 26%
41%
55%41%
51%
73%
0%
10%
20%
30%
40%
50%
60%
70%
80%
No Known Substance Abuse Only Both Mental Health Only
Employment FOR Other Income FOR Total FOR
Outcomes by Behavioral Health History
behavioral health histories (40% and 25% respectively). This effect was greatest for those with substance abuse histories: 41% of those with substance abuse only histories who had achieved a Favorable Outcome Through Employment lost their employment, compared to 33% of those with mental health histories alone.
Mental Health Disorders 1. Types of Mental Health Disorders:
a. The profile of PAES participants with mental health disorders differs from that of all DPH Community Mental Health Services (CMHS) recipients in terms of both types of primary disorders and levels of functionality. Compared to all CMHS clients, PAES recipients had: Nearly double the
frequency of mood disorders (55% PAES; 29% CMHS)
Half the rate of schizophrenia and other psychotic disorders (17% PAES; 38% CMHS) Similar rates of adjustment disorders (12% PAES; 14 % CMHS) Double the frequency of anxiety disorders (6% PAES; 3%CMHS)
5%
65%
30%
55%
17%
12%
6%
9%
57%
37%
29%
38%
14%
3%
0% 10% 20% 30% 40% 50% 60% 70%
Mild to Minimally Impaired
Moderately Impaired
Major to Severely Impaired
Mood Disorder
Schizo/Psycho Disorder
Adjustment Disorder
Anxiety Disorder
% of All CM HS% of PAES M H Clients
PAES Mental Health Clients Compared to All CMHS
Summary
# Participants with Favorable Outcomes Favorable Outcome
Ratio (FOR) = # with Favorable + Unfavorable Outcomes
x 100% February 20, 2003 – Page 18
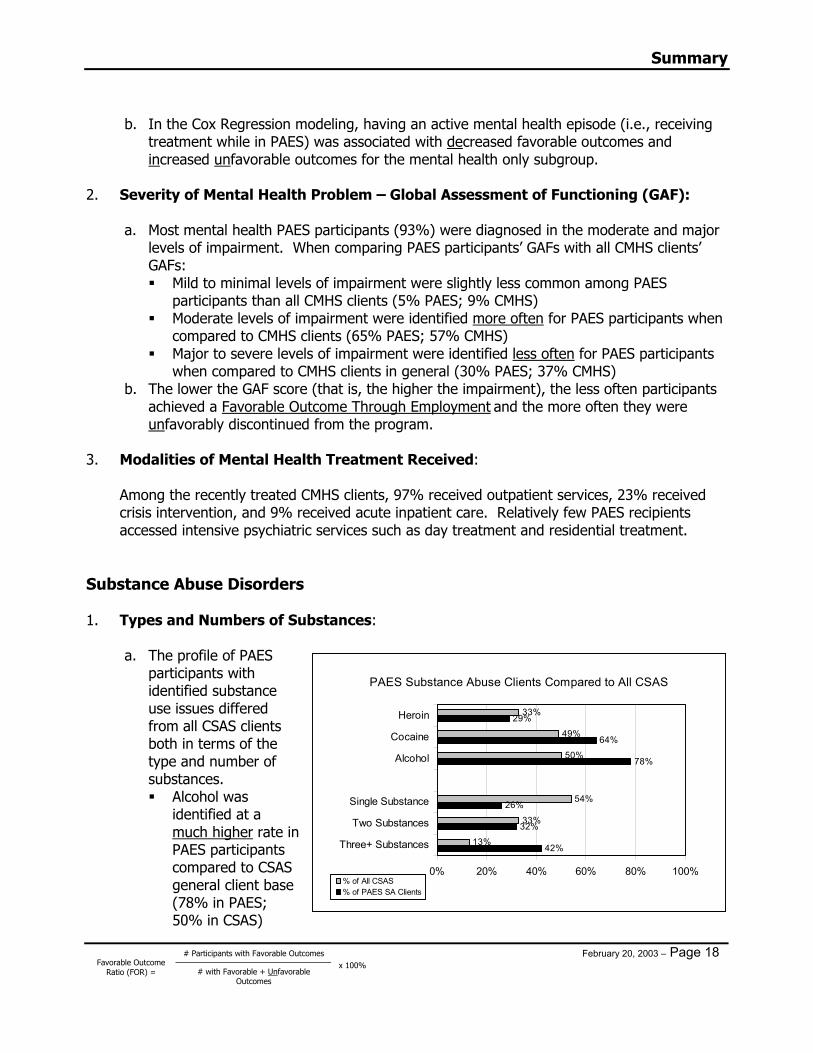
b. In the Cox Regression modeling, having an active mental health episode (i.e., receiving treatment while in PAES) was associated with decreased favorable outcomes and increased unfavorable outcomes for the mental health only subgroup.
2. Severity of Mental Health Problem – Global Assessment of Functioning (GAF):
a. Most mental health PAES participants (93%) were diagnosed in the moderate and major
levels of impairment. When comparing PAES participants’ GAFs with all CMHS clients’ GAFs: Mild to minimal levels of impairment were slightly less common among PAES
participants than all CMHS clients (5% PAES; 9% CMHS) Moderate levels of impairment were identified more often for PAES participants when
compared to CMHS clients (65% PAES; 57% CMHS) Major to severe levels of impairment were identified less often for PAES participants
when compared to CMHS clients in general (30% PAES; 37% CMHS) b. The lower the GAF score (that is, the higher the impairment), the less often participants
achieved a Favorable Outcome Through Employment and the more often they were unfavorably discontinued from the program.
3. Modalities of Mental Health Treatment Received:
Among the recently treated CMHS clients, 97% received outpatient services, 23% received crisis intervention, and 9% received acute inpatient care. Relatively few PAES recipients accessed intensive psychiatric services such as day treatment and residential treatment.
Substance Abuse Disorders 1. Types and Numbers of Substances:
a. The profile of PAES participants with identified substance use issues differed from all CSAS clients both in terms of the type and number of substances. Alcohol was
identified at a much higher rate in PAES participants compared to CSAS general client base (78% in PAES; 50% in CSAS)
42%
32%
26%
78%
64%
29%
13%
33%
54%
50%
49%
33%
0% 20% 40% 60% 80% 100%
Three+ Substances
Two Substances
Single Substance
Alcohol
Cocaine
Heroin
% of All CSAS% of PAES SA Clients
PAES Substance Abuse Clients Compared to All CSAS

Summary
# Participants with Favorable Outcomes Favorable Outcome
Ratio (FOR) = # with Favorable + Unfavorable Outcomes
x 100% February 20, 2003 – Page 19
Cocaine was identified at a higher rate in PAES participants compared to CSAS general client base (64% in PAES; 49% in CSAS)
Heroin was identified at a similar rate in PAES participants as in the CSAS general client base (29% in PAES; 33% in CSAS)
The combination of alcohol, cocaine and heroin was identified in 8% of the PAES population treatment records
Use of a single substance was identified at a lower rate in PAES participants compared to CSAS in general (26% in PAES; 54% in CSAS)
Two substances were identified at a similar rate in PAES participants compared to CSAS general client base (32% in PAES; 33% in CSAS)
Three or more substances were identified at a much higher rate in PAES participants compared to CSAS general client base (42% in PAES, 13% in CSAS)
b. Those without substance abuse treatment history were 1.6 times more often employed
and achieved a higher Total FOR than those with known substance abuse disorders. Participants who identified only one drug problem achieved a greater Favorable Outcome Through Employment (34%) than those with two or more drugs identified (25-26%). Among the common drug combinations observed, the poly-drug users of alcohol, cocaine, and heroin had the lowest levels of achieving a favorable outcome in PAES.
2. Modalities of Substance Abuse Treatment:
a. Of the 1,233 recipients with Substance Abuse treatment histories between 1991 and 2000, outpatient counseling was the only form of treatment for 36% (444). Of the 130 PAES recipients who engaged in residential treatment during their time in PAES, one-third (43) used beds subsidized by PAES, with the remaining 87 using beds subsidized by DPH.
b. PAES participants utilizing detox services had a history of multiple detoxes during the year prior to and during their enrollment to PAES: 91 opiate users who detoxed with methadone did so an average of 5.1 times. During the study period, it was common for opiate users to have repeated detox episodes because of the difficulty of accessing methadone maintenance; i.e., clients utilized methadone detox as a way of bridging getting into methadone maintenance. Residential detox clients (typically alcohol users) detoxed an average of 2.3 times each.
3. Methadone Maintenance:
a. Heroin users with methadone maintenance had significantly higher Total FORs; primarily due to their moving to other income sources.
29% 25% 15%
29%12%
14%
58%
37%29%
0%
25%
50%
75%
100%
MethadoneMaintenance
No MethadoneMaintenance
Methadone Detox
Employment FOR Other Income FOR Total FOR
Heroin User Outcomes by Methadone Maintenance

Summary
# Participants with Favorable Outcomes Favorable Outcome
Ratio (FOR) = # with Favorable + Unfavorable Outcomes
x 100% February 20, 2003 – Page 20
b. Methadone Maintenance had the highest level of Favorable Outcomes, while those on methadone detox had the lowest. The difference is statistically significant.
c. Of the 355 participants with a heroin use history, 102 (29%) received methadone maintenance services at some point in the time period one year prior to entering PAES and/or concurrently. Of these, one-third (34) received their methadone through the PAES-subsidized program. The remaining two-thirds (68) received methadone maintenance through DPH-subsidized programs.
4. Number of Substance Abuse Treatment Episodes:
a. Of the 289 PAES recipients with 5 or more treatment episodes, 126 had 5-7 episodes, 58 had 8-10, and 105 had more than ten.
b. Comparing those with 1-4 recent CSAS episodes to those with 5 or more recent episodes, those with four or fewer had a significantly higher Total FOR; due to having a combination of more Total Favorable Outcomes and fewer Unfavorable Outcomes.

Summary
# Participants with Favorable Outcomes Favorable Outcome
Ratio (FOR) = # with Favorable + Unfavorable Outcomes
x 100% February 20, 2003 – Page 21
54%44%
16%
64%
53%
20%
43%
32%
14%
46%
34%
10%
48%
30%
15%
0%
20%
40%
60%
80%
100%
Entered Homeless - Remained Entered Homeless - Hsg Subsidy Entered Housed
Employ FOR - AllEmploy FOR - No KnownEmploy FOR - Only MHEmploy FOR - Only SAEmploy FOR - Both
Employment FORs - Relationships Between BH History and Housing Status
Joint Effects of Housing and Behavioral Health 1. Distribution:
a. Only 35% of the cohort entered housed and without behavioral health histories. b. The homeless as a whole had higher rates of behavioral health histories than those who
entered housed: 60% had behavioral health histories with DPH, as compared to 44% of those who entered housed.
c. Nearly 5 out of 10 recipients with substance abuse histories entered homeless – as compared to 3 out of 10 for those without substance abuse histories
d. One third of the homeless gained housing through PAES subsidies. The other two-thirds remained homeless.
2. Outcomes:
When comparing housing status for each type of behavioral health history: a. The homeless for each behavioral health subgroup did by far the worst. For all
subgroups, Total FORs (see textured bar below) and Employment FORs were lower for homeless than those who were housed or whose housing was subsidized.
b. The formerly homeless who were given housing subsidies did much better than those who remained homeless, and as well as those who entered housed. The Employment FOR for the housing-subsidized was at least triple the Employment FOR for the homeless in every subgroup.
c. This difference was not attributable to differences in behavioral health histories, as both the homeless who transitioned into subsidized housing and the homeless who remained homeless had the same rate of participants with behavioral health histories (about 60% each).

Summary
# Participants with Favorable Outcomes Favorable Outcome
Ratio (FOR) = # with Favorable + Unfavorable Outcomes
x 100% February 20, 2003 – Page 22
3. Psycho-Social Disability Index:
To assess the joint effects of problems facing PAES recipients, the Analysis Team constructed an index combining the three available factors of greatest concern: mental health disorders, substance abuse, and homelessness. (See Appendix 1 for methodology.) a. Only 60 participants (2% of the Cohort) scored a severe disability and almost all of these
participants were both homeless and dually diagnosed. b. The Psycho-Social Disability Index shows that as the level of disability increased, the
Favorable Outcome Through Employment decreased. In fact, this measure showed a consistent gradient between level of disability score and every outcome measure used in this study. Those with no Psycho-Social Disability kept employment more than twice as often as those with the lowest level of disability.
c. In the Cox Regression modeling, the Psycho-Social Disability Index was also
independently associated with both outcomes for the cohort. Higher (more severe) disability scores were associated with both decreased Favorable Outcomes Through Employment and increased Unfavorable Outcomes. For each subgroup of the cohort either the Disability Index itself, or its component parts, was significantly related to outcomes and with the same associations as the whole cohort.
0%10%20%30%40%50%60%
Still in PAES Employed Employed &Maintained
Favorable Thru OtherIncome
Unfavorable
No Disability Minimal Disability Moderate Disability Severe Disability
Status Achieved by Psycho-Social Disability Index
54%
12%
66%
30%
17%
47%
18% 18%
36%
10%20%
29%
0%
20%
40%
60%
80%
Employment FOR Other Income FOR Total FOR
No Disability Minimal Disability Moderate Disability Severe Disability
FORs by Psycho-Social Disability Index

SFDPH/SFDHS – (415) 255-3706 – January 31, 2003 Page 23
Recommendations
for the PAES Program

Recommendations for the PAES Program
SFDPH/SFDHS – (415) 255-3706 – January 31, 2003 Page 24
I. Increase availability and use of housing subsidies
The data indicate that the housing subsidy significantly affects performance and is an effective intervention. However, because 25% (725) of the PAES population was homeless as of December 2000 and only 33 were on the waiting list for subsidized housing, it would be important to determine what the barriers to wanting or accessing housing subsidies are for homeless participants.
II. Maintain on-site behavioral health services
PAES Counseling Service (PCS), the onsite service, provides an effective alternative route into treatment since a significant number of clients who received PCS services had never previously received DPH treatment. In addition, it was determined that the general PAES client seen by DPH has a very different profile of mental health and substance abuse issues of the typical DPH client. A DHS-subsidized program assures that treatment access and intensity can respond to the distinct behavioral health needs as well as to the employment goal of the PAES program. Findings from this report should inform PCS in their ongoing evaluation of services they provide. For example, focus groups endorsed paid peer counselors, emergency drop-in and 24-hour access to treatment as important.
III. Expand access to health services for PAES clients
A. Clients with histories of heroin use are much more successful in PAES when they are
provided methadone maintenance. They both secure employment and are awarded Social Security benefits at a rate significantly greater than those clients who were identified as using heroin but did not have methadone treatment.
B. The onsite dental service was associated with better outcomes. While it was not feasible to collect information about the medical needs of the PAES population, previous analyses by DPH showed that CAAP clients disproportionately use emergent services rather than ongoing treatment. Improving availability of medical health services, such as co-location, would prove beneficial.
C. Focus groups indicated a general lack of awareness of health issues by PAES staff. Training for PAES staff would help them recognize health problems, discuss them with clients, and make appropriate referrals.
IV. Expand employment and SSI advocacy services
A. The data associating part-time employment with favorable outcomes strongly suggest
that reaching self-sufficiency is a stepped process. Therefore, DHS and DPH should explore other ways to remove barriers and to provide experiences that may help clients progress toward any level of employment in the competitive job market, such as subsidized employment programs, job coaching, job-site supportive services, etc.
B. A number of individuals with known behavioral health disorders (n475) left the PAES program unfavorably (due to non-compliance and/or fraud reasons) and did not transfer to the SSIP program. Increased SSI screening and advocacy services would lessen the likelihood of disabled clients falling out of PAES without the benefit of SSI entitlements.

SFDPH/SFDHS – (415) 255-3706 – January 31, 2003 Page 25
Recommendations for the
Ongoing Assessment of PAES

Recommendations for Ongoing Assessment
SFDPH/SFDHS – (415) 255-3706 – January 31, 2003 Page 26
I. Maintain history of clients’ outcomes
A. As has been noted, the CDS database does not maintain histories. Similarly, many elements of the mental health and substance abuse historical data are overwritten with each update. To monitor how recipients (and therefore the program) perform, it is essential to build into the systems the capacity to measure, record, and maintain outcomes in files over time.
Recommendations: (a) Do not overwrite outcomes with later changes in status. Rather, any such
changes important to understanding the trajectory of PAES recipients over time should be recorded sequentially and left available in a computer record.
(b) Design future databases in DPH and DHS so that all functional, vocational, and health assessment scores can be recorded and tracked through the databases.
(c) Design data system that replaces the DPH mental health and substance abuse systems to provide longitudinal tracking capability.
II. Improve outcome information
A. PAES recipients may drop out of the program without notice to the employment specialist because they find work and no longer need cash assistance or services. To the employment specialist, the recipient simply ceased to show up for appointments and they are subsequently discontinued with a code that is considered “unfavorable.” Currently there is no way to systematically determine the reasons why recipients drop out of PAES. This information is important to assess outcomes and make the program more responsive to the needs of all its recipients. With improved “discontinuance” information, DHS will be able to more accurately reflect performance as follows: Favorable: Employed, no matter what the reason for discontinuance Neutral: Not employed and was discontinued due to death, moving,
confinement, etc. Unfavorable: Not employed and was discontinued due to fraud, non-
compliance, etc.
Recommendations: (a) Determine reasons why recipients drop out of the program. (b) DHS might consider offering incentives for recipients to tell DHS why they
are leaving. (c) Record outcomes in a computer file for access by program managers and
evaluators.

Recommendations for Ongoing Assessment
SFDPH/SFDHS – (415) 255-3706 – January 31, 2003 Page 27
B. The goal of the program is to help people achieve the most appropriate route to economic self-sufficiency. As such, those who were disabled, unable to work, eligible for disability support programs, and successfully identified as such were transferred to SSIP and considered “Favorable Outcomes” in this study. From an “Employment Program” perspective, it may be that transfers are neutral, rather than favorable, outcomes.
Recommendation: (a) Determine if transferring recipients to SSIP is a favorable outcome of PAES.
C. The Analysis Team defined being in PAES as neutral, that is, not in itself a program
outcome. In fact, the study showed that the longer recipients remained in PAES, the higher their favorable outcomes through employment. However, given that PAES is a time-limited program, continuing in PAES past a certain length of time without getting any part-time employment might be considered an unfavorable outcome with respect to moving people toward greater economic self-sufficiency.
Recommendations: (a) Determine whether, and if so, how long is “too long” in PAES without any
employment. (b) Add, measure and monitor the frequency at which PAES recipients have “x
time in PAES without any employment.” Add those who reach this outcome to the category of “Unfavorable Outcomes,” but delineate as such so that their numbers can be separated.
III. Measure overall performance
A. Research indicated that there is no standard to which San Francisco can compare its
PAES program’s performance. The Analysis Team developed a performance indicator to measure the overall performance of PAES and recipient groupings. The Favorable Outcome Ratio (FOR) compares the proportion of “favorable outcomes” among the “favorable plus unfavorable outcomes.” In effect, it eliminates the neutral outcomes and those still in PAES from the performance measure. Using this indicator, one can readily see that any rate over 50% means more success than failure in PAES.
Recommendations: (a) Continue to use the Favorable Outcome Ratio to measure and monitor
performance over time (of some variant reflecting most important outcomes).
(b) Use the findings from this study as sources for baseline performance. IV. Measure progress
A. Part-time employment was the strongest predictor of achieving a Favorable
Outcome Through Employment. Thus gaining any employment should be considered a desired intermediate program goal – a step toward success. It is

Recommendations for Ongoing Assessment
SFDPH/SFDHS – (415) 255-3706 – January 31, 2003 Page 28
possible that the step between no employment and any employment is a more important threshold toward self-sufficiency than the step between part-time employment and meeting the DHS income threshold.
To better understand the relationship between part-time employment and reaching the income threshold, it would be useful to record wages and hours. This would provide information on which transitions were due to changes in jobs or job status, and which to shifts in wages or hours.
The DHS threshold for income (i.e., the recipient no longer qualifies for cash
assistance) is less than the minimum and livable wages established for San Francisco. DHS’ Career Advancement program is key to sustainable self-sufficiency. Performance in PAES should be thought of in terms of progress toward the ultimate goal of self-sufficiency, both during and after graduation from the program.
Recommendations: (a) Monitor stages of progress in economic self-sufficiency:
Employed – Income is less than DHS threshold Employed – Income meets DHS threshold Employed – Income meets livable wage Employed – Advancement of career and/or income above livable wage
(b) Collect information on wages and hours over time to allow for the tracking of the above employment levels. Collect this information at intervals following the end of cash benefits, until individuals reach the “livable wage” or to the extent feasible. Those who elect to stay with the Retention Program can be easily monitored for post-PAES outcomes. For others, it might involve a combination of a postcard or telephone reply system, combined with active attempts to contact them, with compliance probably greatly enhanced by a minor financial incentive.
(c) Measure each step whether step is progressive or regressive. (d) Incorporate steps into the Favorable Outcome Ratio similar to the way
“Employment FOR” and “Other Income FOR” were delineated as parts of the “Total FOR” favorable outcome in this study.
Recommendations for Ongoing Assessment
SFDPH/SFDHS – (415) 255-3706 – January 31, 2003 Page 29
V. Broaden and evaluate scope of factors that influence outcomes A. The Psycho-Social Disability Index developed for this study was found to be strongly
associated with every PAES outcome analyzed. However, the analysis was limited to proxy measures developed from existing DHS and DPH databases.
Functionality information is collected by employment specialists and documented in the case folder but is dependent upon self-assessments rather than objective functional testing. There were a significant number of recipients who failed but had none of the measurable barriers to employment used in this study; i.e., they did not have a history of behavioral health treatment and they were not homeless. Conversely, many homeless recipients with behavioral health histories were able to achieve favorable outcomes through employment. Clearly, factors other than those for which data were available to the Analysis Team contribute to performance in PAES. The more these factors can be measured and monitored, the better the program’s ability to know the needs and capacities of its clientele, set program expectations, and monitor program performance.
Recommendations: (a) Adopt a reliable functional assessment tool for use with PAES recipients
upon entry and at regular intervals including at exit. Enter scores into database.
(b) At the next analysis of PAES, incorporate as many as possible of the factors listed below. While additional measures are needed in some cases, others call for simply enhancing the tracking capabilities of existing databases. (See Appendix 2, Page 12 for more information on data availability and sources.) Vocational Factors
• Education/Training History (Pre-PAES) ** • Employment History ** • Income History ** • Literacy Assessment ** • Vocational Assessment ** • Work Readiness (Self-assessment) ** Functionality Factors
• Disability: Learning ** • Disability: Mental Health (GAF and type of diagnosis) * • Disability: Physical Health (Presence of chronic disease) * • Disability: Substance Abuse (# and type of problem drugs) * • Treatment: Mental Health – Current and Historical * • Treatment: Physical Health – Current and Historical * • Treatment: Substance Abuse – Current and Historical * Contextual Factors
• Domestic Violence and Other Trauma – Current and Historical ** • Housing Status – Current and Historical * and ** (both current only) • Social Support and Isolation (current only) * and **

Recommendations for Ongoing Assessment
SFDPH/SFDHS – (415) 255-3706 – January 31, 2003 Page 30
Legal Factors • Current and Historical ** Program History Factors
• CAAP History (current only) * and ** • Education/Training while in PAES * • Time active in PAES **
* Data elements captured in existing databases within DPH and DHS ** Data elements captured in the PAES case file, but not registered in a
database, however, some of the case file data are currently extremely limited in nature