portsmouth local air quality plan outline business …
TRANSCRIPT

PORTSMOUTH CITY COUNCIL
1
PORTSMOUTH LOCAL AIR QUALITY PLAN
OUTLINE BUSINESS CASE
1. EXECUTIVE SUMMARY 6
2. INTRODUCTION 7
Background context 7
Outline Business Case 8
Study area 8
3. STRATEGIC CASE 10
Introduction 10
Local air quality problem 10
3.2.1. Exceedance locations 10
3.2.2. Contributory factors 15
3.2.3. Wider air quality issues (Portsmouth AQMAs) 22
3.2.4. Recent and current measures to reduce emissions in Portsmouth 22
Air quality policy context 23
3.3.1. UK government policy and strategy 23
3.3.2. Clean Air Zone framework 24
3.3.3. Portsmouth Air Quality Strategy (2017-2027) 26
3.3.4. Portsmouth International Port Air Quality Strategy 26
Wider local policy context 27
3.4.1. Introduction 27
3.4.2. Economic growth context 28
3.4.3. Transport context 28
3.4.4. Socio-demographic context 30
3.4.5. Fit with other local policies and strategies 31
Spending objectives / critical success factors 32
3.5.1. Primary objective 32
3.5.2. Secondary objectives 32
Benefits, risks, constraints and dependencies 32
3.6.1. Benefits 33
3.6.2. Risks 33
3.6.3. Constraints 33
3.6.4. Dependencies 33
Theory of change and logic mapping for options 36
Stakeholder input / support 38
3.8.1. Stakeholder survey 38
3.8.2. Focus groups 42
4. ECONOMIC CASE 44
Introduction 44
Optioneering process 44
CAZ Benchmark 47

PORTSMOUTH CITY COUNCIL
2
4.3.1. CAZ boundary 47
4.3.2. Exclusion of Portsmouth International Port 48
4.3.3. CAZ charge 48
4.3.4. Other model assumptions 49
4.3.5. Level of CAZ required for the benchmark 49
Alternative package (CAZ B + non-charging measures) 54
4.4.1. CAZ B specification 54
4.4.2. Non-charging measures 56
4.4.3. Wider strategies and proposals 59
Comparison of package performance in delivering Primary Critical Success Factor 60
4.5.1. Comparison of package performance on compliance (based on core assumptions) 60
4.5.2. Impact of sensitivity tests on compliance 60
4.5.3. Summary 65
Comparison of package performance in delivering Secondary Critical Success
Factors 66
4.6.1. Value for money 66
4.6.1.1 Economic appraisal approach 66
4.6.1.2 Economic appraisal results 70
4.6.2. Distributional impacts on stakeholders 76
4.6.2.1 Impact on vulnerable groups 76
4.6.2.2 Impact on businesses 76
4.6.3. Strategic fit 81
4.6.4. Deliverability 81
4.6.5. Affordability 82
4.6.6. Achievability 83
Overall summary of package performance 85
Preferred package 86
5. COMMERCIAL CASE 87
Introduction 87
Works and services 87
Sourcing approaches 87
5.3.1. Class B Clean Air Zone 88
5.3.2. Other aspects of the Class B Clean Air Zone 97
5.3.3. Supporting/non-charging measures 98
Contracting arrangements 102
Payment mechanisms 106
Risk allocation 106
Introduction 110
6.1.1. Purpose 110
6.1.2. Units of account 111
6.1.3. Assumptions and limitations 111
6.1.4. Project Costs 111
6.1.5. Treatment of risk and market engagement 111
Indicative costings for Class B CAZ 112
6.2.1. Implementation Costs of Class B CAZ 112
6.2.2. Operation and Maintenance Cost of Class B CAZ 115
6.2.3. Revenue generated from CAZ 115
6.2.4. Decommissioning 116

PORTSMOUTH CITY COUNCIL
3
Indicative Costing for Additional Measures 117
6.3.1. Implementation Costs of Additional Measures 117
6.3.2. Operation Costs of Additional Measures 119
6.3.3. Decommission Costs of Additional Measures 119
Financial Appraisal of the Preferred Package 119
6.4.1. Preferred Package Financial Profile 119
6.4.2. Total Financial Costs to be funded through the Implementation Fund 120
6.4.3. Sensitivity Testing 120
Current financial situation 121
Costs to develop the Final Business Case 121
7. MANAGEMENT CASE 122
Introduction 122
Governance 122
7.2.1. Assurance 125
Programme and project management processes 127
7.3.1. Change Management 129
7.3.2. Issue Management 129
7.3.3. Risk management 129
7.3.4. Closure and hand-over 130
Delivery and Implementation 130
7.4.1. Deliverability 130
7.4.2. Experience of Delivering Successful Projects and Programmes 131
Benefits Realisation Plan 133
7.5.1. Identifying Benefits 133
7.5.2. Measuring Benefits 136
7.5.3. Analysing and Reporting Benefits 136
7.5.4. Roles and Responsibilities 137
7.5.5. Tracking Benefits Realisation 137
Monitoring and evaluation Plan 137
7.6.1. PCC and JAQU responsibilities for monitoring and evaluation 138
7.6.2. Principles for monitoring and evaluation 138
7.6.3. Objectives of the Preferred Package 138
7.6.4. Key Outcomes of the Preferred Package 139
7.6.5. Data Collection and Reporting for Monitoring and Evaluation 141
7.6.6. Data reporting cycles 148
7.6.7. Qualitative data 148
7.6.8. Financial Implications of Monitoring and Evaluation 148
7.6.9. Monitoring and Evaluation Officer 148
7.6.10. New and existing data sources 148
Communication and Stakeholder Engagement 149
7.7.1. Stakeholder Identification 149
7.7.2. Risks associated with Stakeholder Engagement 151
7.7.3. Communications and Engagement Plan 151
7.7.4. CAZ Public Consultation 152
8. CLEAN AIR FUND BID 153
Introduction 153
Mitigation measures for taxis 155

PORTSMOUTH CITY COUNCIL
4
8.2.1. Background 155
8.2.2. Summary of distributional impact on group 155
8.2.3. Financial incentives for HC and PHV drivers to an upgrade to a compliant vehicle 157
Mitigation measures for buses and coaches 161
8.3.1. Background 161
8.3.2. Retrofitting of remaining non-compliant buses and coaches 161
Mitigation measures for HGVs 164
8.4.1. Background 164
8.4.2. Summary of distributional impact on group 164
8.4.3. Deliver an out-of-city consolidation centre for Portsmouth (macro-consolidation) 166
8.4.4. Financial subsidies to replace or retrofit non-compliant HGVs (subject to availability of
appropriate technology) 170
Clean Air Fund application overview form 173
8.5.1. Summary of distributional analysis 173
8.5.2. Summary of measures 174
APPENDICES
APPENDIX A. LOCAL AIR QUALITY PROBLEM AND UNDERLYING CAUSES
APPENDIX B. SUMMARY OF OPTIONEERING PROCESS TO IDENTIFY SHORTLIST
OTHER SUPPORTING DOCUMENTS
T2 – Transport Modelling Validation Report
T3 – Transport Modelling Methodology Report
T4 – Transport Modelling Forecasting Report
AQ2 – Air Quality Modelling Methodology Report
AQ3 – Air Quality Modelling Report
E1 – Economic Appraisal Methodology Report
E2 – Economic Model
E3 – Distributional Analysis Methodology Report
AAS – Analytical Assurance Statement
Stated Preference Survey Report

PORTSMOUTH CITY COUNCIL
5
Document Register
Version Description Originator Checker Reviewer Approver
1.0 Incorporates comments on policy sections from PCC (02,08,2019)
Various HT, KR (PCC)
JR HT (30,08,2019)
2.0 Update for JAQU Various JR 09/10/2019
3.0 Draft for publication
Various JR, TM MW HT 18/10/2019
3.2 Draft for JAQU review
Various
6.0 Final Various JR, TM (Atkins) HT, KR (PCC)
HT HT
31/10/2019

PORTSMOUTH CITY COUNCIL
6
1. Executive Summary
Portsmouth is a busy, thriving city, and like other cities, current legal limits for nitrogen dioxide can
sometimes be exceeded at certain locations. Being an island city with only three roads on and off
of the island, the city faces unique challenges in improving air quality. It is recognised that air
pollution has negative effects on health, and can have a disproportionate impact on the most
vulnerable in society such as children, older people and those with pre-existing medical conditions.
Portsmouth City Council recognises the importance of reducing harmful levels of NO2 and is keen
to continue to build on the progress already made in respect to improving air quality, delivering a
package of measures which will contribute positively to the health of residents, employees and
visitors to the city.
This Local Air Quality Plan Outline Business Case (OBC) sets out Portsmouth City Council's
approach to achieving compliance with legal limits for NO2 at all locations citywide, leading to a
healthier environment for all.
The Plan has been produced in response to the Ministerial Direction issued to Portsmouth City
Council on 4th October 2018, requiring the council to develop a plan which identifies how
compliance with legal limits for nitrogen dioxide can be achieved in the shortest possible time.
The OBC sets out the process that has been followed, and the technical work undertaken to
develop the preferred package of measures to achieve the primary objective of delivering a
scheme that leads to compliance with NO2 concentrations in the shortest possible time, without
significantly worsening emissions elsewhere. The preferred package consists of the following
elements:
Class B Charging Clean Air Zone (CAZ)
Changes to parking capacity and pricing south of the city centre
Improvements to strategic cycling routes
Changes to Alfred Road traffic signals
Progressive tightening of taxi licensing rules
Rapid charging points at taxi ranks
Reduced fee/ free residents parking permits for low emission vehicles
Travel planning and behaviour change measures
Targeted communications and marketing initiatives
The plan is set out using the five cases business case model, outlining the rationale and
justification for securing funding from central government to deliver the measures proposed. The
plan has been developed in line with the guidance provided by Government's Joint Air Quality Unit
(JAQU) and Her Majesty's (HM) Treasury Green Book.

PORTSMOUTH CITY COUNCIL
7
2. Introduction
Background context
On 26 July 2017, the government published the UK plan for tackling roadside nitrogen dioxide
(NO2) concentrations (‘the UK Plan’). This set out how the government would bring the UK NO2
concentrations within the statutory annual limit of 40 micrograms per cubic metre (µg/m3) in
the shortest possible time. As part of the UK Plan, the government set out how 28 local authorities
(first and second wave local authorities) with the most severe NO2 exceedances1 should develop
local plans to implement measures to achieve compliance with statutory NO2 limits (set out in the
Ambient Air Quality Directive) within the shortest possible time.
On 5 October 2018, the government published a supplement to the UK Plan, setting out
conclusions for each of the 33 ‘third wave’ local authorities2, based on Targeted Feasibility Studies
undertaken for each of these authorities. The supplement identified eight local authorities with
more persistent long-term exceedances. Portsmouth is one of the eight authorities falling into this
category.
Under the terms of the Environment Act 1995, the government has issued a Ministerial Direction to
this group of local authorities. This Direction requires these local authorities to develop a local
plan to identify the option which will deliver compliance with legal limits for nitrogen
dioxide in the shortest possible time.
Portsmouth City Council (PCC) is therefore required to undertake a local assessment to consider
the best option to achieve compliance within the shortest possible time. An initial plan (in the form
of a Strategic Outline Case) was provided on 31 January 2019. A final plan must be submitted no
later than 31 October 2019, in the form of an Outline or Full Business Case. If statutory public
consultation is required, an Outline Business Case that outlines the final plan must be submitted at
the earliest opportunity and no later than 31 October 2019, with the Full Business Case to follow
shortly after.
In the technical report published alongside the UK Plan, government identified charging
Clean Air Zones (CAZ)3 as the measure, able to be modelled nationally, which would achieve
compliance with NO2 limits in the shortest possible time. Given the potential impacts on individuals
and businesses, the government believes that if a local authority can identify measures other than
charging zones that can be shown to deliver NO2 compliance as quickly as a charging CAZ then
those measures should be preferred.
The UK Plan states that local plans should seek to target measures so as to minimise their impact
on local residents and businesses. Where local plans will have a significant impact on residents
and businesses, government will work with local authorities to consider mitigation options.
The Department for Environment, Food and Rural Affairs and the Department for Transport’s Joint
Air Quality Unit (JAQU) is responsible for overseeing the delivery of the UK Plan which includes
supporting local authorities and other organisations on the delivery of local measures in their area.
1 Based on DEFRA Pollution Climate Mapping (PCM) model outputs, these authorities were forecast to exceed legal NO2 limits in 2020. 2 Identified in the UK Plan as having shorter-term NO2 exceedances with projected compliance with legal limits by 2021. 3 A CAZ defines an area where targeted action is taken to improve air quality and resources are prioritised and coordinated in order to shape the urban environment in a way that delivers improved health benefits and supports economic growth. It may or may not include a charging element.

PORTSMOUTH CITY COUNCIL
8
Outline Business Case
The purpose of this document is to justify the selection of the preferred option for delivering
compliance in the shortest possible time, building on the evidence presented in the Strategic
Outline Case. It should also set out the likely implementation plan procurement route and
demonstrate the affordability of the local plan.
The document will be assessed by government to ensure that it delivers the necessary air quality
compliance, is fair, cost effective and where possible delivers wider benefits. The document will
only be approved by government, and thus considered appropriate for funding, if it can be shown
that:
It is likely to cause NO2 levels in the area to reach legal compliance within the shortest time
possible (and provides a route to compliance which reduces exposure as quickly as possible);
The effects and impacts on local residents and businesses, including disadvantaged groups,
have been assessed and that there are no unintended consequences;
Proposals that request government funding support demonstrate value for money; and
The local measures have been carefully analysed using detailed local evidence and local air
quality modelling tools and analysis methods, improving on the analysis at the national level.
All short-listed and the preferred option must pass a Critical Success Factor test on whether the
option proposed would deliver compliance in the shortest possible time. Additional factors, such as
cost, can only be considered when options are equally effective at achieving compliance in the
shortest possible time. The short list must include a benchmark charging CAZ of a high enough
class to bring about compliance.
The rest of this document is structured around the five cases model, covering the five core
elements of a business case:
Strategic Case - Makes the case for change. Analyses the current situation and identifies the
required change, what outcomes are expected, and how this fits with wider government
policies and objectives; sets out input from stakeholder engagement.
Economic Case - What is the net value to society (the public value) of the proposal? What are
the risks and their costs, and how are they best managed? Assessment of shortlist,
considering costs and benefits in detail to identify a preferred option; including a distributional
analysis of the option.
Commercial Case - Can a realistic and credible implementation approach be developed, who
will manage which risks? Outlines the required services and an associated procurement
strategy and timeline.
Financial Case - What is the impact of the proposal on the budget of the public sector in terms
of total cost both capital and revenue? Sets out the financial profile, as well as the impact and
consequences of the proposed deal.
Management Case - Are there realistic and robust delivery plans, how can the proposal be
delivered? Outlines the arrangements required to ensure successful delivery of the scheme,
including risk register, monitoring and evaluation plan, project plan, organogram of project team
and governance structure.
Study area
A map of the study area is shown in Figure 1-1 for context. The study area comprises the whole of
Portsea Island, i.e. the area south of Portsea Island, which can only be accessed from the
mainland by vehicular traffic via the M275, the A3 or the A2030.

PORTSMOUTH CITY COUNCIL
9
Table 2-1 Map of the study area (Portsea Island)

PORTSMOUTH CITY COUNCIL
10
3. Strategic Case
Introduction
This section sets out the case for change, in terms of:
the local air quality problem (including the results of the baseline air quality and transport
modelling);
national and local policy drivers;
the objectives for intervention and the desired goal;
the benefits, risks, constraints and dependencies related to addressing the identified issue;
a logic map setting out the theory of change to guide the identification of suitable options;
input from stakeholder engagement, including stakeholder survey and focus groups; and
an assessment of potential economic impacts of a CAZ on businesses in the city.
Local air quality problem
3.2.1. Exceedance locations
a) Exceedance locations on the local road network
At the time the Strategic Outline Case was produced, there were five locations where the annual
mean NO2 EU Limit Value of 40 µg/m3 was modelled as being exceeded by either the DEFRA
PCM model or by local modelling work, with all forecast to remain above the 40 µg/m3 limit (or
40.49 µg/m3 unrounded) limit until at least 2020. These were:
A3 Alfred Road, between Hope Street roundabout and the Queen Street / Anglesea Road /
Alfred Road intersection (PCM link 18114);
A3 Mile End Road, between the southern end of the M275 and Church Street roundabout
(PCM link 48196);
A2047 Kingston Road / Fratton Road, located south of the eastern end of Kingston Crescent
down to intersection with A2030 Road (PCM link 36116);
A2047 Kingston Crescent located west from the junction with London Road and Kingston
Road, and A2047 London Road between the junction with Kingston Crescent and Laburnum
Grove (PCM link 38333); and
A2047 London Road, from Magdalen Road to Derby Road/Laburnum Grove, north of Kingston
Crescent (PCM link 6118).
Since then, a more detailed local model has been developed, using:
the latest 2018 roadside monitoring data (based on 107 diffusion tube locations and 4
continuous air quality monitoring stations, see Appendix A.2 for further information);
Automatic Number Plate Recognition surveys at over 70 camera locations across the city
(undertaken over a 7 day period in March 2019); and
forecast traffic flows, speeds, and vehicle types from the Sub-Regional Transport Model
(SRTM).
In addition, mitigation measures have been funded in terms of the retrofitting of 105 buses which
pass through the A3 Mile End Road and A3 Alfred Road PCM exceedance links to Euro 6
emissions standard (due to be completed by end of 2019).
The latest modelling data identifies two local road sections in central Portsmouth where modelled
NO2 concentrations are forecast to exceed the EU limit of 40 µg/m3 (or 40.49 µg/m3 unrounded) in
2022 (see Table 2-1 and Figure 2-1).

PORTSMOUTH CITY COUNCIL
11
Table 3-1 Roadside receptor sites with modelled exceedances (and near exceedances) in 2022 baseline (Based on Emissions Factor Toolkit v9.1b)
Receptor
ID
Road Name Modelled NO2
(µg/m3) –
2022 baseline
Modelled Road-
NOx (µg/m3) –
2022 baseline
% Road NOx
reduction to
meet EU limita
Year compliance would
be achieved, assuming
no intervention
Road sections on the local network modelled as exceeding the EU limit (40 µg/m3) in 2022
573 A3 Alfred Road (Unicorn Rd to Queen St, s/b) 41.7 47.3 -6.7% 2023
546 A3 Commercial Road (south of Church St Rbt, s/b) 41.1 39.6 -3.8% 2023
Road sections on the local network not exceeding the EU limit, but still above 37 µg/m3 in 2022
526 Church Street (east of Church St Rbt, n/b) 40.4 37.6 (+0.6%)
526 Church Street (sensitivity test) – described below 38.7 33.4 (+1.0%)
536 A3 Hope Street (south of Church St R'bout, s/b) 38.9 34.9 (+11.0%) -
824 A2030 Eastern Road Water Bridge (s/b) 38.8 43.9 (+9.5%) -
648 A2047 London Road (Stubbington Ave to Kingston
Crescent, s/b)
38.5 33.1 (+14.3%) -
520 Mile End Road (north of Church St R'bout, s/b) 37.6 30.9 (+22.2%) -
557 A3 Marketway (Hope St Rbt to Unicorn Rd) 37.4 38.5 (+19.8%)
Road sections on the Strategic Road Network exceeding the EU limit (40 µg/m3) in 2022
986 A27 (north of Portsea Island, w/b) 48.5 68.6 -29.5% 2026
1089 A27 (east of Portsea Island, w/b) 46.1 65.3 -21.3% 2025
11 M27 (west of Portsea Island, w/b) 45.3 68.0 -17.9% 2025
968 A27 (north of Portsea Island, e/b) 43.7 59.9 -14.7% 2024
834 A27 (east of Portsea Island, w/b) 41.1 49.0 -3.0% 2023
Nitrogen oxides or NOx is the term that applies to a combination of nitric oxide (NO) and NO2. NOx gases are emitted from vehicles but as NO is considered to be harmless to health, the EU Limit Value is
based on NO2 concentrations. Air quality modelling is conducted for NOx emissions from the road and then this is converted to NO2 taking into account the non-linear relationship between the two and the
contribution from background concentrations. Therefore, the level of road NOx reduction is calculated to consider the level of traffic emission reductions required to achieve the NO2 limit value.
Some road links have more than one receptor exceeding the EU limit, but only the highest receptor is listed in the table above.
Note a: % reduction required to achieve a NO2 concentration of 40.49 µg/m3.
% increase in Road
NOx that would
results in EU limit
being exceeded.

PORTSMOUTH CITY COUNCIL
12
Figure 3-1 Location of roadside receptor sites with modelled exceedances in 2022 baseline (EFT v1.9b)
a) All receptors
City centre exceedance
locations shown in red;
near exceedances
(>37 µg/m3) shown in orange
Strategic
Road
Network
exceedance
locations
shown in red
Near exceedance
(>37 µg/m3) on Eastern
Road Water Bridge s/b One near exceedance
(>37 µg/m3) on
London Road s/b

PORTSMOUTH CITY COUNCIL
13
b) City centre exceedance and near exceedance locations
These are:
A3 Alfred Road (Unicorn Rd to Queen St, 41.7 µg/m3),
A3 Commercial Road (south of Church St, 41.1 µg/m3).
These road links are located in the city centre area, on the main A3 route in and out of the city. An
estimated reduction in NOx of 4%-7% is required to achieve the EU limit.
For context, 2022 is the earliest year in which compliance is considered feasible as a result of
implementing a charging Clean Air Zone4, and represents the benchmark year for assessing option
viability.
In the absence of any intervention, compliance would be achieved in 2023 at the identified
exceedance locations, due to background changes in fleet composition.
b) Locations on the local road network just below the EU limit (near exceedances)
There are a further six road sections where NO2 concentrations are above >37 µg/m3 in 2022. It is
important that measures implemented to address exceedances at Commercial Road and Alfred
Road, do not simply displace traffic and push NO2 concentrations above the EU limit at these ‘near
exceedance’ sites.
4 PCC estimate that the earliest a charging CAZ could be implemented is late 2021, with compliance expected to be achieved at the end of the first year (i.e. late 2022).

PORTSMOUTH CITY COUNCIL
14
Church Street sensitivity test
Following a comparison between the strategic transport model outputs and observed traffic counts
in the city centre, it is apparent that the SRTM5 traffic model substantially over-estimates flows
on Church Street, primarily as a result of the modelled link capturing movements on other local
roads which are not represented in the strategic model network.
Table 2-2 summarises the comparison of modelled traffic against observed data. The comparison
draws on the two available sources of observed data:
the vehicles counted by the ANPR camera installed on the northern part of Church Street for
the week of 18/03/19 to 24/03/19 providing two way all day coverage; and
a classified count on a single day (Thursday 04/04/19) for the AM and PM peak periods at the
junction between Church Street, Holbrook Road and Lake Road to the south of the link.
Table 3-2 Comparison between modelled and observed traffic data, Church Street, 2019
Modelled Baseline 2019 (SRTM) ANPR 2019*
One day Classified
Turning Count 2019 **
Section -
Direction
AM
peak
hour
IP
peak
hour
PM
peak
hour
24hr
AADT
AM
peak
hour
IP
peak
hour
PM
peak
hour
24hr
AADT
AM peak
hour
PM peak
hour
North – NB 1,044 764 787 10533 - - - - - -
North – SB 983 758 1,169 11,506 - - - - - -
North – 2way 2,028 1,523 1,957 22,037 1,057 880 768 14,225 - -
South – NB 1,303 768 1,260 12,735 - - - - 517 440
South – SB 765 650 756 8,884 - - - - 584 334
South – 2way 2,067 1,352 2,017 21,620 - - - - 1,101 774
Key: Comparable modelled flows and ANPR counts. Comparable modelled flows and turning counts.
North refers to the short section between Church Street Roundabout and Wingfield Street and most closely
represents the conditions at receptor ID526. South refers to the section between Wingfield Street and Lake
Road Roundabout, a 350 metre section south of ID526.
* ANPR data is a 7 day average, adjusted to account for average 93% capture rate over the week.
** Turning count undertaken on Thursday 04/04/19
The data shows that two-way modelled flows on the short section between Church Street
Roundabout and Wingfield Street, which most closely represents the conditions at receptor ID526,
are 22,037 compared with an ANPR count of 14,2256.
A comparison of modelled speeds against available data from Trafficmaster, TomTom and Google
mapping showed that modelled speeds appear to be close to observed speeds, despite the
difference in flow levels. For example, TomTom GPS journey speed data for 2018 (24hr flow
weighted average) provides the following comparison for the section between Church Street
Roundabout and Wingfield Street (see Figure A-4):
southbound: median speed = 29kph and mean speed = 29kph, compared to a modelled speed
of 31kph;
5 Sub Regional Transport Model 6 A further two week Manual Classified Count was undertaken commencing 24th September 2019. The corresponding two way flow for the north site was 14,489 (24 AADT); 838 (AM peak hour); 881 (IP peak hour); 945 (PM peak hour).

PORTSMOUTH CITY COUNCIL
15
northbound: median speed = 13kph and mean speed = 15kph, compared to a modelled speed
of 9kph.
As a result of the over-estimate of modelled traffic flows, the air quality model over-estimates NO2
concentrations compared to the measured data on Church Street. A sensitivity modelling test was
conducted whereby the observed ANPR traffic flows were growthed to 2022 levels (using the
forecast growth from SRTM and a further 15% uplift to allow for uncertainty) to provide a more
realistic, lower future flow estimate for Church Street. Using these revised traffic flows, the
predicted modelled NO2 concentration at receptor 526 is forecast to be lower in 2022 (38.7 µg/m3)
compared to the predictions from the SRTM baseline forecast traffic outputs (40.4 µg/m3) as
presented in Table 2-1 above.
Based on the evidence from the traffic count data presented in Table 2-2, the sensitivity test is
judged to be a more accurate representation of concentrations on Church Street and from this
point on we will assume the revised baseline figure of 38.7 µg/m3 for Church Street.
c) Exceedance locations on the strategic road network
There are also five road sections on the A27/M27 Strategic Road Network (operated by Highways
England) where NO2 concentrations are forecast to exceed the EU limit in 2022. The highest
exceedance is on the section of the A27 immediately north of Portsea Island, requiring a reduction
in road NOx of 30% to achieve the EU limit.
These are Highways England’s responsibility, but PCC is expected to communicate with Highways
England as local plans are developed and ensure local measures do not adversely impact on
these sites.
3.2.2. Contributory factors
The main contributory factors contributing to the above exceedances are summarised below, with
further detail provided in Appendix A.
a) Background air quality
The total modelled NOx and NO2 concentrations include a contribution from both road traffic
emissions as well as emissions from other local sources (e.g. domestic boilers, industry, shipping
and rail) as well as more rural sources from outside of Portsmouth.
This background NOx component is sourced from Defra mapping, forecast from a 2017 base year
and averaged across 1km grid squares7 (grid square locations shown in Figure A-2). In 2022,
across Portsea Island, on average non-road sources make up more than 70% of the background
NOx, with the rural component (30%) and shipping (23%) being the most significant of these (Table
2-3).
For the grid area covering exceedance PCM link 80848 (including Church Street/Commercial
Road) almost half of emissions are from shipping (45%), and in the area covering PCM link 18114
(including Alfred Road) 34% is from shipping and 12% from off-road sources (i.e. port-side
operations). This is higher than in other parts of the city, and potentially includes significant
emissions from Portsmouth International Port and the Naval Base. Less than a quarter of
emissions, when aggregated across the respective 1km grid squares are associated with road
transport (22% and 17% respectively), representing a significant challenge for this Plan which is
primarily focused on transport-focused solutions. However, it is noted that at the exceedance
7 https://uk-air.defra.gov.uk/data/laqm-background-maps?year=2017

PORTSMOUTH CITY COUNCIL
16
locations, the contribution from the road itself is much greater than the average value across the
grid square presented in Table 2-3.
Table 3-3: Contribution of sources to background NOx concentrations in 2022 (for non-compliant links and across Portsea Island) – average value across grid square
Area
(Background grid square and receptors)
Total back-ground NOx
(µg/m3)
Percentage contribution to NOx concentrations
Industr
y
Dom
estic
heating
Railw
ay
Ship
pin
g
Off-r
oad
ind
ustr
ial
Off-r
oad o
ther
Poin
t sourc
es
Rura
l
(outs
ide
PC
C)
To
tal
No
n-
Ro
ad
So
urc
es
To
tal
Ro
ad
So
urc
es
M275/A3 Mile End Rd/ Church St/Commercial Road (incl. International Port)
Grid square: 464500, 101500 PCM link 80848
40.4 µg/m3
1.9%
6.8%
0.0%
45.2%
3.1%
0.1%
2.2%
18.6%
77.9%
22.1%
A3 Alfred Rd/Marketway (incl. the Naval Base)
Grid square: 463500. 100500 PCM link 18114
33.0 µg/m3
2.2%
6.2%
0.1%
34.0%
11.6%
0.1%
6.4%
22.7%
83.3%
16.7%
Portsea Island (average of grid squares)
24.8 µg/m3
3.3%
7.9%
0.1%
22.7%
4.7%
0.2%
4.1%
30.3%
73.4%
25.6%
Source: Defra background maps for 2022 (based on 2017 base data)
Previous modelling studies estimated that in 2010 shipping contributed to 9.6% of NOx
concentrations within Air Quality Management Area (AQMA) 11, which includes the Commercial
Road exceedance (See Figure A-12).
As highlighted below (Section 2.3.4), Portsmouth International Port is currently undertaking work to
understand its air quality impacts and is preparing a Port Air Quality Strategy (PAQS) by July 2020.
This will outline proposals for reducing emissions associated with port activities, which will also
contribute to achieving the EU limit value for NO2 concentrations on Commercial Road and Alfred
Road.
b) Traffic characteristics
Traffic volume / speeds - The exceedance sites are located in the city centre area, on the main A3
route in and out of the city (see Figure A-3). The A3 is the busiest of the three routes into / out
of Portsmouth and flows directly from / into the M275. The 24 hour Annual Average Daily Traffic
flow, predicted for 2022, is:
37,054 for A3 Alfred Road (4% growth between 2018 and 2022); and
32,298 for A3 Commercial Road (south of Church St Roundabout) (3% growth between 2018
and 2022).
PORTSMOUTH CITY COUNCIL
17
GPS journey speed data recorded via TomTom devices shows the following 24hr average
(median) speeds (see Figure A-4):
A3 Alfred Road (37kph s/b, 37kph n/b)8; and
A3 Commercial Road (south of Church St Roundabout) (36kph s/b, 15kph n/b)9.
Journey purpose - Evidence from the Sub-Regional Transport Model (SRTM, 2026) (see Table A-
2) shows that the majority of trips in Portsmouth (78%) are non-business car trips (Car
Other), followed by Car Business (9%), LGVs (7%), HGVs (7%).
Overall, 46% of trips are local journeys within Portsea Island, and 54% are travelling to/from the
mainland10. By journey purpose:
Car Other trips are a mix of local journeys (47%) and trips to / from the mainland (53%);
the majority of Car Business (66%) and HGV trips (61%) are to / from the island; and
the majority of LGV trips (57%) are within the island.
Local and non-local movements – The majority of traffic on the two exceedance routes is travelling
to/from external locations to Portsea Island11:
82% for A3 Alfred Road and
85% for A3 Commercial Road (south of Church St Roundabout).
This reflects their strategic nature. Neighbouring Fareham and Havant represent key trip ends,
along with the city centre and area to the south-west of the city centre (Charles Dickens and St
Thomas wards).
Frequency of driving in Portsmouth – The results from the Stakeholder Survey (Table 2-4)
undertaken to inform this Air Quality Plan show that a substantial proportion of car drivers make
trips within Portsea Island most days (64%, at least 4 days/week), or, in the case of non-residents,
drive onto the island most days (45%,at least 4 days/week). These drivers are likely to be
contributing most to the exceedances and would be most affected by the introduction of a charging
CAZ D.
The corresponding proportions are similar for non-compliant diesel cars (66% and 47%
respectively), and for non-compliant petrol cars (61% and 41% respectively).
8 S/b data is based on average journey times between Unicorn Road to Queen Street junctions and may mask slower
speeds resulting from queuing on the approach to the Queen Street junction. N/b data is based on a shorter section of road providing a better representation of the conditions at the exceedance location. 9 S/b and n/b data is based on average journey times between Church Street and Commercial Road, providing a good
representation of conditions at the exceedance location. 10 As explained further below, buses, coaches and HGVs that meet Euro VI emissions standards are considered
compliant. Cars, vans and taxis that meet Euro 6 (diesel) or Euro 4 (petrol) emissions are considered compliant. 11 Approximation based on the modelled origin flows and destination flows in each direction, and using a 2026 baseline
as an approximation for 2022. The overall share of external traffic represents the share of traffic from or to external regions in both directions. Portsmouth wards located outside of Portsea Island and Isle of Wight are considered external.

PORTSMOUTH CITY COUNCIL
18
Table 3-4 Travel frequency amongst stakeholder survey respondents
Drive around (to a destination on) Portsea Island
Drive off of Portsea Island
Drive on to Portsea Island
Daily 40% 22% 13%
4-6 days 24% 19% 32%
2-3 days 22% 24% 21%
Once a week 8% 20% 12%
Less than once a week 4% 15% 20%
I do not drive to destinations on Portsea Island 2% 1% 1%
I do not drive <0% 0% 0%
Total 100% 100% 100%
n (sample) 2306 2305 1547
c) Vehicle / fleet characteristics
Background - NOx emission rates vary by vehicle type, age and Euro emission standard. Overall,
newer vehicles emit lower NOx emissions compared to older vehicles (see Figures A-5 and A-6).
European emission standards define the acceptable limits for exhaust emissions of new vehicles
sold in the European Union and EEA member states. Euro VI HGVs and buses are much less
polluting than Euro V vehicles. A new Euro 6 diesel car (4 years old) has a NOx emission standard
of 0.08 g/km compared to a Euro 3 (18 years old) which has a standard of 0.5 g/km12. The latest
Euro 6 petrol cars have the lowest emissions factors. Electric vehicles have no NOx exhaust
emissions.
The Euro 6 standard applies to all new type approvals from September 2014 and all new cars from
September 2015, with more stringent testing introduced more recently:
The Euro 6(c) test became more stringent from Sep 2017. New test procedures were
introduced (WLTP) to deliver results which more accurately reflect real driving behaviour than
the previous NEDC procedure.
A RDE (Real Driving Emissions) test was also introduced in Sep 2017 (Euro 6d). Euro 6d will
take effect fully from January 2020 for type approvals (and from January 2021 for new
registrations), although a Euro 6d-TEMP standard was also introduced in Sep 2017, which
allows some discrepancy between real and lab tests. Euro 6d diesel vehicles (from 2020/2021)
will have considerably lower emissions rates than earlier Euro 6 vehicles.
Figure 2-2 provides a comparison of NOx emission rates based on national information for a typical
urban fleet in 2017. This clearly shows highest emissions from HGVs and buses, and higher
emissions from diesel cars compared to petrol cars, which have the lowest overall emission rates13.
Compliant vehicles (in terms of a Charging Clean Air Zone) are:
Buses, coaches and HGVs that meet Euro VI emissions standards – introduced 2013.
12 However, it is noted that real-world NOx emissions from diesels (particular cars) have been found to be higher than
standards given in the type approval tests conducted in the laboratory, with some studies showing that emissions of a Euro 6 diesel may be seven times higher (i.e. 0.56 g/km) on the road. ICCT (2014). Real World Exhaust Emissions from Modern Diesel Cars. https://www.theicct.org/sites/default/files/publications/ICCT_PEMS-study_diesel-cars_20141013_0.pdf 13 NAEI (2017). National Atmospheric Emissions Inventory. Available at: http://naei.beis.gov.uk/data/ef-transport

PORTSMOUTH CITY COUNCIL
19
Cars, vans and taxis that meet Euro 6 (diesel) emission standards – introduced September
2015.
Cars, vans and taxis that meet Euro 4 (petrol) emissions standards – introduced January 2005.
Figure 3-2 Comparison of NOx emission rates (g/km) in a typical UK vehicle fleet (2017)
Source: Data based on fleet weighted hot exhaust road transport emission factors for urban areas
Portsmouth fleet - For most vehicle types (except LGVs), the Portsmouth fleet is older than the
national average (see Figure A-7).
Role of different vehicle types in Portsmouth – Modelling analysis based on ANPR data collected
over 7 days in March 2019 shows that overall diesel cars (both compliant and non-compliant
vehicles) are the main contributor to NOx emission in 2018, accounting for almost half of
current emissions (47%). Other diesel vehicles such as buses / coaches (8%), diesel LGVs (20%),
and rigid HGVs (12%) are also significant. Overall, light duty vehicles (cars, taxis, light goods vans,
minibuses) account for 76% of road emissions in 2018, and heavy duty vehicles (HGVs, buses,
coaches) account for 24% of road NOx emissions (Table A-4).
The contribution of buses drops to 3% in 2022 as a result of the retrofitting of 105 buses which
pass through the A3 exceedance links on Mile End Road and Alfred Road (funded by Defra).
Overall, the contribution of heavy duty vehicles drops to 15% by 2022, with light vehicles
accounting for 85%. The relative contribution of diesel cars increases slightly to 50%, as a result of
changes in other vehicle types.
Non-compliant vehicle movements (observations) in Portsmouth – The ANPR data shows that 45%
of vehicle movements14 in the city are undertaken by older, more polluting vehicles that
would not meet the emissions criteria for a charging Clean Air Zone (Table A-5)15. Some 24% of
fleet movements are undertaken by non-compliant diesel cars, 9% by non-compliant petrol cars,
9% by non-compliant diesel LGVs, and 2% by non-compliant taxis. The remaining 1% of non-
compliant vehicle trips relate to petrol LGVs, HGVs and diesel buses.
In 2019, some 70% of diesel car trips are made by non-compliant vehicles. However, by 2022, this
proportion is predicted to reduce to 47%, due to natural evolution of the fleet. However, as
14 Vehicle movements have been calculated based on vehicle observations at all ANPR locations over the seven days. 15 Source apportionment calculations are based on EFT v9.0, but the results are unlikely to differ significantly from those based on the latest EFT.

PORTSMOUTH CITY COUNCIL
20
described above, changes in other vehicle types means that overall contribution of diesel vehicles
is actually higher in 2022 than 2018.
Source of road NOx at exceedance locations – In both exceedance locations, non-compliant
diesel cars are the largest source of emissions, accounting for 30% on Alfred Road and 27%
on Commercial Road (Figure 2-3)16. However, around 45% of total emissions are associated
with compliant vehicles.
These results suggest that options need to be addressed at a range of vehicle types, including
diesel cars.
Figure 3-3: Source of 2022 traffic NOx at the local road sites with exceedances
P:\GBEMB\TP\HA\PROJECTS\5185637 - PCC AQ Plan - ROBI2323\40. Technical\08. Emissions Calculations\6.
Baseline_Apportion\Baseline_emissions_vehicle_type_v11.xlsm
Source apportionment maps – Detailed maps showing the contribution by vehicle type to NOx
emissions across the city are provided for the year 2022 in Figure A-8.
Registered location of non-compliant vehicles – Data from the ANPR survey shows that the
proportion of non-compliant vehicles varies from 39% to 51% across the various wards in
Portsmouth (Table A-7). The wards with the highest proportion of non-compliant vehicles are
Charles Dickens ward covering the city centre (47%), and Fratton ward to the north of the city
centre (49%).
d) Site-specific characteristics
Both exceedance sites are located on the main strategic route through the city, carrying some of
the highest flows.
16 Source apportionment calculations are based on EFT v9.0, but the results are unlikely to differ significantly from those based on the latest EFT.

PORTSMOUTH CITY COUNCIL
21
A3 Commercial Road (Receptor 546) – Located at the bottom of the M275, providing the main
route into the city centre for traffic via the western corridor, and out of the city for traffic from the
city centre and areas to the south east. There are three lanes southbound, including a bus
lane along part of the route; and one lane northbound, increasing to three on the approach to
Church Street Roundabout. A 30mph speed limit is in place. The exceedance site is adjacent
to the southbound carriageway, south of the exit from Church Street Roundabout.
Average daily traffic flows on the roundabout and this road are currently over 30,000, with over
25,000 vehicles a day travelling in the southbound direction at an average modelled speed of
37 kph in 2018 (Figure A-4). Although flows are lower on the northbound carriageway, there is
more queuing towards the roundabout with speeds in the traffic model averaging 27kph on the
approach to the roundabout over the day17. As the prevailing wind direction is from SW,
receptor 546 will receive a greater contribution from emissions than locations on the other side
of the road.
Commercial Road is located between the two PCM links targeted by the bus retrofit scheme,
but non-compliant buses and coaches are still accounting for a small proportion of road-related
emissions (3%)18. In this area (aggregated over a 1km grid square), over three-quarter of the
NOx concentration comes from non-road sources, which includes emissions associated with
Portsmouth International Port and the Naval Base.
There is a NO2 monitoring site (DT34) set further from the road and located south of receptor
546 (close to Marketway Roundabout), reporting a concentration of 33.3 µg/m3 in 2018, but not
in the vicinity of receptor 546. The air quality model is over-estimating at this location.
A3 Alfred Road (Receptor 573) – Located further south on the A3, providing the main access
route to the University area, The Hard / Gunwharf Quays and the seafront, carrying over
35,000 vehicles per day. There are two lanes in both directions, and a 30mph (48 km/h) speed
limit in place. The exceedance site is on the southbound carriageway, just north of the junction
with Queen Street and next to the cathedral. The building line is close to the road along the
entire route, but the street is not considered to be a canyon from an air quality modelling
perspective.
Road source emissions appear to be related to the large volume of traffic on this route, a
relatively high proportion of HGVs (non-compliant HGVs account for 15% of emissions and
relatively low modelled speeds (18kph in each direction in 2018, see Figure A-4) which is likely
to be associated with the junction19. As the prevailing wind direction is from SW, receptor 573
will receive a greater contribution from emissions than locations on the other side of the road.
In this area, (aggregated over a 1km grid square), over 80% of the NOx concentration comes
from non-road sources, which includes emissions associated with the Naval Base.
There are three NO2 monitoring sites on Alfred Road, which measured concentrations of 47.5
to 50.4 µg/m3 in 2018. The AQ model is under-predicting at this location.
17 In comparison, journey time data obtained from TomTom for 2018 shows average speeds are 34kph in the southbound direction and 15kph in the northbound direction (slightly slower than modelled speeds). 18 This includes local vehicles which cannot be retrofitted and non-local vehicles travelling into the city on a frequent and non-frequent basis (e.g. coach trips to the Historic Dockyard, Gunwharf Quays, and the Isle of Wight). 19 Although observed levels of flow recorded on Google Maps suggest that Alfred Road is not a particularly congested point on the network; and localised modelling shows that the junction is not operating over capacity even during peak hours.

PORTSMOUTH CITY COUNCIL
22
See Figures A-9 to A-10 for images.
3.2.3. Wider air quality issues (Portsmouth AQMAs)
There are five Air Quality Management Areas (AQMAs) currently in place in Portsmouth which were
declared due to exceedances in the annual nitrogen dioxide National Air Quality Objective (NAQO)
(Figure A-11).
The Commercial Road exceedance falls within AQMA 11, which extends from Rudmore Roundabout
south to the roundabout about the bottom of Commercial Road.
There are four further AQMAs in Portsmouth which do not currently contain any exceedances in
relation to the EU limit for NO2 concentrations, but any increase in traffic volumes on these routes
could exacerbate recent air quality problems. This is a particular concern regarding AQMA6, which
contains an EU limit near exceedance site on London Road.
3.2.4. Recent and current measures to reduce emissions in Portsmouth
A number of measures have been implemented in recent years, are currently being implemented,
or are expected to be implemented soon, and have the potential to make a positive contribution to
improving air quality on the identified exceedance links. These are summarised below:
Bus retrofit programme - Defra funding to retrofit 105 buses which pass through the A3 Mile
End Road and A3 Alfred Road PCM exceedance links to Euro 6 emissions standard. Due to
be completed by end of the 2019 financial year.
Traffic signal improvements - PCC is modernising existing signal infrastructure and improving
the overall operation of the traffic signal equipment across the city to improve traffic throughput,
reduce delays and improve the safety of road users and pedestrians.
Traffic management measures to improve traffic flow – Including Mile End Relining Scheme
(early 2019), and Church Street Roundabout improvement (2016).
Public transport improvements – Including re-development of The Hard Public Transport
Interchange (2017), launch of Park and Ride 2 (PR2) service serving the University and city
centre businesses (Sep 2018), deployment of real time information at bus stops on key
corridors and installation of MOVA at three key junctions to improve bus priority (TCF Tranche
1, 2019). In addition, from December 2018, additional and faster train services began
operating to and from Portsmouth to Southampton and Portsmouth to London.
Electric Vehicle (EV) Chargepoints - Funding was secured from the Office for Low Emission
Vehicles (OLEV) On-street Residential Chargepoint Scheme (ORCS) to install 36 charge
points in residential areas by the end of March 2019, enabling residents without off-street
parking the ability to charge their vehicles at home. Following the success of this project PCC
are also hoping to secure additional funding to install an additional 70 charge points due to
demand from residents. PCC have also installed EV charging points in three public pay and
display car parks as part of a small trial before considering providing EV charging in more
Council operated car parks.
Air Quality Grant Programme (2018/19) and promotion of active travel modes - PCC were
awarded an Air Quality Grant (AQG) of £450,000 from Defra for delivery of targeted
improvements in air quality within Portsmouth, including infrastructure improvements,
communications and marketing, initiatives to promote sustainable travel in workplaces and
schools, eco-driving, and an anti-idling awareness campaign. The programme is expected to
have contributed to improving air quality, as part of the Council’s on-going programme to
encourage more sustainable travel, building on the 2016/17 Sustainable Travel Transition Year
programme, and including the creation of 10 Quieter Routes for cycling, and other
infrastructure improvements for cyclists.

PORTSMOUTH CITY COUNCIL
23
Residents Parking Zone permits – Reduced fee / free permits for low emission vehicles. In
September 2019, it was agreed (subject to the statutory notice procedure), that the charges for
residents permits be changed so that the first permit for a household is free if the vehicle is
powered solely by electricity and that the charge for a first permit is reduced by 50% to £15 if
the vehicle emits less than 100g of CO2 per km (provided it is not powered by a diesel internal
combustion engine and that it was registered after 1 March 2001).
Portsmouth University parking policy – A new parking policy for Portsmouth University comes
into force in September 2019 which will significantly increase charges for the majority of staff.
In addition, University staff living within a 2 mile exclusion zone around University will not be
eligible to apply for a staff parking permit.
Wightlink has been proactive in reducing emissions from ships, traffic and logistics in recent
years. For example, in the last 3 years fuel consumption at Wightlink has reduced by 33%. In
September 2019, Wightlink will be launching their formal green agenda.
Air quality policy context
3.3.1. UK government policy and strategy
In July 2017 the UK government (DEFRA and DfT) published the UK plan for tackling roadside
NO2 concentrations, setting out its commitment to achieving a cleaner and healthier environment,
with the aim of benefitting both people and the economy.
Air pollution is the largest environmental risk to public health in the UK20, and it is known to have
disproportionate effects on vulnerable groups. Air quality disproportionately affects the very old, the
very young, and those with chronic conditions. It also has greater impact on those who live, work or
go to school in more deprived areas.
A recent report by the Committee on the Medical Effects of Air Pollutants (COMEAP, 2018) shows
that the combined effect of long-term exposure to air pollution in the UK in 2013, from both NO2 and
particulate matter (PM), was an effect equivalent to 28,000 to 36,000 deaths at typical ages,
associated with a loss of 328,000 – 416,000 life years21. Public Health England advise that it is well
established that NO2, particularly at high concentrations, is a respiratory irritant that that can cause
inflammation of the airways. There is currently no clear evidence of a threshold concentration of
NO2 in ambient air below which there are no harmful effects for humans.
Data from the Public Health Outcomes Framework22 indicates that in 2016, 6.6% of all
premature deaths in Portsmouth could be attributed to air pollution, compared to 5.4% of all
early deaths in England, and 5.5% in the South East. The burden of disease attributed to poor
air quality is therefore estimated to be greater than the regional and national average.
The link between NO2 concentrations and respiratory diseases is implied in Figure 2-4 which
shows that the number of deaths from respiratory diseases in Portsmouth is highest in
Charles Dickens ward, which contains the two air quality exceedance locations, and has high
levels of deprivation.
The natural environment can also be damaged through high NO2 concentrations contributing to
acidification and eutrophication, which can have an adverse impact on animals, plants and
biodiversity. Economically, air pollution can increase social costs from lost working days, due to ill
health caused by air-pollution related health problems.
20 Air Quality, A Briefing for Directors of Public Health, March 2017, Defra and Public Health England 21 COMEAP (2018); Associations of long-term average concentrations of nitrogen dioxide with mortality. 22 https://fingertips.phe.org.uk/search/air#page/0/gid/1/pat/6/par/E12000008/ati/102/are/E06000044

PORTSMOUTH CITY COUNCIL
24
Consequently, the government are adopting legally binding national emission limits for air pollutants,
to tackle poor air quality. The government’s top priority is to reduce the NO2 concentrations on and
near roads, where traffic is causing higher NO2 levels. Due to elevated levels of traffic on roads in
urban areas, reducing air pollution in towns and cities is an important focus.
The government is planning to achieve the air pollution reduction through encouraging innovative
vehicle solutions such as electric vehicles, alongside ending the sale of conventional petrol and
diesel cars and vans by 2040, as well as targeting behaviour change amongst communities,
employers, education establishments and policy makers.
Figure 3-4 Deaths from respiratory diseases in Portsmouth
3.3.2. Clean Air Zone framework
A Clean Air Zone (CAZ) defines an area where targeted action is taken to improve air quality and
resources are prioritised and coordinated to shape the urban environment in a way that delivers
improved health benefits.
There are two types of CAZ:
Non-charging Clean Air Zones – These are defined geographic areas used as a focus for
action to improve air quality, but does not include the use of charge based access restrictions.

PORTSMOUTH CITY COUNCIL
25
Charging Clean Air Zones – These are zones where, in addition to the above, vehicle owners
are required to pay a charge to enter, or move within, a zone if they are driving a vehicle that
does not meet the particular standard for their vehicle type in that zone.
CAZ proposals are not required to include a charging zone, and local authorities may consider
alternatives to charging such as access restrictions for certain types of vehicles.
Following a consultation in 2016, the UK government has published a Clean Air Zone Framework in
England23 setting out the principles for the operation of Clean Air Zones in any cities which decide,
or are required, to do so.
Under the Framework, charging Clean Air Zones are sub-divided into classes A – D on the basis of
the types of vehicles to which the charging schemes may apply:
Class A CAZ – Targeting taxis and Private Hire Vehicles (PHVs), buses and coaches
Class B CAZ – Targeting taxis and PHVs, buses, coaches and HGVs
Class C CAZ – Targeting taxis and PHVs, buses, coaches, HGVs and LGVs
Class D CAZ – Targeting taxis and PHVs, buses, coaches, HGVs, LGVs and private cars
As described above, the following vehicles are considered non-compliant and are therefore required
to pay the charge levied on non-compliant vehicles travelling within the CAZ:
Buses, coaches and HGVs that do not meet Euro VI emission standards – introduced 2013;
Cars, vans and taxis that do not meet Euro 6 (diesel) emission standards – introduced in September 2015; and
Cars, vans and taxis that do not meet Euro 4 (petrol) emission standards – introduced in January 2005.
Any revenues collected by local authorities will be reinvested to support local transport policies,
which could cover public health projects or strategic planning projects to promote cleaner air. A CAZ
must be in place for at least three years.
Local authorities may also consider placing absolute restrictions on the access of certain types of
vehicles to the Zone at all, or at specified times.
The Framework also provides a range of non-charging measures which local authorities
can use, for example:
Exploring innovative retrofitting technologies and new fuels;
Buying ULEVs and encouraging local transport operators to do the same;
Encouraging private uptake of ULEVs via ensuring adequate charge points;
Encouraging use of public transport, cycling, walking, park & ride schemes, car clubs and car
sharing;
Improving road layouts and junctions to optimise traffic flow; and
Working with local businesses and neighbouring authorities to ensure a
consistent approach.
Over time, it is expected that all roads will achieve statutory NO2 limit values due to the natural
upgrade of the national vehicle fleet to cleaner models. Charging Clean Air Zones aim to accelerate
this turnover and thus need to be maintained only for as long as the statutory NO2 limit values are
exceeded. As soon as it is possible to do so while maintaining legal compliance, these Clean Air
Zones can be removed.
23 Defra and DfT (2017) Clean Air Zone Framework for England www.gov.uk/government/publications/air-quality-clean-air-zone-framework-for-england

PORTSMOUTH CITY COUNCIL
26
The government believe that implementation of a CAZ will generally achieve compliance with NO2
limits in the shortest possible time, but also recognise the potential impacts on individuals and
businesses. It is therefore important that the relative benefits of a charging CAZ are considered
alongside other measures as part of the Outline Business Case for reducing NO2 emissions in
Portsmouth as soon as possible.
3.3.3. Portsmouth Air Quality Strategy (2017-2027)
Portsmouth’s Air Quality Strategy sets out a commitment to “work collaboratively to improve and
maintain a healthy local air quality in the city in order to protect health and the environment,
enhancing our status as a great waterfront city”.
It sets out the following strategic aims:
Foster closer working relationships between council directorates and external partners;
Create a focus on sustainable travel, including the promotion of a modal shift in transport from
the car to active travel;
Provide high quality information and guidance on local air quality to members of the public;
Develop and implement measures to reduce traffic and congestion-related emissions,
addressing road network flow and functionality;
Support and stimulate sustainable citywide economic growth, including a focus on reducing
carbon emissions; and
Ensure that as a council we lead by example in supporting sustainable working practices,
minimising our own emissions and carbon footprint.
The strategic objectives are underpinned by the following core principles: evidenced-based
practice, innovation, collaborative working, monitoring and evaluation, ambition, seeking funding,
and analysis.
In addition, various approaches and actions PCC intend to take to improve local air quality are
detailed, many of which will be incorporated into the Air Quality Action Plan which will be
developed further following approval of this Air Quality Local Plan.
3.3.4. Portsmouth International Port Air Quality Strategy
In January 2019 the Government published the Clean Air Strategy which set out plans to address
air pollution across the UK, aiming to protect the environment and public health. Previous
approaches to addressing air pollution had focused on tackling the individual biggest sources of
pollution, and for the transport sector the focus to date has mainly been on road traffic.
As outlined in this OBC, work is ongoing to reduce emissions from road traffic; however work to
consider the impact of other emitters such as shipping and ports is still underway. As a result these
sectors are now being asked by Government to play a larger role in delivering clean air for all.
The Clean Air Strategy requests that all large English ports submit an initial commitment to
understanding their air quality impacts by December 2019, followed by production of a final Port Air
Quality Strategy (PAQS) by July 2020. The PAQS are intended to give ports an opportunity to
demonstrate their commitment to tackling air quality issues as well as their proactive engagement
with Government, local communities and wider stakeholders to reduce pollutant emissions from
their activities.
In line with this requirement Portsmouth International Port are currently preparing their PAQS
ahead of the initial submission later in 2019. However, it should be noted that work to reduce the
emissions from Portsmouth International Port has been in progress for some time and this year the
Port Director announced the port's ambition to become the UK's first zero emission port. Measures
undertaken to date include, but are not limited to:

PORTSMOUTH CITY COUNCIL
27
Being one of 10 partners in the Ports Energy and Carbon Savings (PECS) Interreg 2 Seas
project to develop, test and implement different tools and technologies to reduce the carbon
footprint on SME ports and marinas and to make their functioning more energy efficient and
cost effective;
Working with operator Brittany Ferries to introduce the first passenger ship in the word
powered by liquefied natural gas (LNG) to the fleet in Portsmouth;
Development of a new terminal building in 2011 which was the first public building in the
country to be largely heated and cooled using thermal energy and sea water.
Wider local policy context
3.4.1. Introduction
Portsmouth is a bustling south coast city with unique geography, being surrounded by 49km of
coastline on three sides. Its historic, diverse and vibrant waterfront contains the Naval Base,
Portsmouth International Port, and major tourist attractions (such as Southsea seafront, Gunwharf
Quays retail outlet, and the world-renowned Portsmouth Historic Dockyard / Mary Rose Museum).
In addition, the University of Portsmouth in the city centre has a population of c. 20,000 students
and has ambitious plans for growth.
It is one of the most densely populated cities in Europe (with a population density higher than some
parts of London), and its population of around 211,80024 is expected to grow to 235,500 by 203425.
In terms of transport, Portsea Island only has three roads linking to the mainland, the M275 and
A2030 connecting to the wider strategic road network, and the A3. The M275 provides a direct link
from the strategic road network to Portsmouth International Port and onwards into the heart of the
city via the A3. Portsmouth has five rail stations and direct rail connections with London Waterloo
and Victoria, as well as Bristol and Wales. It has good bus and coach links across the city, sub-
region and country. There are regular ferry services to Gosport, the Isle of Wight and Hayling
Island as well as cross-channel services to Europe and the Channel Islands.
Portsmouth is a key centre for the local economy, with high visitor numbers, and high levels of
inbound and outbound vehicular commuting, which can contribute to significant congestion within
some parts of the city, particularly at peak times. The city is a net importer of labour, with over
25,000 inbound commuters arriving from other parts of the city region each day compared to just
over 13,000 Portsmouth residents travelling out of the city to jobs in other parts of the city region.
This indicates that surrounding suburbs such as Fareham, Gosport and Havant are feeding
Portsmouth’s employment market, with respectively 17%, 18% and 24% of their residents working
in Portsmouth. Meanwhile Portsmouth itself has a fairly high level of commuting self- containment
(65%) – a majority of city residents also work in the city, reflecting some of the geographic
difficulties facing out-commuting flows, particularly from Portsea Island, as a result of a limited
selection of routes off the island - as well as a reasonably wide range of employment opportunities
available within the city.
These factors create unique challenges for Portsmouth in terms of improving its air quality.
24 NOMIS - https://www.nomisweb.co.uk/reports/lmp/la/1946157284/report.aspx?town=portsmouth#tabrespop 25 Office for National Statistics - Subnational population projections for England: 2014-based projections

PORTSMOUTH CITY COUNCIL
28
3.4.2. Economic growth context
There are ambitious plans for growth across the city and wider sub-region. The PUSH26 Spatial
Strategy Position Statement identifies a need for 17,020 dwellings in Portsmouth by 2034 and
92,000 square metres of office floorspace and 28,000 of mixed B-Class floorspace.
The two exceedance sites are located in the city centre, a key development area within the city,
and are therefore expected to experience increased travel demand in future years.
3.4.3. Transport context27
Roads – Portsmouth’s economic success has created challenges on the road network, and a
number of the principle roads in the city suffer congestion at peak times. According to the 2011
census, c.56,000 people who work in Portsmouth (both residents of the city and people travelling
from further afield) commute by car, either as a driver or a passenger; and approximately 40,000
Portsmouth residents drive to work each day (to destinations within Portsmouth and further afield).
Furthermore the two ports cater for approximately 1.5 million vehicle movements annually.
Within the city, there is limited space to provide additional highway space, and although improving
pinch points in the network may provide some journey time benefits, there is little opportunity to
significantly add capacity to the highway network.
Buses - About 7.5% of work journeys in the city are undertaken by bus according to the 2011
census. There have been significant investments in the city’s bus system in recent years, including
new bus fleets, bus priority, improved shelters, real time information (RTI) and all operator
contactless ticketing, as well as the introduction of Park & Ride and the re-development of The
Hard Gateway (public transport interchange).
However, on congested routes bus services can suffer poor journey time reliability making them
less attractive to people. It is also acknowledged that bus fares in the city are high, with the cost of
parking and private hire vehicles, being a competitive alternative. As a result, Portsmouth has the
lowest number of bus journeys per person per year in the south east28. If PCC's bid into the
Transforming Cities Fund is successful significant work will be undertaken to address such
challenges and increase bus use in the city and wider sub-region.
Rail – Some 3% of people who work in Portsmouth currently catch the train to work according to
2011 Census. Portsmouth and Southsea, Portsmouth Harbour and Fratton are the major train
stations in the city, and the city has identified improvements to them which will enhance their
position as gateways into the city. In general, train services don’t currently compete well with the
car, in terms of speed and convenience, for many destinations in the Solent including Southampton
and Southampton Airport.
However, there are a number of proposals to improve rail services in the sub-region, affecting
Portsmouth in particular, promoted by Network Rail and Solent Transport.
Walking and cycling – Levels of cycling in the city are higher than in other parts of the sub-region.
Overall, 8.3% of the people working in Portsmouth regularly cycled to work in 2011, but there is
considerable variation in levels of cycling across the city, with low levels in the city centre and north
of the M2729. Levels of walking in Portsmouth are higher than the national average30, but again
vary across the city.
26 Partnership for Urban South Hampshire 27 Large taken from the Evidence Base for LTP Refresh (April 2017). 28 DfT annual bus statistics, Table BUS0110 29 Census 2011 30 Census 2011

PORTSMOUTH CITY COUNCIL
29
The city council has delivered a comprehensive behaviour change programme over the last five
years to encourage people in Portsmouth to walk and cycle more. In the 2018 NHT Survey,
Portsmouth ranked 7th out of 113 local authorities for walking provision and 22nd out of 113 for
provision of cycle routes.
Water based transport- There are regular ferry services to Gosport, Hayling Island and the Isle of
Wight as well as cross-channel services to Europe that all depart from Portsmouth.
Licensed taxis and Private Hire Vehicles - Portsmouth has a comprehensive taxi and private
hire service, offering competitive rates and high availability of vehicles. There are currently 234
licensed (hackney carriage) taxis and 976 private hire vehicles (1210 in total) in the city equating to
one licensed taxi or private hire vehicle for every 174 people. Virtually all hackney carriages are
owned by self-employed drivers. Approximately half of private hire vehicles are owned by self-
employed drivers, or very small operators with less than five licenses. The remainder are run by
operators with more than five licenses. The majority of these vehicles are believed to be leased
rather than owned outright. The majority of operators own less than 25 vehicles, but there are a
small number of operators with much larger fleets.
The composition of the registered private hire and licensed taxi fleet is 93% diesel (93%), 4%
petrol, 3% hybrid, and <1% electric. Currently, half of taxis would be compliant with the
requirements of a charging Clean Air Zone, with the remaining half representing older and more
polluting vehicles.
Parking - There is an oversupply of off-street parking in the city centre, contributing to low prices
and helping to push up demand. The city council only owns and operates approximately a quarter
of the city centre off-street parking provision, limiting its parking management capability.
A one day parking audit undertaken in Summer 2019 showed that average occupancy across nine
city centre car parks (2263 spaces) peaked at 52% occupancy (around 12:00 midday). Surveys
were only conducted between 07:00 and 12:00, but previous parking audits have shown that car
park occupancy peaks around midday and declines over the course of the afternoon. The busiest
car parks were Guildhall and Isambard Brunel MSPC where occupancy was greater than 75%
between 10:00 and 12:00. Overall, the results were similar on a Saturday, but use of the above
two car parks were lower, reflecting their commuter-focused market.
There are proposals to increase the parking provision at the Park & Ride site through the addition
of decking. The re-development of city council owned city centre car parks has also been
identified as a future opportunity to help unlock development land and reduce the supply of
parking.
The city council has introduced Controlled Parking Zones (CPZs) in many areas throughout the city
to help improve residents’ access to on-street parking near to their homes, and further CPZ s are
proposed.
Car ownership - Car ownership in Portsmouth has been growing steadily in recent decades, from
90,200 licensed cars in 2009 to 103,154 licensed cars in 2018, placing additional pressure on the
road network and parking provision for residents, visitors and workers. Within the overall increase
in vehicles in the city, in recent years there has been a growth in the number of electric vehicles.
For example of the 103,154 cars and 17,500 light goods vehicles licensed in Portsmouth
(postcodes PO1 to PO6) at the end of 2018 (Q4), 1,648 were plug-in cars, LGVs and

PORTSMOUTH CITY COUNCIL
30
quadricycles31.
3.4.4. Socio-demographic context
Portsmouth faces a number of public health challenges, which mean that 64% of early deaths in
the city are attributable to cancer, coronary heart disease, respiratory disease and liver disease32.
It is estimated that in Portsmouth, 95 deaths per year occur where air pollution has been a
contributing factor33.
Figure 3-5 Levels of income deprivation in Portsmouth
Source: English indices of deprivation 2015: income deprivation component (DCLG)
Portsmouth is currently ranked 63rd out of 326 local authorities, where 1 is the most deprived in
terms of average score. Unemployment levels in the city are double the average for the south east
of England, and in some wards levels of poverty are twice the national average34. Higher levels of
deprivation are indicators for poorer public health and lower levels of physical activity nationally.
As shown in Figure 2-5, the two exceedance links coincide with the areas of highest deprivation
within the city, as well as high proportions of children, people with disabilities, and Black, Asian and
Minority Ethnic (BAME) residents (all amongst the 20 top LSOAs in England and Wales). These
groups are currently being disproportionately affected by poor air quality and the associated
impacts on health.
31 https://www.gov.uk/government/statistical-data-sets/allvehicles-veh01. It is recognised that this may under-estimate the actual number of electric vehicles owned by Portsmouth residents, as electric cars are often centrally registered first before being sent to dealers where there is a specific demand. 32 Portsmouth CC Public Health Strategy 33 Public Health England, Centre for Radiation, Chemical and Environmental Hazards (PHE-CRCE) (2014); Estimating local mortality burdens associated with particulate air pollution. 34 JSNA Annual Summary 2016

PORTSMOUTH CITY COUNCIL
31
Portsmouth also has an ageing population35; and elderly people can be disproportionately affected
by air pollution.
3.4.5. Fit with other local policies and strategies
A summary of other local policies and strategies is presented in Table 2-5 which will complement
this local plan.
Table 3-5 Relevant local policies and strategies
Local policies and strategies Key relevant themes
Economic growth and development
Local
Emerging Local Plan
Emerging Revised Parking Standards
Emerging Economic Development and
Regeneration Strategy
Sub-Regional
Solent LEP36 Strategic Economic Plan
PUSH37 Spatial Strategy
Encouraging economic growth and reducing
social deprivation.
‘To make Portsmouth the premier waterfront city
with an unrivalled maritime heritage - a great
place to live, work and visit’. (Local Plan)
‘Delivering sustainable, economic-led growth and
regeneration … offering a better quality of life for
everyone who lives, works and spends their
leisure time here’ (PUSH Spatial Strategy Position
Statement)
Transport
Local
Emerging Local Transport Plan
Park & Ride Strategy
Emerging Parking Strategy
Emerging Walking & Cycling Strategy
Highway Maintenance Strategy
Street Lighting Strategy
Sub-Regional / Regional
Solent LEP Strategic Transport Investment Plan
Transport for the South East Emerging Transport
Strategy
Supporting economic growth and improving
strategic access to Portsmouth.
Developing a sustainable and connected
transport network.
‘Need for a modern and resilient transport
network that can enable the region to fulfil its
economic potential by providing the conditions
that enable businesses and people to thrive and
productivity to increase’. (Strategic Transport
Investment Plan)
Health and well-being
Joint Health and Well-being Strategy
Obesity Strategy
Physical Activity Strategy
Anti-Poverty Strategy
Ageing Population Strategy
Emerging Equalities and Diversity Strategy
Children's Trust Board children's physical health
and wellbeing strategy 2018-2021
Portsmouth Clinical Commissioning Group -
20/20 Vision
Improving public health and well-being
Increasing levels of physical activity
Tackling social isolation (particularly amongst the
elderly)
Reducing social deprivation and health
inequalities
Promoting good health in children, from
conception to adulthood
35 Portsmouth’s ageing population strategy 2010-2020 36 Local Enterprise Partnership 37 Partnership for Urban South Hampshire

PORTSMOUTH CITY COUNCIL
32
Environment and Communities
Air Quality Strategy
Sustainability Strategy
Climate Change Strategy
Climate Emergency pledge to achieve net zero
carbon emissions in Portsmouth by 2030
Improve air quality
Enable a sustainable transport system in
Portsmouth and promote sustainable travel
choices across Portsmouth City Council
Reduce Portsmouth’s carbon footprint and adapt
to climate change
The table highlights the local focus on promoting economic growth, reducing levels of social
deprivation, improving transport connectivity by sustainable modes, and encourage active travel.
While the focus is on identifying options which will achieve compliance in the shortest possible
time, it is also important that options fit and/or complement these local priorities, or if not, mitigation
measures are put in place to minimise the dis-benefits.
Spending objectives / critical success factors
The case for intervention is set out in Section 2.2 to 2.4 above. Local modelling to date indicates
that NO2 concentrations in Portsmouth will continue to be non-compliant until 2023, which means
that PCC will need to implement measures to bring forward compliance as quickly as possible.
The objectives which any intervention (package of measures) should seek to achieve are
summarised below. These reflect the guidance set out by JAQU in Third Wave Local Authorities –
Guidance (Options Appraisal), and the local Portsmouth context.
3.5.1. Primary objective
The primary objective of the Portsmouth Air Quality Local Plan is:
to deliver a scheme that leads to compliance with NO2 concentrations in the shortest possible
time, without significantly worsening emissions elsewhere.
This objective has been set by JAQU and is crucial to the overall success of the project. Packages
of options that do not meet this criterion should be rejected.
3.5.2. Secondary objectives
In addition, interventions should seek to achieve the following secondary objectives:
deliver value for money;
ensure that particular groups of stakeholders are not disproportionately impacted by any
negative impacts associated with the proposed intervention;
complement existing and planned wider policies for the city (including promote economic
growth, reduce levels of social deprivation, improve health and encourage sustainable and
active travel);
be deliverable in terms of supply side capacity and capability;
be affordable; and
be achievable (taking into account technical, legislative, and political and public acceptability
constraints).
Benefits, risks, constraints and dependencies
The following section identifies benefits, risks, constraints and dependencies related to addressing
the identified air quality problem.

PORTSMOUTH CITY COUNCIL
33
3.6.1. Benefits
Opportunity to promote and optimise public transport use and walking and cycling
infrastructure.
Opportunity to deliver longer term environmental benefits, and for Portsmouth to become an
exemplar city.
Opportunity to enhance understanding of successful measures for achieving air quality
improvements, for longer term use in Portsmouth and elsewhere.
3.6.2. Risks
Risk that problem will simply be displaced to other parts of the city (and neighbouring
authorities), if inappropriate options are shortlisted.
The M275/A3 ‘western corridor’ route is the most attractive route into Portsmouth and there is a
risk that any measures to discourage vehicle trips simply free up space for other vehicles to
route away from less attractive routes currently being used.
Risk that measures conflict with other local objectives for economic growth and development or
other local objectives.
Risk of on-going health issues if measures are insufficient to significantly reduce emissions in
the shortest possible time.
Risk that charging measures have a disproportionate impact on low income groups and
becomes a regressive tax.
3.6.3. Constraints
Being a majority island city with only three roads linking Portsea Island to the mainland,
Portsmouth has a unique layout and any changes to the main road network require city wide
consideration to ensure that potential displacement of traffic does not increase congestion and
air pollution in other locations.
Limited local authority control of city centre parking due to substantial amount of privately
controlled parking.
Uncertainty about future economic growth, and impacts on traffic flow, vehicle composition, and
mode choice.
Less than a quarter of NO2 concentrations in the vicinity of the exceedance locations are
associated with road transport sources, representing a significant challenge for this Plan which
is primarily focused on transport-focused solutions.
Uncertainty over Brexit and potential impact upon the operation of the Portsmouth International
Port, including the volume, nature and flow of vehicles entering / leaving the port.
Accuracy of the transport and air quality models, which are only able to provide a best estimate
of future conditions given the evidence available and are intended as a tool rather than a true
representation of conditions.
3.6.4. Dependencies
Transforming Cities Fund – Rapid Transit proposals are being developed with the DfT to
deliver a step change in public transport in the City Region. A draft Strategic Outline Business
Case (SOBC) was submitted to the Department for Transport in June 2019 setting out a holistic
proposition for South East Hampshire Rapid Transit (SEHRT) and making the case for funding
from Tranche 2 of the Department for Transport’s (DfT’s) Transforming Cities Fund (TCF). A
Final Outline Business Case will be submitted in November 2019, with a funding decision in
April 2020.
The vision is to deliver a high-quality integrated, sustainable multimodal travel system which
will connect communities in Gosport, Fareham, Havant, Waterlooville and Isle of Wight with

PORTSMOUTH CITY COUNCIL
34
Portsmouth, spread prosperity and drive up productivity. This will involve a branded network of
fast, frequent, reliable and quality services and infrastructure, primarily on-street, providing turn
up and go, end to end connectivity, limited-stop travel and interchange at key locations within
the city region.
The Tranche 2 bid focused on a proposed network of rapid transit routes and supporting
infrastructure improvements. One of the principle routes proposed passes through the city
centre (including Commercial Road) and Alfred Road, with various infrastructure measures
proposed.
In support of the TCF bid, both Stagecoach and First are looking to invest in new vehicles.
Stagecoach is looking to invest in new electric double decker buses, and First is looking to
invest in 40 new diesel vehicles. Both operators are supportive of upgrading ticket machines
for Tap On Tap Off (TOTO) across the TCF network (due to be implemented by the end of
2021).
Complementary policies (not being delivered as part of TCF, but will support the objectives)
include: Portsmouth City Council Parking Strategy, Portsmouth Local Cycling and Walking
Infrastructure Plan, Portsmouth City Council Local Transport Plan, Portsmouth City Council
Parking Supplementary Planning Document, and Portsmouth Local Plan.
Portsmouth Park & Ride Expansion – The Council is currently developing a business case to
examine the potential for a significant expansion of the Park & Ride site at Junction 1 of the
M275. The location of the site provides the opportunity to remove cars from the network before
they reach the exceedance locations in the city centre. An expanded Park & Ride site could
play an important role in providing an alternative option for car drivers. The case for an
expanded facility is based on strategic policy objectives and cross-cutting priorities which are of
city-wide and long-term importance and critical to the city’s future, with benefits focused on the
longer term horizon.
Solent Future Mobility Zone Bid – Solent Transport is bidding for Future Mobility Zone
funding (up to £43.95m) to deliver innovation in urban transport. The funding is available over
a four year period to March 2023, with successful bidders due to be announced in November
2019. The bid focuses on two over-arching themes:
- Theme 1: Personal Mobility: providing new modes of travel, and developing new,
complementary means of planning and paying for journeys; and
- Theme 2: Sustainable Urban Logistics: developing innovative approaches to address
impacts of freight and logistics in urban environments, recognising that due to changes to
the way people shop and work and increasing levels of online retail and service related-
activity, light goods vehicles are the fastest growing sector of road traffic and a significant
contributor to local congestion and air quality issues.
In addition, two projects are proposed which would bring both themes together, exploring novel
combined approaches to movement of people and freight.
Theme 1: Personal Mobility
Mobility as a
Service (MaaS
app) – University
trial project
(£7.5m)
Creation of a viable platform which links together other Theme 1 projects across
the whole Solent sub-region through delivery of a “marketplace” providing
planning/ access/ booking/ payment for new modes such as Dynamic Demand
Responsive Transit, cycle share and lift share alongside more traditional public
transport. Initially focused on the Universities of Portsmouth (UoP) and
Southampton (UoS) as testbeds.

PORTSMOUTH CITY COUNCIL
35
Growing Solent
Go (£1.3m)
Improvements to Solent Go’s product line, designed to reduce cost and
convenience deterrents to multi-operator/ multi-stage public transport journeys in
the Solent area, and purchased and ticketed via the MaaS “marketplace” app.
Mobility Credits
trial (£1.0m)
Small scale trial of mobility credits through provision of “free” spend (£30-
£100/month) on a smartphone travel planning/ ticketing MaaS app each month
to a trial group of residents within Havant Borough (a suburban area in
Portsmouth city region). The project would be targeted at users in low income
groups, aged 35 and under.
Dynamic Demand
Responsive
Transit (£3.5m)
Trial of DDRT services in different geographical areas and with differences in the
nature of service offered, to identify potential routes to viability.
Bike/ e-bike share
and smart cycle
locks trial (£4.8m)
Project to kickstart a Solent bike share scheme focused on Portsmouth (with an
extension into Gosport along the Eclipse BRT corridor) and Southampton. This
scheme would aim to be the most secure bike share scheme in the country.
Lift sharing
(£0.8m)
Project to support major employers to set up lift-sharing schemes in workplaces,
and enable car sharing as an option within the Solent MaaS app.
Theme 2: Sustainable Urban Logistics
Drone Logistics
(£8.0m)
The SMZ Drone Logistics Project would realise the first Unmanned Aerial
Vehicle (UAV) beyond-visual-line-of-sight (BVLOS) flights between medical
centres across the Solent region (e.g. between Queen Alexandra Hospital in
Portsmouth and St Mary’s Hospital on the Isle of Wight) trips which currently
need to travel through Portsmouth.
Halls / Higher
Education
Institution (HEI)
Consolidation
project (£1.3m)
Large scale trials of consolidated business-to-consumer (B2C) parcel delivery to
students living in halls of residence at Higher Education Institutions (HEIs) in
Southampton and Portsmouth, and to university staff working on campus. This
would be achieved using established distribution centres and various micro-
consolidation options.
Macro
Consolidation
(£2.8m)
This project would deliver an out-of-city freight consolidation centre for
Portsmouth and increase the use of an existing centre in Southampton, to
reduce the volume of commercial traffic in urban centres, and transfer deliveries
to cleaner vehicles for the “last mile”. Supported by Delivery and Service Plans
(DSPs) or “Freight Travel Plans” which identify the operational, environmental
and financial opportunities related to freight and servicing activities at specific
business locations and are the first stage in developing sustainable
consolidation approaches.
Micro
Consolidation
(£2.9m)
This project would trial the creation and use of ‘Micro-Consolidation Points’ to
assist last-mile freight activities in both cities. This will involve:
Dynamically managing the use of existing parking spaces/ bays, local
mobility hubs and /or public transport interchanges for timed drop-offs and
pick-ups by parcel carriers through a newly developed loading bay booking
tool; and/or;
Installing locker systems and using established ‘attended delivery’ services
for drop-off and pick-up to create opportunities for last-mile e-cargo bike
deliveries, portering or direct pick-up or drop-off.
Linking Projects
MPV and Local
Mobility Hubs /
Combination of Demand Responsive Transit and Last Mile Freight - Project
to identify potential new uses for DRT in quieter periods which may help to

PORTSMOUTH CITY COUNCIL
36
Interchanges
(£3.2m)
improve their financial sustainability. Multi-Purpose Vehicle (MPV) feasibility
investigation and trial.
Local Mobility Hubs and Interchanges - Many of the above projects would be
brought together in one place at transport interchanges and local mobility
hubs.
The above proposals would all play an important role in improving the attractiveness of sustainable
modes for personal mobility and freight / delivery / servicing movements, reducing vehicle
emissions in the two exceedance locations and across the wider study area. Due to the
uncommitted nature of these projects they have not been included within the core packages
of interventions proposed as part of this Outline Business Case, however, they are
expected to have a positive impact on air quality, reinforcing the benefits of the proposed
package in the medium to longer term.
Theory of change and logic mapping for options
Figure 2-6 represents Portsmouth City Council’s overarching vision of change for achieving
compliance with EU limit values for NO2 in the shortest possible time.
A logic map is a systematic and visual way of presenting the ‘theory of change’ underpinning a
programme / policy, setting out how expenditure and invested resources (inputs) generates
activities (outputs) which are then expected to lead to particular changes in outcomes and impacts.
It will be used initially to guide the option development and assessment process, and later to scope
the baseline data requirements for ex-post evaluation.

PORTSMOUTH CITY COUNCIL
37
Figure 3-6 Logic map to represent Portsmouth City Council’s overarching vision of change

PORTSMOUTH CITY COUNCIL
38
Stakeholder input / support
3.8.1. Stakeholder survey
An online survey of those who currently drive in the proposed charging CAZ boundary was
undertaken in June 2019 to understand how the travel behaviour of drivers in Portsmouth could
change should a charging zone be introduced. Responses were received from 4,636 individuals of
which 91% were car drivers, 2% were taxi drivers, and 4% drove a Light Goods Vehicle. In
addition, some 62 businesses interacted with the business survey.
Feedback from car drivers
Profile - Over half of car drivers responding live on Portsea Island, with the rest coming from
further afield. A good spread of ages was achieved; and two-thirds (67%) work full time. The
average household income for compliant drivers is £46,726 compared to £43,284 for the
sampled non-compliant drivers.
Compliant / non-compliant car use - The majority of respondents (59%) normally drive non-
compliant cars, of which 64% are driving diesel vehicles and 36% are driving petrol vehicles.
Vehicle replacement - Some 40% of drivers of non-compliant cars expect to replace their
vehicle in the next 5 years (by 2024), with 27% planning to do so in the next two or three years.
However, 60% of non-compliant cars will potentially still be on the road in 2024.
Frequency and purpose of travel - The majority of non-compliant respondents (>80%) travel
on to or off of Portsea Island at least once a week. It is therefore clear that the implementation
of a Portsea Island-wide CAZ would affect a large proportion of both residents and non-
residents. In addition, the majority of residents with non-compliant vehicles (>93%) are making
journeys within the proposed CAZ on at least a weekly basis. Over half of the most frequent
journeys being made by non-compliant car drivers are commutes to and from work (54% of
respondents).
Response to a charging CAZ - Figure 2-6 shows the impact a CAZ would have on non-
compliant car users. Overall the results show that the introduction of even a daily £5 charging
point has a marked impact upon non-compliant car travel within and through Portsea Island;
41% would avoid the charging area (changed their destination or not made the journey), 29%
would either replace their vehicle or travel using a different mode although 30% would still
make the journey in their non-compliant car and just pay the charge. An increase to £10 sees a
shift in behaviour with fewer people willing to pay the charge (17%); people would rather
replace or retro-fit their vehicle or not make the journey. Increases beyond £10 however, have
little further impact upon non-compliant car users.
Response amongst drivers with a disability - A charging CAZ would encourage a higher
proportion of those with a disability to not make their journeys, potentially isolating this group of
people (e.g. 31% of those with a disability vs 24% of those without a disability assuming a £10
charge). Replacing or retro-fitting their vehicle is also much less appealing to those with a
disability at all charging levels (<16%). Consistently people with a disability are less likely to
make the same journey using a different mode - it's simply not a viable option for many
because of their disabilities.

PORTSMOUTH CITY COUNCIL
39
Figure 3-7 Non-compliant car drivers stated response to a charging CAZ
Response by journey purpose - Figure 2-7 suggests that a charging CAZ will drive leisure
and retail shoppers elsewhere and encourage them to stay at home; 33% of respondents will
change their destination to avoid the charging area (i.e. go to a retail outlet or entertainment
venue outside of Portsmouth) at the £10 level, or simply won't make the journey at all (34% of
respondents). Based on these results a charging CAZ would have a significant adverse impact
on the leisure and shopping economy in Portsmouth. Around a fifth of people who’s most
frequent journey within or through Portsea Island is commuting will pay a £10 charge.
Appeal of schemes to help reduce pollution from private vehicles - Figure 2-8 shows the
popularity of other schemes to help reduce pollution. A fast, high quality bus service (as might
be delivered through the Transforming Cities Fund bid for a SR Hants Rapid Transit scheme)
was the most popular option (supported by 33%), followed by high quality cycle routes, and an
enhanced Park & Ride (mainly amongst those travelling into the potential CAZ). Drivers
travelling within the CAZ are generally more positive towards the mitigation measures
compared to those driving through the CAZ frequently, particularly towards the mobility credit
scheme offering free public transport.
Other comments - There was widespread concerns that a CAZ would have a detrimental
effect on local businesses.

PORTSMOUTH CITY COUNCIL
40
Figure 3-8 Non-compliant car drivers stated response to a charging CAZ by reason for most frequent travel
Figure 3-9 Appeal of schemes to help reduce pollution from private cars
Feedback from taxi drivers
Sample size – The taxi results are based on a small sample of 29 non-compliant drivers who
own their vehicle. Drivers of leased vehicles were routed out of the survey prior to being asked
for their response to a charging CAZ because they cannot personally decide to replace a non-
compliant leased vehicle. The results are therefore assumed to be indicative only and may not
be representative of the wider population of taxi drivers in Portsmouth.

PORTSMOUTH CITY COUNCIL
41
Vehicle replacement – A large majority of respondents (72%) are planning to replace their
non-compliant taxi/PHV within the next five years, with 55% planning to do so within the next
three years. Encouragingly, a small majority (52%) have plans to replace their non-compliant
taxis/PHVs with complaint diesel or hybrid cars within the next four years.
Response to a charging CAZ – Based on a small sample of 26 non-compliant taxi drivers and
assuming a £10 CAZ charge, 9 drivers said they would retire early or leave the taxi trade, and
8 said they would stop working in the CAZ area. This would have significant consequences for
the taxi trade in Portsmouth if representative of the wider taxi driver population.
Appeal of schemes to help reduce pollution from private vehicles – Some 19 drivers were
supportive of ‘an interest free loan to support upgrade to ultralow emission vehicle’, with 9
supporting ‘a grant to support upgrade to an electric vehicle, supported by the installation of EV
charging points at taxi ranks and other key locations around the city’.
Feedback from Light Goods Vehicle drivers
Sample size – Just over 100 responses were received from non-compliant LGV drivers. The
results are therefore assumed to be indicative only and may not be representative of the wider
population of LGV drivers in Portsmouth.
Profile – The majority of LGV drivers responding (65%) live on Portsea Island, with the rest
coming from further afield. Those living on Portsea Island are more likely to have a non-
compliant vehicle. Just under half (47% of respondents) earn less than £20,000 per annum.
Compliant / non-compliant car use - The majority of respondents (79%) normally drive a
non-compliant LGV.
Vehicle replacement - Almost three-quarters (73%) of non-compliant LGV/van drivers
responding to the survey said they have no specific plans to replace their vehicle in the next
five years. Based on these results, there is likely to be a high proportion of non-compliant
LGVs are still likely to be on the road in 2022.
Frequency and purpose of travel - Non-compliant LGV/van drivers are travelling around
(within) Portsea Island frequently with 65% of respondents travelling daily; with only 30%
travelling on/off the island on a daily basis (i.e. these results suggest there are a lot of local
movements). The majority of non-compliant LGV/van drivers are commuting (42% of
respondents) or travelling for work (36% of respondents).
Response to a charging CAZ – Based on a sample of 95 non-compliant LGV drivers and
assuming a £10 CAZ charge, 23 drivers said they would pay the charge, 28 said that they
would change their destination, 18 would replace or retro-fit their vehicle, and 18 would not
make the journey. Making the same journey using a different mode is not a popular choice
amongst LGV drivers, with just 8 drivers selecting this option; believed to be because LGV
drivers often need their vehicles to carry essential work equipment.
Appeal of schemes to help reduce pollution from private vehicles – Some 32 drivers were
supportive of ‘an interest free loan to support upgrade to ultralow emission vehicle’, with 30
supporting ‘a grant to support upgrade to an electric vehicle, supported by the installation of EV
charging points at taxi ranks and other key locations around the city’. Only 3 were supportive of
a freight consolidation centre, although this is more likely to be appropriate for HGV
movements.
Feedback from businesses
A separate consultation survey was designed and distributed directly to local businesses (with
fleets of Light Good Vehicles (LGVs) and/or Heavy Goods Vehicles (HGVs)) through PCC
distribution lists and it was promoted on social media.
PORTSMOUTH CITY COUNCIL
42
Sample size – In total, 62 businesses responded, reflecting a range of business sizes. The
results are assumed to be indicative only and may not be representative of the wider
population of businesses in Portsmouth.
Response to a charging CAZ – Around half of the 26 businesses with LGV fleets said they
would relocate their business out of the CAZ; and just under half of the 16 businesses with
HGV drivers said they would do the same. It is thought that these responses are indicative of
the concern businesses in Portsmouth have about a potential CAZ, but that in practice the level
of relocation would be much lower. At the time of the survey there had been no other
engagement with the business community about a potential CAZ. Nevertheless, the results
highlight the need for further consideration to be given to the potential business impacts of a
CAZ.
Appeal of schemes to help reduce pollution from private vehicles – The most popular
options amongst the 26 businesses with LGV fleets were ‘a grant to upgrade to an electric
vehicle, supported by the installation of EV charging points at key locations around the city’ (9
businesses), and ‘an interest free loan to support upgrade to ultra-low emission vehicle’ (7
businesses).
The most popular options amongst the 16 businesses with HGV fleets were ‘a grant to retrofit
the existing fleet so that the vehicles become Euro VI compliant’ (5 businesses), ‘an interest
free loan to support upgrade to ultralow emission vehicles (5 businesses), and ‘reducing the
CAZ charge for journeys made outside of peak hours’ (4 businesses).
3.8.2. Focus groups
A number of focus groups were held with taxi drivers (hackney carriage drivers, private hire vehicle
drivers, and taxi companies) and local businesses (including city centre retailers, manufacturing
businesses, hauliers, Wightlink, Portsmouth International Port and the Naval Base).
Key issues identified by taxi drivers / companies:
Concern from drivers and operators about the cost of upgrading vehicles to compliant types;
Drivers would be interested in Electric Vehicles however there is a lack of charging
infrastructure in the city (particularly at taxi ranks and other pick-up locations), and few
residents have off-street parking at home. In addition, the cost of purchasing an EV is seen as
prohibitive;
Drivers and operators would like to see loans and grants available to help with the cost of
switching to a compliant vehicle type, however there is limited appetite for retrofit due to the
perception that it is not worth investing in older vehicles;
Particular concern about the cost of upgrading wheelchair accessible vehicles to compliant
types and would like to see a bigger loan or grant available for replacement of this type of
vehicle;
Many of Portsmouth's private hire vehicles are leased, and therefore there is a concern that if
the availability of loans or grants for replacement was limited to only small fleets, the majority of
private hire vehicles would not be eligible for support.
Key issues identified by local businesses:
A number of businesses identified plans to upgrade their vehicles to Euro 4 or Euro 6
compliance standards, with a small number of businesses already underway with this process.
It is typically larger companies who have the capacity to do this and concerns were raised over
the affordability for such fleet upgrades amongst smaller organisations, suggesting that
interest-free loans or grant money could assist them in purchasing compliant vehicles;

PORTSMOUTH CITY COUNCIL
43
Some businesses operating within Portsmouth lease their vehicle fleets meaning they are
unable to upgrade their vehicles ahead of 2022, however, it would be helpful to have funding
available to facilitate businesses 'buying-out' of existing leases so that they can enter into new
agreements to lead compliant vehicle types;
The majority of local businesses have LGV fleets, and there is a perception that the HGVs
which do come into the city are most commonly operated by large companies who trade across
the country and will have greater ability to either face the costs of a CAZ with non-compliant
vehicles, or upgrade their fleets with compliant vehicles if this has not already been done;
A centralised distribution point is recognised as a facility which would be used by some
businesses. However, others raised concern about such a facility adding another stage to the
distribution process and the potential increased cost to retailers as well as risk of goods being
lost in the system throughout the process;
Adjustments to CAZ times of operation was a common theme, with some businesses
suggesting that they would be happy to make alterations to delivery schedules if there were
time windows where charges were relieved. Others stressed this would not be beneficial to
them because it could require further costings, for example having staff available to receive
deliveries at retail outlets out of normal working hours;
There is major concern from some port and ferry travel companies over the high level of impact
they predict a CAZ will have on them. They have estimated that not only would a CAZ result in
major economic issues for their business with reduced clients, but that there may also be a
further significant impact on the local economy, particularly the Isle of Wight;
Wightlink which operates ferry services between Portsmouth and the Isle of Wight noted that
some of their customers use the services to connect with specialist buses which transfer
hospital patients, and that where possible these types of vehicles should be recognised for
their fundamental services and need to be considered for exemption;
There is concern that specialist fleets will struggle with CAZ charges - such as gritters or
vehicles with specialised kit temperature control. These types of vehicles are not operated
frequently and are harder to replace, with a longer procurement time.

PORTSMOUTH CITY COUNCIL
44
4. Economic Case
Introduction
This section presents an overview of the assessment and analysis undertaken to identify the
preferred option.
In particular, it:
describes the optioneering process used to identify a shortlist of options for assessment;
sets out the process for identifying the final shortlist of a benchmark CAZ (Portsea Island CAZ
C) and an Alternative Package (Small Area CAZ B + non-charging measures);
compares the performance of the two final shortlisted options in delivering the primary Critical
Success Factor (compliance with the EU Limit in the shortest possible time) and the various
secondary Critical Success Factors; and
identifies the Alternative Package (Small Area CAZ B + non-charging measures) as the
preferred package for implementation.
Optioneering process
The Strategic Outline Case (submitted January 2019) set out the process for identifying a long list
of options (structured around the spending objectives / critical success factors), in order to identify
a shortlist of better performing packages of options to take forward to Outline Business Case. This
process is summarised in Appendix B.
The SOC shortlist was re-assessed following the submission of the SOC, and the results from the
detailed local air quality modelling (undertaken to inform the OBC) which show exceedances in
slightly different locations from those suggested by the original PCM analysis. The process was
based on the following activities:
A PCC workshop with officers to discuss further options (March 2019)
Input from the Air Quality Stakeholder Group and Air Quality Project Board
Inputs from Members
Initial modelling of traffic and emissions impact
Further research and data collection relating to the various options.
This resulted in the following revised shortlist of options for further consideration (Table 3-1).
Table 4-1 Shortlisted package options for further consideration
ID Description OBC status
Charging Clean Air Zone
Portsea Island CAZ B
Targeting taxis and Private Hire Vehicles (PHVs), buses and coaches, and HGVs on Portsea island.
Potential package component.
Portsea Island CAZ C
Targeting taxis and Private Hire Vehicles (PHVs), buses and coaches, HGVs, LGVs on Portsea Island. Higher charges for buses and HGVs.
Expected Benchmark CAZ.
CAZ ? Small Area
CAZ B or C, focused on a smaller area Potential package component.
CAZ ? (Ext/int
Portsea Island CAZ B or C, focused on int/ext trips only (i.e. exempting local trips)
Potential package component.

PORTSMOUTH CITY COUNCIL
45
trips only)
A. Measures to reduce private car use
A1 Increase car-parking charges to discourage car use
Potential package component to encourage mode shift.
A2 Reduce number of car parking spaces to discourage car use
Potential package component to encourage mode shift.
A4 Increase on-street parking charges for residents (or vary charges based on vehicle emissions) to discourage car ownership or purchase of a cleaner vehicle
Potential complementary measure to discourage car ownership or use of a cleaner vehicle amongst Portsea Island residents. (See also D7)
A6 Advance and real time (social and conventional media, VMS) messaging to discourage driving on days of high pollution
Potential complementary measure to raise awareness and change behaviour.
A8 Introduce car clubs and car hire schemes (using low emission vehicles) in exceedance areas, with subsidised hire rates. To discourage car ownership and use
Potential complementary measure to discourage car ownership (but most effective as potential CAZ D mitigation measure).
A10 Mobility credit scheme - Provision of ‘mobility credit’ in return for giving up car use i.e. credit for use on other modes of transport or low emission car club cars
Potential complementary measure to discourage car ownership (but most effective as potential CAZ D mitigation measure).
B. Road network Measures to reduce private car use
B6 Change traffic priorities at Alfred Road / Queen Street (Additional green time to s/bound movements from Alfred Road to Queen Street)
Potential package component (as a temporary measure, prior to introduction of additional bus priority measures as part of the proposed SE Hants Rapid Transit (TCF bid)
B22b Rapid transit - Full TCF proposal for sub-region
Potential medium term solution (i.e. post 2022), subject to securing funding (i.e. sensitivity test).
D. Measures to encourage use of cleaner vehicles and more sustainable driving (to reduce tailpipe emissions)
D1 Anti-idling campaign Potential complementary measure to raise awareness and change behaviour.
D7 Discounted charges for residents on-street parking permits for low emission vehicles (vary charges based on vehicle emissions)
Potential complementary measure to discourage car ownership or use of a cleaner vehicle amongst Portsea residents. See also A4.
D9 Support to convert buses to lower emission fuels (including hybrid buses, biofuel powered buses, and electric buses, as an alternative to petrol and diesel)
Potential complementary measure (based on operator commitment, subject to securing TCF funding for rapid transit proposals – medium term measure). See B22b.
D10,D11 Encourage use of lower emissions taxis through incentives and tightening of existing licensing policies. Introduce charging points for taxis.
Potential package component or potential CAZ mitigation measure
D12 Encourage use of lower emission vehicles for business fleets (HGV / LGV fleets)
Options being developed as part of Solent Mobility Zone Bid
D13 Eco-driver training for businesses Potential complementary measure
E. Mode shift to sustainable modes
E1 Workplace Travel Planning Potential complementary measure to raise awareness and change behaviour
E2 School Travel Planning Potential complementary measure to raise awareness and change behaviour

PORTSMOUTH CITY COUNCIL
46
E3 Personal Journey Planning for residents Potential complementary measure to raise awareness and change behaviour
E4 Promote easitNETWORK and easitSHARE Potential complementary measure to raise awareness and change behaviour
E7a Promotion of Portsmouth Park & Ride amongst commuters
Potential complementary measure (most effective if combined with a CAZ D or significant parking restraint elsewhere)
E9b Contactless payment Potential complementary measure to encourage mode shift (as part of TCF Tranche 2 bid). See B22b.
E11 Mobility as a Service (MaaS) Potential complementary measure to encourage mode shift (part of Solent Mobility Zone bid).
E12 Improve cycling and walking facilities (e.g. cycle lanes, secure cycle storage, safe crossings, etc.)
Potential package component
F. Communications and marketing
F1 Targeted communications and marketing Potential complementary measure (an important element of any package of measures).
G. Other
G2a Freight consolidation measures (via Solent Consolidation Centre, and micro-trials)
Potential package component to reduce freight impact (part of Solent Mobility Zone bid).
G2b Service and Delivery Plans Potential package component to reduce freight impact (part of Solent Mobility Zone bid).
G3 Port-specific measures Portsmouth International Port are preparing a Port Air Quality Strategy (PAQS) by July 2020. This will outline proposals for reducing emissions intensity associated with port activities, which will also influence NO2 concentrations on Commercial Road and Alfred Road.
Through an iterative process of further analysis and assessment of likely impacts, deliverability
considerations, and consultation with the Air Quality Board, the shortlist of package options
identified above was further refined to produce the following filtered list of options to be assessed
further with detailed modelling in order to identify a final shortlist of a Benchmark and Alternative
Package for comparison:
Table 4-2 Packages of options modelled in detail
Options / packages Detail
0. 2022 Baseline 2022 Projected Base Year including committed developments.
1. Portsea Island CAZ B Targeting taxis and private hire vehicles (PHV), buses, coaches, HGVs across Portsea Island.
2. Portsea Island CAZ C Targeting taxis and Private Hire Vehicles (PHVs), buses and coaches, HGVs, LGVs on Portsea Island.
3. Small Area CAZ B Targeting taxis and private hire vehicles (PHV), buses, coaches, HGVs within a smaller area of the city.
4. Small Area CAZ B with non-charging measures (CAZ B+)
As Test 3 + parking measures + strategic cycling routes + modification to the traffic signal timings at the Alfred Road / Queen Street junction + complementary measures (not modelled).
5. Portsea Island CAZ B external trips only
As Test 1 but charge only applied to trips into / out of Portsea Island (i.e. not including internal trips), as these trips make up the vast majority of movements on the two exceedance links.

PORTSMOUTH CITY COUNCIL
47
CAZ Benchmark
In line with the guidance for third wave local authorities, our short list of options includes a
benchmark charging CAZ of a high enough class to bring about compliance. The process for
identifying the CAZ benchmark is set out below.
4.3.1. CAZ boundary
The indicative boundary for the benchmark CAZ is shown in Figure 3-1. It is focused on the whole
of the Portsea Island area, excluding the M275 and the western arm of Rudmore Roundabout
(providing the option to exempt traffic to Portsmouth International Port).
Figure 4-1 Indicative boundary for benchmark Portsea Island CAZ

PORTSMOUTH CITY COUNCIL
48
The cordon would capture all traffic entering Portsmouth via:
the A3 Mile End Road (south of the M275);
Portsbridge Roundabout / London Road (A3); and
Eastern Road (A2030).
Drivers would have the opportunity to use the P&R or to turn around using Tipner Roundabout,
thereby avoiding the charge. Drivers would also be able to access the land at Tipner West, without
a charge.
4.3.2. Exclusion of Portsmouth International Port
Portsmouth International Port has been excluded from the charging zone due to the potential
negative economic impacts. To inform this decision, further analysis was undertaken to
understand what impact this might have on the wider network and how local trips might be
impacted.
Analysis of the traffic model forecasts shows that the vast majority of flows accessing the Port
come via the M275 (Figure 3-2) and would not need to pay a charge if the CAZ area starts south of
Rudmore Roundabout. These trips are not contributing to the NO2 exceedances on Commercial
Road and Alfred Road.
Figure 4-2 2026 AM – Portsmouth International Port Inbound Flows (pcus)
The above plot shows all flows accessing the M275 J2 Rudmore Roundabout from the western arm. This includes both Port flows and
those to Whale Island.
Only a small proportion of trips are associated with origins / destinations within Portsea Island.
These trips would be subject to the CAZ charge. A proportion of these are likely to be journey-to-
work trips, and therefore largely unaffected by a CAZ B or CAZ C..
4.3.3. CAZ charge
It is envisaged that the charge would be applied on a daily basis (24 hour period from midnight to
midnight) as is used for the London ULEZ. This is considered preferable to applying a charge for
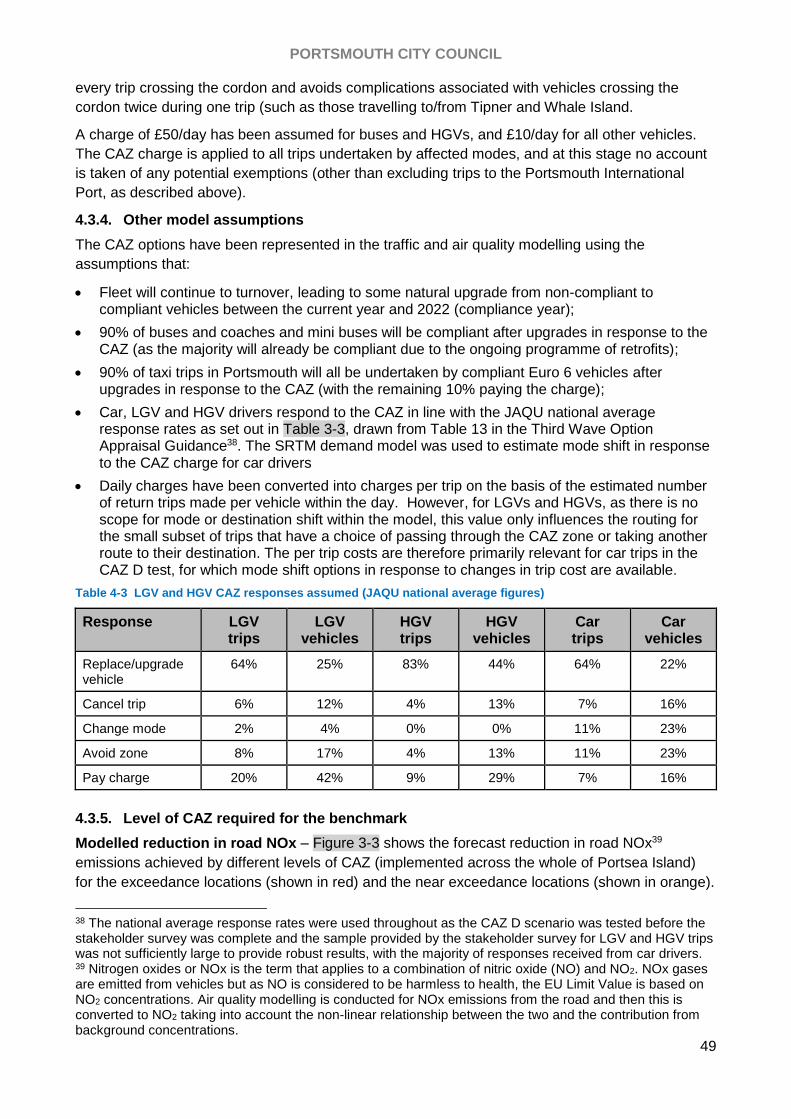
PORTSMOUTH CITY COUNCIL
49
every trip crossing the cordon and avoids complications associated with vehicles crossing the
cordon twice during one trip (such as those travelling to/from Tipner and Whale Island.
A charge of £50/day has been assumed for buses and HGVs, and £10/day for all other vehicles.
The CAZ charge is applied to all trips undertaken by affected modes, and at this stage no account
is taken of any potential exemptions (other than excluding trips to the Portsmouth International
Port, as described above).
4.3.4. Other model assumptions
The CAZ options have been represented in the traffic and air quality modelling using the
assumptions that:
Fleet will continue to turnover, leading to some natural upgrade from non-compliant to compliant vehicles between the current year and 2022 (compliance year);
90% of buses and coaches and mini buses will be compliant after upgrades in response to the CAZ (as the majority will already be compliant due to the ongoing programme of retrofits);
90% of taxi trips in Portsmouth will all be undertaken by compliant Euro 6 vehicles after upgrades in response to the CAZ (with the remaining 10% paying the charge);
Car, LGV and HGV drivers respond to the CAZ in line with the JAQU national average response rates as set out in Table 3-3, drawn from Table 13 in the Third Wave Option Appraisal Guidance38. The SRTM demand model was used to estimate mode shift in response to the CAZ charge for car drivers
Daily charges have been converted into charges per trip on the basis of the estimated number of return trips made per vehicle within the day. However, for LGVs and HGVs, as there is no scope for mode or destination shift within the model, this value only influences the routing for the small subset of trips that have a choice of passing through the CAZ zone or taking another route to their destination. The per trip costs are therefore primarily relevant for car trips in the CAZ D test, for which mode shift options in response to changes in trip cost are available.
Table 4-3 LGV and HGV CAZ responses assumed (JAQU national average figures)
Response LGV trips
LGV vehicles
HGV trips
HGV vehicles
Car trips
Car vehicles
Replace/upgrade vehicle
64% 25% 83% 44% 64% 22%
Cancel trip 6% 12% 4% 13% 7% 16%
Change mode 2% 4% 0% 0% 11% 23%
Avoid zone 8% 17% 4% 13% 11% 23%
Pay charge 20% 42% 9% 29% 7% 16%
4.3.5. Level of CAZ required for the benchmark
Modelled reduction in road NOx – Figure 3-3 shows the forecast reduction in road NOx39
emissions achieved by different levels of CAZ (implemented across the whole of Portsea Island)
for the exceedance locations (shown in red) and the near exceedance locations (shown in orange).
38 The national average response rates were used throughout as the CAZ D scenario was tested before the stakeholder survey was complete and the sample provided by the stakeholder survey for LGV and HGV trips was not sufficiently large to provide robust results, with the majority of responses received from car drivers. 39 Nitrogen oxides or NOx is the term that applies to a combination of nitric oxide (NO) and NO2. NOx gases are emitted from vehicles but as NO is considered to be harmless to health, the EU Limit Value is based on NO2 concentrations. Air quality modelling is conducted for NOx emissions from the road and then this is converted to NO2 taking into account the non-linear relationship between the two and the contribution from background concentrations.

PORTSMOUTH CITY COUNCIL
50
Figure 4-3 Modelled reduction in road NOx in 2022 for different levels of CAZ
CAZ A (Indicative traffic model outputs and emissions spreadsheet)
P:\GBEMB\TP\HA\PROJECTS\5185637 - PCC AQ Plan - ROBI2323\40. Technical\08. Emissions Calculations\2.
CAZ\Emissions\Indicative\Indicative - High-level emissions analysis TD1 CAZC-D v5
CAZ B (based on CAZ B traffic model outputs and emissions spreadsheet)
P:\GBEMB\TP\HA\PROJECTS\5185637 - PCC AQ Plan - ROBI2323\40. Technical\08. Emissions Calculations\2.
CAZ\Emissions\ModelledSRTM\Modelled - High-level emissions analysis TD1 CAZB-D v8

PORTSMOUTH CITY COUNCIL
51
CAZ C (based on CAZ C traffic model outputs and emissions spreadsheet)
P:\GBEMB\TP\HA\PROJECTS\5185637 - PCC AQ Plan - ROBI2323\40. Technical\08. Emissions Calculations\2.
CAZ\Emissions\ModelledSRTM\Modelled - High-level emissions analysis TD1 CAZB-D v8
CAZ D (based on CAZ D traffic model outputs and emissions spreadsheet)
P:\GBEMB\TP\HA\PROJECTS\5185637 - PCC AQ Plan - ROBI2323\40. Technical\08. Emissions Calculations\2.
CAZ\Emissions\ModelledSRTM\Modelled - High-level emissions analysis TD1 CAZB-D v8

PORTSMOUTH CITY COUNCIL
52
The results are based on outputs from the traffic model and estimated impact of the changes in
traffic flows and speed and vehicle fleet on traffic emissions (based on Emissions Factor Toolkit
v1.9b).
The emissions spreadsheet provides an approximation of the impact on NO2 concentrations that
the air quality model will forecast at each receptor for each CAZ option. However, it is not a precise
indication as the relationship between NOx emissions and NO2 concentrations is not direct/linear
and the spreadsheet only accounts for emissions on the link the receptor is located on and not the
secondary effects of emissions from other nearby links (which are included in the air quality
model). The approach provides an understanding of the scale of the impact of the different CAZ
options and how they compare but may give slightly different results to the full air quality model.
The graphs show that a CAZ A (targeting taxis and private hire vehicles, buses and coaches)
achieves only a small reduction in road emissions (1% and 3% on Alfred Road and Commercial
Road respectively). A CAZ B (which also includes HGVs) would be substantially more effective in
reducing emissions on the two exceedance links (reducing road emissions by 11% and 14% on
Alfred Road and Commercial Road respectively), reflecting the relatively high proportion of non-
compliant HGVs on these links. A CAZ C (which also includes LGVs) would achieve a further
reduction in emissions, but the difference between a CAZ B and CAZ C is relatively small,
reflecting the average age of LGVs in Portsmouth (LGVs are typically newer than the national
average). Finally, a CAZ D (covering all vehicle types) would be most effective, achieving a much
greater reduction in road emissions than a CAZ C (29% and 34% on Alfred Road and Commercial
Road respectively). This is not surprising as cars (compliant and non-compliant) account for 57%
of road emissions on Alfred Road and 61% on Commercial Road (see Figure 2-3).
Modelled reduction in NO2 (µg/m3) – Table 3-4 shows forecasts from the Air Quality modelling of
how the forecast changes in road emissions for CAZ B and CAZ C relate to changes in NO2
concentration in 2022, taking account of other factors such as weather conditions and street
geometry and accounting for background concentrations (including emissions from other roads.
A CAZ C is forecast to deliver compliance in NO2 concentrations at the Alfred Road and
Commercial Road exceedance locations in 2022, without worsening emissions elsewhere. A CAZ
B is also forecast to deliver compliance at both exceedance locations in 2022, but the
concentrations of NO2 on Alfred Road are very close to the EU limit of 40.49µg/m3. Small changes
in model assumptions could result in the EU limit being exceeded. For example, sensitivity testing
presented in Section 3.5.2, suggests that a doubling of the proportion of HGV drivers assumed to
pay the CAZ charge (from 9% to 18%) would increase the NO2 concentration on Alfred Road by
+0.1µg/m3, pushing it over the 40.49µg/m3 EU limit.
Under both scenarios there are outstanding exceedances on the Strategic Road Network, but to a
lesser extent than in the baseline scenario.
Given the forecast proximity of the Alfred Road concentration to the EU limit in a CAZ B
scenario, a Level C CAZ applied at a cordon around Portsea Island, as shown in Figure 3-1,
is taken forward as the benchmark CAZ against which other options are compared.

PORTSMOUTH CITY COUNCIL
53
Table 4-4 Modelled NO2 (µg/m3) in 2022 for different levels of CAZ (Based on Emissions Factor Toolkit, V9.1b)
ID Road Name Modelled NO2 (µg/m3) in 2022
Future
baseline
Portsea Is.
CAZ-B
Portsea Is.
CAZ-C
Exceedance locations
573 A3 Alfred Road
(Unicorn Rd to Queen St, s/b)
41.7 40.4 39.7
546 A3 Commercial Road
(south of Church St Rbt, s/b)
41.1 40.0 39.2
Near exceedances (37 µg/m3)
526 Church Street (east of Church St Rbt, n/b)
(revised assessment)
38.7 <38.7a <38.7a
536 A3 Hope Street
(south of Church St R'bout, s/b)
38.9 37.9 37.5
824 A2030 Eastern Road Water Bridge (s/b) 38.8 (36.8) (36.3)
648 A2047 London Road
(Stubbington Ave to Kingston Crescent, s/b)
38.5 38.1 37.3
520 Mile End Road
(north of Church St R'bout, s/b)
37.6 37.0 (36.3)
557 A3 Marketway
(Hope St Rbt to Unicorn Rd)
37.4 (36.3) (35.7)
Strategic Road Network
986 A27 (north of Portsea Island, w/b) 48.5 46.7 45.4
1089 A27 (east of Portsea Island, w/b) 46.1 45.1 43.8
11 M27 (west of Portsea Island, w/b) 45.3 44.0 42.6
968 A27 (north of Portsea Island, e/b) 43.7 41.7 40.7
834 A27 (east of Portsea Island, w/b) 41.1 39.7 38.8
Exceedances (>40.49µg/m3) shown in bold, near exceedances (>37µg/m3) shown in grey, lower
concentrations shown in brackets.
Future baseline and both CAZ scenarios are based on EFTv1.9b.
Note a: The concentration at Church Rd has not been modelled directly, but a Portsea Island CAZ reduces
traffic levels and improves average fleet emissions compared with the baseline. It therefore follows that the
concentration will follow the same trend as at all other sites and be lower than the baseline concentration.

PORTSMOUTH CITY COUNCIL
54
Alternative package (CAZ B + non-charging measures)
In recognition of the potential scale of impacts of a CAZ C on individuals and businesses, an
alternative package based on a CAZ B plus non-charging measures (CAZ B+) has also been
considered as part of the short list of options.
4.4.1. CAZ B specification
The following CAZ B options have been considered as a potential basis for the alternative
package:
CAZ B1 – Portsea Island CAZ B
CAZ B2 – Small Area CAZ B
CAZ B3 – Portsea Island CAZ B (external to internal trips only), i.e. excluding local movements within Portsea Island
The indicative boundary for the Small Area CAZ B is shown in Figure 3-4.
Figure 4-4 Indicative boundary for Small Area CAZ (indicative boundary)
The boundary includes key destinations for targeted traffic on the two exceedance links including the City Centre, Gunwharf Quay / Wightlink Terminal, and the Naval Base, and is intended to minimise re-routing. In particular, the inclusion of Kingston Crescent and Fratton Road is intended to minimise re-routing along London Road and Fratton Road which could result in new exceedances elsewhere in the city.

PORTSMOUTH CITY COUNCIL
55
Table 4-5 Modelled NO2 (µg/m3) for CAZ B scenarios in 2022 (Based on Emissions Factor Toolkit, V9.1b)
Receptor
ID
Road Name Future Baseline Portsea Island
CAZ-B
Small Area
CAZ B
Portsea Island CAZ-
B (ext trips only)b
Exceedance locations
573 A3 Alfred Road (Unicorn Rd to Queen St, s/b) 41.7 40.4 40.3 41.4
546 A3 Commercial Road (south of Church St Rbt, s/b) 41.1 40.0 39.9 40.6
Near exceedances (37 µg/m3)
526 Church Street (east of Church St Rbt, n/b)
(revised assessment)
38.7 <38.7a <38.7a -
536 A3 Hope Street (south of Church St R'bout, s/b) 38.9 37.9 37.8 38.4
824 A2030 Eastern Road Water Bridge (s/b) 38.8 (36.8) 38.4 37.0
648 A2047 London Road (Stubbington Ave to Kingston
Crescent, s/b)
38.5 38.1 37.7 38.5
520 Mile End Road (north of Church St R'bout, s/b) 37.6 37.0 (36.9) 37.5
557 A3 Marketway (Hope St Rbt to Unicorn Rd) 37.4 (36.3) (36.3) 37.1
Road sections on the Strategic Road Network exceeding the EU limit (40 µg/m3) in 2022
986 A27 (north of Portsea Island, w/b) 48.5 46.7 48.2 46.9
1089 A27 (east of Portsea Island, w/b) 46.1 45.1 46.0 45.2
11 M27 (west of Portsea Island, w/b) 45.3 44.0 45.3 44.0
968 A27 (north of Portsea Island, e/b) 43.7 41.7 43.1 42.0
834 A27 (east of Portsea Island, w/b) 41.1 39.7 40.9 39.9
Exceedances (>40.49µg/m3) shown in bold, near exceedances (>37µg/m3) shown in grey, lower concentrations shown in brackets.
Note a: The concentration at Church Rd has not been modelled directly, but the Portsea Island and Small Area CAZ scenarios reduce traffic levels and improve
average fleet emissions compared with the baseline. It therefore follows that the concentration will follow the same trend as at all other sites and be lower than the
baseline concentration. Portsea Island CAZ (ext trips only) results in a slight increase in flows on Church Street, but concentrations are believed to remain below the
EU limit.
Note b: All scenarios are based on EFTv1.9b, but Portsea Island CAZ-B (ext trips only) is based on a different approach for applying future petrol / diesel projections
to compliant and non-compliant vehicles. This approach is believed to over-estimate concentrations by 0.2 µg/m3.

PORTSMOUTH CITY COUNCIL
56
Table 3-5 shows that the Small Area CAZ B performs as well as the Portsea Island CAZ B at
exceedance locations on the PCC network. As most significant destinations for taxis/private hire
vehicles and HGVs are inside the cordon, minimal re-routing occurs. The slight re-routing which
does occur results in a small shift in traffic composition from heavy to light vehicles relative to the
Portsea Island CAZ and actually improves performance slightly on the two exceedance links,
without introducing exceedances elsewhere.
Eastern Road shows an increase in NO2 concentration relative to Portsea Island CAZ B due to
fewer HGVs needing to upgrade (e.g. vehicles to Anchorage Park are no longer affected by the
CAZ), however the concentration is still lower than in the baseline and below the EU limit.
The Small Area CAZ performs slightly less well than the Portsea Island CAZ at SRN exceedance
locations, due to the lower overall upgrade of vehicles, but still performs better than the baseline.
The version of the Portsea Island CAZ B based on External Trips Only performs less well than
the full Portsea Island CAZ B at each exceedance and near exceedance location. This primarily
reflects the smaller scale reduction in non-compliant HGVs. It results in a slight increase relative to
the baseline at Church Street due to small increase in HGVs using the route, although the
concentrations are believed to remain below the EU limit.
While a Portsea Island CAZ B and Small Area CAZ B would both achieve compliance in 2022
(albeit by a very small margin), a Small Area CAZ B achieves a greater reduction in NO2
concentration. It is also expected to have less of an adverse economic impact on
individuals and businesses than the other CAZ B options. A Small Area CAZ B has
therefore been taken forward as the basis for the Alternative Package.
4.4.2. Non-charging measures
The supporting non-charging measures included in the Alternative Package are intended to
achieve a further reduction in NO2 concentrations beyond that which could be achieved through
the implementation of a Small Area CAZ B only, ensuring that the EU limit is met under a range of
different modelling assumptions.
Modelled interventions – The measures included have been selected through the shortlisting
process outlined at the beginning of this chapter and have been identified as the most appropriate
measures for achieving emissions reductions on the exceedance links, whilst also contributing to
the secondary Critical Success Factors for the plan - see Table B-4 for supporting justification for
the proposed measures.
The following non-charging measures have been modelled:
Changes to parking capacity and pricing south of the city centre including increased charges
for Council and University staff, increased tariffs in short-stay car parks and seafront parking,
reduced capacity in city centre car parks, and reconsideration of the Park & Ride pricing
structure to encourage more commuter use.
Strategic cycling routes proposed within the draft Local Cycling and Walking Infrastructure Plan
on two priority corridors (Eastern Road to City Centre and City Centre to London Road and
Portsbridge Roundabout).
Alfred Road signal changes to allow for extra green time for southbound traffic on Alfred Road
to reduce delay on this road to reduce emissions from queuing traffic.
The measures are focused on car drivers (with compliant and non-compliant vehicles) as cars
account for the biggest proportion of emissions overall. They are also intended to complement
existing and planned wider policies for the city (including promote economic growth, reduce levels

PORTSMOUTH CITY COUNCIL
57
of social deprivation, improve health and encourage sustainable and active travel), in order to
leave a positive legacy within the city. For example, the proposed cycling routes are part of the
Draft Local Cycling and Walking Infrastructure Plan (LCWIP). More effective management of
parking supply and charges forms a core part of the city’s strategy for encouraging greater use of
sustainable transport (including the proposed Rapid Transit services and Park & Ride), as well as
enabling development and growth ambitions for the city, as set out in the emerging Local Plan.
Table 4-6 Proposed non-charging measures (modelled)
Measure Description
Parking
measures
(A1, A2,
E7a)
Various changes to parking capacity and pricing in the area to the south of the city
centre:
Portsmouth City Centre staff parking
From 2020, the Council will no longer fund car parking passes for staff. This includes the removal of 353 season tickets (£630pa, paid for by PCC) and 168 Park-It cards (paid for by PCC) for use at Isambard Kingdom Brunel Multi Storey car park.
Removal of reduced rate for a further 176 staff with Park-It cards (currently £3.45
per day).
Up to 697 PCC staff affected. From 2020, these staff will need to pay the standard tariff of £12 per day, park elsewhere, or change modes.
University staff parking
A new parking policy for Portsmouth University came into force in September 2019 which will significantly increase charges for the majority of staff. Under the old policy staff paid 0.3% of their salary a year for a parking permit. This normally meant paying £50-£350 a year. Under the new policy staff will pay £500 a year, with this being phased in over 3 years for those on lower pay grades. Blue badge holders are not charged.
In addition, University staff living within a 2 mile exclusion zone around University are no longer eligible to apply for a staff parking permit.
There are 500 people who previously had a permit but are now in the exclusion zone and are now unable to get a permit unless they are blue badge holders or carers.
The no. of permits issued has already reduced - in mid-September only 750 staff permits had been issued, compared to 1643 staff permits being in use last academic year.
Reduction in parking capacity
Closure of Market Way car park (500 spaces, PCC owned/NCP leased) and Clarence Street car park (154 spaces, PCC owned) from 2021.
Other car park space reduction within the outer city centre ring zones (183 spaces).
Increase in parking tariffs
Increase in parking tariffs at Harbour car park (62 spaces, PCC owned) from 2021 – To match tariffs at Gunwharf Quay car park.
- Existing tariff: <2 hrs = £2.60, <3 hrs = £3.50, <4 hrs = £4.50 <5 hrs = £8, Over 5hrs = £12.00
- New tariff: <2 hrs = £2.90, <3 hrs = £3.90, <4 hrs = £6.00 <5 hrs = £6.90, Over 5hrs = £12.00
Increase in seafront parking tariffs off street and on street

PORTSMOUTH CITY COUNCIL
58
On-street increases 15% over the 3 years from 2020-2023
Off-street car parks increases 10% over 3 years from 2020-2023
Park & Ride charge restructuring
Reconsider Park & Ride pricing structure to encourage more commuter use.
Strategic
cycling
routes
(E12)
Two priority corridors
City Centre – Eastern Road
City Centre – London Road – Portsbridge Roundabout
These routes have been proposed in the Draft Local Cycling and Walking Infrastructure Plan (LCWIP) and assessed as being of most relevance to reducing emissions at exceedance locations as well as near exceedance locations. Both are longer distance routes designed to encourage mode shift between the mainland and the city centre area (and beyond), reflecting the characteristics of traffic on the two exceedance links.
Routes are mix of quiet routes, on-road and off-road cycle lanes and supporting infrastructure.
Alfred
Road
signal
changes
(B6)
Provision of extra green time to southbound traffic on Alfred Road, to increase
average link speed from current low levels to reduce emissions rates. No change to
east-west movements to minimise impact on buses.
Intended as a temporary measure, prior to introduction of additional bus priority
measures as part of the proposed SE Hants Rapid Transit (TCF bid).
Complementary measures (not modelled) - In addition, various other complementary measures
are being proposed to provide certainty of meeting the EU limit for NO2 across the city, at both
exceedance and near exceedance locations.
These measures cannot be modelled but will play an important role in ensuring the successful
delivery of the AQ Plan. Again, they are largely focused on car drivers as cars account for the
biggest proportion of emissions and they are intended to complement existing and planned wider
policies for the city (including promotion of low emission vehicles, the emerging Parking Strategy,
promotion of Park & Ride, and Portsmouth International Port Air Quality Strategy).
Table 4-7 Other proposed non-charging measures (not modelled)
Measure Description
Taxi license
requirements (D10)
Progressive tightening of taxi licensing rules to ensure use of lower
emission vehicles and ensure national projections regarding fleet upgrades
occur in Portsmouth.
EV charging points
(D11)
Rapid charging points at taxi ranks to enable taxi drivers to upgrade to
electric vehicles.
Residents Parking
Zone permits
(A4, D7)
Reduced fee / free permits for low emission vehicles. In September 2019,
it was agreed (subject to the statutory notice procedure), that the charges
for residents permits be changed so that the first permit for a household is
free if the vehicle is powered solely by electricity and that the charge for a
first permit is reduced by 50% to £15 if the vehicle emits less than 100g of
CO2 per km (provided it is not powered by a diesel internal combustion
engine and that it was registered after 1 March 2001).

PORTSMOUTH CITY COUNCIL
59
Travel planning
(E1, E2, E3, E4,
E7a)
Travel planning measures to ensure that assumptions regarding increased
levels of cycling and sustainable travel use are realised. Building on
interventions with residents, schools, and workplaces delivered through the
recent Air Quality Grant Programme (2018/19) and other funding
programmes to encourage sustainable travel.
Targeted
communications and
marketing (F1)
Including continuation of anti-idling campaign (D1), advance and real time
(social and conventional media, VMS) messaging (A6). Integrated with
travel planning measures.
4.4.3. Wider strategies and proposals
In addition, the following strategies and proposals are expected to have a positive impact on air
quality, reinforcing the benefits of the above package in the medium to longer term:
port measures emerging from Portsmouth International Port Air Quality Strategy – expected to have a significant impact on background NO2 concentrations in the vicinity of the exceedance links;
Transforming Cities Fund bid to implement a South East Hampshire Rapid Transit (SEHRT), including key corridors into Portsmouth and associated measures;
Solent Future Mobility Zone Fund bid to deliver innovation in urban transport, covering personal mobility and sustainable urban logistics;
the proposed expansion of Portsmouth Park & Ride;
the Climate Emergency pledge to achieve net zero carbon emissions in Portsmouth by 2030;
the Local Cycling and Walking Infrastructure Plan; and
supporting measures to change attitudes to travel and personal mobility.

PORTSMOUTH CITY COUNCIL
60
Comparison of package performance in delivering Primary Critical Success Factor
This section compares the performance of the shortlisted options of:
Benchmark (Portsea Island CAZ C), and
the Alternative Package (Small Area CAZ B + non-charging measures, CAZ B+), in terms of
achieving compliance with the NO2 concentrations in the shortest possible time, without
significantly worsening emissions elsewhere; the primary Critical Success Factor for this Plan.
4.5.1. Comparison of package performance on compliance (based on core assumptions)
Table 3-8 shows that both packages deliver compliance with the EU limit for NO2 concentrations in
2022, which is considered the shortest possible time and is a year earlier than predicted through
natural fleet upgrades. Neither scenario results in a worsening of emissions elsewhere.
4.5.2. Impact of sensitivity tests on compliance
The following section sets out the results of various sensitivity tests undertaken to assess the
robustness of the forecast concentrations for the Alternative Package, in terms of ensuring
compliance is achieved in 2022. The tests undertaken involve changes to both the transport and
air quality assumptions which inform the modelling process:
Category Description of sensitivity tests undertaken
Transport
assumptions
HGV pay charge response assumption - Sensitivity test undertaken assuming a
doubling of the percentage choosing to pay the charge and continue with a non-
compliant vehicle, reducing the proportions of the other responses.
HGV daily trip rate assumption – Upper bound sensitivity test undertaken
assuming each HGV makes only one trip into the CAZ per day (resulting in a
charge of £50 per day) rather than multiple trips.
Air quality
assumptions
Meteorological assumptions - ADMS-Roads run with 2017 and 2016
meteorological year from Thorney Island (to compare against 2018 data used
from the same sites for core tests).
Surface roughness assumption - ADMS-Roads run with a modified surface
roughness to represent the more built up conditions in the city centre
For each of these tests, the air quality model was run for 2018 to re-visit the model verification and
then run for the 2022 scenarios.
Due to timescale considerations, the sensitivity tests were undertaken using an early version of the
Alternative Package (comprising Small Area CAZ B, the parking measures, and the proposed
strategic cycling routes, but excluding the Alfred Road signal improvements)40, with the results
presented in terms of the scale of change associated with each sensitivity scenario, i.e. change in
modelled NO2 (µg/m3).
Table 3-9 shows the impact of changes to both the transport and air quality assumptions, in terms
of change in modelled NO2 (µg/m3). In all cases the absolute concentrations on the
exceedance and near exceedance links remain below the EU limit for NO2 concentrations of
40.49 µg/m3.
40 Except for HGV trip rate test, which test was based on model runs which included only the Small Area CAZ B, and not the other non-charging measures proposed.

PORTSMOUTH CITY COUNCIL
61
Table 4-8 Modelled NO2 (µg/m3) for CAZ C Benchmark and Alternative Package (CAZ B + non-charging measures) in 2022 (Based on Emissions Factor Toolkit, V9.1b)
Receptor
ID
Road Name Future Baseline Portsea Island CAZ-C
(Benchmark)
CAZ B + non-charging
measures (Alternative
Package, CAZ B+)
Exceedance locations
573 A3 Alfred Road (Unicorn Rd to Queen St, s/b) 41.7 39.7 40.1
546 A3 Commercial Road (south of Church St Rbt, s/b) 41.1 39.2 39.5
Near exceedances (37 µg/m3)
526 Church Street (east of Church St Rbt, n/b)
(revised assessment)
38.7 <38.7a <38.7a
536 A3 Hope Street (south of Church St R'bout, s/b) 38.9 37.5 37.8
824 A2030 Eastern Road Water Bridge (s/b) 38.8 (36.3) 38.3
648 A2047 London Road (Stubbington Ave to Kingston
Crescent, s/b)
38.5 37.3 37.6
520 Mile End Road (north of Church St R'bout, s/b) 37.6 (36.3) (36.9)
557 A3 Marketway (Hope St Rbt to Unicorn Rd) 37.4 (35.7) (36.2)
Road sections on the Strategic Road Network exceeding the EU limit (40 µg/m3) in 2022
986 A27 (north of Portsea Island, w/b) 48.5 45.4 48.2
1089 A27 (east of Portsea Island, w/b) 46.1 43.8 46.0
11 M27 (west of Portsea Island, w/b) 45.3 42.6 45.3
968 A27 (north of Portsea Island, e/b) 43.7 40.7 43.1
834 A27 (east of Portsea Island, w/b) 41.1 38.8 40.8
Exceedances (>40.49µg/m3) shown in bold, near exceedances (>37µg/m3) shown in grey, lower concentrations shown in brackets.
Note a: The concentration at Church Rd has not been modelled directly, but both options reduce traffic levels and improve the average fleet emissions compared
with the baseline. It therefore follows that the concentration will follow the same trend as at all other sites and be lower than the baseline concentration.

PORTSMOUTH CITY COUNCIL
62
Table 4-9 Impact of sensitivity tests on modelled NO2 (µg/m3) concentrations in 2022, for early version of Alternative Package – change in modelled NO2 (µg/m3)
Receptor
ID
Road Name HGV pay charge
assumption (double
national average)
Meteorological
test
(2017 met year)
Meteorological
test
(2016 met year)
Surface roughness
test (high surface
roughness)
Exceedance locations
573 A3 Alfred Road (Unicorn Rd to Queen St, s/b) +0.1 -0.6 -0.3 -0.7
546 A3 Commercial Road (south of Church St Rbt, s/b) 0.0 +0.4 +0.0 -0.5
Near exceedances (37 µg/m3)
526 Church Street (east of Church St Rbt, n/b)
(revised assessment)
0.0 -0.4 -0.5 -0.4
536 A3 Hope Street (south of Church St R'bout, s/b) 0.0 -1.3 -0.5 -0.5
824 A2030 Eastern Road Water Bridge (s/b) 0.0 +1.5 +0.9 +0.4
648 A2047 London Road (Stubbington Ave to Kingston
Crescent, s/b)
+0.1 +0.1 +0.1 -0.2
520 Mile End Road (north of Church St R'bout, s/b) 0.0 +0.7 +0.2 -0.2
557 A3 Marketway (Hope St Rbt to Unicorn Rd) +0.1 -0.9 -0.3 -0.6
Road sections on the Strategic Road Network exceeding the EU limit (40 µg/m3) in 2022
986 A27 (north of Portsea Island, w/b) +0.1 -1.8 -0.4 -0.4
1089 A27 (east of Portsea Island, w/b) 0.0 +1.6 +1.3 -0.4
11 M27 (west of Portsea Island, w/b) 0.0 -1.8 -0.5 -0.6
968 A27 (north of Portsea Island, e/b) 0.0 +2.0 -0.6 +0.1
834 A27 (east of Portsea Island, w/b) 0.0 +0.1 +0.3 +0.8
Exceedances (>40.49µg/m3) shown in bold, near exceedances (>37µg/m3) shown in grey, lower concentrations shown in brackets.
Note a: The concentration at Church Rd has not been modelled directly, but a CAZ reduces traffic levels compared with baseline, and improves average fleet
emissions compared with the baseline. It therefore follows that the concentration will follow the same trend as at all other sites and be lower than the baseline
concentration.
Note b: All scenarios are based on EFTv1.9b, but Portsea Island CAZ-B (ext trips only) is based on a different approach for applying future petrol / diesel projections
to compliant and non-compliant vehicles. This approach is believed to over-estimate concentrations by 0.2 µg/m3.

PORTSMOUTH CITY COUNCIL
63
HGV upgrade sensitivity test – For the core scenario, assumptions regarding the responses
of HGV drivers to a CAZ are based on the national assumption provided by JAQU. This
assumes that 9% of HGV drivers choose to pay the £50 indicative CAZ charge, with most
(83%) choosing to upgrade. It is likely that the proportion choosing to pay the charge will
differ at a local level. A pessimistic sensitivity scenario (Table 3-10) has therefore been
modelled based on the assumption that the number choosing to pay would be twice as high,
resulting in a corresponding reduction in the proportion choosing to upgrade, avoid the CAZ,
or cancel their trip. No changes were made to other vehicle types in the fleet.
Table 4-10 HGV response assumptions for the core scenario and sensitivity test
Central / Core Scenario Sensitivity Test
Upgrade 83% 74.8%
Avoid 4% 3.6%
Cancel 4% 3.6%
Pay charge 9% 18%
Table 3-10 shows that the impact of this change on modelled NO2 concentrations in 2022 is
very small, with increases of less than 0.1 µg/m3 predicted at receptors within the city centre
compared to the central / core test. This response reflects the fact that although the
percentage change in trips forecast to pay is large, the responses of upgrade, avoid and
cancellation still account for over 80% of trips and are only reduced by 10% relative to the
core scenario.
HGV daily trip rate assumption – The daily trip rate and therefore average charge per trip for
HGVs assumed in the traffic model only influences routing choices. The upgrade and
cancellation responses are exogenous inputs to the model based on the JAQU national
averages, with their own underlying assumptions on average daily trip rates. Therefore, the
key potential influence of a revised modelled daily trip rate is on the number of HGVs
choosing to re-route in order to avoid paying the charge. However, the majority of HGVs
paying the charge in the core test have either an origin or destination in the CAZ area and
therefore would not benefit from rerouting. The traffic flow plots for the core and sensitivity
scenarios confirm this, showing very little difference41, with any changes most likely
attributed to model noise. Sensitivity of the modelled result to the assumed daily trip rate is
therefore very low.
Impact of changes to meteorological assumptions - For the core scenario, the ADMS-Roads
Air Quality model was run for the 2018 Base Year with 2018 meteorological data, with the
same set of data used for the 2022 Future Year models. As pollutant concentrations can
vary significantly from year to year due to the influence of meteorological conditions,
sensitivity tests have been conducted using meteorological data from 2017 and 2016 from
the Thorney Island Meteorological Office site. The dominant wind direction in all years is
from the south-west, but there are variations seen from year to year as shown in Figure 3-5.
For example, the wind directions in 2016 and 2018 are similar with winds also coming from
41 It should be noted that this sensitivity test was based on model runs which included only the Small Area CAZ B, and not the other non-charging measures proposed. However this will not have affected the conclusions reported.

PORTSMOUTH CITY COUNCIL
64
the north-east, whereas in 2017, the wind direction was predominantly distributed from
south-west to west. Wind speeds were highest in 2016, and lowest in 2017.
Figure 4-5: Wind roses (wind speed/direction) at Thorney Island Met Office site
The sensitivity results show that NO2 concentrations at the locations of concern are broadly
similar for each of the three years of meteorological data used, but there are variations in
concentrations between different receptor locations, as some concentrations go down in
some years, whilst others go up (Table 3-9). These differences are due to changes in the
wind direction/speed in each year in relation to the orientation of the road and position of the
receptor relative to this.
For example, receptor 546 (A3 Commercial Road) has the same NO2 concentration in 2016
and 2018 but levels are higher in 2017. This site is located to the east of a road going north-
south. In 2017, as the wind direction is predominately from south-west/west this will blow
road traffic emissions across the road towards the receptor more often than in other years,
resulting in a higher annual mean concentration.
Conversely, concentrations at receptor 573 (A3 Alfred Road) go down in 2016 and 2017.
This receptor is located to the south of a road that is orientated on a north-east to south-west
axis, so the higher number of days with wind direction coming from east in 2018 will result in
the emissions from the road being blown towards the receptor on more occasions compared
to the other years when the wind direction is more like the 2018 trend.
Concentrations of NO2 on the two exceedance links remain below the EU limit of
40.49 µg/m3 in all metrological conditions, and at all near exceedance locations within the
city. The biggest increase in NO2 concentration occurs on Eastern Road Water Bridge,
where the meteorological conditions in 2017 and 2016 result in an increase of 1.5 and 0.9
µg/m3 respectively, relative to 2018 conditions. However, in all scenarios, the NO2
concentration at Eastern Road Water Bridge remains below 40.0 µg/m3.
Impact of changes to surface roughness assumptions – The surface roughness (SR)
parameter within ADMS-Roads model takes into account the texture of the ground (i.e. what
the surface topography is like and how built-up it is). This determines how air flow interacts
with the ground and affects the level of NO2 concentration.

PORTSMOUTH CITY COUNCIL
65
For the core / central scenario, a surface roughness (SR) value of 0.5m was applied across
the whole of the Portsmouth study area, corresponding to “open suburbia” conditions in the
model. This was considered appropriate to reflect the average conditions across the large
study area.
However, as the exceedance locations are situated within the city centre, a sensitivity test
has been conducted to examine the effects of applying a higher SR value (1.5m rather than
0.5m) within the ADMS-Road model, to represent the more built up nature of the city centre.
The results of this test demonstrate that overall, the higher SR value results in lower
modelled road NOx at most locations. A higher surface roughness generally results in more
turbulence and faster dispersion of emissions. The majority of the receptor locations are
therefore predicted to have lower NO2 concentrations compared to the core scenario. Some
receptors, however, are predicted to have slightly higher NO2 concentrations (e.g. receptor
824 on Eastern Road Water Bridge) due to the higher model verification factor compared to
that applied in the core / central test.
Road NOx concentrations (and therefore NO2 concentrations) are higher at a small number
of receptors that are located on elevated sections of road (e.g. specific sites on the A27 and
M27). This is because due to emissions are not expected to disperse so rapidly away from
the road above the receptor.
The modelled NO2 concentrations on the exceedance links reduce by 0.7 µg/m3 and 0.5
µg/m3 respectively; providing confidence that the EU limit will be achieved on both
these links. The NO2 concentrations on the near exceedance links reduce by up to 0.6
µg/m3 (with the exception of Eastern Road Water Bridge), which provides certainty that the
annual concentrations will also remain below the EU limit at all these sites (including Eastern
Road Water Bridge).
4.5.3. Summary
The above results show that both the Benchmark and the Alternative Package deliver
compliance with the EU limit for NO2 concentrations in 2022, based on the core
assumptions. This is considered the shortest possible time and is a year earlier than
predicted through natural fleet upgrades. Neither scenario results in a worsening of
emissions elsewhere.
Sensitivity analysis suggests that the core scenario for the Alternative Package represents a
pessimistic or worst case picture in terms of the assumed meteorological conditions and
surface roughness (urban / built-up) conditions.
In terms of the transport assumptions, concentrations would remain below the EU limit even
with a doubling of the proportion of HGVs choosing to pay the £50 indicative CAZ charge.
Changes in the average number of trips per day undertaken per vehicle (and associated
perceived charge per trip) is shown to have very little impact on routing and therefore flows
and emissions.
Based on the findings of these sensitivity tests, the results presented in this study provides
confidence that the Alternative Package will achieve compliance with the EU limit on
both exceedance links, and that concentrations will remain well below the EU limit at
all ‘near exceedance’ sites.
Guidance from the Joint Air Quality Unit (JAQU) indicates that where more than one class of
charging CAZ is shown to achieve compliance in the same year (and in the shortest possible
time), funding will only be granted for the lowest class of CAZ that is shown to achieve
compliance.

PORTSMOUTH CITY COUNCIL
66
Comparison of package performance in delivering Secondary Critical Success Factors
This section compares the performance of the shortlisted options of:
the Benchmark (Portsea Island CAZ C), and
the Alternative Package (Small Area CAZ B + non-charging measures),
in terms of the secondary Critical Success Factors (CSFs) for this Plan i.e. that it should:
deliver value for money;
ensure that particular groups of stakeholders are not disproportionately impacted by any
negative impacts associated with the proposed intervention, assessed through
distributional impact assessment;
complement existing and planned wider policies for the city (including promote economic
growth, reduce levels of social deprivation, improve health and encourage sustainable
and active travel) i.e. strategic fit;
be deliverable in terms of supply side capacity and capability;
be affordable; and
be achievable (taking into account technical, legislative, and political and public
acceptability constraints).
All secondary CSFs are considered to have equal weighting.
4.6.1. Value for money
The value for money of the shortlisted options has been assessed on the basis of their
impact on the net welfare of society, estimated in line with the JAQU Options Appraisal
guidance and DfT’s TAG documentation.
4.6.1.1 Economic appraisal approach
The scope of the economic appraisal in terms of the type of economic impact assessed for
each package depends on the characteristics of the measure and the behavioural responses
it is likely to generate. Table 3-11 sets out the behavioural responses that have been
assumed to be relevant for the proposed package measures, defining the scope of the
appraisal.
Table 4-11 - Behavioural responses relevant for each potential package option
Response CAZ B/C Traffic signals Parking measures
Cycling measures
Continue Yes Yes Yes Yes
Avoid Yes No No No
Cancel Yes No No No
Mode/vehicle type shift
Yes No Yes Yes
Replace Yes No No No
Redeploy Yes No No No
The expected behavioural responses outlined in Table 3-11 have the potential to generate a
range of economic impacts. Those impacts for which monetary values can be attributed have

PORTSMOUTH CITY COUNCIL
67
been assessed using JAQU, HM Treasury and DfT TAG guidance, using the following three
appraisal tools, drawing on the modelling outputs and economics parameters:
• DfT’s TUBA software using output matrices from SRTM providing trips, travel time,
distance and travel cost in the Baseline and With Option scenarios to calculate impacts
of changes in traffic volumes and speed on travel times and operating costs for transport
users and welfare impacts associated with changes in parking and public transport fares
(and associated indirect tax impacts). The forecast changes capture the impacts of any
traffic rerouting and changes in trip numbers and therefore traffic levels on the transport
network.
• DfT’s Active Mode appraisal toolkit using details of estimated additional and improved
existing cycling trips to estimate journey quality, absenteeism and health benefit impacts
associated with increased cycling as a result of the cycle improvements.
• A bespoke spreadsheet model to estimate:
- the damage costs42 of changes in NOx, PM10 and CO2e emissions in the study area, drawing on: air quality model outputs of NOx, PM10 and CO2 emissions in the study area by year in tonnes p.a. in the Baseline and With Option scenarios and estimated damage costs per tonne (from JAQU guidance for NO2 and PM10 and the TAG databook for CO2);
- the welfare impacts of responses to the CAZ i.e. vehicle upgrades, transaction costs, scrappage impacts, trip cancellation and vehicle operating costs (and associated indirect tax impacts) of vehicle upgrade, drawing on estimates of cancelled trips and number of upgraded vehicles, vehicle prices and depreciation and fuel prices;
- option implementation, operating and decommissioning costs in appraisal terms; and
- overall value for money, by drawing together the outputs from the TUBA and Active Mode appraisal toolkit analysis to combine all elements of the appraisal on a consistent basis to estimate the Net Present Value of each option.
Each element of the appraisal has applied consistent parameters and approaches where
appropriate, including the following core assumptions:
• price base (2018, real prices);
• discount base year (2018);
• discount rate (3.5%, WebTAG);
• appraisal period (10 years, although noting that the CAZ itself is only in operation until
2024);
• expression in real prices (allowing for real growth above standard inflation e.g. for values
of time); and
• expression in market prices (converting resource prices using the 1.19 market prices
uplift, where relevant to convert from resource to market prices).
Table 3-12 provides more detail on each of the appraisal tools, in terms of the inputs and
impacts represented and specific assumptions used. Further details of the approach adopted
are provided in the E1 Report.
42 Damage costs provide an estimate of the net impact on society of each additional tonne of emissions released, accounting for health and productivity impacts.

PORTSMOUTH CITY COUNCIL
68
Table 4-12 - Inputs to and outputs from appraisal tools applied
Tool Inputs Impacts assessed Comments
TUBA SRTM matrices for the Baseline and With Option scenarios for demand, travel time, travel cost (fares, parking, charges) and travel distance
For car, LGV, HGV and public transport modes for AM, IP and PM time period in 2019 and 2026 (appraisal period of 2022 to 2031 is derived from interpolation and extrapolation and exclusion of the years 2019 to 2022)
DfT TAG appraisal parameters (e.g. value of time, discount factor incorporated in TUBA parameter file)
Annualisation factors for modelled outputs (representing 1 hour):
- AM to annual: 759 hours
- IP to annual 1518 hours
- PM to annual 759 hours
Impacts for road and public transport users of changes in trip numbers by mode and rerouting with associated impacts on traffic volumes and speeds i.e.:
- Travel time savings
- Travel cost savings (e.g. fuel and parking costs)
- Welfare impacts of changes in public transport fares and parking charges
- Change in indirect tax due to change in expenditure on fares, parking and vehicle operating costs (especially fuel)
TUBA 1.9.12 (January 2019 release) used.
Filtering was applied to the TUBA results to remove outputs associated with:
- The years 2019 to 2021 (i.e. pre scheme opening) – 2019 was used as the first year in TUBA due to availability of SRTM model runs
- CAZ related impacts after 2024 (after decommissioning)
- User charge and revenue impacts of the CAZ charge. These are calculated to inform the Distributional Impact analysis but excluded from the economic appraisal on the basis of JAQU guidance that the CAZ charge should be treated as a transfer payment and excluded from the appraisal
- Impacts associated with external to external trips. The TUBA analysis was summarised in terms of 16 geographical sectors, 14 representing Portsmouth, 1 representing Isle of Wight and 1 representing all other ‘external’ areas. As the external areas were remote from the proposed measures and subject to noise in a model the scale of SRTM, impacts associated with movements with O and D in external areas were excluded.
Active mode appraisal toolkit
- Spreadsheet modelling of impact of proposed cycling measures (based on the Propensity to Cycle tool) in terms of the number, length and purpose of trips
- DfT TAG appraisal parameters (e.g. value of quality improvements, incorporated in the toolkit)
- Cycling journey quality improvements
- Health benefits of increased cycling
- Accident impacts of increased cycling
- Journey quality benefits of improved cycling

PORTSMOUTH CITY COUNCIL
69
Tool Inputs Impacts assessed Comments
Bespoke spreadsheet model
- Baseline and With Option NOx, PM10 and CO2 emissions in the study area (from air quality model)
- Forecast fleet affected by upgrade based on:
- ANPR survey details of number of unique vehicles seen in average week
- Assumption on total affected fleet as a proportion of total observed in survey week (factors vary by number of days vehicles observed for, resulting in uplift of 1.75 from observed to total affected fleet for HGVs and 1.6 for LGVs)
- JAQU national average assumptions on proportion of vehicles upgrading
- Forecast baseline fleet change (from EFT 9.1b used in air quality modelling)
- Vehicle prices and depreciation (from JAQU data)
- Assumed scrappage age 16 years for LGVs and for HGVs.
- Assumed reduction in scrappage age by 2 years as a result of CAZ upgrade impacts
- Fuel prices from BEIS data
- Average vehicle mileage by vehicle type from DfT traffic statistics TRA0106
- Forecast cancelled trips (from SRTM matrices of affected trips and JAQU national average assumed proportion of cancelled trips)
- Option costs for implementation, operation and decommissioning
- Damage costs of change in NOx, PM10 and CO2 emissions
- Welfare impacts of vehicle upgrade: impacts of change, scrappage, transaction costs and reduced fuel costs
- Appraisal value of costs of option implementation and operation
Spreadsheet also draws in results from TUBA and active mode appraisal toolkit to provide overall appraisal of NPV
Damage costs based on Urban Big damage costs as Portsmouth is identified as falling in the Urban Big category in TAG Unit A5.4
The samples from the local stakeholder survey were too small to provide reliable alternative estimates for the proportion of LGV and HGVs that would upgrade.
Further details on assumptions around vehicle price etc are provided in Deliverable E1
Scrappage ages based on SMMT estimate of average car scrappage age (14 years) and EU data on average vehicle age in the fleet by type
Costs are converted to appraisal terms through a number of steps including inclusion of a 44% optimism bias allowance, allowance for real growth in costs (particularly construction) and conversion to market prices (using the TAG 1.19 market price adjustment factor)

PORTSMOUTH CITY COUNCIL
70
4.6.1.2 Economic appraisal results
Monetised impacts - Table 3-13. summarises the estimated monetary impacts of each of
the options assessed through the approach outlined above and compares them with the
estimated scheme costs to provide an NPV.
Table 4-13 –Summary results (£mill, 2018 prices, present value, 10-year appraisal period, 2018 discount base) (Results for better performing option shown in bold)
Category Portsea Island
CAZ-C
(Benchmark)
CAZ B + non-
charging measures
(Alternative
Package, CAZ B+)
Description
Economic
efficiency:
transport user
impacts -
commuting,
business and
other users
0.3 2.8
Time saving and vehicle operating cost
savings as a result of the scheme as
represented in TUBA, accounting for
traffic reduction and re-routing due to
the CAZ charge, parking and cycling
measures (as relevant)
Welfare loss -
cancelled trips -0.2 0.0
Disbenefit experienced by those
cancelling their trip to avoid paying the
CAZ charge
Welfare impacts
of vehicle
upgrades
(including
transaction
impact and
scrappage)
-16.3 -3.7
Costs to drivers of upgrading their
vehicle sooner than planned to achieve
compliance including costs of scrapping
vehicles earlier than planned as part of
the change in fleet turnover to achieve
compliance and vehicle operating cost
savings (where relevant)
Welfare impacts
of cycling 0.0 4.0
Health and absenteeism benefits due to
increased cycling resulting from mode
shift generated by complementary
measures
Indirect tax loss -1.7 -0.2
Primarily loss in fuel duty to
government due to fuel savings
associated with vehicles being
upgraded to more efficient models for
compliance and changes in traffic
conditions
NOX benefits 0.7 0.2
Value of reduction in NOx emissions as
a result of the option using estimated
change in emissions in the wider
affected area and the damage cost
approach
PM benefits 0.1 0.2
Value of reduction in PM emissions as
a result of the option using estimated
change in emissions in the wider
affected area and the damage cost
approach

PORTSMOUTH CITY COUNCIL
71
Category Portsea Island
CAZ-C
(Benchmark)
CAZ B + non-
charging measures
(Alternative
Package, CAZ B+)
Description
CO2 benefits 0.2 0.5
Value of reduction in CO2 emissions as
a result of the option using non-traded
values of carbon
Present value of
benefits (PVB) -16.9 3.7
Sum of above entries
Present value of
cost (PVC) 36.5 25.4
Implementing and operating costs of
the CAZ
NPV (PVB-PVC) -53.4 -21.7
The results show that both options produce a negative NPV when assessed on the basis
of the impacts that can be monetised (i.e. the costs of the option are greater than the
monetised benefits). However, the negative NPV for the Alternative Package (CAZ B+) is
less than half of the negative NPV for the Benchmark Option.
This better performance reflects two key factors:
the estimated costs for the Alternative Package are approximately 70% of those for the
Benchmark Option (£25.4 million, rather than £36.5 million);
the Alternative Package generates a small PVB (£3.7 million) as opposed to the
significant negative impact generated by the Benchmark Option (-£16.9 million).
The lower costs for the Alternative Package reflect the considerably smaller geographical
scale of the CAZ, reducing the scale of all aspects of implementation and operating costs
significantly. Although the Alternative Package includes additional costs to implement the
non-charging measures, the net impact is still the considerably lower cost as shown in Table
3-13.
The small positive PVB for the Alternative Package (+£3.7 million) is derived primarily from:
time and vehicle operating costs associated with congestion relief in the congested
western corridor of the city due to the reduction in car trips due to the cycling and parking
measures;
the health, journey quality and absenteeism benefits associated with increased cycling;
and
the damage cost savings associated with reduced emissions.
These benefits are offset to an extent by welfare disbenefits associated with parking charge
increases and the choice to upgrade a vehicle in response to the CAZ. However, the net
impact is positive.
By contrast, the net impact of the Benchmark Option on transport users and externalities is
negative (-£16.9 million). The larger extent and scope of the CAZ means that it has a more
significant beneficial impact on NOx emissions than the Alternative Package. However,
although very modest in both options, the reduction in PM10 and CO2 emissions is smaller in
the Benchmark Option than the Alternative Package. The emissions improvement
associated with the transition from Euro V (5) to VI (6) for goods vehicles is much less

PORTSMOUTH CITY COUNCIL
72
significant for PM10 and CO2 than it is for NOx emissions. Consequently, the reductions in
these emissions in the Alternative Package is largely caused by the reduction in car trips
associated with the non charging measures, rather than the vehicle upgrade impacts of the
CAZ. The Benchmark Option leads to a much more limited reduction in trips (cancelled HGV
and LGV trips only), resulting in a smaller impact on PM10 and CO2 emissions.
The more limited impact on trip numbers also means that the time savings generated by the
Benchmark Option are much more limited than those generated by the Alternative Package.
In contrast, the welfare disbenefits (i.e. the cost to drivers of upgrading their vehicles sooner
rather than planned) associated with the CAZ C option are much more significant than those
associated with the CAZ B. As a result of the larger area and the wider coverage of the CAZ
(covering LGVs which are much more numerous than the vehicle types covered in CAZ B), it
is estimated that over 10 times as many vehicles would be upgraded as a result of the
Benchmark Option than as would be upgraded as a result of the Alternative Package.
Although the upgrade costs associated with LGVs are lower than those for HGVs, this
increase in vehicle numbers affected leads to much more significant impacts in terms of
welfare loss associated with vehicle upgrade and scrappage costs.
Sensitivity tests
A range of sensitivity tests have been undertaken to assess the resilience of the economic
appraisal results to changes in a number of key appraisal assumptions, specifically
- Optimism bias allowance on costs, ranging from low 22% to high 66% around the core
value of 44%.
- Damage costs of NOX , PM10 and CO2 emissions, ranging from low (core costs -20%) to
high, (core costs +20%).
- Vehicle price depreciation rate – ranging from low, the minimum annual rate in the JAQU
default guidance to high, the maximum annual rate in the JAQU default guidance – this
impacts on the welfare impacts of vehicle upgrades by affecting the price differential
involved in upgrading and the welfare losses associated with scrappage.
- The number of vehicle upgrades required – ranging from low (core – 25%) to high (core
+ 25%). This test does not vary the assumed emissions impact of the options but tests
the sensitivity to the assumed number of vehicles that would need to be upgraded to
achieve the forecast emissions reduction.
Table 3-14 and Table 3-15 summarise the results, showing that the NPV is highly sensitive
to the optimism bias assumptions, which vary the CAZ C NPV by approximately 10% in each
direction and the CAZ B+ NPV by over 15%.
The variation in damage cost values lead to variation in the NPV of less than 2% for CAZ B+
and less than 1% for CAZ C, highlighting the fact that the monetised value of emissions
impacts accounts for a relatively small proportion of the welfare impact of both options.
Changing the rate of assumed depreciation of vehicle prices has a minor impact (<1%) on
NPV for both options. However, varying the assumed number of non-compliant vehicles that
would need to upgrade to achieve the modelled emissions impact has a more significant
effect on NPV. This test is effectively a measure of the proportion of total trips in the CAZ an
average vehicle is assumed to make43. The higher the proportion each vehicle makes, the
43 The number of vehicles assumed to need to upgrade is based on the number of unique non-compliant taxis, buses and goods vehicles observed in the week long ANPR survey in March 2019.

PORTSMOUTH CITY COUNCIL
73
lower the number of vehicles that would need to be upgraded to achieve the modelled
emissions impact and the lower the welfare losses and NPV loss. NPV values vary by about
4% with the sensitivity tests on upgrade numbers for CAZ B+ and by over 8% for CAZ C
The larger impact for CAZ C reflects the larger number of vehicles upgraded as a result of
the CAZ.
In all tests the performance of the Alternative Package remains stronger than that of the CAZ
C benchmark.
Table 4-14 – Economic appraisal sensitivity tests – CAZ C Benchmark, £ mill (2018 prices and values)
Core Optimism bias Damage costs Vehicle
depreciation rate
No. of vehicle
upgrades needed
Category High Low High Low High Low High Low
Present
value of
benefits
(PVB)
-17.0 -17.0 -17.0 -16.7 -17.0 -17.1 -17.1 -21.4 -12.6
Present
value of cost
(PVC)
36.5 42.0 30.9 36.5 36.5 36.5 36.5 36.5 36.5
NPV (PVB-
PVC) -53.4 -59.0 -47.8 -53.1 -53.4 -53.6 -53.5 -57.8 -49.0
Table 4-15 – Economic appraisal sensitivity tests – Alternative Package CAZ B+ £ mill (2018 prices and values)
Core Optimism bias Damage costs Vehicle
depreciation rate
No. of vehicle
upgrades needed
Category High Low High Low High Low High Low
Present
value of
benefits
(PVB)
3.7 3.7 3.7 4.1 3.9 3.5 3.8 2.8 4.7
Present
value of cost
(PVC)
25.4 29.3 21.5 25.4 25.4 25.4 25.4 25.4 25.4
NPV (PVB-
PVC) -21.7 -25.6 -17.8 -21.3 -21.5 -21.9 -21.6 -22.6 -20.8
The vehicles are categorised in terms of the number of days during the week they were observed and an assumption is made on what proportion of the sample of vehicles visiting the CAZ on average that many times per week during the year they represent. The core assumptions estimate that the number of unique taxis, buses and goods vehicles visiting the CAZ in the year is 60% greater than the number observed in the average week and the sensitivity tests consider assumptions of uplifts of 20% and 100%.

PORTSMOUTH CITY COUNCIL
74
Wider assessment - The monetised impacts of the two options must also be seen in the
context of other impacts that cannot be attributed a monetary value. Table 3-16 provides a
qualitative assessment of the options in terms of the full range of impacts identified in the
DfT’s TAG Appraisal Summary Table (AST) which provides a list of the full range of potential
impacts from transport schemes of any type.
Table 4-16 – Summary results – wider assessment
Category Impact Portsea Island CAZ-C (Benchmark)
CAZ B + non-charging measures (Alternative Package, CAZ B+)
Economy Business users & transport providers
Moderate negative – time savings very limited and offset by CAZ charges
Moderate negative – time savings offset by CAZ charges and parking charges
Reliability impact on Business users
Negligible impact on traffic flows and therefore reliability
Slight positive - reductions in congestion, particularly in peak hours, improving journey time reliability
Regeneration Not applicable - scheme does not directly affect any identified regeneration areas
Not applicable - scheme does not directly affect any identified regeneration areas
Wider Impacts Negligible impact on transport costs and therefore wider impacts
Negligible impact on transport costs and therefore wider impacts
Environ-ment
Noise Negligible impact - modelled changes in traffic flow and speed are limited to a few % and therefore noise impacts assumed to be negligible
Negligible impact - modelled changes in traffic flow and speed are limited to a few % and therefore noise impacts assumed to be negligible
Air Quality Large positive - Concentrations at exceedance locations below EU limit and NOx in study area reduced by 11.7% in 2022, PM10 by 1.7% and PM2.5 by 2.7%
Moderate positive - Concentrations at exceedance locations below EU limit and NOx in study area reduced by 3.5% in 2022, PM10 by 0.7% and PM2.5 by 0.9%
Greenhouse gases
Slight reduction in CO2e emissions (0.4% across study area in 2022) due to changes in fleet, traffic volumes and speed
Slight reduction in CO2e emissions (0.7% across study area in 2022) due to changes in fleet, traffic volumes and speed
Landscape No impact - no physical infrastructure outside of the city area
No impact - no physical infrastructure outside of the city area
Townscape Slight negative visual impacts possible as ANPR cameras and signs required to implement the scheme.
Slight negative visual impacts possible as ANPR cameras and signs required to implement the scheme and new cycling infrastructure required
Historic Environment
Slight negative visual impacts possible as ANPR cameras and signs required to implement the scheme.
Slight negative visual impacts possible as ANPR cameras and signs required to implement the scheme and new cycling infrastructure required
Biodiversity Neutral - physical infrastructure limited to cameras and signs and therefore impacts on biodiversity
Neutral - physical infrastructure limited to cameras, signs and cycle infrastructure and therefore impacts

PORTSMOUTH CITY COUNCIL
75
Category Impact Portsea Island CAZ-C (Benchmark)
CAZ B + non-charging measures (Alternative Package, CAZ B+)
Water Environment
and water environment assumed to be avoidable
on biodiversity and water environment assumed to be avoidable
Social Commuting and Other users
Slight negative – time savings are limited and some commuting by LGV will face CAZ charges
Slight positive - time savings, particularly in peak hour, partly offset by increased parking charges
Reliability impact on Commuting and Other users
Negligible impact on traffic flows and therefore reliability
Slight positive - reductions in congestion, particularly in peak hours, improving journey time reliability
Physical activity Neutral - scheme has no impact on physical activity
Moderate positive - scheme encourages cycling along two improved cycle corridors
Journey quality Neutral - scheme has no impact Slight positive - improvements to cycling journey quality
Accidents Negligible - scheme achieves a slight reduction in vehicle kms and would therefore be likely to reduce accidents. However, the net scale of change is small and the overall impact is assumed to be negligible.
Negligible - scheme achieves a slight reduction in vehicle kms and would therefore be likely to reduce accidents. However, the net scale of change is small and the overall impact is assumed to be negligible.
Security Scheme has no impact on security Scheme has no impact on security
Access to services
Slight negative due to potential reduction in taxi and bus service provision and availability.
Slight negative due to potential reduction in taxi and bus service provision and availability.
Affordability Slight negative – CAZ charges increase costs for taxis, bus (operators), HGV and LGV trips
Slight negative - impacts of parking charges and CAZ charge for affected trips.
Severance Negligible – scheme causes some improvement in severance but restricted to links with already low flows and severance levels.
Negligible – scheme causes some improvement in severance but restricted to links with already low flows and severance levels.
Option and non-use values
Scheme does not introduce new transport options
Scheme does not introduce new transport options
Summary - The analysis shows that the CAZ B+ option has a wider range of positive
impacts, including improvements in physical activity and journey quality and journey time
and reliability savings as a result of reduced congestion at key bottlenecks. The CAZ C
benefits are focussed on greater emissions improvements across the study area as a whole
but offset by larger disbenefits as result of the more extensive CAZ charge.

PORTSMOUTH CITY COUNCIL
76
4.6.2. Distributional impacts on stakeholders
A distributional impact analysis has been undertaken to determine whether the proposed
packages unduly favour or disadvantage particular social groups or businesses; rather than
the overall impact of the options on all groups, which is the main focus of economic appraisal
analysis presented in Section 3.6.1.
4.6.2.1 Impact on vulnerable groups
A summary of findings for the eight distributional impact indicators is provided in Table 3-17.
Both the CAZ C Benchmark option and the Alternative Package (CAZ B + non-charging
measures) option are shown to have a slight adverse impact on accessibility, as taxi drivers
may increase their charges or chose to stop operating in the CAZ area, limiting the
availability of hackney carriages and private hire vehicles and disproportionately impacting
on income deprived residents and disabled people living in the centre of Portsmouth.
For both options, the impact of the proposed CAZs on traffic flow and re-routing is small.
The overall impact in terms of severance, accidents, noise, is therefore limited, and the
change which is predicted is found to have a neutral or slight beneficial impact on relevant
vulnerable groups.
The overall impact on user benefits (capturing changes in journey times, vehicle operating
costs, public transport costs, parking charges, and the CAZ charge, where relevant) is also
small, but the impacts are not evenly distributed. The CAZ C Benchmark option results in
minor disbenefits for commuter and other non-business trips which are disproportionately
focused on the most deprived groups, and dis-benefits for HGV and LGV business trips
which are disproportionately focused on the areas with the highest concentration of SMEs.
In contrast, the Small Area CAZ B+ option performs more favourably, with low income
groups less likely to be disproportionately affected, and benefits for all groups of SMEs. This
represents a key difference between the two options, in terms of their distributional impacts.
In terms of air quality, both options benefit the high proportion of children and low income
households in central Portsmouth, who will benefit from reduced emissions. The impact is
considered large beneficial for the CAZ C benchmark, and moderate beneficial for the CAZ
B+ Alternative Package, reflecting the smaller scale of the CAZ area.
4.6.2.2 Impact on businesses
Impact on taxis and PHVs – The majority of hackney carriage (HC) drivers are self-
employed drivers, who own their own their vehicle. Drivers in this group with non-compliant
vehicles are likely to be significantly impacted by the introduction of a CAZ, as they will need
to personally bear the cost of paying the charge or upgrading their vehicles. In contrast,
private hire vehicles (PHVs) are more likely to be leased, and drivers are less likely to be
self-employed; although a substantial proportion of this group are self-employed or small
scale operators who are also likely to find it difficult to bear the cost of upgrading a non-
compliant vehicle.
A significant percentage of taxi drivers (>20%) are aged between 51 and 60 years old, and
more than 10% are aged between 61 and 80 years old. Older drivers may choose to retire
following the introduction of a charging CAZ as they may not be able to justify the upfront
costs of a new vehicle in terms of the time to amortize the investment.
Analysis from Portsmouth City Council taxi licensing data shows that 29% of taxi drivers
identify themselves as from Black, Asian, and Minority Ethnic (BAME) groups (23% for PHV

PORTSMOUTH CITY COUNCIL
77
drivers and 56% for HC drivers), compared to 26% of the overall population in Portsmouth
and 13% nationally. There is a strong prevalence of taxi drivers coming from the most
deprived LSOAs (which are amongst the 20% most deprived areas in England and Wales).
Impact on HGVs and LGVs - The benchmark option (Portsea Island CAZ C) is likely to
have a significantly more detrimental impact on goods vehicle owners / operators than the
alternative Small Area CAZ B+ option. The Small Area CAZ B+ option does not impact
LGVs and reduces the number of HGVs impacted compared to the Portsea Island CAZ C
benchmark option by more than half.
The most significant adverse impacts would be experienced by the operators of non-
compliant vehicles that would need to enter the CAZ area frequently each week (the ANPR
data suggests that 17% of observed vehicles in a typical week enter the CAZ on 3 or more
days). These operators face the option of a significant annual charge (up to £18,200 p.a.) or
the capital cost of upgrading their vehicles (or retrofitting if possible), if they are unable to
adjust their operations.
The impact of the charge on businesses will depend on a range of factors including the size
of their fleet, their flexibility to alter operations to minimise CAZ charges, their scale, the
significance of transport costs in their total operational costs and their ability to access funds
to invest in upgraded or retrofitted vehicles. Although impacts will vary, the operators with
the least flexibility and capacity to respond are likely to be those based within the CAZ itself
and/or small operators that do not have large fleets which can be redistributed to avoid CAZ
charges nor the financial capacity to upgrade their vehicle.
There are significantly more non-compliant LGVs entering the Portsea Island CAZ C area,
than there are HGVs; and they enter the CAZ area more frequently than non-compliant
HGVs (38% of non-compliant LGVs enter the CAZ on 3 or more days a week, compared
with 17% of HGVs). A larger share of LGVs might therefore choose to upgrade.
The specific impact on the above groups is considered further in the Clean Air Fund bid in
Chapter 7.

PORTSMOUTH CITY COUNCIL
78
Table 4-17 – Distributional impact assessment for the two packages
Impact variables
Portsea Island CAZ C (Benchmark) Small Area CAZ B + non-charging measures (Alternative Package)
Accessibility Slight adverse
The option may indirectly impact the availability of taxis/PHVs, as drivers may increase their charges or choose to stop operating. There are a small number of conventional bus services which cannot be or have not yet been retrofitted; and there is a risk that operators may withdraw these vehicles from service in the short-term.
There are high proportions of income deprived residents and disabled people in the centre of Portsmouth, who are more likely to rely on these services for certain trips and will be disproportionately affected. This may reduce their ability to access key services and amenities, jobs, and social networks, and could result in isolation and social exclusion.
Slight adverse
Similar impacts to the CAZ C option, but with some cycling accessibility benefits for residents near to the proposed routes.
Some 55% of residents within the Small Area CAZ B are amongst the 20% most income deprived in England and Wales, and 67% have high levels of illness and disability. These groups will be disproportionally affected, with potential adverse impacts on employment and education prospects, health, isolation and social inclusion.
In addition, the proposed cycle routes will improve accessibility.
Severance Slight beneficial
There are a small number of road links where traffic flow reduces by >10%, which will improve the quality of the pedestrian environment. There is a higher than average proportion of no car households and disabled persons in the CAZ area, who will disproportionately benefit from any change in severance. Elderly and children will also benefit.
There are no road links where traffic flow is expected to increase by >10%, hence there are no potential adverse impacts to severance for this option.
In virtually all cases the flow on the roads concerned is less than 1500 per day, often much less, so the overall level of severance is limited.
Neutral
There are a large number of road links where traffic flow reduces by >10%, which will improve the quality of the pedestrian environment, disproportionately benefiting the high proportion of disabled people living nearby.
However, there are two links where traffic flow increases by >10%, where there are concentrations of vulnerable groups (children and no car households). This could adversely impact perceptions amongst these groups about the ease of crossing these roads. However, in both cases the daily flow is less than 300 vehicles, so the overall level of severance is limited.
Accidents Neutral
There are no road links where traffic flow increases by >10%, which could lead to an increase in collisions. There are a small number of road links where flow reduces by >10%, which could lead to a reduction in collisions.
Historically, there have been relatively few casualties (10 over 5 years, 7 involving cyclists) from vulnerable groups on these links. The impact on vulnerable groups is therefore considered neutral on these links.
Overall, this option achieves only a slight reduction in veh-kms, and the overall impact on all accidents (not just those involving vulnerable groups) is assumed to be negligible (see Table 3-14).
Slight beneficial
There are a small number of road links where traffic flow increases by >10%, which could lead to an increase in collisions. Historically, there have been relatively few casualties (10 over 5 years) involving vulnerable groups on these links.
There are more links where flow reduces by >10%, which could lead to a reduction in collisions. Historically, there has been a relatively high number of casualties (159 over 5 years) involving vulnerable groups on these links (especially cyclists and income deprived).
Overall, this option achieves only a slight reduction in veh-kms, and the overall impact on all accidents (not just those involving vulnerable groups) is assumed to be negligible (see Table 3-14).

PORTSMOUTH CITY COUNCIL
79
Air quality Large beneficial
Air quality modelling shows a decrease (>10%) in NO2 levels across a large number of links in Portsmouth. There are a high proportion of children and low income households in central Portsmouth, who will disproportionately benefit from reduced emissions. These groups are particularly vulnerable to air quality impacts as low income households are more likely to live on a main road and children tend to spend more time outside.
Moderate beneficial
Air quality modelling shows a decrease (>10%) in NO2 levels across a moderate number of links in Portsmouth. There are a high proportion of children and low income households in this area, who will disproportionately benefit from reduced emissions.
The magnitude of overall benefit for vulnerable groups is expected to be proportional to the size of the CAZ.
Noise Slight beneficial
There are a moderate number of links where traffic flow has decreased by >20%, which is generally indicative of a reduction in noise levels. These links are in the vicinity of low income households and several amenities such as schools and playgrounds which children may attend.
There are no links where traffic flow has increased by >25%, which is generally assumed to indicate an increase in noise levels.
Overall, this option achieves only a slight reduction in flow and speed, and the overall impact on noise is assumed to be negligible (see Table 3-14).
Slight beneficial
There are a moderate number of links where traffic flow has decreased by >20%, which is generally indicative of a reduction in noise levels. This is expected to result in greater than average benefits for the most deprived residents and the high proportion of children in the area.
There is one link where traffic flow has increased by >25%, which is generally assumed to indicate an increase in noise levels, however, the absolute change is very small.
Overall, this option achieves only a slight reduction in flow and speed, and the overall impact on noise is assumed to be negligible (see Table 3-14).
User benefits (commuter and other non-business trips)
Large adverse
The CAZ C benchmark has a very small negative impact (-£41,397) on these users, due to small scale increases in travel time and associated vehicle operating costs. Based on the relative proportion of disbenefits (by LSOA) against the population in each income quintile (by LSOA), the impact is large adverse for the most deprived income quintiles, and moderate adverse for other income quintiles.
The distributional impact is large adverse, but the absolute scale of the net impact is very small.
Slight adverse
The CAZ C benchmark has a small negative impact (£1,835,483) on these users, due to small scale increases in travel time and associated vehicle operating costs, and increased parking charges.
Based on the relative proportion of disbenefits against the population in each income quintile, the impact is slight adverse for income quintiles 1 and 2 (containing the most income deprived) and moderate adverse for the other income quintiles.
User benefits
(HGV and LGV business trips)
Large adverse
There is a dis-benefit across all SME quintiles (-£6,662,834), as a result of the CAZ charge paid by the remaining non-compliant HGVs and LGVs (with a larger number of LGVs paying the charge relative to HGVs). However, the dis-benefits are disproportionally focused on the areas with the highest concentration of SMEs, resulting in a large adverse impact on SMEs.
Moderate beneficial
The cost and time impacts for business trips outweigh the disbenefits across all groups of SMEs (£189,863 in total), due to the overall congestion benefits associated with the parking and cycling measures, and the small number of HGVs choosing to cancel their trip, rather than upgrade, etc. The dis-benefits are almost entirely focused on the locations with the highest concentration of SMEs, however, overall impact for this group is still beneficial. The absolute scale of the net impact is very small.

PORTSMOUTH CITY COUNCIL
80
Personal affordability
Moderate adverse
The CAZ C benchmark has a very small negative impact (-£791) on affordability, as a result of re-routing effects on vehicle operating costs, with specific income groups experiencing benefits and dis-benefits.
Based on the relative proportion of dis-benefits against the population in each quintile, there is a neutral affordability impact for the most income deprived residents, and a large adverse affordability impact for income quintile 2, with other income groups experiencing a large adverse or large beneficial impact.
Moderate adverse
The analysis shows a small negative impact across all income groups (£3,206,380), largely as a result of increased parking charges.
Based on the relative proportion of dis-benefits against the population in each quintile, there is a slight adverse affordability impact for the most income deprived residents, and a moderate adverse impact for income quintiles 2, with other income groups experiencing a moderate adverse impact.
Business affordability
(HGV and LGV business trips)
Large adverse
The CAZ C benchmark has a negative impact (-£6,662,834) on affordability, with all concentrations of SMEs experiencing disbenefits.
There is a disproportionately large disbenefit in areas where there are a high number of SMEs.
Large adverse
The CAZ B+ option has a small negative impact (-£132,616) on affordability, with all concentrations of SMEs experiencing disbenefits.
There is a disproportionately large disbenefit in areas where there are a high number of SMEs.
a

PORTSMOUTH CITY COUNCIL
81
4.6.3. Strategic fit
The Strategic Case sets out the wider policy context within Portsmouth. The performance of
the packages in terms of complementing existing and planned wider policies for the city
(including promote economic growth, reduce levels of social deprivation, improve health and
encourage sustainable and active travel) is summarised below.
Table 4-18 – Contribution of the two packages to the wider policy agenda within the City
Portsea Island CAZ-C (Benchmark) CAZ B + non-charging measures (Alternative Package, CAZ B+)
Positive impact in terms addressing health related impacts of air quality amongst Portsmouth residents. Will also contribute to Portsmouth’s Sustainability and Climate Change Strategies by reducing CO2 emissions (slight reduction).
However, adverse impact on economic growth aspirations for the City due to additional costs for taxi drivers / operators, bus and coach operators, and businesses dependent on HGV and LGV use.
Positive impact in terms addressing health related impacts of air quality amongst Portsmouth residents. Will also contribute to Portsmouth’s Sustainability and Climate Change Strategies by reducing CO2 emissions (slight reduction).
Less of an adverse impact on economic growth aspirations for the City than the CAZ C benchmark, as fewer businesses and individuals affected.
Non-charging measures complement existing and planned wider policies for the city (including promote economic growth, reduce levels of social deprivation, improve health and encourage sustainable and active travel), in order to leave a positive legacy within the city. For example, the proposed cycling routes are part of the Draft Local Cycling and Walking Infrastructure Plan (LCWIP). More effective management of parking supply and charges forms a core part of the city’s strategy for encouraging greater use of sustainable transport (including the proposed Rapid Transit services and Park & Ride), as well as enabling development and growth ambitions for the city, as set out in the emerging Local Plan.
The Alternative Package will have less of an adverse impact on the economic growth
aspirations for the city than the CAZ C benchmark, and will leave a positive legacy within the
city due to the inclusion of non-charging measures which will contribute towards encouraging
sustainable and active travel.
4.6.4. Deliverability
The performance of the packages in terms of deliverability, i.e. supply side capacity and
capability is summarised below. Further information is available in the Commercial Case,
which sets out the plans for delivering and implementing the proposed measures.
Table 4-19 – Deliverability of the two packages
Portsea Island CAZ-C (Benchmark) CAZ B + non-charging measures (Alternative Package, CAZ B+)
Soft market testing has been carried out for a Clean Air Zone
A number of suppliers have shown an interest in the scheme and have confirmed that they would be able to deliver the CAZ within the required timescales.
Soft market testing has been carried out for a CAZ, with a number of suppliers having shown an interest in the scheme, and confirming that they would be able to deliver the CAZ within the required timescales.
Non Charging Measures
Parking measures - this element would be delivered in house by PCC
Strategic cycling routes - this measure would be for the development of two strategic cycle routes serving long distance corridors. This is likely to require the support

PORTSMOUTH CITY COUNCIL
82
Portsea Island CAZ-C (Benchmark) CAZ B + non-charging measures (Alternative Package, CAZ B+)
of consultants and would therefore be likely to require going out to the market
Alfred Road signal changes - this measure would be delivered in house
Progressive tightening of taxi licensing rules to ensure use of lower emission vehicles and ensure national projections regarding fleet upgrades occur in Portsmouth - this measure would be delivered in house
Rapid charging points at taxi ranks to enable taxi drivers to upgrade to electric vehicles
Reduced fee / free residents’ parking permits for low emission vehicles - this measure would be delivered in house
Travel planning measures to ensure that assumptions regarding increased levels of cycling and sustainable travel use are realized - potential to deliver this either using in house resource or by use of existing Framework agreement
Targeted communications and marketing initiatives, including continuation of anti-idling campaign, advance and real time (social and conventional media, VMS) messaging, integrated with the above travel planning measures - this measure would be delivered in house
Soft market testing has been carried out for a CAZ, and a number of suppliers have shown
an interest in the scheme and confirmed that they would be able to deliver either CAZ option
within the required timescales.
Non-charging measures included in the Alternative Package are conventional transport
schemes, which the Council is experienced in delivering in-house or via consultants.
4.6.5. Affordability
The performance of the packages in terms of affordability is summarised below. Further
information is available in the Finance Case, which sets out the funding and expenditure
requirements for the packages.
Table 4-20 – Affordability of the two packages
Portsea Island CAZ-C (Benchmark) CAZ B + non-charging measures (Alternative Package, CAZ B+)
It is envisaged that the approved CAZ would be fully funded by Defra, covering all costs incurred by the scheme
The approved CAZ would need to be fully funded by
Defra, covering all costs incurred by the scheme
Non Charging Measures
Parking measures – no funding required
Strategic cycling routes - this measure would require
funding from Defra in order for it to be delivered
Alfred Road signal changes - this measure would
require funding from Defra in order for it to be delivered
Progressive tightening of taxi licensing rules to ensure
use of lower emission vehicles and ensure national
projections regarding fleet upgrades occur in
Portsmouth – no funding required. However, Clean Air
Funding would be essential to support this measure

PORTSMOUTH CITY COUNCIL
83
Portsea Island CAZ-C (Benchmark) CAZ B + non-charging measures (Alternative Package, CAZ B+)
being delivered, and support taxi drivers to be able to
upgrade their vehicles. Without this funding support,
this measure could disadvantage vehicles registered in
the city.
Rapid charging points at taxi ranks to enable taxi
drivers to upgrade to electric vehicles - this measure
would require funding from Defra to enable it to be
delivered
Reduced fee / free permits for low emission vehicles –
no funding required
Travel planning measures to ensure that assumptions
regarding increased levels of cycling and sustainable
travel use are realized - this measure would require
funding from Defra to be delivered
Targeted communications and marketing initiatives,
including continuation of anti-idling campaign, advance
and real time (social and conventional media, VMS)
messaging, integrated with the above travel planning
measures - this measure would require funding from
Defra to be delivered
It is envisaged that both CAZ options would be fully funded by DEFRA, covering all costs
incurred by the scheme. For the Alternative Package, some non-charging measures simply
require policy changes but others require funding from DEFRA.
The overall cost of the CAZ Benchmark option (£23.2 mill, 2019 prices, excluding optimism
bias) is nearly 50% more than the cost of the Alternative Package (£16.1 mill, 2019 prices,
excluding optimism bias).
4.6.6. Achievability
The performance of the achievability (taking into account technical, legislative, and political
and public acceptability constraints.
Table 4-21 – Achievability of the two packages
Portsea Island CAZ-C (Benchmark) CAZ B + non-charging measures (Alternative Package, CAZ B+)
Whilst some in-house technical knowledge and experience already exists through the delivery and management of bus lane enforcement in the city, this is very small scale in comparison to a charging CAZ. Therefore, extensive consultant support would be required to design, support and deliver this scheme
Regarding the legislative process, despite not having specific experience in regards to a charging CAZ, the in-house legal team have a substantial amount of knowledge through experience with other schemes
Whilst some in-house technical knowledge and experience already exists through the delivery and management of bus lane enforcement in the city, this is very small scale in comparison to a charging CAZ. Therefore, extensive consultant support would be required to design, support and deliver this scheme
Regarding the legislative process, despite not having specific experience in regards to a charging CAZ, the in-house legal team have a substantial amount of knowledge through experience with other schemes.
Non Charging Measures
For all of the non-charging measures, in-house experience is available to deliver achievability in all schemes. A point to note is that Council elections are held every three years in the city, with the next

PORTSMOUTH CITY COUNCIL
84
Portsea Island CAZ-C (Benchmark) CAZ B + non-charging measures (Alternative Package, CAZ B+)
election due to be held in May 2020. Consideration would need to be given to the timescales for consultation to ensure that this does not coincide with Purdah
The CAZ C Benchmark Option is considered to be more challenging to deliver, given the
larger geographical scale of the CAZ, the larger number of businesses affected, and the
higher number of modes affected (due to the inclusion of LGVs). Technical, legislative,
political and public acceptability challenges are therefore likely to be more significant.

PORTSMOUTH CITY COUNCIL
85
Overall summary of package performance
An overall summary of the performance of the two packages against both the primary and
secondary Critical Success Factors is provided below. For each CSF the better performing
option is shaded blue.
Table 4-22 – Performance of the two packages against the Critical Success Factors
CSF Portsea Island CAZ-C (Benchmark)
CAZ B + non-charging measures (Alternative Package, CAZ B+)
Primary Critical Success Factor
Compliance in shortest time
Compliance achieved in 2022. Compliance achieved in 2022.
Secondary Critical Success Factors
Value for money
Negative Net Present Value (-£63.1million).
The cost of implementing and operating the option is higher (PVC = £47.5million) due to the larger geographical scale of the option; and the disbenefits are greater (PVB = -£15.6million), mainly because over 10 times as many vehicles are upgraded with associated welfare costs.
Negative Net Present Value (-£22.6million).
The cost of implementing the option is lower (PVC = £25.0million) due to the smaller geographical scale of the option; and positive benefits are derived, primarily from the time, vehicle operating costs, health, journey quality and absenteeism benefits associated with the non-charging options; and the damage cost savings associated with reduced emissions.
Distributional impacts
Slight / neutral distributional impacts relating to accessibility, severance, accidents, noise.
Large beneficial impact on air quality.
Moderate / large adverse impact on user benefits (personal trips), user benefits (HGV and LGV business trips), personal affordability.
Slight / neutral distributional impacts relating to accessibility, severance, accidents, noise, user benefits (personal trips).
Moderate beneficial impact on air quality.
Moderate adverse impact on user benefits (HGV and LGV business trips), personal affordability.
Strategic fit Positive impact in terms addressing health related impacts of air quality amongst Portsmouth residents. Will provide slight contribution to climate change and sustainability strategies.
However, adverse impact on economic growth aspirations for the City due to additional costs for taxi drivers / operators, bus and coach operators, and businesses dependent on HGV and LGV use.
Positive impact in terms addressing health related impacts of air quality amongst Portsmouth residents. Will provide slight contribution to climate change and sustainability strategies.
Will have less of an adverse impact on the economic growth aspirations for the city than the CAZ C benchmark and will leave a positive legacy within the city due to the inclusion of non-charging measures which will contribute towards encouraging sustainable and active travel.
Deliverability Soft market testing has been carried out for a CAZ, and a number of suppliers have shown an interest in the scheme, and confirmed that they would be able to deliver the CAZ within the required timescales.
Soft market testing has been carried out for a CAZ, and a number of suppliers have shown an interest in the scheme, and confirmed that they would be able to deliver the CAZ within the required timescales.
Non-charging measures are conventional transport schemes, which the Council is experienced in delivering in-house or via consultants.

PORTSMOUTH CITY COUNCIL
86
CSF Portsea Island CAZ-C (Benchmark)
CAZ B + non-charging measures (Alternative Package, CAZ B+)
Affordability It is envisaged that the approved CAZ would be fully funded by DEFRA, covering all costs incurred by the scheme.
Package cost = £23.1 mill, 2019 prices, excluding optimism bias.
It is envisaged that the approved CAZ would be fully funded by DEFRA, covering all costs incurred by the scheme.
Some non-charging measures simply require policy changes but others require funding from DEFRA.
Package cost = £16.1 mill, 2019 prices, excluding optimism bias.
Achievability Considered to be more challenging to deliver, given the larger geographical scale of the CAZ, the larger number of businesses affected, and the higher number of modes affected (due to the inclusion of LGVs). Technical, legislative political and public acceptability challenges are therefore likely to be more significant.
Considered to be less challenging to deliver, given the smaller geographical scale of the CAZ, the smaller number of businesses affected, and the fewer modes affected. Technical, legislative, political and public acceptability challenges are therefore likely to be less significant.
Preferred package
Based on the above analysis, the Alternative Package is identified as the preferred package.
The above results show that both the Benchmark and the Alternative Package deliver
compliance with the EU limit for NO2 concentrations in 2022, based on the core
assumptions. This is considered the shortest possible time and is a year earlier than
predicted through natural fleet upgrades. Neither scenario results in a worsening of
emissions elsewhere. The results of the sensitivity analysis provide confidence that the
Alternative Package will achieve compliance with the EU limit on both exceedance links, and
that concentrations will remain well below the EU limit at all ‘near exceedance’ sites. Neither
scenario results in a worsening of emissions elsewhere.
In addition, the Alternative Package is shown to perform more favourably in terms of the
secondary Critical Success Factors. In particular, the NPV is considerably less negative
than the NPV for the Benchmark Option and includes some user benefits, particularly time
savings due to congestion relief and welfare benefits associated with increased cycling. It
will also have less of an adverse impact on the economic growth aspirations for the city, and
will leave a positive legacy within the city due to the inclusion of non-charging measures
which will contribute towards encouraging sustainable and active travel.
The Alternative Package performs better in terms of affordability and achievability due to its
smaller scale.

PORTSMOUTH CITY COUNCIL
87
5. Commercial Case
Introduction
The Commercial case sets out the works and services that will be required to deliver the
preferred package of a Class B Clean Air Zone (CAZ) and supporting measures, the risks
associated with the delivery and the procurement routes available to deliver the project in the
most efficient way. This section sets out the intended approach to procurement and the
commercial strategy.
Portsmouth City Council's preferred package of measures is a CAZ B with a range of
supporting measures. These measures include taxis (amendments to licencing rules to
ensure all taxis and private hire vehicles are Euro 6C standard by 2022 and offering
incentives to encourage compliance), changes to Council owned city centre parking
availability and charges, expansion/upgrade of city centre cycle routes and changes to traffic
signals on Alfred Road.
Works and services
It is recognised that a range of works and services will be required to deliver the preferred
package of measures, from a variety of internal and external providers.
In respect of the implementation and operation of the charging CAZ element of the package,
the following activities will be required:
Scheme design and specification
On-road infrastructure (signs, road markings, network changes)
Roadside technology (ANPR cameras including installation, commissioning)
Communications (linking roadside infrastructure to back office systems)
Back office databases and data processing facilities
Back office payment and penalty systems
Maintenance and support
Ongoing development and further services
Operation of service (roadside technology to back office systems)
Enforcement of non-payment (including appeals)
Client-side support
In addition, the following activities are required to deliver the non-charging measures
included within the preferred package of measures:
Improvements to strategic cycle routes
Review of car parking availability and charges
Changes to traffic signal timings on Alfred Road
Tightening of licensing requirements for taxis and private hire vehicles (subject to
approval at licensing committee)
Sourcing approaches
In the Strategic Outline Case it was established that there are a number of procurement
routes that could be followed to procure the required works and services and further

PORTSMOUTH CITY COUNCIL
88
consideration has been given to the likely and preferred option to be undertaken for the
different elements of the preferred package.
The sourcing strategy has now been developed and the main procurement routes to be
utilised by the council in delivering the scheme detailed in Table 4-1 -Procurement Routes.
Where more than one route is identified for an element or activity, details of the preferred
route and why alternative approaches may be required are detailed in the relevant sections
within the commercial case.
Table 4-1 - Procurement Routes
Procurement Routes Elements / Activities
Restricted Procedure through the Official Journal of the European Union (OJEU) and in accordance with the Public Contract Regulations (2015)
CAZ and supporting activities and elements
Framework call-off to Alun Griffiths, City Centre Road Scheme partner contractor secured from an OJEU Restricted Procedure.
Civils works
Strategic Cycle Routes
Call-off to Ensign (Colas), Highways PFI Contractor. Civils works
Strategic Cycle Routes
Mini-competition from Portsmouth City Council's Portsmouth Area Highways Minor Works framework
Civils works
Strategic Cycle Routes
Framework call-off to Signways, via call-off from Hampshire County Council's Highways Signage framework.
Additional signage for CAZ scheme / cycle routes as required
Framework call-off to Atkins, Portsmouth City Council's Transport Professional Services Strategic partner
Client side support
Low value consultancy, modelling, other professional services
Low-medium value informal quotation procedures in line with the council's Contract Procedure Rules.
Client side support
The different elements and the preferred strategies are dealt with in more detail over the
following sections.
5.3.1. Class B Clean Air Zone
The preferred procurement route for the supply, installation and maintenance of all hardware
and supporting software for the clean air zone is an OJEU compliant Restricted Procedure to
establish a single supplier framework for the supply, installation, operation and maintenance
of ANPR hardware (cameras, installation poles etc.) and software.
A framework will be established to enable the council to call-off additional services over the
framework duration. This includes bus lane and school "keep clear" zone enforcement when
the current contract expires and the potential to call-off further services as required.
Aggregation of demand within a framework will help to make the council's opportunity more
attractive to the market and use of a framework will enable award to the second placed
bidder in the event the preferred bidder fails to perform satisfactorily during the design
configuration stage.
A two stage tendering approach will provide the council with significant assurances in
respect of project delivery and cost. Stage one tenders will provide a high level of detail
against developed Employers Requirements in respect of how the CAZ will be delivered, as
well as a high level of cost granularity. Detailed and developed solutions will undergo final
configuration by the preferred supplier using an initial call-off from the framework for

PORTSMOUTH CITY COUNCIL
89
professional services. Once the agreed and finalised, the council will enter into a contract for
the supply and installation of the CAZ and a contract for the operation and maintenance of
the CAZ with the supplier.
Restricted Procedure
Following an open call for competition, a minimum of three and a maximum of five of the
most suitable bidders will be shortlisted to receive the invitation to tender. It should be noted
that while the Public Contract Regulations 2015 state that a minimum of five bidders are to
be shortlisted, the council has significant experience of establishing a shortlist of three or
four bidders without challenge. In past projects, the council has openly and transparently
stated its intentions within the published OJEU notice, to shortlist a reduced number of
bidders if required. In the event that evaluation of initial interest provides a clear distinction
between the top three and/or four returns and the remaining bidders, the council is not
required to invite less suitably qualified contractors through to the tender stage purely to,
"make up the numbers". This prevents the expenditure of unnecessary resources for
additional bidders and for the council and provides shortlisted bidders with additional
confidence and motivation as they are one of a smaller pool of potential suppliers.
While this approach does present a risk of challenge from a bidder not shortlisted, the level
of risk is low and mitigation can be provided in the form of clear and transparent advertising
of the shortlisting procedure within the OJEU Notice and within the documents, robust and
detailed feedback to all unsuccessful bidders, and the ability to extend the shortlist to the
fourth and/or fifth ranked bidder in the event of a challenge. This approach is in accordance
with market norms for projects where the cost of bidding is higher for both parties, for
example for design and build projects. The council has tested its approach with the market
and feedback has been positive with suppliers indicating their preference to be one of a
smaller pool of shortlisted bidders and therefore more willing to commit a greater level of
resource and commitment to the bid. The council is satisfied that the risk of potential
challenge is low in both likelihood and impact and therefore this can be tolerated within the
procurement strategy.
Supplier Selection
In order to shortlist three to five suitable bidders, the call for competition will focus on
bidders' experience and capabilities which bidders will be required to demonstrate via
provision of three to five contract case studies.
The minimum requirements are as follows:
Experience of the direct delivery of at least three similar charging and enforcement
schemes that include all aspects of the council's process map. At least one scheme must
include school "keep clear" enforcement.
Design of charging schemes delivered on a minimum of two contracts.
Stakeholder management and engagement on a minimum of two contracts.
Experience of integration with Conduent systems (Conduent's Si-DEM solution is the
council's current back office case/debt management system) on at least two contracts.
Significant position in the industry including number of years the company has been
established in the industry, influence in the industry and on national policy.
Experience of working of partnership working.
Experience of following open book principles of working.
Experience of working under NEC terms.
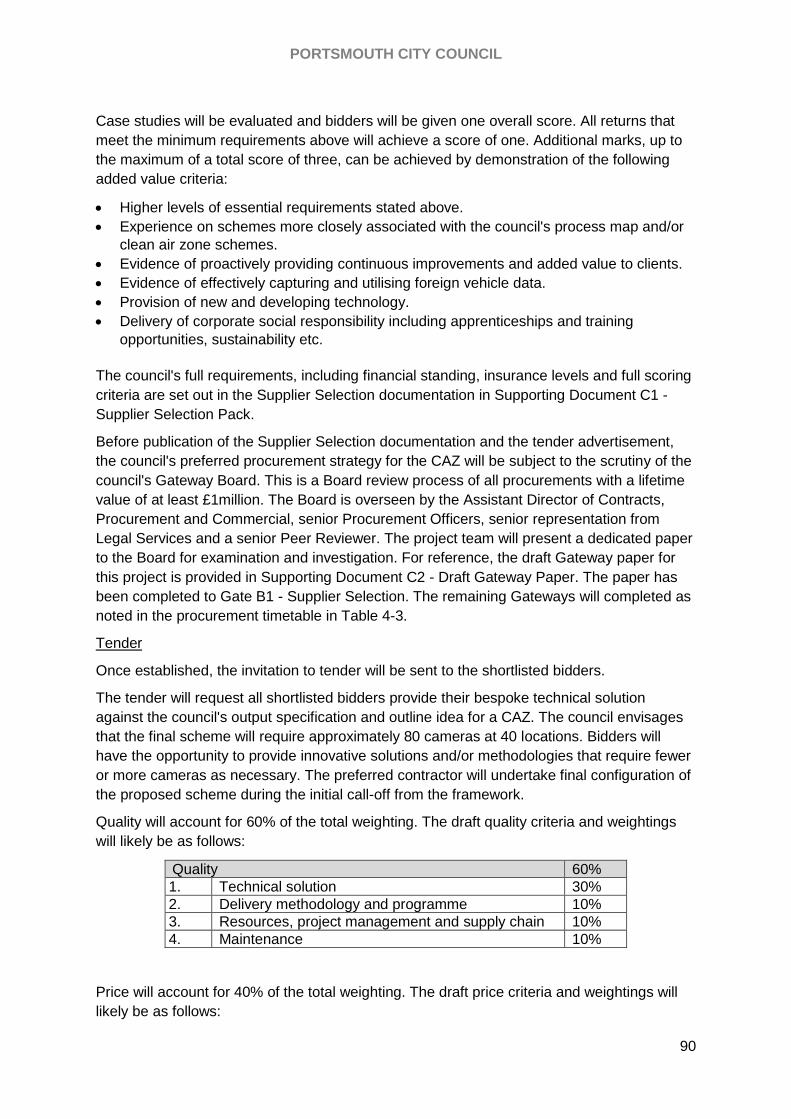
PORTSMOUTH CITY COUNCIL
90
Case studies will be evaluated and bidders will be given one overall score. All returns that
meet the minimum requirements above will achieve a score of one. Additional marks, up to
the maximum of a total score of three, can be achieved by demonstration of the following
added value criteria:
Higher levels of essential requirements stated above.
Experience on schemes more closely associated with the council's process map and/or
clean air zone schemes.
Evidence of proactively providing continuous improvements and added value to clients.
Evidence of effectively capturing and utilising foreign vehicle data.
Provision of new and developing technology.
Delivery of corporate social responsibility including apprenticeships and training
opportunities, sustainability etc.
The council's full requirements, including financial standing, insurance levels and full scoring
criteria are set out in the Supplier Selection documentation in Supporting Document C1 -
Supplier Selection Pack.
Before publication of the Supplier Selection documentation and the tender advertisement,
the council's preferred procurement strategy for the CAZ will be subject to the scrutiny of the
council's Gateway Board. This is a Board review process of all procurements with a lifetime
value of at least £1million. The Board is overseen by the Assistant Director of Contracts,
Procurement and Commercial, senior Procurement Officers, senior representation from
Legal Services and a senior Peer Reviewer. The project team will present a dedicated paper
to the Board for examination and investigation. For reference, the draft Gateway paper for
this project is provided in Supporting Document C2 - Draft Gateway Paper. The paper has
been completed to Gate B1 - Supplier Selection. The remaining Gateways will completed as
noted in the procurement timetable in Table 4-3.
Tender
Once established, the invitation to tender will be sent to the shortlisted bidders.
The tender will request all shortlisted bidders provide their bespoke technical solution
against the council's output specification and outline idea for a CAZ. The council envisages
that the final scheme will require approximately 80 cameras at 40 locations. Bidders will
have the opportunity to provide innovative solutions and/or methodologies that require fewer
or more cameras as necessary. The preferred contractor will undertake final configuration of
the proposed scheme during the initial call-off from the framework.
Quality will account for 60% of the total weighting. The draft quality criteria and weightings
will likely be as follows:
Quality 60%
1. Technical solution 30%
2. Delivery methodology and programme 10%
3. Resources, project management and supply chain 10%
4. Maintenance 10%
Price will account for 40% of the total weighting. The draft price criteria and weightings will
likely be as follows:

PORTSMOUTH CITY COUNCIL
91
Price 40%
5. Indicative price of tendered solution 20%
6. Design 10%
7. NEC fee percentage 10%
It should be noted that these criteria and weightings are currently in draft format. Before the
tender is published to the shortlisted bidders, all tender criteria will be examined and
reviewed by the Gateway Board through submission of the B2 Gateway Paper on 17th
January 2020.
In submitting prices, bidders will be required to complete a cost model to demonstrate unit
prices for hardware (cameras, camera poles etc.), design rates, installation rates,
maintenance rates, project management rates and materials costs. Bidders will be able to
modify this model as required for their unique bid. Bidders will be held to these prices,
subject to agreed uplifts, throughout the framework period. This ensures that:
The council achieves a high degree of granularity in respect of pricing.
Tender returns provide a high level of confidence and cost assurance at tender stage
without a final design configuration / specification.
Competitively tendered prices can be tracked and held throughout the contract,
minimising the risk of cost inflation and budget overrun from Outline Business Case to
Full Business Case and during the implementation phase.
During the tender stage, face to face dialogue meetings will be offered to all shortlisted
bidders. The purpose of this offer is to ensure bidders have a thorough and complete
understanding of the specification, the tender process and the tender submission
requirements. It provides bidders with the opportunity to test and verify that approaches
taken are acceptable to the council, the opportunity for further clarification and to enable
dialogue between bidders and the council in respect of the approach to contractual terms
and allocation of risk during the operation of the framework.
Meetings are held on a one-to-one confidential basis to ensure bidders have a suitable
environment to test commercially sensitive ideas. Meetings are not a replacement for the
Master Clarification Log that is maintained throughout the tender process and made
available to all bidders; or an initiation of a negotiated procedure and they do not provide any
single bidder with an advantage. An audit trail is maintained and each meeting is minuted
and notes shared with all attendees. In the event that discussions result in changes to the
specification or tender documents, or the release of any information not previously shared,
the details are shared with all bidders via the Master Clarification Log to ensure the tender
process remains fair and transparent.
The council has offered these one-to-one meetings to bidders during the procurement on a
number of high value and high risk projects, including the recent Southsea Coastal Defences
scheme, the North Portsea Island Flood Defences scheme and the City Centre Road Re-
development scheme. In the council's experience, these meetings are appreciated by
bidders, regardless of whether or not they succeed in winning the tender. Bidders report
getting a much clearer and more detailed understanding of requirements than can be
achieved via written clarification, with the use of follow up questions that can be answered
instantly. In addition, the ability to test innovative and variant approaches ensures bidder
resources are not wasted with unacceptable or unworkable offers. Bidders are generally

PORTSMOUTH CITY COUNCIL
92
more engaged with the tender and produce higher quality, well-developed final tenders that
consider all aspects of the requirements. In the council's experience, this approach provides
bids that fully and clearly address the stated requirements and require fewer post-tender
clarifications. This generates a streamlined evaluation process that can be robustly and
confidently completed. This approach also encourages bidders to demonstrate a higher level
of engagement and commitment to the project. This gives rise to a short mobilisation period
because the "understanding the client" period has already been completed during the
tender.
Two Stage, Design, Supply and Install Approach
The nature of the clean air zone project, in particular the potential for changes to the
proposed scheme following feedback from both the public consultation and from JAQU, has
led the council to adopt a two stage, design, supply and install process. The rationale and
benefits of using this approach are as follows:
Works very well with output specifications with design, supply and install responsibilities
as it allows for significant de-risking for both parties due to first stage collaboration.
Any design produced by a third party consultant carries the risk that the solution will be
over-engineered, will not take advantage of industry best practice and will have
deliverability issues.
Designs from third party consultants may also include items that are not required for the
final configured scheme and omit others that are, resulting in a tender exercise that is
effectively meaningless and resulting in costly variations that impact programme.
The supplier selected to supply and install the CAZ will require time to review the
designs and offer value engineering opportunities, adding additional delay to the
programme.
Feedback from JAQU and from the public consultation may impact the final design
configuration and these changes may be difficult or costly to implement with the CAZ
supplier. Alternatively, the design cannot begin until after the consultation closes and the
results analysed adding further delay to the programme.
The end of the public consultation and final selection of the CAZ supplier will both occur
at the end of March 2020. Data analysis from the public consultation can take place in
conjunction with final design configuration and allows the CAZ supplier to start working
on the design as early as possible.
Configuration of the final scheme can be completed using the contractor's expertise and
with the contractor's technological capabilities in mind.
Configuration of the final scheme will build in deliverability and value engineering, rather
than require a separate phase.
Once secured, design of the CAZ scheme is programmed to take 11 weeks. During the
design phase, the CAZ supplier will design the scheme, reporting to the council's project
manager and using the information from the public consultation and the feedback from
JAQU. The design configuration phase allows for any investigatory or enabling works to be
undertaken in order to identify and minimise risk for the supplier and the council. The outputs
of the design configuration phase are:
Confirmation of a final design configuration and associated programme and delivery
methodology with confirmed costs which is submitted as part of the Final Business Case.
Complete drafting and preparation of the supply and installation contract and operation
and maintenance contract and service level agreements.

PORTSMOUTH CITY COUNCIL
93
Please note, the council's preferred contracting and risk strategy is addressed in sections
4.4 and 4.6.
A criticism of two stage tendering and contracting is that an element of risk is introduced in
respect of costs because tenders will not be submitted on the basis of a fully finalised
configuration, and therefore could be subject to variation, specifically an increase in costs.
However for this project, the stage one tender will include a significantly high level of detail in
respect of scheme design and cost to provide a high level of confidence in respect of the
final scheme cost. Unit prices for hardware and materials, rates for installation, servicing and
maintenance and project management, overhead and profit percentages, and uplift
mechanisms secured during the competitive tender process for the duration of the
framework agreement will provide sufficient granularity for a thorough examination of final
and continuing costs. In addition, the contracting arrangements with the CAZ supplier, as
outlined in section 4.4 are based on open book partnership working thereby ensuring that
the final scheme cost, including any items not costed during the competitive tender, is
transparently calculated and can withstand any scrutiny of investigate to ensure best value.
Securing key prices during the competitive tender process ensures that the risks posed by
the two stage approach do not account for the total project cost. The council estimates that:
85% of the final scheme cost: Fixed at first stage tender under competitive conditions
15% of the final scheme cost: Finalised during the second stage, costed on a re-
measureable bases from process securing during the first
stage tender under competitive conditions.
This approach also mitigates against potential changes in final scheme configuration that
may be costly to implement and doing so could cause significant programme delays.
In addition, the final scheme is substantially de-risked for the contractor, the need for future
variation is minimised and where required, the cost of any variation is based upon pre-
agreed rates and uplift mechanism. This ensures that the final scheme cost submitted as
part of the Final Business Case is presented with a high degree of cost certainty and
provides significant confidence in deliverability.
In the unlikely event that the preferred bidder fails to meet key milestones during the final
design configuration phase, the two-stage process allows the council to terminate the
contract with the preferred bidder and move to contract with the second placed bidder.
Contracting strategy and termination clauses are dealt with in Section 4.4.
It is noted that other strategies could have been employed for the selection of a CAZ supplier
and that other strategies may appear to provide timetable improvements over the Restricted
Procedure with its additional stage in selection. The council has considered several sourcing
approaches and this evaluation is documented in Table 4-3.
The full procurement timetable for the CAZ is outlined in Table 4-2.

PORTSMOUTH CITY COUNCIL
94
Table 4-2 - CAZ Procurement Timetable
Action Target date
1 Gateway Board (Gates A and B1) 13th November 2019
2 Contract notice published on OJEU 14th November 2019
3 Selection stage documents available on In-tend 18th November 2019
4 Deadline for requests for selection stage clarification 9th December 2019
5 SSQ return deadline 20th December 2019
6 Evaluation of SSQs completed 10th January 2020
7 Selection decision notified to candidates 10th January 2020
8 Gateway Board (Gate B2) 17th January 2020
9 Invitation to tender issued to shortlisted tenderers 20th January 2020
10 Deadline for requests for tender stage clarification 17th February 2020
11 Tender return deadline 28th February 2020
12 Invitation to interview (if required) 6th March 2020
13 Interview period 11th - 12th March 2020
14 Moderation 13th March 2020
15 Project Board Approval 17th March 2020
16 Gateway Board (Gate C) 20th March 2020
17 Award decision notified to tenderers 23rd March 2020
18 Standstill period starts 24th March 2020
19 Standstill period ends 2rd April 2020
20 Contractor secured and framework awarded 3rd April 2020
Procurement Delivery
The Restricted Process will be delivered by the council's procurement team who are fully
resourced to deliver the project and in accordance with Portsmouth City Council's contract
procedure rules.
In order to ensure all aspects of the project and its impacts are effectively considered,
several working groups have been established to inform the supplier requirements and
technical specification and to assist with evaluation and eventual implementation. These
groups include representation from:
Transport
IT
Parking and Enforcement
Procurement
Legal
PFI Contract Management Team
Communication
City Helpdesk team
Finance

PORTSMOUTH CITY COUNCIL
95
Table 4-3 - Discounted Routes to Market
Route to Market Advantages Disadvantages Rationale for not pursing
Crown Commercial Service (CCS) Traffic Management Technology 2 framework (RM1089)
Suppliers already pre-selected by CCS Framework suppliers are prepared for CAZ work. The framework has already been used by Leeds. Shorter tender period than a Restricted Procedure.
Lack of flexibility in the procurement strategy to accommodate a two stage process. Incumbent supplier for bus lane enforcement not on framework. Very broad range of suppliers and an obligation to invite all suppliers. Concern that suppliers will not PCC requirements. Not able to use a selection stage. Need for fully designed scheme before accessing. Pricing fixed so any changes will be costly due to lack of open book working.
Discussions with the framework manager has concluded that a two stage tendering strategy is not an appropriate use of the framework. Instead, the framework manager recommended a call-off for professional services from Lot 12 of the framework, before approaching CAZ suppliers. This does not provide the council with the opportunity to test the design and deliverability of the scheme with the preferred CAZ supplier, or include changes as a result of feedback from JAQU and the public consultation. Additional time and cost will be required for the preferred CAZ supplier to review all designs and to allow for re-design where required. Feedback from the supply market and from other Local Authorities suggests that a procurement strategy that allows for some flexibility in the design approach will enable the council and the CAZ supplier/operator to enact any changes quickly and efficiently without disrupting the programme or contractual relationship.
Open Procedure Shorter timescales - compliant tender period of 30 days. Allows open competition including suppliers not on the CCS framework.
Inability to offer one to one confidential meetings due to number of potential bidders. Traditional clarification process does not encourage commitment of bidders. This results in bids of a limited development requiring further clarification.
The Open Procedure could provide small programme benefits during the tender phase because it is a single stage process. However on this project, any potential benefits of a single stage are negated by a lengthier tender period to allow for a greater number of clarifications from a larger pool of bidders, and a more complex evaluation process as a result of a larger number of returns and the need for greater clarification of tenders that are likely to be of varying quality and may lack detail. The Restricted Procedure will take a similar amount of time and provide more developed final bids that will allow for speedier mobilisation and implementation of the design configuration phase.

PORTSMOUTH CITY COUNCIL
96
Shorter tender period negated by lengthy evaluation period. Bidders put off - less effort. Less well developed bids received in the timescale. Higher weighting on quality which could lead to cost escalation - no selection stage to ensure quality. Mitigated by high quality weighting.
A brief comparison between the Open and Restricted Procedure is provided below:
Open Procedure Restricted Procedure
SSQ Issued 18th November 2019
SSQ Returned 20th December 2019
Evaluation 17th January 2020
Communication 17th January 2020
ITT issued 16th December 2019 20th January 2020
ITT returned 14th February 2020 28th February 2020
Evaluation 6th March 2020 13th March 2020
Internal approvals 17th March 2020 20th March 2020
Standstill 30th March 2020 2nd April 2020
Contractor secured and framework awarded
31st March 2020 3rd April 2020
Voluntary Ex-Ante Transparency (VEAT) Notice
Fast award process. Established working relationships with current supplier. Lengthy integration process already completed.
High risk of challenge from the market.
A VEAT notice could be used to award the contract to the council's current bus lane enforcement supplier, who was selected following an OJEU compliant Open Procedure undertaken in 2014, with contract commencement from July 2015. However, the council considers there to be insufficient justification to award this contract without competition. The original advert for this opportunity clearly specified that the contract was for bus lane and bus gate enforcement only. No further expansion of the scope was identified. The extent of the current ANPR camera network does don’t give rise to a persuasive argument for the absence of competition for technical reasons. While integration took approximately 9 months, a new supplier could negate these issues in delivery (e.g. with a standalone system). The council has not tested the market in over five years and soft market testing has demonstrated a variety of sources of supply that could offer a range of solutions. The current supplier has already been awarded a CAZ contract via a VEAT notice and a second may increase the risk of challenge from other suppliers.

PORTSMOUTH CITY COUNCIL
97
5.3.2. Other aspects of the Class B Clean Air Zone
The result of the Restricted Procedure procurement exercise is to secure a supplier to
design, supply, install, operate and maintain all hardware and software operations of the
charging CAZ.
Other services are also required in order to design and implement the CAZ:
Signage
All bidders will be asked to price for the supply and installation of required signage for the
CAZ as part of the tender process. Any required signage not provided by the CAZ supplier
can be sourced via a single supplier framework provided by Hampshire County Council for
the supply and installation of signs and sign posts for the traffic network. Portsmouth City
Council are named users of the agreement and orders are placed directly with Signway
Supplies Limited via direct award.
Civils Works
All bidders will be asked to price for the complete installation of the CAZ infrastructure
because the council would prefer to transfer all risk associated with the installation of the
system to the supplier.
In the event the supplier is unable to complete some or all of these works, there are multiple
sourcing routes for any civils works required for the installation and operation of the CAZ.
These are:
Portsmouth Area Highways Minor Works Framework - a multi supplier framework
provided by Portsmouth City Council for highways minor works in the Portsmouth
area. Nine contractors over two Lots are invited to participate in mini-competitions.
Where time is of the essence direct awards are also permitted. The framework is
predominantly used by the council for delivery of designed works, however there is
scope within the framework to source contractors on a design and build basis. All
works are delivered under NEC4 Engineering and Construction Short Contracts. This
is the primary route for delivery of civils works outside of the city centre.
Alun Griffiths is the council's City Centre Road Scheme Design and Build Contractor
secured from an OJEU Restricted Procedure. This is a single supplier framework for
the design and build of the city centre road scheme which allows for various call-offs
for works and services within the "City Centre Road Scheme" boundary. Works and
services with significant value or risk within this boundary can be allocated to the
contractor for delivery. Alun Griffiths are partnered with Peter Brett Associates who
can provide professional services and design support. All works and services are
delivered using NEC4 contracts. This is the primary route for delivery of civils works
inside of the city centre boundary.
Call-off order placed with Portsmouth City Council's PFI Highways Contractor,
Ensign Highways Limited, utilising existing contractual arrangements. This route will
be used where programming of other works in the area provides programme
benefits.
All requirements for civils works will be identified during the design configuration phase with
the CAZ contractor.

PORTSMOUTH CITY COUNCIL
98
Any design activity for civils works not undertaken by the CAZ supplier will be undertaken in-
house by the council's team of highways engineers. In the event that external design support
is required, this will be sourced via a direct award to Atkins via the council's single supplier
Professional Support Partnership Framework and supervised by the council's in-house
highways engineers. As noted above, further design support is also available through the
council's contractor frameworks.
Client-side support
Professional support and expert advice in respect of CAZ schemes is required to provide the
council with "critical friend" guidance in respect of tender specification, tender returns, final
designs and contract management and sign off.
The council has an existing relationship with Atkins via its single supplier Professional
Support Framework. In the event that the required expertise is not available within Atkins,
the council is prepared to run a quotation exercise to secure professional support via a
medium value (below £100,000) quotation process. This process, run in conjunction with the
CAZ supplier selection stage, will secure a consultant in time for the CAZ tender release in
January.
Enforcement
Enforcement of non-payment activities including processing of appeals will be managed by
Portsmouth City Council's in-house parking service. In the event that penalty charge notices
remain unpaid, further enforcement will be undertaken using Portsmouth City Council's
current parking enforcement contract. As a result, no further procurement considerations
have been noted.
5.3.3. Supporting/non-charging measures
All of the supporting and non-charging measures that complete the council's preferred
package will be delivered using existing contracts and frameworks. There may be a need for
low value consultancy services for events to assist with scheme promotion and where
identified, these services will be sourced via quotation process. Given the value of required
services and the need for Portsmouth specific events, there will be little value in
collaboration with surrounding services.
A summary of the preferred procurement strategy for all supporting and non-charging
measures can be found in Table 4-5.
A summary of the programme for all anticipated procurement activity for the project is
provided in Table 4-4.

PORTSMOUTH CITY COUNCIL
99
Table 4-4 - All Procurement Activity
Month CAZ Professional Services Cycle Schemes
November 2019 Issue SSQ Low value quotation Initial discussions with Alun Griffiths
December 2019 SSQ return Consultant secured Internal approvals and contract drafting
January 2020 SSQ evaluation Issue ITT
Client-side support contract begins
Contract executed
February 2020 ITT return Design activities begin
March 2020 ITT Evaluation
April 2020 Contractor Secured
May 2020 Final design configuration and cost confirmed.
June 2020
July 2020
August 2020
September 2020
Please note, no timescales have been provided for the traffic signals changes because
consultants for modelling have already been secured. In the event that additional hardware
is required, this call-off process will take a maximum 4 weeks. This is a compliant call-off to
Siemens from the CCS RM1089 framework using standard framework call-off terms and the
council's standard z-clauses. The council has an established relationship with Siemens and
no additional contracting time is anticipated.

PORTSMOUTH CITY COUNCIL
100
Table 4-5 - Procurement strategy for supporting measures
Measure Key Requirements Procurement Route Contract Model
Improvements to strategic cycle routes
Design of cycle route expansion/upgrade Civils works for network improvements Necessary communications in respect of any disruptions Publicity and awareness raising of new infrastructure
The majority of the schemes are to be delivered within the city centre and will therefore be delivered by the council's City Centre Road contractor, Alun Griffiths. Alun Griffiths are partnered with Peter Brett Associates who can provide professional services and design support. All works and services are delivered using NEC4 contracts. This is the primary route for delivery of civils works inside of the city centre boundary. One scheme is located outside of the city centre boundary and therefore outside of the remit of the City Centre Road framework. The preferred procurement route is still Alun Griffiths although via direct award. Given the cost, management and programme benefits to be obtained in using the same contractor, the council has significant justification for a direct award. The works are below the Works threshold of £4,551,413 although above the council's £100,000 tender threshold. The contract procedure rules can be waived if there is significant justification and approval from the Assistant Director of Contracts, Procurement and Commercial and Legal Services. In the event of any concerns raised in respect of a direct award, a call-off from the council's Portsmouth Area Highways Minor Works framework, or a call-off with the council's PFI contract will be used instead.
Design work will be carried out by Alun Griffiths' partner, Peter Brett Associates using NEC4 Professional Services Short Contract. Civils works will be via NEC4 Engineering and Construction Short Contracts. In the event alternative procurement routes are used:
Portsmouth Area Highways Minor Works framework - using the NEC4 Engineering and Construction Short Contract
PFI call-off - existing terms and conditions.
Any consultancy support for events will utilise the council's standard consultancy terms and conditions. Payment will be via the council's standard terms which are 30 days from invoice for work carried out.
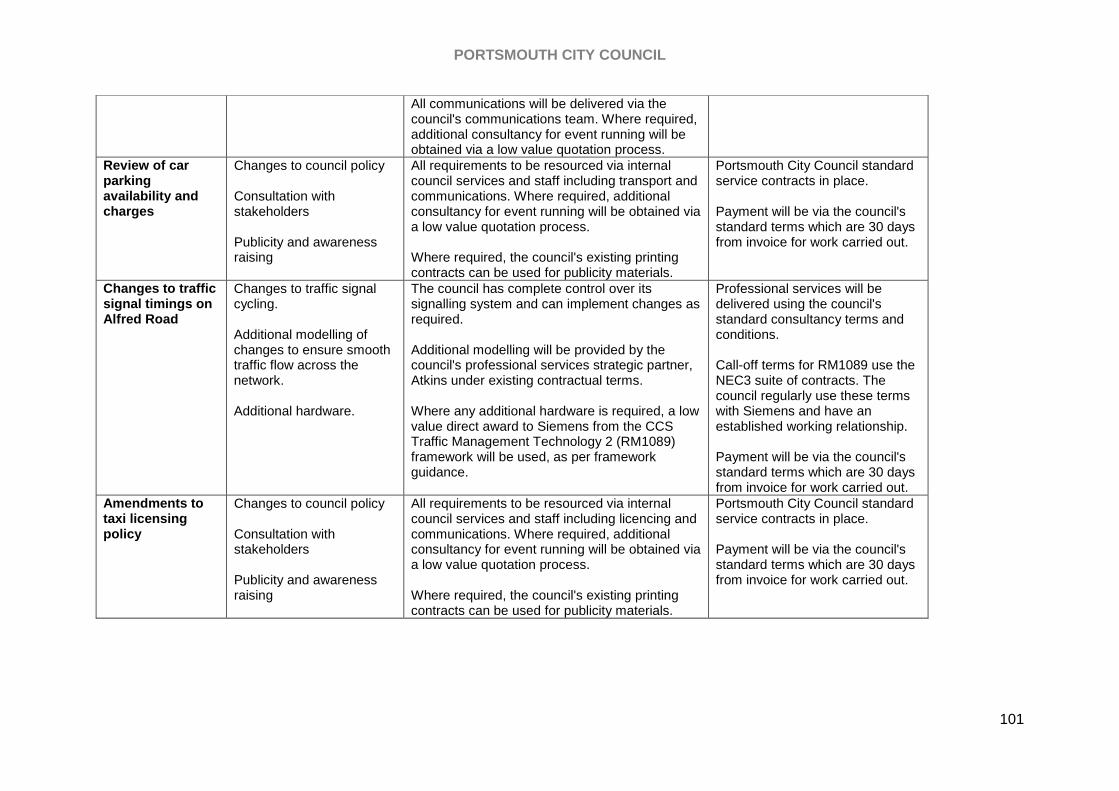
PORTSMOUTH CITY COUNCIL
101
All communications will be delivered via the council's communications team. Where required, additional consultancy for event running will be obtained via a low value quotation process.
Review of car parking availability and charges
Changes to council policy Consultation with stakeholders Publicity and awareness raising
All requirements to be resourced via internal council services and staff including transport and communications. Where required, additional consultancy for event running will be obtained via a low value quotation process. Where required, the council's existing printing contracts can be used for publicity materials.
Portsmouth City Council standard service contracts in place. Payment will be via the council's standard terms which are 30 days from invoice for work carried out.
Changes to traffic signal timings on Alfred Road
Changes to traffic signal cycling. Additional modelling of changes to ensure smooth traffic flow across the network. Additional hardware.
The council has complete control over its signalling system and can implement changes as required. Additional modelling will be provided by the council's professional services strategic partner, Atkins under existing contractual terms. Where any additional hardware is required, a low value direct award to Siemens from the CCS Traffic Management Technology 2 (RM1089) framework will be used, as per framework guidance.
Professional services will be delivered using the council's standard consultancy terms and conditions. Call-off terms for RM1089 use the NEC3 suite of contracts. The council regularly use these terms with Siemens and have an established working relationship. Payment will be via the council's standard terms which are 30 days from invoice for work carried out.
Amendments to taxi licensing policy
Changes to council policy Consultation with stakeholders Publicity and awareness raising
All requirements to be resourced via internal council services and staff including licencing and communications. Where required, additional consultancy for event running will be obtained via a low value quotation process. Where required, the council's existing printing contracts can be used for publicity materials.
Portsmouth City Council standard service contracts in place. Payment will be via the council's standard terms which are 30 days from invoice for work carried out.

PORTSMOUTH CITY COUNCIL
102
Contracting arrangements
Framework
In establishing a single supplier framework the council is able to call-off works and services
in "bite-sized" chunks, using the terms and conditions appropriate to the works and/or
services required. This provides a significant amount of flexibility and mitigates the risk that
terms stated at the outset to encompass a variety of circumstances become erroneous or
excessive once the contractor is secured, the detailed design is finalised and the project is
de-risked for the supplier.
This approach also ensures the council is not committed to the supplier for a supply, install,
operate and maintain contract from the outset. Failure of the preferred bidder to meet key
milestones during the initial call-off for professional services to configure the detailed design
allows the council to terminate the contract and move to the second placed bidder.
It is sometimes suggested that in allowing for the option to move to the second placed
bidder, the contracting authority should enter into contract with both the preferred and
second placed bidder from the outset. However, this is approach is not generally used within
the public sector because it incurs the risk of additional programme delays and the need for
further resources caused by executing and managing two contracts and design configuration
processes. It also creates risk by introducing a second award procedure once the final
scheme configuration is agreed.
Therefore the council will execute a contract with preferred bidder only and will utilise the
option of contracting with the second bidder in the event that the preferred bidder fails to
meet the key milestones within the contract. This approach is an established practice used
throughout the public sector to establish a number of high value frameworks. Therefore this
is not seen as a risk to the procurement strategy.
The framework is available to the council for the CAZ and for associated products and
services as required. The council will use the framework to call-off bus lane and school
"keep clear" enforcement cameras and services at the end of the council's current contract
in 2020, and further enforcement services, for example for moving traffic enforcement are
likely to be required in the future if local authority enforcement powers are expanded as
indicated in recent announcements. This aggregation of demand provides a more valuable
opportunity to bidders which in turn should provide better costs and greater innovation.
As a result, the framework must be broad enough in scope to cover a variety of requirements
both now and in the future. This scope includes:
Core Services
o ANPR enforcement hardware, infrastructure and services (design, project
management etc.)
o ANPR enforcement to be used for the enforcement of clean air zones, bus
lanes and bus gates, school "keep clear" areas, moving traffic violations.
Additional Services
o Traffic monitoring
o Bluetooth and smart cities technology
o CCTV
The framework runs for a period of four years, extendable in increments to be agreed to a
maximum term of four years. Call-offs from the framework can extend beyond this in order to

PORTSMOUTH CITY COUNCIL
103
capture one refresh cycle of hardware, and suppliers report lifespans ranging from five to ten
years. Therefore call-off contracts for operation, servicing and maintenance will be of a
minimum term of five years, extendable on a rolling basis as required.
This is a framework for use by Portsmouth City Council only. Where the OJEU Notice states
that delivery will be throughout South Hampshire, this is only for neighbouring authorities
who contract with Portsmouth City Council to provide a shared parking and/or traffic
enforcement service. Neighbouring authorities are not be able to directly call-off from the
framework.
Call-off Terms
The proposed call-off terms to be used during operation of the framework are set out in
Table 4-6.

PORTSMOUTH CITY COUNCIL
104
Table 4-6 - Preferred call-off terms
Activity Contract Payment Mechanism KPIs
Final configuration of the charging CAZ
NEC4 Professional Services Short Contract (including council standard z clauses for GDPR, FOI etc.)
Payment monthly in arrears for work completed. Payment to be made within 30 days of receipt of a compliant invoice. Bonus payments used to incentivise performance linked to completion of key milestone tasks. Liquidated damages to be used where key milestones tasks are not completed.
Quality of Design
Adherence to programme
Timely and clear communication
Management of stakeholders
Partnership working
Business processes including timely and accurate invoices
Key milestone tasks within the contract will ensure there are no programme slippages. Milestones will be set to programme and cost target and the council's will set its 'red lines' in respect of milestones during the tender. Bidders can improve on these with their tender response which will be taken into account during evaluation. The supplier will be incentivised to meet or improve on key milestone tasks with the use of bonus payments. Non-compliance will be deterred by the use of liquidated damages and termination clauses that ensure the council can terminate with zero notice while retaining all Intellectual Property Rights. Client side professional support to ensure quality of design, satisfactory achievement of key milestone tasks and approval of bonus payments.
Supply, installation and set-up of all hardware and software for the charging CAZ.
NEC4 Engineering and Construction Contract (Option A)
Preferred payment structure is monthly in arrears for work completed, with payment made within 30 days of receipt of a compliant invoice. This has been tested with the market who have confirmed this approach is acceptable. Where staged payments are required, for example to kick off the order/manufacture of hardware, these can be accommodated. Preferred staged payment structure is:
Adherence to programme
Quality of delivery
Integration with current system
Timely and clear communication
Management of stakeholders
Partnership working
Business processes including timely and accurate invoices

PORTSMOUTH CITY COUNCIL
105
25% on order
25% on delivery and factory test
50% on installation, commissioning and on-site test
Key milestones and completion dates set into the contract to ensure there are no programme slippages, with bonus payments to incentivise performance and liquidated damages to deter non-compliance. Client side professional and quantity surveyor support to ensure quality of delivery and invoicing.
Operation and maintenance of the charging CAZ
NEC4 Term Service Contract with required council/contractor terms as necessary (e.g. z clauses for GDPR, FOI and any amendments necessary for the supplier to effectively deliver the contract./ Additional X options will be agreed with the preferred bidder during the design phase, however preferred X options include: X17 - Low service damages
Payment monthly in arrears for work completed. Payments to be made within 30 days of receipt of a compliant invoice. Use of low service damages to incentivise performance.
Capture rate
Downtime
Timely and clear communication
Partnership working
Upgrades and innovation
Business processes including timely and accurate invoices
While the council will state minimum capture rates and reliability/downtime, bidders will submit their proposed rates within their tenders. These will be incorporated into the service level agreements and KPIs. If the service is suffers non-agreed downtime in excess of agreed service levels, low service damages will be used. These will reflect the anticipated levels of income received from the CAZ on an hourly basis. Downtime will be measured on an annual basis and if the average across the year is in excess of the committed levels, an improvement notice will be issued. This will not be considered a material breach, but will be linked with the persistent breach clause within the contract and will allow the council to terminate the contract for persistent failure to provide a consistent service. Upgrades and innovation performance measures will be included to minimise the risk of technological obsolescence.

PORTSMOUTH CITY COUNCIL
106
The operation and maintenance agreement will be on an NEC4 Term Service Contract
which will be amended as necessary using z clauses in order to incorporate the council's
standard GDPR and FOI clauses and to ensure the contract does not place any onerous or
unnecessary restrictions on the supplier. The council will set out its 'red lines' and
negotiables for the Term Service contract during the tender, however final terms will be
agreed once the final design configuration has been agreed and the implementation phase
has been significantly de-risked for the contract.
Proposed terms will form part of the one to one discussions held with shortlisted bidders so
the council can share its approach to risk sharing, service level agreements and key
performance indicators for the various stages of the project. These discussions are included
within the agenda to ensure the council is transparent with all bidders in respect of the
minimum service levels it requires, how service levels exceeding the council's minimums will
be incorporated into the contract, and the role and application of bonus payments and
liquidated damages within contract performance and management. This is not an opportunity
for bidders to negotiate terms or to achieve an upper hand in respect of tender evaluation,
but will provide a clear framework for bidders on which to base their offer and pricing model.
All KPIs will be managed in accordance with NEC4 terms.
Payment mechanisms
Where existing arrangements and contracts are to be utilised, pricing and payment for any
works and services will be in accordance with those arrangements.
Unless otherwise agreed, payment will be in accordance with Portsmouth City Council
standard payment terms, 30 days from date of invoice in arrears.
Where required, staged payments (including a kick-off payment) will be used to allow the
preferred bidder to purchase required materials. The council's preferred staged payment
timetable is 25% on order; 25% on delivery and satisfactory completion of an in-factory test
and a final 50% on installation and satisfactory completion of on-site testing. Where
suppliers do not require staged payments, the council's standard terms will be used.
In order to keep the preferred supplier focused on the required activities and to keep to
programme, the council proposes to offer bonus payments for the completion of key
milestone tasks.
In order to ensure performance during operation of the CAZ, the council proposes to use
liquidated damaged within the contract to ensure that unapproved downtime is kept to a
minimum.
Risk allocation
Where existing framework agreements and contracts will be utilised, established working
practices, contract and supplier management processes and established pricing
mechanisms provide significant confidence in respect of risk mitigation in delivering various
elements of the charging clean air zone and supporting measures.
The preferred procurement approach in respect of the main CAZ supplier offers significant
benefits in terms of risk mitigation, however, some key risk will remain and these must be
managed and account for.

PORTSMOUTH CITY COUNCIL
107
Key procurement risks are detailed in the risk register. Table 4-7 provides further details in
respect of risk transfer.

PORTSMOUTH CITY COUNCIL
108
Table 4-7 - Risk Transfer
Risk Allocation
Notes Council Supplier Shared
Design Risk Quality of final detailed design, on time completion
CAZ Detailed design for provided during tender. Supplier held to key milestones during configuration phase by KPIs, liquidated damages and threat of termination Cycle schemes All design and delivery risk passed to Alun Griffiths.
Construction and development risk Supply, installation and commissioning of the CAZ to cost and to programme
Use of Option A in NEC4 ECC to ensure supplier takes on all cost risk during construction. Supplier to take responsibility for all installation works. Cycle schemes All delivery and construction risk passed to Alun Griffiths who will be responsible for all traffic management and construction works. Contractor to de-risk construction phase during design.
Transition and implementation risk Commissioning and implementation of CAZ hardware and software, communication and promotion of CAZ to public
Supplier responsible for successful commissioning and implementation, underpinned by KPIs and liquidated damages linked to successful completion of key milestone tasks to programme. Council is best placed to manage continued stakeholder engagement and public perception with support from the supplier.
Availability and performance risk System downtime and risks associated with system failure leading to lack of effectiveness of system
Supplier responsible for minimising downtime of system, ensuring operational performance and ensuring continuous service improvement. Monitored via KPIs and linked to low service damages. Risk of failure to meet strategic aims of the project and comply with the Ministerial Directive remains with the council.
Operating risk Operation of scheme, achievement of NO2 compliances
Supplier responsible for scheme operation and minimising downtime as above. All risks associated with the strategic case for the CAZ and achieving NO2 compliance remain with the council.

PORTSMOUTH CITY COUNCIL
109
Variability of revenue risks Securing payment of PCNs, variability of income
As compliance increases revenue from the scheme will decrease although this should see a corresponding decrease in demand for mitigation schemes. Other air quality improvement measures will have to be funded via alternative routes.
Termination risks Termination of contract during the design configuration phase
The supplier will be held to performance of key milestone tasks in respect of programme, quality and costs during the design configuration phase. The council is able to terminate with no notice in the event of failure to meet milestones.
Technology and obsolescence risks Hardware and software failure, upgrades and improvements
The supplier will be contractually obligated to ensure upgrades and innovation and provided throughout the contract and therefore all technology risks remain with the supplier.
Control risks Lack of good governance, financial controls,
Council responsible for ensuring good contract management in accordance with NEC4 terms, good project and financial governance to ensure all invoices etc. are accurate
Residual value risks Decreasing value of hardware assets throughout their lifetime
These risks remain with the council. Expected lifespan of equipment will be taken into account during tender evaluation but in the event that any hardware needs replacing, this cost will be borne by the council.
Financing risks Securing capital funds to implement the project
All financing for the project is subject to the council's successful full business case submission. Therefore all risk resides with the council.
Legislative risks Compliance with all relevant legislation, regulation and Ministerial Directives
All legislative risks are best mitigated by the council.
Other programme risks Internal risks to the programme
The council must ensure the project is sufficiently resourced to meet the needs of the supplier and the project.

PORTSMOUTH CITY COUNCIL
110
6. Financial Case
Introduction
The Financial Case assesses the potential financial impacts to Portsmouth City Council
(PCC) of setting up, running and enforcing a Clean Air Zone (CAZ) in the City.
As discussed in the Economic Case, the results of the traffic and air quality modelling
conducted indicates that a CAZ B scheme plus additional measures (CAZ B+) is most likely
to deliver compliance with the EU limit values for air quality in the shortest possible time. The
Financial Case focuses on this option.
The CAZ B+ scheme implements charges on all class B vehicles (buses, coaches, taxis and
private hire vehicles heavy goods vehicles) that do not meet the defined emission standards.
The additional measures assessed in the preferred scheme are:
Core components (modelled)
Parking measures
Strategic cycling routes
Signal changes
Complementary measures (not modelled) - To provide certainty of meeting the EU limit
for NO2 across the city, at both exceedance and near exceedance locations. Cannot be
modelled, but will play an important role in ensuring the successful delivery of the AQ Plan:
Progressive tightening of taxi licensing rules to ensure use of lower emission vehicles
and ensure national projections regarding fleet upgrades occur in Portsmouth.
Rapid charging points at taxi ranks to enable taxi drivers to upgrade to electric vehicles.
Reduced fee / free permits for low emission vehicles.
Travel planning measures to ensure that assumptions regarding increased levels of
cycling and sustainable travel use are realised.
Targeted communications and marketing initiatives, including continuation of anti-idling
campaign, advance and real time (social and conventional media, VMS) messaging;
integrated with the above travel planning measures.
6.1.1. Purpose
The purpose of this financial case is to support the application for drawdown from the JAQU Implementation Fund. The financial case for the implementation fund grant assesses the potential affordability of the costs to PCC of setting up and operating preferred package, and the potential revenues that would be generated through the scheme’s operation. The Finance case also presents identified mitigation measures toward targeted groups impacted by the implementation of the CAZ scheme. Funding from the Clean Air Fund (CAF) is requested for these mitigations. The Financial Case is structured as follows:
Section 6.2 provides details of the implementation, operation and decommissioning costs of the Class B CAZ element of the preferred package

PORTSMOUTH CITY COUNCIL
111
Section 6.3 provides details of the implementation, operation and decommissioning cost of the additional measures element of the preferred package
Section 6.4 provides a financial appraisal of the preferred package
Section 6.5 gives an overview of PCC's current financial position
Section 6.6 provides details of the funding being sought from the Clean Air Fund
Section 6.7 provides details of the costs anticipated to develop the Final Business Case
6.1.2. Units of account
The figures presented in the Financial Case are in nominal values, unless otherwise stated.
6.1.3. Assumptions and limitations
A full tender has not been carried out and instead the costs quoted are based on initial soft market testing, information gained from previous similar schemes and other projects. Scheme revenues are calculated from traffic model outputs and ANPR data. The traffic model assumptions are taken from SRTM which is explained in the Transport Technical documents attached as a supporting document to this OBC. These costs have been reviewed by PCC while concurrently undertaking market engagement. The costs will be refined through the procurement process and detailed design development as the scheme progresses towards the Full Business Case. The sources and further details are set out in the assumptions sheet and individual costings sheets of the financial model. 6.1.4. Project Costs
The costs for introducing and maintaining the CAZ are split into two categories: implementation costs (capital costs) and operating and maintenance costs (O&M). Where available, costs were estimated using local information and local data. Some of the costs (e.g. costs of signs and ANPR cameras) were derived from per item cost estimates and a forecast of the number of assets required, based on an analysis of the estimated cordon boundary area and the required infrastructure that would likely need to be introduced. In other cases, costs were estimated on the basis of additional analysis, simplifying assumptions, professional judgement or relevant cost information from similar local schemes. Details on how each cost was estimated are summarised in the following tables and further details are set out in the Financial Model. The majority of the costs are determined by the area of the CAZ. However, some operational costs, transaction fees for example, are calculated from forecast traffic volumes. PCC can reclaim any Value Added Tax (VAT) that it incurs, therefore, all costs presented here are in factor costs (excluding VAT). 6.1.5. Treatment of risk and market engagement
Due to the current scheme design stage the cost forecasts use optimism bias (OB) levels recommended by WebTAG. As design progresses and market engagement provides increased data points, it is anticipated that there will be sufficient information to perform a quantified risk assessment (QRA). With the application of a QRA, the optimism bias will be reduced and calculated risk contingency pots will be created for drawdown. The optimism bias rates applied to implementation costs, 44% is the OB level that WebTAG recommends to apply at the Strategic Preferred Option Business Case stage. The WebTAG recommended OB levels reduce for projects at Preferred Option Business case stage. However, as a quantified risk assessment has not been performed, the SOBC

PORTSMOUTH CITY COUNCIL
112
recommended OB levels have been maintained. When increased market sounding is received, these OB levels will be reduced. The WebTAG recommended Optimism Bias for CAZ implementation projects at OBC stage (used for this POBC) of 44% is applied to ANPR camera and sign maintenance costs as the cost build up for these is based on established practices and in the case of the signs, is building off of the Portsmouth PFI agreement with Ensign Highways. This level of OB was also applied to ongoing air quality monitoring and transaction fees as there is more certainty around these assumptions. Portsmouth City Council is currently engaging the market to attain implementation and operating cost quotes. Indicative pricing for the installation and maintenance of the ANPR cameras has been derived through some soft market testing. The market sounding does indicate that the ANPR camera capex forecast is reasonable. However, the main risk elements of installation have not been accounted for in the indicative pricing supplied by the market. Accordingly, the optimism bias level for cameras installation and maintenance has not been modified. Portsmouth City Council has a current contract with Ensign Highways that includes the maintenance of signs on the PCC network, this is referred to as the Portsmouth Highways PFI contract. The PFI agreement will be expanded to include these signs and it is anticipated that with increased clarity on contract negotiations that the optimism bias associated with sign maintenance will be reduced.
Indicative costings for Class B CAZ
6.2.1. Implementation Costs of Class B CAZ
Implementation costs are the expenses required for the initial design and set-up of the CAZ. PCC will procure the civil engineering contractors and technology suppliers as set out in the Commercial Case. The implementation costs of the Class B CAZ fall into six board categories:
Staff time- This includes PCC staff (Project management, Financial, Legal, Procurement, Parking Enforcement, Highways Engineers, Traffic Engineers, IT and Customer Support) and specialist consultants to design the CAZ.
Equipment- This includes costs associated with the purchase of the ANPR cameras, signage and other equipment required for the operation of a CAZ.
Installation- This includes the costs for any minor groundworks required to install the CAZ equipment and associated traffic management.
Back-office integration- This includes the costs associated with linking into back office systems and the costs of storing and transferring data.
Decommissioning - This includes all costs to remove the scheme upon completion
Consultation - This includes all events and materials required to carry out the consultation for the CAZ

PORTSMOUTH CITY COUNCIL
113
Table 6-1- Derivation of implementation cost estimates for Class B CAZ
Cost item Description Costing Method Key Assumptions
Staff time Project Managers
Finance staff Legal staff Procurement staff Parking enforcement Highways engineers Traffic engineers I.T. staff Customer support
For all PCC staff, existing staffing bands for similar posts were used to determine the level of funding required to cover each post.
For all PCC staff posts, overheads have been included
Specialist consultants required to advise on procurement of CAZ/ Quantity Surveyors
Indicative costs were used to determine the likely cost of for specialist design consultants, based on similar schemes.
Equipment ANPR cameras and service
Guidance on the cost of ANPR cameras for similar schemes were used as a guide
The estimated number of ANPR cameras required for the CAZ were based on the number of cameras required for the ANPR survey which was carried out in the city in March 2019. The assumption has been made that an 80 camera model will be required It was assumed that two cameras would be installed onto each post
Posts for cameras Guidance was provided by relevant PCC staff on the costs for equipment, using previous schemes as a guide
It has been assumed that a separate post would be required for 50% of cameras, based on an 80 camera model.

PORTSMOUTH CITY COUNCIL
114
Signage The signage required has been assumed with reference to the guidance provided by DEFRA
Additional costs for parking team: Postage Stationary DVLA costs Traffic Penalty Tribunal Fees Link/uploads to DVLA/other databases
Experience of similar schemes was used to determine additional costs that would be required by the parking team
It has been assumed that additional costs will arise with this scheme
Installation Trenching/connecting Guidance was provided by relevant PCC staff on the costs for installation, using previous schemes as a guide
It has been assumed that 75% of pole locations will required1m of footway trenching, 20% will require 3m of footway trenching, 3% will require 3m of footway trenching and 4m of carriageway trenching, and 2% will require 3m of footway trenching and 8m of carriageway trenching
Camera attachment and maintenance
Back-office integration
Storage of data Guidance was provided by relevant PCC staff on the costs of Back-office integration, using previous schemes as a guide
Costs estimations have been provided based on current provisions.
Set up of new debt type
Decommissioning Disconnection of cameras at end of scheme
Guidance was provided by relevant PCC staff on the costs for decommissioning, using previous schemes as a guide
The assumption has been made that decommissioning will be required upon completion of the scheme
Removal of cameras upon scheme completion
Decommissioning of signage
Consultation Events The experience of the Communications and Marketing team
It has been assumed that a 12 week consultation
Material

PORTSMOUTH CITY COUNCIL
115
was used to determine the cost of consultation events and materials, based on previous consultation exercises
will be carried out for the CAZ, with a number of events being held in connection with this
The capital cost of the Class B CAZ is forecast at £ 4.39m. As these local measures will improve air quality in the CAZ, funding is sought from the DEFRA national funding for locally implemented CAZ schemes.
6.2.2. Operation and Maintenance Cost of Class B CAZ
Operating and maintenance costs are the ongoing costs required to maintain the CAZ on an annual basis. The Financial Model assumes that the income from CAZ charges and PCNs will be used to fund the operation and maintenance costs listed. The main operating costs have been identified and fall roughly into eight groups:
1. Sign maintenance – required maintenance for road signs. It has been assumed that these assets will be transferred to the PFI operator for maintenance and the costs reflect the charges for such assets under the PFI scheme.
2. ANPR camera maintenance – required maintenance for ANPR cameras. 3. IT support and maintenance – annual maintenance charge to support IT back office. 4. Monitoring and evaluation – continual monitoring if air quality sites to calibrate modelling
to assess compliance with air quality standards. 5. Staffing – salary costs of PCC staff to administer the scheme, respond to customer
enquiries, review contraventions, assess representation and appeals, and monitor AQ compliance and benefit realisation.
6. Transaction Fees – these represent the third part payment facilitation fees (i.e. credit card transaction charges).
7. Collection fees – cost of pursuing delinquent payments. 8. DVLA Database Query - Fees paid to check number plate registration data. These costs will be further refined as we progress to the Full Business Case stage but they are currently estimated to be in the region of £1.8m per annum. It is anticipated that the operation and maintenance costs of the Class B CAZ will be funded through the revenue generated through its operation (with the exception of the staffing costs not directly related to the operation and maintenance of the charging CAZ , which are anticipated to be a draw on the Implementation Fund). 6.2.3. Revenue generated from CAZ
The CAZ would result in non-compliant vehicles being issued with a daily charge for traveling into and within the zone. Traffic and air quality modelling demonstrates that compliance with legal limits for nitrogen dioxide can be achieved by the end of 2022 with charges set at £10 per day for non-compliant taxis and private hire vehicles and £50 per day for non-compliant buses, coaches and heavy goods vehicles. The daily charges are set at different levels for different vehicle types to reflect the contributions that each type of vehicles makes on a per-vehicle basis and to ensure that the vehicles with the highest emissions are incentivised to change to compliant vehicle types. It assumed that the charge level will remain constant throughout the operation of the Class B CAZ.

PORTSMOUTH CITY COUNCIL
116
The data collected from an automatic number plate recognition (ANPR) survey was used to calculate the number of non-compliant vehicles expected to travel within the CAZ each day. This number was then adjusted to take into account the likely behavioural response of non-compliant vehicle owners to the introduction of a charging CAZ based on the table below.
Response Taxis
HGVs Buses & Coaches
Replace vehicle 22% 44% 41%
Cancel trip 16% 13% 26%
Change mode 23% 0% 0%
Avoid zone 23% 13% 0%
Pay charge 16% 29% 32%
The number of non-compliant vehicles (and therefore the income generated) is expected to decrease over time due to the natural replacement of the fleet. The rate at which the fleet is expected to renew is taken from the fleet projection tool in the Emission Factor Toolkit (EFT). It is however acknowledged that not all non-compliant vehicles will pay the CAZ charge and therefore will be issued with a penalty charge notice (PCN) and required to pay a fine. Non-compliant vehicles that do not pay the daily charge will be issued a penalty charge notice (PCN) charged at £60 if paid within 14 days of £120 if paid after this. Compliance rates for paying the CAZ charge have been assumed based on data from other charging schemes (London ULEZ and Dart charge). The assumptions about the proportion of drivers then likely to pay their PCN days within 14 days has been calculated based on experience from collecting PCNs for other traffic offences in Portsmouth. The assumptions that have been applied are:
8% of non-compliant vehicle owners don't pay the CAZ charge and are issued a PCN
6.4% of non-compliant vehicle drivers pay the PCN fine
5.1% of non-compliant vehicle drivers pay the PCN fine within 14 days
1.3% of non-compliant vehicle drivers pay the PCN fine after 14 days
1.6% of drivers do not pay the PCN fine, however 10% of the PCNs issued will be recovered via legal proceedings
The intention is that any surplus CAZ charging revenues generated would be spent on directly or indirectly facilitating the achievement of local transport policies of the authority, specially measures to improve air quality and encourage use of sustainable transport modes. The exact schemes to be funded through the CAZ revenue are yet to be identified, details, including a 5 year and 10 year spending profile, will be provided within the draft charging Scheme Order which will be published for consultation in early 2020. 6.2.4. Decommissioning
It is assumed that the CAZ infrastructure will be decommissioned at the end of three-year operational period, in 2024. Decommissioning costs relate to removing scheme infrastructure and are forecast from a per item cost build up. This results in a forecast decommissioning cost of £1.61m. 1.2.5 Summary of Class B CAZ Net Financial Position

PORTSMOUTH CITY COUNCIL
117
The financial appraisal involves comparing costs and revenues to ascertain the scheme's net financial position. The annual revenues generated from the Class B CAZ compared to the public expenditure required to set up and deliver the preferred package (when considered over the whole life of the programme) leads to a net cost of £5.10M, excluding any draw on the Implementation Fund.
Indicative Costing for Additional Measures
A number additional schemes are included to complement the proposed Class B CAZ, ensuring that compliance is reached by the end of 2022. These are referred to as Additional Measures. Whilst not strictly an additional measure, there will be a requirement from some additional equipment to be installed during the implementation phase so that the effectiveness of the programme can be monitored and evaluated. The costs associated with monitoring and evaluation of the programme are included within the 'additional measures' appraisal. 6.3.1. Implementation Costs of Additional Measures
The Additional Measures included within the preferred package are as follows and will need to be funded from Implementation Fund.
A. Progressive tightening of taxi licensing rules to ensure use of lower emission vehicles and ensure national projections regarding fleet upgrades occur in Portsmouth.
B. Rapid charging points at taxi ranks to enable taxi drivers to upgrade to electric
vehicles.
C. Reduced fee / free residents parking permits for low emission vehicles.
D. Travel planning measures to ensure that assumptions regarding increased levels of cycling and sustainable travel use are realised.
E. Targeted communications and marketing initiatives, including continuation of anti-
idling campaign, advance and real time (social and conventional media, VMS) messaging; integrated with the above travel planning measures.
Table 6-3- Implementation costs of additional measures
Cost item Description Costing Method Key Assumptions
Tightening of taxi licensing
Progressive tightening of taxi licensing rules to ensure use of lower emission vehicles in the taxi fleet in Portsmouth
Costing for this measure will be for internal staff time only
Taxi/PHV operators will require support to upgrade their vehicles to meet this measures
Rapid charging at taxi ranks
Rapid charging points at taxi ranks to enable taxi drivers to upgrade to electric vehicles.
Cost guidance was taken from the previous EV charge point scheme introduced in the city in 2019
Rapid EV chargers will be required to meet the requirements of the taxi/PHV trade.

PORTSMOUTH CITY COUNCIL
118
Taxi drivers will provide input into the locations of the EV charging sites.
Reduced fee/ free residents parking permits
Reduced fee for residents parking permits within the residents parking zones in the city
Costing for this measure will be for internal staff time only
This measure will act as an incentive to encourage greater uptake of EV/low emission vehicles in the city
Travel planning measures
Travel planning measures to be introduced, building on interventions with schools and workplaces delivered through the recent Air Quality Grant Programme (2018/19) and other funding programmes to encourage sustainable travel
Costings for this measures were guided by the similar work carried out on the Air Quality Grant Programme (2018/19)
Assumed that local businesses and schools will be willing to engage with the travel planning measure
Targeted communication and marketing
To include continuation of anti-idling campaign, advance and real time messaging. To be integrated with travel planning measures
The experience of the Communications and Marketing team was used to determine the cost of consultation events and materials, based on previous consultation exercises
This campaign and associated measures will support the delivery of the other measures
Monitoring and evaluation equipment: Automatic traffic counters
Monitoring and evaluation equipment to be introduced to monitor the CAZ and impact on wider network
Costs of similar products were used to guide the cost estimates for this equipment
Increased level of monitoring and evaluation equipment will be required to monitor NO2 measures as a result of the CAZ and supporting measures
Introduction of automatic traffic counters to assist in monitoring traffic flows - required for monitoring and evaluation
Costs of similar products were used to guide the cost estimates for this equipment
Automatic traffic counters will be required to help monitor the effects of the CAZ
Network of ANPR cameras to monitor
Guidance on costs were taken from the
That a wider network of ANPR

PORTSMOUTH CITY COUNCIL
119
ANPR cameras traffic behaviour following installation of CAZ - required for monitoring and evaluation
ANPR survey carried out in the city in March 2019
cameras will be required to fully monitor the operation of the CAZ
In order to ensure that maximum benefit is gained from the delivery of the additional measures it is proposed that the measures should be delivered within the 'implementation year', rather than in year 1 of the operation of the CAZ. This will help to ensure that the benefits associated with the measures are realised as early as possible within the programme and to help secure compliance with the legal limits for nitrogen dioxide in the shortest possible time. The capital cost of the additional measures is forecast at £10.57m. As these local measures will improve air quality in the CAZ, funding is sought from the Implementation Fund.
6.3.2. Operation Costs of Additional Measures
Whilst a large proportion of the costs associated with delivering the additional measures will occur within the implementation year, there will be a number of ongoing costs associated with the nature of the additional measures being focused around revenue costs. However, unlike the Class B CAZ, the operation of the additional measures is not revenue generating and therefore the ongoing operation and delivery costs should be funded through the Implementation Fund. 6.3.3. Decommission Costs of Additional Measures
Unlike the Class B CAZ there is no need to remove infrastructure at the end of the operation
period for the additional measures. However, to ensure that the benefits of the preferred
package are realised and recorded beyond the operational phase of the preferred package it
is proposed that funding is secured to keep a handful of staff in post beyond the operational
phase of the programme to ensure the delivery of the additional measures is complete and
benefits realisation through to the decommission stage is achieved.
Therefore the costs associated with the additional measures in the decommission year result in a cost of £0.20m.
Financial Appraisal of the Preferred Package
6.4.1. Preferred Package Financial Profile
The financial profile in table 6-6 shows that the majority of costs will arise in the implementation year. Once the Class B CAZ is operational these costs are mostly recovered through the income generated through CAZ charges and PCNs, however this income decreases over time as user compliance increases and the number of non-compliant vehicles entering the zone decreases. Part of the Operation and Maintenance costs relate to the staffing costs not directly related to the operation and maintenance of the charging CAZ, i.e. the staff to deliver non-charging measures, which are proposed to be a draw on the Implementation Fund. After incorporating the proposed draw on the Implementation Fund, revenues exceed costs by the end of the forecast period, resulting in net positive cash flow of £2.19m. As previously stated, it is proposed that any surplus CAZ charging revenues generated would be spent to facilitate the achievement of local transport policies including measures to improve air quality and encourage use of sustainable transport modes.

PORTSMOUTH CITY COUNCIL
120
Table 6-6- Financial Profile of the Preferred Package
£m's
Implem. Year 1 Year 2 Year 3 Decom. Total
Capex (4.39) - - - - (4.39)
Operation & Maintenance - (1.78) (1.81) (1.86) - (5.46)
Decommissioning - - - - (1.61) (1.61)
CAZ revenue - 3.15 1.70 0.67 - 5.52
PCN revenue - 0.46 0.26 0.11 - 0.84
Additional Measures (10.57) (0.47) (0.48) (0.48) (0.20) (12.20)
Implementation Fund 14.96 0.90 0.90 0.92 1.81 19.50
Net cash flow 0.00 2.26 0.57 (0.64) 0.00 2.19
6.4.2. Total Financial Costs to be funded through the Implementation Fund
The total financial cost for Class CAZ B over the period 2020-2024 is estimated to be
£19.50m. This covers the costs from Full Business Case (FBC) stage to include delivery,
implementation and decommissioning at the end of the scheme once compliance has been
achieved and maintained.
6.4.3. Sensitivity Testing
Sensitivity tests have been applied to the financial appraisal to understand the impact of any
changes to the assumptions applied to the appraisal.
Table 6-7- Summary of sensitivity tests applied to the preferred package financial appraisal
Sensitivity area Sensitivity test applied Impact
A.Daily charge Daily charge lowered to £5 and £25.
Reduced to a net negative cash flow of £0.57m.
B.Implementation cost Increase in costs of 88% compared to the optimism bias of 44%.
Net positive cash flow reduced to £0.92m.
C.Revenue Reduction of non-compliant vehicles increases by an additional 5% each year.
Net positive cash flow reduced to £1.25m.
D.Implementation cost and Revenue
A combination of B. and C. above. Reduced to a net negative cash flow of £0.02m.

PORTSMOUTH CITY COUNCIL
121
The sensitivity tests indicate that a 50% reduction in the daily charge has the biggest impact
on the forecast net cash flow of the preferred package, such that there would be a net
negative cash flow of £0.57m. This supports the need for charges at the level that are being
considered.
The sensitivity tests on both the implementation costs and the revenue from non-compliant
vehicles, when applied individually, show that a net positive cash flow would be retained,
although at a reduced level. However, the combination of increased costs and reduced
levels of non-compliant vehicles, as defined in the final test, would result in a net negative
cash flow.
Current financial situation
The 'Portsmouth City Council - Budget & Council Tax 2019/20 & Medium Term Budget
Forecast 2020/21 to 2022/23' report to Full Council on 12th February 2019 included the
following statement from the Director of Finance (S151 Officer):
The proposed Budget for 2019/20 is financially balanced, robustly based and provides sufficient cover for anticipated and potential financial risks within the year. Furthermore, the overall financial health of the Council currently remains sound providing a good degree of resilience against an uncertain future.
Costs to develop the Final Business Case
Additional funding will be required to refine the preferred package and develop the FBC, taking into account feedback on the OBC from JAQU and details arising from the planned public consultation. These costs are not accounted for in the financial model and will include internal staff costs and consultants' fees to support the technical work informing the FBC and any additional modelling required.

PORTSMOUTH CITY COUNCIL
122
7. Management Case
Introduction
This management case sets out the framework that PCC will use to deliver the preferred
package of measures to achieve compliance with legal limits for nitrogen dioxide. In line with
JAQU guidance, the management case builds on the SOC by making recommendations
about the optimal solutions to the following issues:
Governance structure, including key management roles, responsibilities and assurance
procedures (section 7.2)
Programme and project management processes, including issue and risk management
(section 7.3)
Deliverability and implementation of the preferred package (section 7.4)
Benefits realisation (section 7.5) and associated evaluation and monitoring processes
(section 7.6)
Identification and management of stakeholders, including the approach to engagement
and communications (section 7.7)
Governance
Portsmouth City Council is a unitary authority with responsibilities including highways,
planning, public health and environmental monitoring and ownership of Portsmouth
International Port. Representatives from these departments together form an Air Quality
Board who work closely to address the air quality issues in the city.
In delivering the preferred package of measures the programme will continue to be managed
in accordance with PRINCE2 and Managing Successful Programmes principles. The
governance structure outlined below has been in place throughout the development of the
Air Quality Plan to date and will continue to be used for development of the FBC and delivery
of the programme.

PORTSMOUTH CITY COUNCIL
123
Figure 7-2- Governance structure for the programme
As highlighted in the organogram above, a number of key roles for delivery of the
programme have been identified, and their key responsibilities are set out below:
Senior Responsible Owner (SRO) - The SRO has overall responsibility for ensuring the
AQLP meets its objective to achieve compliance in the shortest possible time, and delivers
the projected benefits within the time and cost parameters set out in this business case. As
has been the case throughout the development of the preferred package, the SRO will
continue to be PCC's Assistant Director of Transport.
Air Quality Board- The board will continue to guide the direction of the project, overseeing
the delivery of the preferred package of measures. It will continue to consist of Directors and
Senior Officers from across Portsmouth City Council and will:
Oversee the delivery of compliance with the National Air Quality objectives as required
by law, in the shortest possible timeframe;
Review and approve the Project Initiation Documents;
Receive Highlight Reports from the Project Managers;

PORTSMOUTH CITY COUNCIL
124
Review and approve any issues, risks and additional requirements escalated by the
Project Managers and Programme Manager;
Communicate information about the programme/projects to other senior officers and
members and liaise with the Programme Manager regarding any feedback;
Foster collaborative working and sharing of information, integrating air quality into all
Portsmouth City Council decision making and relevant plans and strategies;
Ensure that the objectives of the programme are met;
Ensure that the programme is undertaken within the agreed scope;
On completion, review and approve the programme Close-out Report.
Cabinet- Portsmouth City Council's Cabinet will formally approve the proposals in the OBC
and will also do the same for the FBC. Between formal Cabinet meetings this group will
continue to receive regular updates on the progress of the programme.
Air Quality Steering Group- This group is already established and is attended by
representatives from local business and interest groups. Whilst this group does not have a
decision making role they have been an essential part in guiding the development of
measures to date and their continued support will be invaluable for promoting and garnering
public support for the preferred package.
Cross-Party Working Group- Again, this is not a decision making body, however the
meetings of this working group have ensured that all Councillors have had an opportunity to
keep up to date with the development of the Air Quality Local Plan and to feed their ideas
into the options development process. After OBC submission the meeting of this group will
be essential for garnering public support and guiding the delivery of measures.
Air Quality Lead- The Air Quality Lead will act as the Programme Manager and be
responsible for the day to day management of the programme on behalf of the Air Quality
Board and will have oversight of all air quality projects.
Programme Management Office (PMO) -The Programme Management Office will be
responsible for ensuring the objectives of the programme are met and the projects are
undertaken within the agreed scope.
Project Managers- The Project Managers will be responsible for delivery, day to day
management of individual projects and liaising with the PMO.
Project Teams- Each individual project will have a team which will include officers
specifically dedicated to the projects, as well as specialist officers from across the Council
and technical consultants who will assist in the delivery.
The structure of the programme team is detailed in the organogram shown below:

PORTSMOUTH CITY COUNCIL
125
Figure 7-3- Organogram of the programme team structure
7.2.1. Assurance
Assurance is critical to the successful delivery of any programme and part of the overall risk
management approach. The assurance procedures put in place are intended to provide
confidence to stakeholders that the programme will deliver its objectives and realise the
identified benefits.
The APM '3 lines of defence' assurance model will be used to provide robust assurance, and
this will be the responsibility of the Programme Manager and the Programme Management
Office (PMO) to ensure that this model is being followed. The model will be applied to the
programme as follows:
First line of defence: Individual project managers will have operational ownership and
accountability for directly assessing, controlling and mitigating risks. As is outlined in the
Commercial Case, the use of existing framework agreements and contracts will help with
risk allocation and will be an important part in this first line of defence.
Second line of defence: Risk from the individual projects will be reported to the PMO and
Programme Manager for review by the Air Quality Board on a monthly basis. This will
facilitate the monitoring and appropriate escalation of risks. Reports will also be regularly
taken to relevant Council Committees and the Cross-party working group and the Steering
Group. This will to add to the second line of defence by ensuring oversight by stakeholders
and encouraging scrutiny of the programme.

PORTSMOUTH CITY COUNCIL
126
Third line of defence: PCC's internal audit function will provide this line of defence as they
will provide assurance to the Chief Executive and Elected Members. Whilst the internal audit
function is a part of the organisation they provide an independent service taking into account
all elements of the Council's risk management framework.
Figure 7-4- Application of the three lines of defence model
As well as the approach taken in the 3 lines of defence model, additional assurance will be
provided in the form of regular reviews of the progress and financial state of the programme
by JAQU through the quarterly monitoring reports. The role of JAQU's Independent Review
Panel will also play an important role in assuring the quality of the technical work provided to
support the development of the preferred package of measures for the Final Business Case.

PORTSMOUTH CITY COUNCIL
127
Programme and project management processes
The preferred package will be delivered in accordance with PRINCE2 and Managing Successful Programmes methodologies, with clearly identified roles and responsibilities as set out in the previous sections. The project management processes will require the project managers to provide weekly financial and progress reports to the PMO. Any issues highlighted (e.g. overspend or underspend, timescale slippages etc.) will be escalated to the Air Quality Lead, or SRO if necessary, who will seek approval of the Air Quality Board for any changes or decisions required. The Air Quality Board will meet monthly, and the Project Managers will each present a Highlight Report at each of the meetings. This will provide an overview of progress on the projects and be used as a tool to formally record any issues and risks to delivery of the programme and progress towards realisation of benefits. The Monitoring and Evaluation Officer will complete the delivery and budget tracker document in conjunction with the Air Quality Lead on a quarterly basis and return this to JAQU. The reporting cycle for the programme is focused around the monthly Air Quality Board meetings as this is where the decision making process will take place to reflect on progress and report on the previously agreed changes. The frequency of these meetings will ensure that any risks to delivery can be identified and raised in a timely manner, and potentially addressed in between each of the quarterly monitoring reports being issued to JAQU.

PORTSMOUTH CITY COUNCIL
128
Table 7-4- Reporting cycle for the programme
Event Frequency Lead-in
Time
Comments Line of Reporting
Air
Quality
Board
Monthly 1 week for
papers
To take place
during 3rd week of
the month.
- Updates from Air Quality
Lead
- Actions to Project Teams
- Sign-off Delivery & Budget
Tracker
- Updates to Cabinet
- Decisions on minor changes
Delivery
& Budget
Tracker
Quarterly 1 week for
papers
To be submitted
at during the last
week of the
relevant month.
Draft report to be
taken to the AQB
the week prior to
submission for
sign-off.
- Updates from Monitoring &
Evaluation Officer and Air
Quality Lead (after sign off
from Air Quality Board)
Cabinet 6 weekly 10 days
for
publication
of final
papers
15 days
for draft
paper for
briefing
meeting
Updates from
AQB to be taken
to Cabinet on a
regular basis
(suitable
timescale to be
agreed with the
Cabinet Members
for Transport and
for Environment)
- Updates from Air Quality
Board (SRO)
- Actions to Air Quality Board
- Decisions on significant
changes
Gateway
Board
Key
Milestones
1 week for
papers
To attend
Gateway Board
for approval of
procurement
activity at outlines
business case,
procurement
strategy and final
recommendations
stages.
- Updates from Project Teams
- Decisions on procurement
- Updates to Air Quality Board
SRO &
Air
Quality
Lead
Catch-up
Weekly N/A To discuss
progress, risks
and challenges
- Updates from Air Quality
Lead to SRO
- Actions both ways
- Decisions on day to day
operation/ activity
- Updates to Air Quality Board
PORTSMOUTH CITY COUNCIL
129
PCCs Cabinet meetings occur roughly every 6 weeks, however this can vary. Updates on the progress of the programme will be taken from the Board to Cabinet on a regular basis and any significant changes to the programme will be taken to the Cabinet for approval, as outlined in the change management plan in section 1.3.1 below. As well as reporting to the Air Quality Board and to Cabinet, the project managers will also need to take reports and seek approval from the PCC's internal Gateway Board. This Board is comprised of Senior Procurement Managers, Legal Advisors and Senior Peer Reviewers. They will be reviewing the procurement activities of the projects to ensure that all elements are robust and legal. The plan below provides a summary of the reporting cycles that this programme will subject to. Details of the timings of the individual meetings are contained within the programme plan attached at appendix C to this document.
7.3.1. Change Management
Change is an inevitable part of any project or programme, therefore it is crucial that any
changes that arise are managed effectively. To do this there must be an assessment of the
likely impact of the change and the possible benefits associated with this. A change
management process will be followed which will:
Identify and capture potential changes to the programme or the individual projects;
Assess the impact of any potential change and identify mitigations;
Manage the potential change through the approvals process;
Assure the change is properly implemented
The elements outlined above will be captured in the change management form, attached at appendix C. Once completed this form will be circulated to the Project Team for assessment and comment and the Programme Co-ordinator will collate the responses. The proposal will then be discussed with the Programme Manager and relevant Project Managers before being signed off by the SRO. Once a change is approved the Change Notification Form (attached at appendix C) will be circulated to the Project Team. 7.3.2. Issue Management
Issues can be defined as problems that occur immediately and can either have a positive or negative effect on the chances of the programme reaching its objectives. Issues include things such as:
Difficulty in completing work/ a task that is already on the project/ programme plan;
The discovery that work/ a task necessary for the success of the programme was not identified or scheduled into the work plan.
The identification of such issues will require a response from the programme manager so that risks to delivery can be minimised. Any issues raised should be logged in the issues management log (see appendix C for a template of this log), with a mitigation owner and timescale for addressing the issue identified.
7.3.3. Risk management
The process of identifying, assessing, responding to, monitoring, controlling and reporting risks is summarised in this section. It outlines how risk management activities will be

PORTSMOUTH CITY COUNCIL
130
performed, recorded and monitored throughout the local plan development and sets out proposed risk management structure, within the existing governance illustrated above. Risk identification is the responsibility of everyone working on the programme. The project managers will be responsible for identifying impact and interdependencies of risks to their individual projects and for reporting risks to the Air Quality Board. All risks will be logged onto a project register. Key risks will be allocated an owner. The risk owner will be responsible for assessing, in more detail, the range of possible outcomes, defining the level of risk, contingency planning, monitoring, controlling and updating the status of the risk throughout the local plan development. Key risks will be reported up to the Air Quality Lead and SRO. New or updated risks across the range of projects being delivered will be discussed and challenged by the PMO before reporting issues and exceptions to the Air Quality Board. The programme risk register can be found at appendix C to this report. 7.3.4. Closure and hand-over
At the end of the programme it is important to review the performance and close the projects
before the team are reassigned. A key element of this will be the post-programme review
which will look back across the programme to consider any lessons learned, including areas
that could be improved upon and any best practice that can be shared with other parts of the
organisation or with other Local Authorities delivering air quality improvements.
The closure and hand-over process will refer to the progress reported through the monitoring
and evaluation and benefits realisation processes, as set out in sections 6.6 and 6.5
respectively. The closure process will result in production of a programme close-out report
which will be taken to the Air Quality Board, Cross Party Working Group and Air Quality
Steering Group as a means of gaining stakeholder acceptance of what the programme has
delivered.
Delivery and Implementation
An indicative programme plan is provided in Appendix C, demonstrating how the programme
is envisaged to progress following submission of the Outline Business Case through to
submission of the Full Business Case. At this stage the programme plan only provides a
high level overview of the key milestones, however detailed project plans will be developed
ahead of the submission of the FBC.
7.4.1. Deliverability
As outlined in section 2.5.2 of this OBC one of the secondary objectives for the preferred
package was that it should be deliverable in terms of supply side capacity and capability.
The deliverability of each element of the preferred package with regards to this objective is
addressed in details in section 3.6.4 of the Economic Case. The real-world deliverability of
the preferred package will be measured and reported on following the processes set out in
the monitoring and evaluation and benefits realisation plans.
In order to help bring forward the realisation of benefits it is proposed that the travel planning
measures and targeted communication and marketing activities (the roles shown in the
'Behaviour Change and non-charging measures project team) could start to be delivered
prior to submission of the FBC.

PORTSMOUTH CITY COUNCIL
131
These elements of the preferred package do not require lengthy procurement activity in
order for them to take place, only the recruitment of staff to establish the team. By bringing
forward the delivery of these measures this would allow more time to ensure that all
businesses and individuals are aware of the introduction of the charging CAZ and would
therefore increase the likelihood of vehicles being switched to compliant types before the
charging CAZ is operational as they would have more time to plan for the cost of
replacement. In turn this will help to achieve the primary objective of achieving compliance in
the shortest possible time. The delivery of these elements as early delivery measures will be
dependent on JAQU releasing the funding for these posts prior to submission of the FBC.
The review of the taxi licensing requirements can also be delivered as an early measure as
this will fall under business as usual work. It is proposed that a report is taken to the
Licensing Committee in January 2020 to propose the changes to licensing policy, thus
ensuring that the changes come into effect well ahead of the introduction of the charging
CAZ. Starting work on this policy change ahead of submission of the FBC will ensure that
the renewal of the taxi and private hire fleet assumed within the Emissions Factor Toolkit will
actually occur in practice. Delivery of this element as an early delivery measure is not reliant
on release of funding from JAQU.
Another element of the preferred package that would benefit from early delivery is the
improvements to strategic cycle routes. The programme plan shows the recruitment of the
staff to deliver this project beginning in April 2020, prior to submission of the FBC, so that
work on the design of the cycle routes can begin as early as possible. Work to begin
procuring the engineering contractor is not planned to begin until after the FBC is submitted.
This approach allows plenty of time for contingency to ensure that the works to install the
cycle routes is completed before the charging CAZ becomes operational, reducing the risk to
the programme in terms of stakeholder support. However, starting early on the design work
is dependent on JAQU releasing funding ahead of the FBC submission so that recruitment of
staff can begin.
7.4.2. Experience of Delivering Successful Projects and Programmes
PCC's track record in delivering large scale capital projects and programmes as well as
smaller scale revenue schemes provides the Council with valuable experience which can be
drawn upon for delivery of this programme. Below are some examples of the projects and
programmes that PCC has delivered, either alone or with partner organisations.

PORTSMOUTH CITY COUNCIL
132
Table 7-1- Examples of PCC's experience in delivering large projects and programmes
Project / programme
Description Key successes
Tipner Interchange and Park & Ride scheme
The Tipner Interchange scheme provides a motorway junction on the M275, bus lane and Park and Ride site which will enable a major mixed use development to be built in Portsmouth as well as delivering improved public transport links into the City Centre. The scheme included: - A new grade separated motorway
junction on the M275 at Tipner to provide direct access to the development site
- A high quality Park and Ride facility, which will be served by 6 buses per hour
- Creation of an additional southbound lane for buses on the M275 from the new interchange to the end of the motorway at the Rudmore roundabout
- Bus priority measures, including partial signalisation of the Rudmore Roundabout where it ends
- Good partnership working - Motorway remained open throughout
construction - Delivered to timescale - Surface water run-off is captured by
a sustainable SUDS drainage system paired with permavoid separation tanks. A green roof complemented the SUDS solution
- Winner of ICE South East Engineering Excellence Award 2014 for Project Management
- Colas scored an ‘Excellent’ in the Considerate Constructors Scheme award for the project
- On demand on-site recovery service, saved £400,000
- Minimised noise pollution using vibration monitor in the vicinity.
The Hard Interchange
The transport interchange at The Hard in Portsmouth, has created a new transport hub. It is the first step in a vision to regenerate the area around The Hard which is located between the world-famous Historic Dockyard and Gunwharf Quays. It sets the benchmark for the area and the tone for an impressive new gateway to Portsmouth. Services offered to the public in the new building include: - First Travel Centre for bus and
National Express information and tickets
- Visitor Information, including Waterfront Gifts
- Toilets - Refreshments - Seating areas
The 10 bays all have real-time information screens to show arrival times and are used by First Bus, Stagecoach, National Express, Megabus and Park & Ride. The project was carried out by contractors Osborne and local firms were subcontracted. It was funded by the Solent Local Enterprise Partnership and Portsmouth City Council.
The interchange remained open throughout the construction phase and customers had access to all forms of transport throughout. The building has won several awards, including: - Portsmouth Society - Best New
Building - ICE South East England
Engineering Excellence Awards 2017 - Greatest Contribution to South East England
- ICE South East England Engineering Excellence Awards 2017 - South Award for Engineering Excellence Winner
- Runner up at the SPACE awards
Dunsbury Hill Park link road
A £10M construction project that enabled the wider development of the Dunsbury Hill Business Park.
Since the road was completed, the business park has progressed, with tenants now occupying a number of the business units.

PORTSMOUTH CITY COUNCIL
133
Local Sustainable Transport Fund (Transport for South Hampshire and Portsmouth City Council)
Programme of sustainable travel infrastructure and supporting interventions including Solent Go smart ticketing and development of the My Journey brand and communications. Delivered across identified corridors in the Solent sub-region and focusing on travel to and between the city centre, harbour area and Southsea in Portsmouth.
Reduction of car traffic of two to three percentage points on corridors where LSTF measures have been concentrated, compared to those that have not. Reduction in commuting by car (as the car driver) of between 4-10% in those organisations that have invested in workplace travel planning initiatives. Since 2011/12, there has been a 7% increase in the number of rail trips and a 3% increase in the number of bus trips in South Hampshire. In areas where the programme has been implemented car driving has reduced by an average of ten percentage points compared to those areas where it has not been fully implemented.
Northern Road Bridge
In 2012 Portsmouth City Council obtained £11m of DfT funding to enable the rebuild of the bridge to maintain vital traffic and bus link between Portsea Island and mainland Portsmouth The existing structure was demolished and a subsequent like for like replacement. A side project of a One Way System in Cosham town centre has been established to enable improved traffic flow during the bridge closure period.
The scheme was completed on time and under budget. Minimum disruption was caused during the works period, due to the bridge being demolished in two phases. This enabled two operational lanes to be maintained for the majority of the scheme and a restricted use single lane for just 18 weeks. - The scheme was awarded the ICE
Southern / SE Technical Expertise & Innovation award.
Benefits Realisation Plan
Benefits realisation is a key strand of the implementation, operation and management of the
programme. All benefits must be tracked efficiently so that mitigation measures can be
enacted promptly should the preferred plan of action be shown as ineffective. Therefore, this
Benefits Realisation Plan (BRP) should be read alongside the Monitoring and Evaluation
Plan which can be found in section 6.6 below.
The BRP provides an overview of the benefits expected to be delivered through the
programme, how and when they will be realised, how they will be monitored and reported on
and who has responsibility for realising the benefits.
7.5.1. Identifying Benefits
This BRP will discuss both benefits and dis-benefits that are likely to arise from the
programme. Benefits are considered to be measureable improvements resulting from an
outcome that are perceived as an advantage, whilst dis-benefits are considered to be the
adverse to this. Benefits and dis-benefits have been identified at all stages throughout each
of the projects from implementation through to decommissioning and project closure. Table
7-7 below summarises the benefits and dis-benefits that have been identified for this
programme.

PORTSMOUTH CITY COUNCIL
134
Table 7-7 Benefits statement
Benefit Expected benefit outcome
Benefit Type
Where will the benefit occur?
Who will be affected?
Reduction in concentration of nitrogen dioxide emissions
Reduction in hospital admissions for asthma, COPD and pulmonary cardiac diseases
Public Health
Likely to be focused around the CAZ
All residents, but particularly vulnerable groups such as the elderly, the very young and those with pre-existing conditions
Promotion and optimisation of public transport use and walking and cycling infrastructure.
Increase in rates of walking and cycling and a reduction of injury accidents
Public Health
Likely to be focused around corridors with cycleway interventions
All residents who walk or cycle.
Delivery of longer term environmental benefits, and for Portsmouth to become an exemplar city.
Continued reduction in hospital admissions beyond the decommissioning of the project
Public Health
Likely to be focused around the CAZ
All residents, but particularly vulnerable groups such as the elderly, the very young and those with pre-existing conditions
Enhanced understanding of successful measures for achieving air quality improvements, for longer term use in Portsmouth and elsewhere.
Cost savings for delivery of future projects as able to draw on lessons learned
Financial and operational
Citywide and other local authority areas
PCC Officers and other local authorities
Reduction in use of polluting vehicles
Reduction in concentrations of nitrogen dioxide emissions
Primary Objective
Likely to be focused around the CAZ
All residents, visitors and businesses in Portsmouth
Dis-Benefit Expected dis-benefit outcome
Dis-benefit Type
Where will the dis-benefit occur?
Who will be affected?
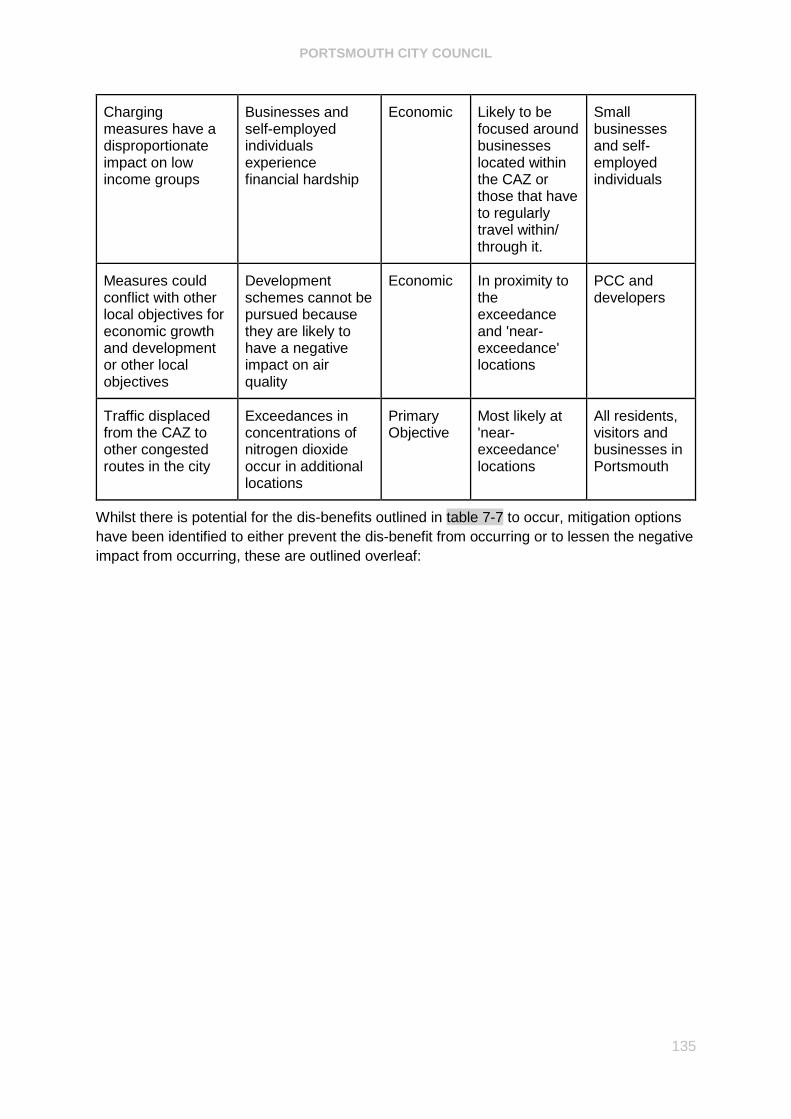
PORTSMOUTH CITY COUNCIL
135
Charging measures have a disproportionate impact on low income groups
Businesses and self-employed individuals experience financial hardship
Economic Likely to be focused around businesses located within the CAZ or those that have to regularly travel within/ through it.
Small businesses and self-employed individuals
Measures could conflict with other local objectives for economic growth and development or other local objectives
Development schemes cannot be pursued because they are likely to have a negative impact on air quality
Economic In proximity to the exceedance and 'near-exceedance' locations
PCC and developers
Traffic displaced from the CAZ to other congested routes in the city
Exceedances in concentrations of nitrogen dioxide occur in additional locations
Primary Objective
Most likely at 'near-exceedance' locations
All residents, visitors and businesses in Portsmouth
Whilst there is potential for the dis-benefits outlined in table 7-7 to occur, mitigation options
have been identified to either prevent the dis-benefit from occurring or to lessen the negative
impact from occurring, these are outlined overleaf:
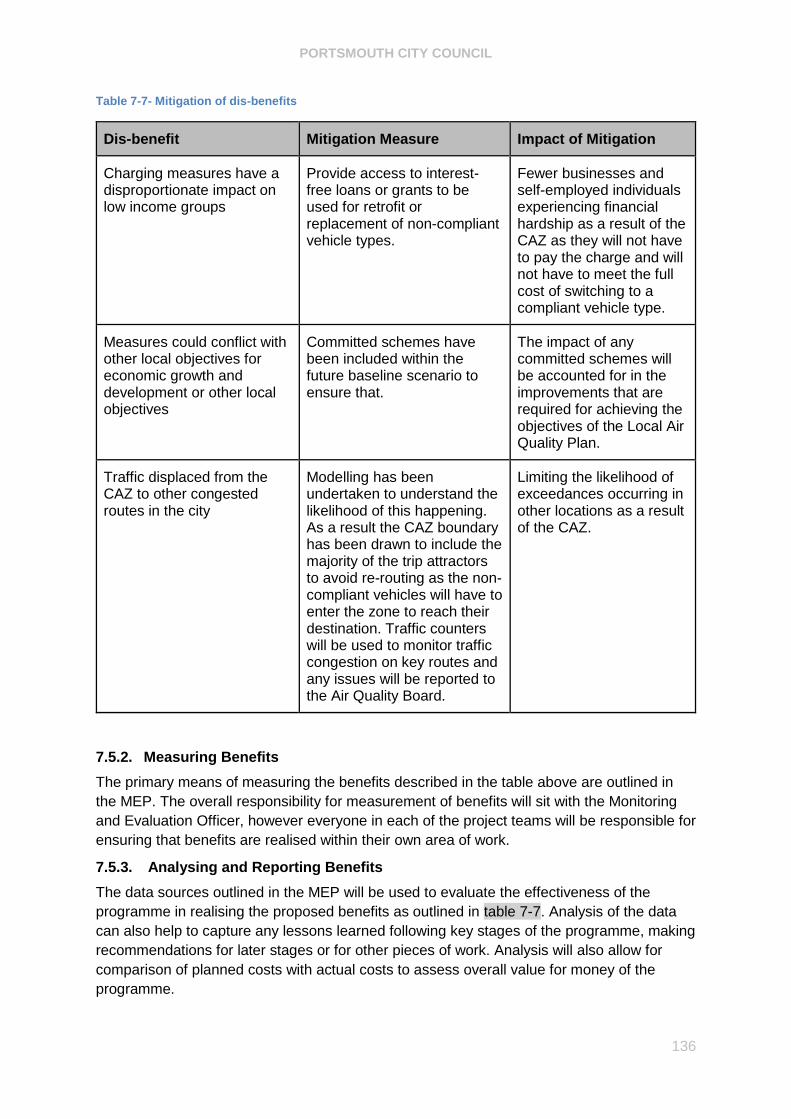
PORTSMOUTH CITY COUNCIL
136
Table 7-7- Mitigation of dis-benefits
Dis-benefit Mitigation Measure Impact of Mitigation
Charging measures have a disproportionate impact on low income groups
Provide access to interest-free loans or grants to be used for retrofit or replacement of non-compliant vehicle types.
Fewer businesses and self-employed individuals experiencing financial hardship as a result of the CAZ as they will not have to pay the charge and will not have to meet the full cost of switching to a compliant vehicle type.
Measures could conflict with other local objectives for economic growth and development or other local objectives
Committed schemes have been included within the future baseline scenario to ensure that.
The impact of any committed schemes will be accounted for in the improvements that are required for achieving the objectives of the Local Air Quality Plan.
Traffic displaced from the CAZ to other congested routes in the city
Modelling has been undertaken to understand the likelihood of this happening. As a result the CAZ boundary has been drawn to include the majority of the trip attractors to avoid re-routing as the non-compliant vehicles will have to enter the zone to reach their destination. Traffic counters will be used to monitor traffic congestion on key routes and any issues will be reported to the Air Quality Board.
Limiting the likelihood of exceedances occurring in other locations as a result of the CAZ.
7.5.2. Measuring Benefits
The primary means of measuring the benefits described in the table above are outlined in
the MEP. The overall responsibility for measurement of benefits will sit with the Monitoring
and Evaluation Officer, however everyone in each of the project teams will be responsible for
ensuring that benefits are realised within their own area of work.
7.5.3. Analysing and Reporting Benefits
The data sources outlined in the MEP will be used to evaluate the effectiveness of the
programme in realising the proposed benefits as outlined in table 7-7. Analysis of the data
can also help to capture any lessons learned following key stages of the programme, making
recommendations for later stages or for other pieces of work. Analysis will also allow for
comparison of planned costs with actual costs to assess overall value for money of the
programme.

PORTSMOUTH CITY COUNCIL
137
7.5.4. Roles and Responsibilities
Whilst the Monitoring and Evaluation Officer will be responsible for measuring and reporting
on progress toward achieving the programme outcomes and objectives, it is the Senior
Responsible Owner (SRO) who will be ultimately accountable for the realisation of benefits
across the programme. The Project Managers and PMO will support the SRO in the
realisation of benefits through ensuring that this BRP is regularly updated and reported on to
the Air Quality Board, Cabinet and to JAQU.
7.5.5. Tracking Benefits Realisation
In order to effectively manage and realise individual benefits, individual benefit profiles have
been developed which will be regularly reviewed and updated throughout all stages of the
projects. Each of the profiles will be formally reviewed at the following milestones:
At submission of FBC (establishing the baseline)
During implementation (assessing any early benefits realisation)
Post-implementation (assessing after one year of operation)
Post-implementation (assessing after three years of operation)
During decommissioning (benefits realisation)
Post- operation (one year after project closure for lasting benefits)
Post-operation (three years after project closure for lasting benefits)
These benefit profile reviews will be accompanied by the production of a post project review
report which will be taken to the Air Quality Board and shared with JAQU one year after the
CAZ is decommissioned. This report will provide an assessment of the overall net benefits
realised by the overall programme and each of the projects; give an assessment of the value
for money provided; and make recommendations for future air quality improvement projects
and identify areas for improvement regarding future work.
Monitoring and evaluation Plan
A comprehensive and robust Monitoring and Evaluation Plan (MEP) has been developed to
set out how the impacts of the programme will be monitored and progress towards meeting
the objectives. The MEP is linked to the Benefits Realisation Plan (BRP) as the MEP details
how the benefits listed within the BRP will be implemented, monitored and evaluated. The
aim of carrying out such monitoring and evaluation activity is to generate evidence on the
following areas and tracking progress towards achieving the objectives of the programme
(based on DfT's Monitoring and Evaluation Framework):
Project implementation (build or commissioning)
Scheme delivery
Costs
Achievement of objectives
Impact on travel demand
Air quality impacts
Impact on the economy
Monitoring and evaluation is a fundamental aspect of understanding the impact of an intervention or policy approach and can be used to demonstrate effectiveness of the preferred approach and to inform the development of future policies and interventions.

PORTSMOUTH CITY COUNCIL
138
The Monitoring and Evaluation Plan draws on the existing extensive monitoring and evaluation programme that PCC has in place and seeks to exceed the 'do minimum' levels of monitoring that JAQU require. The additional local monitoring proposed will help to assess the impact of the objectives of the programme and to provide data on the effectiveness of the interventions proposed within the preferred package that other Local Authorities can learn from.
7.6.1. PCC and JAQU responsibilities for monitoring and evaluation
A 'Monitoring and Evaluation Note' provided by JAQU in October 2018 set out the responsibilities for local authorities and for the central evaluation team with regards to monitoring and evaluation. It is noted that: The central evaluation team will:
Aim to understand the impacts of interventions introduced through a local authority's local plan and ensure that local authorities are on track to reduce NO2
concentrations in the shortest possible time;
Utilise existing local and national monitoring;
Produce quarterly bulletins on the progress of local plans on reducing NO2 concentrations and other key factors.
Portsmouth City Council will:
Maintain the current monitoring sites (on NO2 concentrations or traffic flows) for the length of the evaluation;
Monitor the air quality outcomes in relevant areas but may choose to conduct further monitoring activities or evaluate the wider impact of the measures in more detail;
Seek to cover any running costs associated with local monitoring and evaluation from the revenue generated from the charging CAZ;
Share monitoring on NO2 concentrations and traffic flows with JAQU every three months and liaise with JAQU to understand any issues the report highlights;
Assist the evaluation team in their requests for additional data and discuss with JAQU the outcome of any case studies and engage on any next steps;
Assist the evaluation team in their requests for data or in their collection of new data;
Engage with the evaluation team, assisting them in identifying the impact of the local plan.
7.6.2. Principles for monitoring and evaluation
Considering the guidance set out in the 'Monitoring and Evaluation Note' the following principles have been developed to guide the proposed monitoring and evaluation activity:
The preferred methods of monitoring will be through existing data sources where possible to offer best value for money and to ensure a continuity in the use of data across PCC's strategic projects;
Any additional monitoring costs will be kept to a minimum by considering all existing data sources and sharing resources with other PCC strategic projects where possible;
Metrics should not only be sourced from traditional transport indicators, but should also take account of wider impacts of the preferred packages such as public health and economic outcomes.
7.6.3. Objectives of the Preferred Package
Portsmouth City Council's preferred package for addressing exceedances in concentrations of nitrogen is focussed on a Class B CAZ, accompanied by a number of non-charging and complementary measures. The primary objective of the preferred package is to:

PORTSMOUTH CITY COUNCIL
139
Deliver a scheme that leads to compliance with NO2 concentrations in the shortest possible time, without significantly worsening emissions elsewhere.
In addition, the package selected is intended to meet the following secondary objectives:
Deliver value for money;
Ensure that particular groups of stakeholders are not disproportionately impacted by any negative impacts associated with the proposed intervention;
Complement existing and planned wider policies for the city (i.e. promote economic growth, reduce levels of social deprivation, improve health and encourage sustainable and active travel);
Be deliverable in terms of supply side capacity and capability;
Be affordable; and
Be achievable (taking into account technical, legislative, and political and public acceptability constraints).
This monitoring and evaluation plan sets out the variables that will be observed and the data that will be collected in order to evaluate the effectiveness of the preferred package and to provide insights into its impacts. Evaluation and monitoring will provide accountability that the primary and secondary objectives, as outlined above, will be met and will also help to build an evidence base for future interventions. 7.6.4. Key Outcomes of the Preferred Package
The main outcome of the preferred package will be the reduction in concentrations of nitrogen dioxide, however there are other measurable outcomes that are linked to the specific measures being proposed. Table C-7-8 below outlines the key outcomes that are expected to be achieved with successful delivery of each of the measures that are proposed as part of the preferred package.

PORTSMOUTH CITY COUNCIL
140
Table C-7-8 Outcomes expected from successful delivery of measures
Measures Outcome
Class B CAZ Improved air quality (reduced NO2 concentrations)
Changes to parking capacity and pricing
Fewer journeys being taken through the exceedance areas; therefore a reduction in emissions
An increase in use of the Park & Ride, buses and rail to access the city centre
Delivery of two strategic cycle routes
Increase in proportion of journeys made by bicycle and a decrease in car trips made
Changes to Alfred Road traffic signals
Changes to traffic flows leading to reduced vehicle emissions at the junction
Progressive tightening of taxi licensing rules
Decreased use of non-compliant vehicles
A faster improvement in air quality than would be achieved with CAZ B alone
Rapid charging points at taxi ranks
Increased use of electric vehicles and a reduction in use of non-compliant vehicles
Reduced/ free permits for low emission vehicles
Increased use of low emission vehicles and reduced use of non-compliant vehicles
Travel planning measures Greater awareness of the issues associated with poor air quality and the sources of air pollution.
Greater proportion of trips made by low emission, active travel and sustainable modes.
Targeted communication and marketing
Greater awareness of the issues associated with poor air quality and the sources of air pollution.
Greater proportion of trips made by low emission, active travel and sustainable modes.
Awareness of support packages available to individuals and businesses to reduce negative economic impact of CAZ B.

PORTSMOUTH CITY COUNCIL
141
7.6.5. Data Collection and Reporting for Monitoring and Evaluation
In order to consider the effectiveness of the preferred package of measures it is important that a range of robust data sources are identified and plans are in place for reporting on progress towards achieving objectives. The data collected will be used to assess the ongoing success of the preferred option. Of particular importance will be the reporting of traffic flows and NO2 concentrations to demonstrate progress towards achieving the primary critical success factor. Collection of data over time will allow for temporal analysis and the identification for patterns and trends for monitoring progress. All data will be collected on a monthly basis and fed into a strategic level dashboard that will be reported to the Air Quality Board monthly and to JAQU quarterly. The dashboard will also be used to inform key stakeholders about the performance of the programme in relation to objectives and will assist with updating the benefits profiles.
Table C-7-9 Sources and approach to data collection and reporting for each measure in the preferred package
Metric Coverage
Reason for inclusion
Description Type Objective Outcome Benefit/ Dis-benefit
Class B CAZ
NO2 Concentrations
Diffusion Tubes
Tubes across the city
Deliver compliance with NO2 concentrations in the
shortest possible time without significantly
worsening emissions elsewhere
Improved air quality (reduced NO2 concentrations).
Fewer journeys being taken through the exceedance
areas.
+ Reduction in concentration of nitrogen
dioxide emissions
Traffic Flow
ANPR (from 2021)
80 cameras in CAZ Deliver compliance with
NO2 concentrations in the shortest possible time without significantly
worsening emissions elsewhere
Fewer journeys being taken through the exceedance
areas.
Increased use of electric vehicles and a reduction in
use of non-compliant vehicles
+ Reduction in concentration of nitrogen
dioxide emissions
+ Reduction in use of polluting vehicles
- Traffic displaced from the CAZ to other
congested routes in the city
Automatic traffic
counters
exceedance locations plus
'near exceedance'
locations
Changes to traffic flows leading to reduced vehicle
emissions
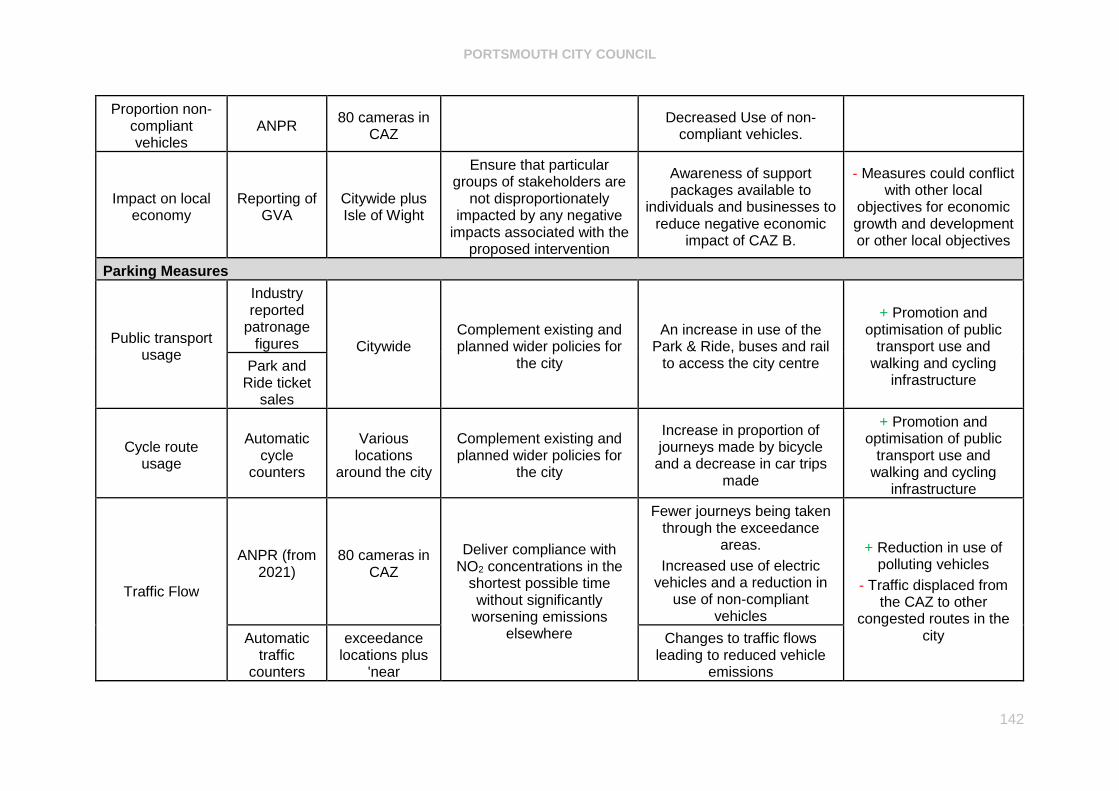
PORTSMOUTH CITY COUNCIL
142
Proportion non-compliant vehicles
ANPR 80 cameras in
CAZ Decreased Use of non-
compliant vehicles.
Impact on local economy
Reporting of GVA
Citywide plus Isle of Wight
Ensure that particular groups of stakeholders are
not disproportionately impacted by any negative
impacts associated with the proposed intervention
Awareness of support packages available to
individuals and businesses to reduce negative economic
impact of CAZ B.
- Measures could conflict with other local
objectives for economic growth and development or other local objectives
Parking Measures
Public transport usage
Industry reported
patronage figures Citywide
Complement existing and planned wider policies for
the city
An increase in use of the Park & Ride, buses and rail
to access the city centre
+ Promotion and optimisation of public
transport use and walking and cycling
infrastructure Park and
Ride ticket sales
Cycle route usage
Automatic cycle
counters
Various locations
around the city
Complement existing and planned wider policies for
the city
Increase in proportion of journeys made by bicycle and a decrease in car trips
made
+ Promotion and optimisation of public
transport use and walking and cycling
infrastructure
Traffic Flow
ANPR (from 2021)
80 cameras in CAZ
Deliver compliance with NO2 concentrations in the
shortest possible time without significantly
worsening emissions elsewhere
Fewer journeys being taken through the exceedance
areas.
Increased use of electric vehicles and a reduction in
use of non-compliant vehicles
+ Reduction in use of polluting vehicles
- Traffic displaced from the CAZ to other
congested routes in the city Automatic
traffic counters
exceedance locations plus
'near
Changes to traffic flows leading to reduced vehicle
emissions

PORTSMOUTH CITY COUNCIL
143
exceedance' locations
NO2 Concentrations
Diffusion Tubes
Tubes across the city
Deliver compliance with NO2 concentrations in the
shortest possible time without significantly
worsening emissions elsewhere
Improved air quality (reduced NO2 concentrations).
Fewer journeys being taken through the exceedance
areas.
+ Reduction in concentration of nitrogen
dioxide emissions
Strategic Cycling Routes
Cycle route usage
Automatic cycle
counters
Various locations
around the city
(see map)
Complement existing and planned wider policies for
the city
Increase in proportion of journeys made by bicycle and a decrease in car trips
made
+ Promotion and optimisation of public
transport use and walking and cycling
infrastructure
+ Delivery of longer term environmental benefits, and for Portsmouth to become an exemplar
city.
Cycling accidents
KSI data for incidents involving cyclists
Various locations
around the city
Complement existing and planned wider policies for
the city
Increase in proportion of journeys made by bicycle and a decrease in car trips
made
NO2 Concentrations
Diffusion Tubes
Tubes across the city
Deliver compliance with NO2 concentrations in the
shortest possible time without significantly
worsening emissions elsewhere
Improved air quality (reduced NO2 concentrations).
Fewer journeys being taken through the exceedance
areas.
+ Reduction in concentration of nitrogen
dioxide emissions
Alfred Road Signal Changes
NO2 Concentrations
Diffusion Tubes
Tubes across the city
Deliver compliance with NO2 concentrations in the
shortest possible time without significantly
worsening emissions elsewhere
Improved air quality (reduced NO2 concentrations).
Fewer journeys being taken through the exceedance
areas.
+ Reduction in concentration of nitrogen
dioxide emissions

PORTSMOUTH CITY COUNCIL
144
Traffic Flow ANPR (from
2021) 80 cameras in
CAZ
Deliver compliance with NO2 concentrations in the
shortest possible time without significantly
worsening emissions elsewhere
Fewer journeys being taken through the exceedance
areas.
Increased use of electric vehicles and a reduction in
use of non-compliant vehicles
+ Reduction in concentration of nitrogen
dioxide emissions
+ Reduction in concentration of nitrogen
dioxide emissions
Traffic Flow Automatic
traffic counters
exceedance locations plus
'near exceedance'
locations
(see map)
Deliver compliance with NO2 concentrations in the
shortest possible time without significantly
worsening emissions elsewhere
Changes to traffic flows leading to reduced vehicle
emissions.
+ Reduction in concentration of nitrogen
dioxide emissions
+ Reduction in concentration of nitrogen
dioxide emissions
Rapid Charging Points at Taxi Ranks
Proportion of electric taxis
(both plug-in and hybrid)
Taxi licensing
data Citywide
Complement existing and planned wider policies for
the city
Decreased use of non-compliant vehicles
A faster improvement in air quality than would be
achieved with CAZ B alone
Increased use of electric vehicles and a reduction in
use of non-compliant vehicles
+ Delivery of longer term environmental benefits, and for Portsmouth to become an exemplar
city.
NO2 Concentrations
Diffusion Tubes
Tubes across the city
Deliver compliance with NO2 concentrations in the
shortest possible time without significantly
worsening emissions elsewhere
Improved air quality (reduced NO2 concentrations).
Fewer journeys being taken through the exceedance
areas.
+ Reduction in concentration of nitrogen
dioxide emissions
Progressive Tightening of Taxi Licensing

PORTSMOUTH CITY COUNCIL
145
Proportion of non-compliant
vehicles licensed
Taxi Licensing
Data Citywide
Deliver compliance with NO2 concentrations in the
shortest possible time without significantly
worsening emissions elsewhere
Improved air quality (reduced NO2 concentrations).
Fewer journeys being taken through the exceedance
areas.
+ Reduction in concentration of nitrogen
dioxide emissions
- Charging measures have a disproportionate impact on low income
groups
+ Delivery of longer term environmental benefits, and for Portsmouth to become an exemplar
city.
Reduced Fee/ Free Permits for Low Emission Vehicles
Proportion of low emissions
vehicles in the city
New vehicles
registrations Citywide
Deliver compliance with NO2 concentrations in the
shortest possible time without significantly
worsening emissions elsewhere
Improved air quality (reduced NO2 concentrations).
Increased use of electric vehicles and a reduction in
use of non-compliant vehicles
+ Reduction in use of polluting vehicles
Low Emission Vehicle
Residents Permit exemptions
Parking Services
Data Citywide
+ Delivery of longer term environmental benefits, and for Portsmouth to become an exemplar
city.
NO2 Concentrations
Diffusion Tubes
Tubes across the city
Improved air quality (reduced NO2 concentrations).
Fewer journeys being taken through the exceedance
areas.
+ Reduction in concentration of nitrogen
dioxide emissions
Travel Planning Measures
Travel Plan Monitoring
Mode share survey with
Citywide (all schools/
Deliver compliance with NO2 concentrations in the shortest possible time
Greater awareness of the issues associated with poor
+ Promotion and optimisation of public transport use and

PORTSMOUTH CITY COUNCIL
146
school/ workplaces
workplaces engaged)
without significantly worsening emissions elsewhere.
Complement existing and planned wider policies for the city
air quality and the sources of air pollution.
Greater proportion of trips made by low emission, active travel and sustainable modes.
walking and cycling infrastructure
+ Reduction in use of polluting vehicles
NO2 Concentrations
Diffusion Tubes
Tubes across the city
Deliver compliance with NO2 concentrations in the shortest possible time without significantly worsening emissions elsewhere
Improved air quality (reduced NO2 concentrations).
Fewer journeys being taken through the exceedance areas.
+ Reduction in concentration of nitrogen dioxide emissions
Targeted Communication and Marketing
NO2 Concentrations
Diffusion Tubes
Tubes across the city
Deliver compliance with NO2 concentrations in the shortest possible time without significantly worsening emissions elsewhere
Improved air quality (reduced NO2 concentrations).
Fewer journeys being taken through the exceedance areas.
+ Reduction in concentration of nitrogen dioxide emissions
Comms and Engagement Performance
Audience reach figures
and quantitative data from
social media posts,
events and public
meetings.
Focused citywide, but potential to
monitor more widely
Deliver a scheme that leads to compliance with NO2 concentrations in the shortest possible time, without significantly worsening emissions elsewhere.
Complement existing and planned wider policies for the city
Ensure that particular groups of stakeholders are not disproportionately impacted by any negative
Greater awareness of the issues associated with poor air quality and the sources of air pollution. Greater proportion of trips made by low emission, active travel and sustainable modes.
Awareness of support packages available to individuals and businesses to reduce negative economic impact of CAZ B.
+ Reduction in concentration of nitrogen dioxide emissions
+ Promotion and optimisation of public transport use and walking and cycling infrastructure.
+ Delivery of longer term environmental benefits, and for Portsmouth to become an exemplar city.

PORTSMOUTH CITY COUNCIL
147
impacts associated with the proposed intervention
+ Enhanced understanding of successful measures for achieving air quality improvements, for longer term use in Portsmouth and elsewhere.
+ Reduction in use of polluting vehicles

PORTSMOUTH CITY COUNCIL
148
7.6.6. Data reporting cycles
A high-level summary of the data collected will be reported to the Air Quality Board on a monthly basis as part of the standard reporting procedure. This will enable the SRO and other board members (as decision makers) to have regular oversight of the effectiveness of the preferred package, providing the opportunity to identify any lack of progress or risks to achieving the primary objective at the earliest opportunity. The data will also be shared with JAQU every three months, during the implementation, operation and decommissioning of the charging CAZ scheme. This will enable the tracking of progress against a baseline position, throughout operation and beyond to demonstrate that compliance can be maintained once the charging CAZ is decommissioned. The specification for the data provided will be agreed with JAQU. As well as the data provided within the quarterly monitoring report, PCC will assist the JAQU evaluation team in their requests for additional data, and liaising with partner organisations for rapid assessment case studies and deep dive case studies. 7.6.7. Qualitative data
As well as the data outlined above, qualitative data will also be collected and analysed to gain an understanding of public perception to air pollution in the city. Furthermore, information will be collated on the response to and acceptance of the measures within PCC's preferred package. The methods for collecting and evaluating qualitative data are outlined in the Communication and Engagement plan.
7.6.8. Financial Implications of Monitoring and Evaluation
Monitoring and evaluation is an integral part of the proposed preferred package and will be essential for ensuring that the primary objective of the programme is successfully achieved. Therefore it is essential that sufficient resources are made available for the collection, analysis and reporting of the data required to monitor the implementation and delivery of the preferred package.
7.6.9. Monitoring and Evaluation Officer
This post will be an integral part of the central Programme Management Office and will be responsible for gathering all of the data outlined in table C-7-2 on a monthly basis, analysing progress and trends and feeding this into the relevant format for the audience (Air Quality Board, Councillors, Stakeholders, JAQU) as well as linking with other PCC projects. It is noted that much of the data collected is relevant to PCC's Transforming Cities Fund (TCF) bid, therefore the Monitoring and Evaluation Officer will work closely with the TCF project team to share data and avoid duplication of effort. 7.6.10. New and existing data sources
The majority of the data listed in table C-7-2 come from sources that PCC already has access to, therefore the only costs associated with using this data would be for the Monitoring and Evaluation Officer's time to gather, analyse and report the data. However, in order to tailor the data collected to this specific programme it will be necessary to install a number of new automatic traffic counters. There is already a network of automatic traffic counters in the city and on the Highways England network, however there are not any specifically placed to monitor traffic in the exceedance locations. It is therefore suggested that new automatic traffic counters are installed at the two exceedance locations and also at the six 'near exceedance' locations.

PORTSMOUTH CITY COUNCIL
149
Table C-7-10 outlines the costs for employing a Monitoring and Evaluation Officer to gather, analyse and report on data and the cost of installing and maintaining new automatic traffic counters to specifically monitor traffic at the exceedance locations. Table C-7-10 Cost for monitoring and evaluation of preferred package
Item Cost per year Total cost for life of programme
1 x FTE Monitoring & Evaluation Officer
(including all overheads)
Installation of traffic counters (for 8 sites)
Annual telecommunication and maintenance (total for all sites)
Total
(these costs have been accounted for in the financial case)
Communication and Stakeholder Engagement
7.7.1. Stakeholder Identification
Identification and management of stakeholders is important to gain support for achieving the objectives of the Local Air Quality Plan and to utilise the power and influence that stakeholders have to the programme's benefit. The identification of stakeholders is useful to inform our understanding of:
What information stakeholders need to know and what format to provide this in;
How best to take account of the needs and concerns of stakeholders
The frequency of stakeholder engagement and the clarity of messaging, timing and use of a single voice;
How to provide reactive engagement to support the programme as new issues arise. An initial stakeholder mapping exercise has been undertaken to identify the stakeholders that have been engaged in the development of the Low Air Quality Plan to date and others that we know will become more heavily involved as the programme progresses.

PORTSMOUTH CITY COUNCIL
150
Figure 7-11- Stakeholder identification and engagement matrix
For each stakeholder section there are a variety of methods of communicating. A number of groups have already been established that are essential in assisting with the development of communications as well as ensuring key stakeholders have a voice. These include:
Cross party working group with all parties invited to ensure all elected individuals are regularly updated on developments with our work to improve air quality in the city
Air Quality steering group includes key stakeholders from across the city
Air Quality Board meets monthly. This is the decision making body for our air quality Local Plan
The frequency of engagement with stakeholders will depend on the level of influence and interest
as well as the journey that the stakeholder needs to be taken on, to hopefully get them to where we
need them.
Stakeholder engagement will be recorded and monitored frequently to ensure a consistent and
clear approach by the project teams. This will be reported to the Board and any issues and support
required highlighted.
The stakeholder matrix in figure 7-11 will be updated at regular intervals to reflect the changing
stakeholders and their engagement needs as we move through different stages in the delivery,
operation and decommissioning of the preferred package.

PORTSMOUTH CITY COUNCIL
151
7.7.2. Risks associated with Stakeholder Engagement
Through the stakeholder mapping process and the stakeholder engagement work that has taken
place to date a number of risks have been identified. These are included in the programme risk log
(appendix C) but are also summarised below:
Table 7.12- Risk associated with stakeholder engagement
ID Risk Mitigation
36 Not all political parties represented at cross party meetings
Attend party specific meetings and individual briefings with party leaders.
37 The voices of the most vocal stakeholders are given disproportionate weight in comparison to the views of others
Provide a variety of feedback methods for the less vocal to have an opportunity to have their say.
38 Insufficient stakeholder engagement could lead to a poor understanding of the issues around air quality and therefore opposition to the proposals
A planned approach as identified by this and the communications to ensure clear and consistent messages with a variety of opportunities for stakeholders to have their say through a variety of channels.
39 Hard to reach stakeholders missed An evolving plan that captures new stakeholders and take them on the programme journey.
40 Unclear and too complex information Clear and concise message clearly understood by all that are working with stakeholders.
7.7.3. Communications and Engagement Plan
As outlined in section 2.8 of the Strategic Case consultation has already taken place with residents, visitors and businesses in the city. It is anticipated that further consolation and engagement activity will be undertaken prior to submission of the Final Business Case to inform the operation of the charging CAZ and the best approach to delivering mitigation measures. It is acknowledged that effective and efficient engagement will be required to ensure that both internal and external stakeholders are aware of the measures proposed and how these measures could potentially impact them. Therefore a dedicated communications and engagement resource is required to manage and coordinate messaging, ensuring that this dovetails with the communications activities and messaging being delivered nationally by JAQU. The tasks conducted by the dedicated resource are detailed in the Communications and Engagement Plan attached at appendix D. The plan details how various stakeholders can help to shape the proposals and how PCC will raise awareness of air quality issues and mitigation measures in the city. The main objectives of the planned communications and engagement activity are:
To educate people about the charging CAZ and the classes of vehicles affected.
To inform individuals and businesses about the support available to them to switch to compliant
vehicles or sustainable and active modes.
To convince people to take action that helps reduce air pollution.
To educate people on the health impacts of poor air quality.
To increase awareness of how city network and transport improvements contribute to reducing
air pollution.
To inspire a shift to more active travel through fun activities and events.
To create awareness and inspire use of sustainable travel.

PORTSMOUTH CITY COUNCIL
152
To build the councils reputation as a council that is taking the issue of air quality seriously
whilst also recognising the potential economic impact on the city, Isle of Wight and surrounding
area, creating awareness of support in place.
7.7.4. CAZ Public Consultation
A key part of the public engagement activity will be a consultation to seek views on the operation of the charging CAZ, addressing issues such as local exemptions and sunset periods, appetite for mitigation measures and views on how any revenue collected from the charging CAZ should be spent. This engagement activity will be made up of the following elements:
Public survey: Seeking views from residents, visitors and businesses in Portsmouth and the surrounding areas.
Public roadshow events: To provide an opportunity for members of the public to ask questions about the charging CAZ and supporting measures and to explore issues in more depth than will be possible in a survey.
Business workshops: Providing an opportunity for businesses within the charging CAZ to provide their views, with a particular focus on their appetite for mitigation measures and support packages.
Taxi trade workshops: An opportunity to explain with the taxi trade how the charging CAZ could affect them, explain the planned changes to licensing requirements in the city and seek views on their appetite for mitigation measures and support packages.
This public consultation will commence in early 2020, following the approval of this Outline Business Case. This will allow sufficient time for insights gathered through the consultation to be fed into the development of the charging CAZ and mitigation measures prior to submission of the FBC.

PORTSMOUTH CITY COUNCIL
153
8. Clean Air Fund Bid
Introduction
The measures proposed for funding through the Clean Air Fund are intended to support the
Implementation Plan abatement measures by enabling PCC to deliver a reduction in NO2
emissions in the shortest possible time, whilst reducing the negative impact on local people and
businesses.
Funding is requested from the Clean Air Fund to deliver the following measures which will assist
individuals and businesses to switch to cleaner vehicles and help to normalise the use of
cleaner vehicles in the local community:
financial incentives for taxi drivers to upgrade to Euro 6 vehicles or above;
retrofitting of remaining non-compliant buses and coaches;
delivery of Service and Delivery Plans, with a long term view for delivery of an out-of-city
consolidation centre for Portsmouth (macro-consolidation);
financial subsidies to replace or retrofit non-compliant HGVs (subject to availability of
appropriate technology) used by heavily impacted businesses.
Benefits of excluding LGVs from the Clean Air Zone requirements
Excluding LGVs from the CAZ requirements brings a number of economic and social benefits for businesses and individuals in the Portsmouth area. In particular, their exclusion avoids:
- Affecting a large number of businesses that use non-compliant LGVs to make a wide range
of contributions to the functioning of the city, including many self-employed and/or sole
trades people;
- Impacts on those people and businesses that rely on the functions provided by the LGVs,
that might face increased costs or reduced services as a result of the impacts on LGV
operators; and
- Impact on travel by private individuals (who use LGVs as an alternative to a car).
National statistics44 suggest that just over 50% of LGVs are privately owned and just under 50% are owned by companies (some of which will be leased on to be the equivalent of private use).
On average, it is estimated that a small area CAZ C would affect over 9000 non-compliant LGVs in an average week in 2022 (compared with 13,500 LGVs for a Portsea Island CAZ C). The stakeholder survey suggests that the average size of non-compliant LGV fleet for businesses in the city is approximately 7 vehicles (with individual responses ranging between 1 and 20 vehicles). This figure needs to be treated with caution due to the small size of the sample (only 42 businesses with fleets responded), however it provides a useful indication.
On this basis, it could be estimated that in the order of 500 to 1000 businesses, and more than 4000 individuals in the Portsmouth area would be subject to the cost of paying the CAZ charge or upgrading/retrofitting their vehicles, as a result of operating non-compliant LGVs in a small area CAZ. This compares to an estimate of approximately 100 to 200 businesses affected by a CAZ B scenario as a result of operating non-compliant HGVs45.
The costs faced by those operating non-compliant LGVs vary according to the frequency of use of the vehicle, ranging from £520 p.a. for a weekly visit (representing 47% of non-compliant LGVs identified in the ANPR) to £3,640 for visiting daily throughout the year (5% of LGVs identified in ANPR).
44 DfT Licencing statistics, 2018 45 Estimate based on approximately 450 HGVs to be upgraded in 2022 and an average of just over 3 HGVs per fleet derived from the survey

PORTSMOUTH CITY COUNCIL
154
The alternative to paying the charge would be to upgrade (or retrofit) the vehicle to be compliant which would involve a significant capital outlay. The JAQU national dataset (providing average vehicle prices and depreciation) suggests that an average brand new LGV would cost approximately £27,000 (2018 prices). Even a more modest upgrade from a 4 year old LGV (the youngest non-compliant age) to a 3 year old LGV would involve an investment of nearly £2,000 (purchase cost of £10,300 relative to the resale value of old vehicle of £8,500). The Birmingham City Council CAF report also highlighted the risk of second-hand markets becoming distorted by the implementation of a CAZ, which would increase the costs of second hand compliant vehicles and decrease the resale value of second hand non-compliant vehicles, increasing the cost of upgrade.
The costs of the CAZ for non-compliant LGV operators would therefore be significant and would be disproportionately borne by smaller businesses and individuals, potentially influencing their ability to operate and/or use their van as they would choose. These costs and restrictions would have negative social and economic impacts for the Portsmouth area in the three key fields identified above:
- Costs experienced by businesses operating non-compliant vehicles, including many self-
employed and/or sole trades people (such as plumbers) and supporting and providing a wide
range of functions in the Portsmouth area, including construction, utilities, engineering, retail
and home deliveries, services such as gardening, vehicle repair, printing, cleaning amongst
many others.46
- Economic and social impacts for those that make use of or rely on the functions provided by
LGV operators. Given the range of functions provides, this will relate to both individuals and
a wide range of businesses.
- Economic and social impacts for those that rely on LGVs for Individual travel - an estimated
60% of mileage by privately owned LGVs are for commuting or personal use47.
46 A number of recent reviews have highlighted the shortage of information on LGV usage, Including the Committee on Climate Change 2018 Progress Report to Parliament, CCC, Chapter 5 Annex: Growth in Van Demand. However recent studies have pulled together information from sources such as the Committee for Integrated Transport (CfIT), 2010, Vans and the Economy and DfT 2002/03 quoted in AECOM, 2014, Van Travel Trends in Great Britain 47 DfT 2002/03 quoted in AECOM for RAC Foundation, 2014, Van Travel Trends in Great Britain

PORTSMOUTH CITY COUNCIL
155
Mitigation measures for taxis
8.2.1. Background
Portsmouth has a comprehensive hackney carriage and private hire service, offering competitive
rates and high availability of vehicles. There are currently 232 licensed hackney carriage vehicles
(HCs) and 958 private hire vehicles (PHVs) (1190 in total) in the City, accounting for 0.9% of the
total vehicle fleet, equating to one taxi for every 174 people.
There are 22 licensed operators working in the city, providing a 24/7 public service together with
specialist businesses, executive contracts and/or airport contracts.
The below table illustrates the profile of Portsmouth's hackney carriage and private hire vehicle
fleet.
Table 8-1 – Profile of Portsmouth's hackney carriage and private hire vehicle fleet
Private hire vehicles (958) Hackney Carriage Vehicle (232)
Diesel Elec Hybrid LPG Petrol Unde-fined
Total Diesel Hybrid Petrol Unde-fined
Total
Compliant 520 1 51 1 64 5 642 95 5 4 4 108
Non-Compliant
316 0 0 0 0 0 316 124 0 0 0 124
Total 836 1 51 1 64 5 958 219 5 4 4 232
Private hire vehicles (958) Hackney Carriage Vehicle (232)
Diesel Elec Hybrid LPG Petrol Unde-fined
Total Diesel Hybrid Petrol Unde-fined
Total
Compliant 54% 0% 5% 0% 7% 1% 67% 41% 2% 2% 2% 47%
Non-Compliant
33% 0% 0% 0% 0% 0% 33% 53% 0% 0% 0% 53%
Total 87% 0% 5% 0% 7% 1% 100% 94% 2% 2% 2% 100%
Source: October 2019 Portsmouth licensing data
8.2.2. Summary of distributional impact on group
It is anticipated that the implementation of a charging CAZ and tightening of the taxi licensing
requirements would put significant pressure on taxi drivers with non-compliant vehicles, and
adversely affect those residents who are dependent on taxis (particularly non-drivers, those with a
disability, and the elderly). At present, no CAZ discounts are proposed for taxis, the potential for
exemptions will be explored through the public consultation.
Overall, 37% of taxis (440) are currently non-compliant with the requirements of a charging CAZ,
and 63% of taxis (750) are compliant. The non-compliant fleet comprises 53% of HCs (124) and
33% of PHVs (316).
Under the Alternative Package (Smaller Area CAZ B+), drivers / owners of non-compliant taxis would
either need to pay the CAZ charge, retrofit their vehicle, swap to a newer vehicle, or stop operating
in the CAZ area. Based on a daily CAZ charge of £10 per day, these drivers would need to pay in
the region of £2,400 per year48. Upgrading the vehicle could cost between £2,500 and £5,500 (for
a typical car, discussed further below). Those leasing a non-compliant vehicle may need to pay a
penalty for breaking a contract early and additional lease payments for a new vehicle. The costs of
48 Assuming taxis would need to enter the CAZ 5 days a week, 48 weeks per year.

PORTSMOUTH CITY COUNCIL
156
responding to the CAZ for those with non-compliant vehicles are therefore significant in each
scenario.
The Distributional Impact analysis shows that:
The majority of HC drivers are self-employed drivers, who own their own vehicle. Drivers in this
group with non-compliant vehicles are likely to be significantly impacted by the introduction of a
CAZ, as they will need to personally bear the cost of paying the charge or upgrading their
vehicles. The number of non-compliant HC vehicles is 124.
In contrast, a large share of the PHVs are owned by proprietors owning several vehicles. While
some drivers own their own vehicles, others lease their vehicles:
- A third of PHVs (314, 33%) are owned by proprietors holding one vehicle license. These are
likely to be self-employed drivers, who own their own their vehicle. Drivers in this group with
non-compliant vehicles are likely to be significantly impacted by the introduction of a CAZ,
as they will need to personally bear the cost of paying the charge or upgrading their vehicle.
The number of non-compliant vehicles in this category is 96.
- A further third of PHVs (338, 35%) are owned by just two proprietors, who own 108 and 230
vehicles respectively. These proprietors (lease companies) lease vehicles to drivers, who
work for taxi operators within the city. The impact on drivers will depend on the nature of the
leasing terms. The number of non-compliant vehicles in this category is 117.
- A final third of PHVs (306, 32%) are owned by proprietors holding between 2 and 25 vehicle
licenses. This is believed to be a mix of smaller lease companies, and proprietors owning
and operating a small number of vehicles. Proprietors in this group with non-compliant
vehicles are likely to be significantly impacted by the introduction of a CAZ, as they will need
to cover the cost of paying the charge or upgrading the vehicles they own. The number of
non-compliant vehicles in this category is 103.
There is a strong prevalence of taxi drivers coming from the most deprived LSOAs49. Some 26%
of HC drivers and 15% of PHV drivers reside in the 10% most deprived LSOAs, when compared
to the England and Wales average. These drivers will find it particularly hard to upgrade or pay
the charge. Even those drivers residing in more affluent parts of the city are likely to be on low
incomes, and will be adversely affected by the introduction of a charging CAZ.
There is a significant percentage of drivers (>30%) aged between 51 and 80 years old, including
11% over 60 years old. Many older drivers may choose to retire following the introduction of a
charging CAZ as they may not be able to justify the upfront costs of a new vehicle in terms of the
time to amortize the investment. In addition to the negative impact on the taxi and PHV drivers
of lost income, the loss of a share of the taxi fleet could have implications for people with limited
mobility (those with a disability, and the elderly) through reduced availability of vehicles.
The Stakeholder Survey undertaken by PCC in June 2019 obtained feedback from a small sample
of 29 drivers, who own their own non-compliant vehicle, on their likely response to a CAZ. Nine
drivers said that they would retire early or leave the taxi trade, and 8 said that they would stop
working in the CAZ. These responses need treating with caution given the relatively small scale of
the sample however they would have significant consequences for the taxi trade in Portsmouth if
representative of the wider taxi driver population.
A number of focus groups were also held with taxi drivers (HC drivers, PHV drivers, and taxi
companies), as well as local businesses (including city centre retailers, manufacturing businesses,
49 Lower Layer Super Output Area (LSOA) is a geographical area designed for the reporting of small area statistics in England and Wales.

PORTSMOUTH CITY COUNCIL
157
hauliers, Wightlink, Portsmouth International Port and the Naval Base). The key issues that were
identified by taxi drivers / companies were as follows:
Concern from drivers and operators about the cost of upgrading vehicles to compliant types;
Drivers would be interested in Electric Vehicles in principle, however there is a lack of charging
infrastructure in the city, particularly at taxi ranks and other pick-up locations, and few drivers
have off-road parking to enable re-charging at home. Furthermore the cost of purchasing an
EV is considered prohibitive;
Drivers and operators would like to see loans and grants available to help with the cost of
switching to a compliant vehicle type, however there is limited appetite for retrofit due to the
perception that it is not worth investing in older vehicles;
Particular concern exists about the cost of upgrading wheelchair accessible vehicles to
compliant types and they would like to see a bigger loan or grant available for replacement of
this type of vehicle. A reduction in the availability of such services may have a significant
impact on disabled people;
Many of Portsmouth's PHVs are leased, and therefore there is a concern that if the availability
of loans or grants for replacement was limited to only small fleets, a large proportion of PHVs
would not be eligible for support.
8.2.3. Financial incentives for HC and PHV drivers to an upgrade to a compliant vehicle
a) Description of proposed mitigation measure, role in mitigating negative impacts of CAZ, and
indicative cost
To aid with the transition of the taxi fleet towards compliant vehicle types it is proposed that
financial support is made available to HC taxi drivers and PHV drivers to support them in upgrading
to a Euro 6 vehicle or better. This could be provided in the form of a purchase grant or interest-
free loan administered by PCC, or subsidised operating costs.
The Stakeholder Survey undertaken by PCC in June 2019 showed that some 19 out of the 29
drivers that owned their own non-compliant vehicle that responded were supportive of ‘an interest
free loan to support upgrade to an ULEV'. In addition, various meetings and focus groups with taxi
representatives suggested there is general support for this type of intervention across the taxi
community. However, to get a better understanding of the likely format and uptake of a financial
support scheme views for the HC and PHV trade will be sought in the public consultation planned
to take place in early 2020 and this will be used to determine the final form of the financial support
to be offered.
As there are very few London cab-style taxis in Portsmouth, it is assumed that replacement
vehicles would be conventional models, which have lower second-hand purchase costs and are
less likely to warrant retro-fitting.
As a worked example, the most common vehicle make and model in Portsmouth's HC and PHV
fleet is the Skoda Octavia, with 350 vehicles. Of these 350 vehicles, 125 are non-compliant, pre-
Sep 2015 diesel vehicles.
Upgrading from a 2014 (Euro 5) 1.6 litre diesel hatchback vehicle to an equivalent second-hand
compliant diesel vehicle would involve an upgrade cost50 of between £3,000 (for a 2017 vehicle)
50 These costs refer to the difference between the likely resale value of the drivers current vehicle and purchase price of a new vehicle. They do not account for the longer term consideration that the driver will have a more valuable asset with a higher future resale value.
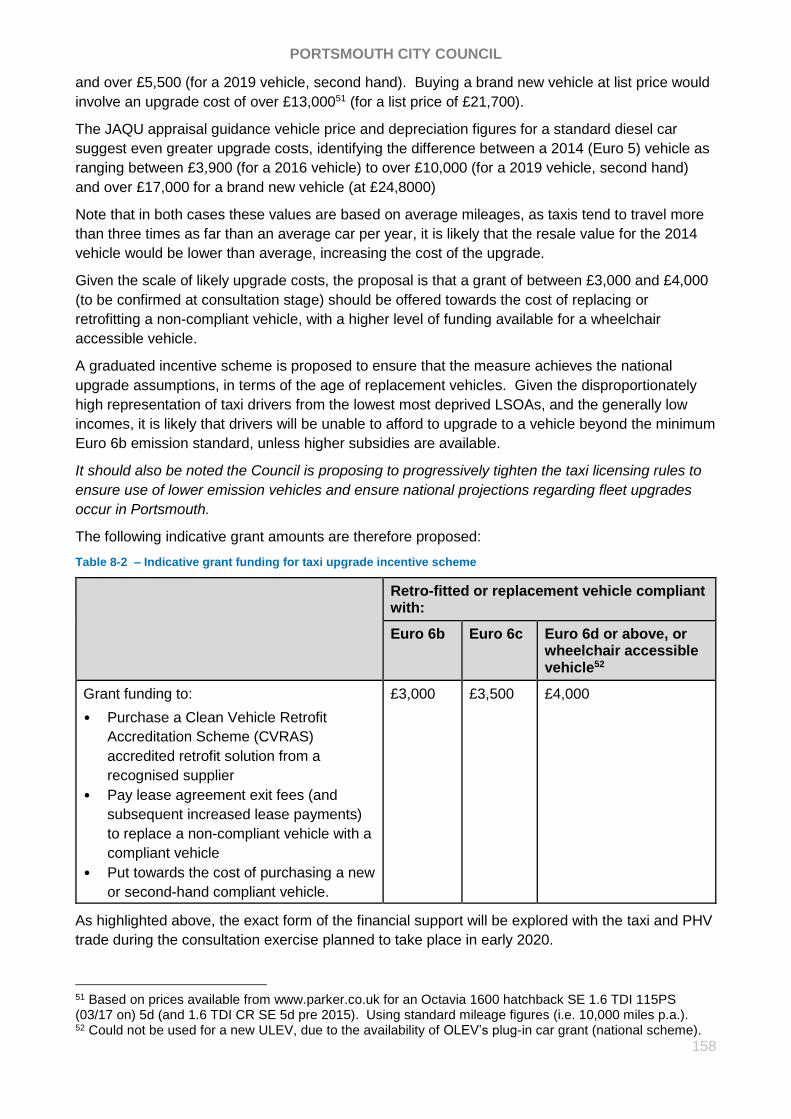
PORTSMOUTH CITY COUNCIL
158
and over £5,500 (for a 2019 vehicle, second hand). Buying a brand new vehicle at list price would
involve an upgrade cost of over £13,00051 (for a list price of £21,700).
The JAQU appraisal guidance vehicle price and depreciation figures for a standard diesel car
suggest even greater upgrade costs, identifying the difference between a 2014 (Euro 5) vehicle as
ranging between £3,900 (for a 2016 vehicle) to over £10,000 (for a 2019 vehicle, second hand)
and over £17,000 for a brand new vehicle (at £24,8000)
Note that in both cases these values are based on average mileages, as taxis tend to travel more
than three times as far than an average car per year, it is likely that the resale value for the 2014
vehicle would be lower than average, increasing the cost of the upgrade.
Given the scale of likely upgrade costs, the proposal is that a grant of between £3,000 and £4,000
(to be confirmed at consultation stage) should be offered towards the cost of replacing or
retrofitting a non-compliant vehicle, with a higher level of funding available for a wheelchair
accessible vehicle.
A graduated incentive scheme is proposed to ensure that the measure achieves the national
upgrade assumptions, in terms of the age of replacement vehicles. Given the disproportionately
high representation of taxi drivers from the lowest most deprived LSOAs, and the generally low
incomes, it is likely that drivers will be unable to afford to upgrade to a vehicle beyond the minimum
Euro 6b emission standard, unless higher subsidies are available.
It should also be noted the Council is proposing to progressively tighten the taxi licensing rules to
ensure use of lower emission vehicles and ensure national projections regarding fleet upgrades
occur in Portsmouth.
The following indicative grant amounts are therefore proposed:
Table 8-2 – Indicative grant funding for taxi upgrade incentive scheme
Retro-fitted or replacement vehicle compliant with:
Euro 6b Euro 6c Euro 6d or above, or wheelchair accessible vehicle52
Grant funding to:
• Purchase a Clean Vehicle Retrofit
Accreditation Scheme (CVRAS)
accredited retrofit solution from a
recognised supplier
• Pay lease agreement exit fees (and
subsequent increased lease payments)
to replace a non-compliant vehicle with a
compliant vehicle
• Put towards the cost of purchasing a new
or second-hand compliant vehicle.
£3,000
£3,500
£4,000
As highlighted above, the exact form of the financial support will be explored with the taxi and PHV
trade during the consultation exercise planned to take place in early 2020.
51 Based on prices available from www.parker.co.uk for an Octavia 1600 hatchback SE 1.6 TDI 115PS (03/17 on) 5d (and 1.6 TDI CR SE 5d pre 2015). Using standard mileage figures (i.e. 10,000 miles p.a.). 52 Could not be used for a new ULEV, due to the availability of OLEV’s plug-in car grant (national scheme).

PORTSMOUTH CITY COUNCIL
159
However, based on the above, the cost of the proposed measure is estimated at a maximum of
£1,875,000.
At this stage (prior to the planned consultation in 2020), this estimated cost is an upper bound as it
is based on 2019 non-compliant vehicles, and does not allow for natural fleet renewal. However,
while some drivers may replace their non-compliant vehicle over the next 18 months, it is
anticipated that the majority may delay doing so in order to benefit from the proposed incentive.
If focused on taxi / PHV drivers owning their vehicle, and proprietors with small fleets (<25
vehicles), the maximum cost of the incentive would be £1,292,000 (323 non-compliant vehicles x
£4,000), (with a total cost of £1,405,000 including administration fees).
b) Value for money evidence
The financial benefit (or increase in consumer surplus) received by taxi owners or drivers to
support vehicle upgrade/retrofit as a result of this measure will be directly offset by the mitigation
payments made. In terms of direct, monetised impacts this would lead to a Benefit Cost Ratio for
the measure of 1. Combining the administration costs with the estimated upgrade costs of
£1,760,000 results in a BCR of 0.94 with an NPV of -£115,000 (2018 prices and values).
However, the overall VfM case for the measure is significantly enhanced by the fact that it would
also bring a number of wider benefits that are not attributed a monetary value, including:
Reduction in negative economic impacts for taxi drivers – the distributional impacts analysis
has shown that taxi drivers with non compliant vehicles will face a significant cost as a result of
the implementation CAZ through the need either to upgrade their vehicle or to make regular
CAZ charge payments. This could lead to economic hardship and potentially job losses
amongst taxi drivers. These negative impacts would be further accentuated by the fact that a
disproportionately high proportion of the drivers live in LSOAs that fall in the most deprived
decile of LSOAs in Portsmouth.
Emissions reduction – the measure would accelerate the shift towards compliance of the taxi
fleet, reducing NOx and PM10 emissions, with associated health benefits.
Maintained accessibility for Portsmouth residents and to Portsmouth, particularly the disabled
and elderly – the measure would help to ensure continuation of provision of taxi services at
current levels, this is particularly important for the disabled and elderly who use the services
more than average.
Potential economic boost to local vehicle dealers, drivers are likely to purchase new vehicles or
retrofit in the local area with a resulting increase in local income (although potentially offset to
an extent by reduced income in subsequent years as a result of upgrades having being brought
forward by the CAZ).
c) Delivery plan, and state aid issues
The delivery timetable is likely to be dependent on whether grants or loans53 are offered as the
incentive as there will be different routes to procuring these measures. An indicative delivery
timetable is outlined below:
53 The possibility of including loan options within the scheme will be considered as part of the public consultation in early 2020.

PORTSMOUTH CITY COUNCIL
160
Table 8-3 – Indicative delivery programme for taxi upgrade incentive scheme
2020 2021 2022
Q4 Q1 Q2 Q3 Q4 Q1 Q2 Q3 Q4 Q1 Q2 Q3 Q4
Recruitment of staff
Staff in post
Expression of Interest/ registration period
Grant/interest free loan availability period
- Applications received
- Applications reviewed and decisions made
- Grants awarded
State aid - The taxi trade is highly localised and there is no competition from HC owners or PHV
operators from other Member States. It therefore cannot impact trade or competition across
Member States and therefore the measure does not constitute state aid. Nevertheless, PCC will
ensure that the funding is in full compliance of state aid rules. Furthermore, the funding award is
well below the de minimis threshold limit for aid to beneficiaries. The amount of financial benefit a
single HC or PHV driver could gain would be £11,200, calculated by considering the benefit from
CAZ exemption (£2,400 x 3 years) and adding the £4,000 grant. Additionally, recipients of the
award will be required to sign a document declaring that the total amount of financial benefit
received from the government within the last 3 fiscal years is within state aid limits, including taking
into consideration any other financial benefit they may have received from similar initiatives, which
may also have been administered by other Local Authorities. PCC will also seek legal advice
during the entire process to ensure state aid regulations are adhered to at every stage.
d) Impact on air quality
This proposal will result in faster upgrade of the taxi fleet in Portsmouth, and will therefore have a
positive impact on air quality. No adverse impacts are anticipated.

PORTSMOUTH CITY COUNCIL
161
Mitigation measures for buses and coaches
8.3.1. Background
By the time the CAZ B is implemented in 2021, the majority of buses and coaches operating in
Portsmouth are expected to be compliant with the CAZ requirements, and will not be required to
pay the proposed charge.
PCC has been awarded £1.5 million from Defra to retrofit 105 buses (68 First buses and 37
Stagecoach buses) passing through Mile End Road and Alfred Road to meet Euro 6 standards.
Following the completion of this programme, local bus services operated by Stagecoach and First
will be almost exclusively operated by Euro 6 equivalent vehicles. In addition, some of the
remaining vehicles (Euro 3 and Euro 5 standard) which are not viable for retrofitting are being
replaced by new diesel vehicles using the latest clean vehicle specification. Furthermore, virtually
all National Express services are operated using Euro 6 vehicles.
8.3.1. Summary of distributional impact on group
In the majority of cases, bus and coach operators will not be affected by the proposed CAZ,
however, there will remain a few local buses and coaches that will be non-compliant, and where
there is a risk that the CAZ charge will result in higher fares or reduced availability of services for
bus users. Some minibuses (including those used for home to school transport and other social
services) may also be liable for the CAZ charge, depending on a number of factors such as
number of seats, gross vehicle weight, etc.
Portsmouth has a strong tourist / leisure industry which would be adversely affected if these types
of services are affected. A large number of tourism and leisure coaches regularly operate within
the small CAZ area. Coaches are regularly used for school travel and for tourist trips to Historic
Dockyard/ Gunwharf Quays. Coaches also travel to/from the Isle of Wight using the Wightlink ferry
terminal near to Gunwharf Quays. The tourism sector is an important sector for the local and
regional economy, and the charge on non-compliant coaches could have a significant negative
impact.
8.3.2. Retrofitting of remaining non-compliant buses and coaches
a) Description of proposed mitigation measure, role in mitigating negative impacts of CAZ, and
indicative cost
This measure would provide a mitigation solution for remaining non-compliant buses where
retrofitting is a viable option. The measure would reduce the financial impact of the CAZ charge on
bus/coach operators and remove the risk of higher fares or reduced services for bus users.
The funding required to support retrofitting of buses and coaches in the city will be dependent on
how many non-compliant buses and coaches remain in local fleets and how many are capable of
being retrofitted. In order to assist those companies with vehicles that cannot be retrofitted,
funding will be made available to them to replace their non-compliant vehicles, equal to the cost of
retrofitting a vehicle.
Based on the recent bus retrofitting programme, the cost of retrofitting a vehicle ranges from
£12,515 to £16,490 (depending on model). The following grant is therefore proposed:
£15,000 grant towards retrofitting other suitable buses and coaches;
£15,000 grant towards replacement for other buses and coaches not suitable for retrofit.
Work is underway to confirm the exact number of remaining non-compliant buses that are suitable
for retrofit to Euro 6.

PORTSMOUTH CITY COUNCIL
162
It is also not yet clear how many locally based (Portsmouth, Isle of Wight and wider South
Hampshire) coach operators have non-compliant vehicles in their fleets, however this information
will be gained through the public consultation and engagement activity planned for early 2020.
The ANPR data (updated for 2022 fleet assumptions) shows 56 individual non-compliant buses
and coaches entering the Small Area CAZ in an average week, of which 33 are making trips on at
least two days a week. Increasing this figure by a third to account for the fact that this data is
based on a single week only (so will not capture all buses), and allowing for higher numbers of
leisure / tourist coaches in warmer months, gives a figure of around 50 non-compliant vehicles.
The cost of the proposed measure is therefore estimated at £1,015,000
We are also aware of approximately 150 non-compliant mini buses, used for home to school to
travel. Further work is on-going to determine how many and to what extent these vehicles will be
impacted by the CAZ. Assuming similar upgrade costs, a further £2,250,000 funding (£15,000 *
150 vehicles) would be required.
b) Value for money evidence
The financial benefit (or increase in consumer surplus) received by bus/coach operators to support
vehicle upgrade/retrofit as a result of this measure will be directly offset by the mitigation payments
made. In terms of direct, monetised impacts this would lead to a Benefit Cost Ratio for the
measure of 1. Combining the administration costs with the estimated upgrade costs of £900,000
results in a BCR of 0.89 with an NPV of -£115,000 (2018 prices and values).
However, the overall VfM case for the measure is significantly enhanced by the fact that it would
also bring a number of wider benefits that are not attributed a monetary value, including:
Reduction in negative economic impacts for bus and coach operators – the cost of vehicle
upgrades, retrofit or payment of charges could have implications for the financial viability of
some operators, particularly if smaller scale or locally based and/or the buses make limited
journeys in a day.
Emissions reduction – the measure would accelerate the shift towards compliance of the bus
and coach fleet, reducing NOx and PM10 emissions, with associated health benefits.
Support for the tourist and leisure industry which is an important part of the Portsmouth
economy.
Maintained accessibility for Portsmouth residents and to Portsmouth, reducing the risk of a
reduction in service (due to increased costs) or increase in fares.
c) Delivery plan, and state aid issues
The delivery of the proposed measure will be dependent on whether a bus or coach operator is
issued a grant to retrofit their vehicle or whether it is towards replacement. The differing timetables
for the two options are outlined in the delivery programme below.

PORTSMOUTH CITY COUNCIL
163
Table 8-4 – Indicative delivery programme for bus and coach retrofit scheme
2020 2021 2022
Q4 Q1 Q2 Q3 Q4 Q1 Q2 Q3 Q4 Q1 Q2 Q3 Q4
Recruitment of staff
Staff in post
Engagement with bus/coach operators
Expression of interest/ registration period
Grant or interest free loan towards replacement
Grant/interest free loan availability period
- Applications received
- Applications reviewed and decisions made
- Grants awarded
Retrofit of vehicles
Negotiate contract bus bus/ coach/ minibus operator
Retro-fit orders placed
First retro-fit (approx. 8-14 weeks from point of order)
Retro-fit program period (approx.)*
*Assumes install rate of one bus per day (based on retrofit program for First Bus: 1 bus per day x 21 = 21 working days
or 4.2 weeks; Stagecoach: 1 bus per day x 28 = 28 working days or 5.6 weeks).
State aid -The bus trade is highly localised and there is no competition from bus operators from
other Member States. It therefore cannot impact trade or competition across Member States and
therefore the measure does not constitute State aid. Nevertheless, PCC will ensure that the
funding is in full compliance of State aid rules. Additionally, recipients of the award will be required
to sign a document declaring that the total amount of financial benefit received from the
government within the last 3 fiscal years is within state aid limits, including taking into consideration
any other financial benefit they may have received from similar initiatives, which may also have
been administered by other Local Authorities. PCC will also seek legal advice during the entire
process to ensure State aid regulations are adhered to at every stage.

PORTSMOUTH CITY COUNCIL
164
d) Impact on air quality
This proposal will result in further upgrade of the bus fleet in Portsmouth, and will therefore have a
positive impact on air quality. No adverse impacts are anticipated.
Mitigation measures for HGVs
8.4.1. Background
The Alternative Package includes charging for all pre Euro VI HGVs travelling into the Small Area
CAZ in central Portsmouth. On the basis of the ANPR survey and EFT54 forecast of natural fleet
turnover, it is estimated that a Small Area CAZ B would affect approximately 450 non-compliant
HGVs in an average week in 2022.
8.4.2. Summary of distributional impact on group
The stakeholder survey undertaken by PCC suggested that the average size of non-compliant
HGV fleets in the city is just over 3 vehicles (with individual responses ranging between 1 and over
20 vehicles). This figure needs to be treated with caution due to the small size of the sample (only
42 businesses with fleets responded), however it provides an indication of average fleet size in the
city.
On this basis, it could be estimated that around 100 to 200 businesses in the Portsmouth area
would face the costs of CAZ charges or upgrading or retrofitting as a result of operating non-
compliant HGVs.
The costs faced as a result of charges would vary according to the number of days per week in
which the HGV would enter the CAZ, as shown in Table 7-6.
Table 8-5 Annual CAZ charge and proportion of unique HGVs by number of days of entry as observed by ANPR survey
Frequency:
1 day 2 days 3 days 4 days 5 days 6 days 7 days Total
Share of Non-Compliant HGVs
68% 16% 6% 4% 4% 2% 1% 100%
Price paid per year
£2,600 £5,200 £7,800 £10,400 £13,000 £15,600 £18,200
Source of vehicles by day data: ANPR data, March 2019
The alternative to paying the charge is to upgrade (or retrofit) the vehicle to be compliant. This
option involves a significant capital outlay for the vehicle owner. The JAQU national dataset
suggests that an average brand new rigid HGV would cost over £60,000 and an articulated vehicle
would cost over £115,00 (2018 prices). Even a more modest upgrade from a 7-year old HGV (the
most recent non-compliant vehicle) to a 3-year old HGV would involve an additional cost of
approximately £20,000 for a rigid HGV (purchase cost of £32,000 relative to resale value of old
vehicle of £12,000) and £30,000 for an articulated HGV (£46,000 compared to £18,000). The
Clean Air Fund bid developed for Birmingham City Council also highlighted the risk of this cost
being increased due to the distortion of second hand markets as a result of the CAZ, with costs of
compliant vehicles becoming inflated and the price of the non-compliant vehicles being sold being
depressed by the changes in demand. This would further increase the costs of upgrading.
The ability of HGV operating firms to absorb these costs and their implications for the financial
viability of the firm will vary according to a number of characteristics of the business. These include
54 Emission Factor Toolkit.

PORTSMOUTH CITY COUNCIL
165
the size of its fleet and whether it also includes any compliant vehicles, the flexibility of the
businesses’ operations and whether fleet movements can be rearranged to avoid the CAZ or use
different vehicles. Flexibility will be influenced by factors such as whether the business is located in
the CAZ (which minimises the scope for rearrangement), whether specialist vehicles are used (with
limited chances for second hand sales) and firm size, the relative significance of transport costs in
overall firm operational costs and the associated issue of the availability of funds, particularly for
upgrade costs.
Figure 7-1 illustrates the final point by highlighting the extent to which paying a CAZ charge on
each working day for a small fleet of HGVs mounts up over the year, presenting it as a proportion
of turnover for businesses in different turnover categories (with the number of businesses in
Portsmouth in each turnover category shown). For example, paying a daily weekday charge for a
single HGV could account for half of the turnover of a firm at the mid-point of the category for
turnover of up to £49,000 p.a.
Figure 8-1 Daily (weekday) CAZ charges as a proportion of business turnover
The businesses most likely to be seriously adversely affected by operating non compliant vehicles
after the implementation of the CAZ are those for which transport costs are a significant proportion
of the operational costs and that have the least flexibility to respond. This may often reflect smaller
businesses with constrained available funds and small fleet size. The risk of negative impacts is
therefore increased by the fact that the business distribution in Portsmouth and central Portsmouth
includes a high proportion of small (10 – 50 employees, approx. 20% of businesses in central
Portsmouth, excluding self-employed) and micro businesses (0-9 employees, approx. 70% of
businesses). The negative impacts would be further accentuated for businesses located within the
CAZ (which therefore cannot avoid travelling within it) and those that use specialist vehicles, for
which opportunities for upgrade are likely to be more expensive and more limited.
Whilst the negative implications of the CAZ charges will be focussed on those firms operating non-
compliant HGVS, they may also be passed on to firms that rely on the goods transported by them,
which might face increased transportation costs. Sectoral analysis of the businesses in
Portsmouth and central Portsmouth indicates that approximately 50% can be considered road

PORTSMOUTH CITY COUNCIL
166
dependent sectors for which the transport of goods is significant55, using HGVs either operated
directly by the firm or by other firms.
The following sections set out two measures proposed to mitigate the impacts of the CAZ on those
that operate or rely on non-compliant HGVs:
Deliver an out-of-city consolidation centre for Portsmouth (macro-consolidation)
Financial subsidies to replace or retrofit non-compliant HGVs (subject to availability of appropriate technology)
8.4.3. Deliver an out-of-city consolidation centre for Portsmouth (macro-consolidation)
a) Description of proposed mitigation measure, role in mitigating negative impacts of CAZ, and
indicative cost
As part of the Solent Future Mobility Zone (FMZ) bid, up to £2.8 million is being sought to deliver
an out-of-city freight Sustainable Distribution Centre (SDC) (also referred to as a consolidation
centre) for Portsmouth and increase the use of an existing SDC in Southampton, to reduce the
volume of commercial traffic in urban centres, and transfer deliveries to cleaner vehicles for the
“last mile”.
A freight consolidation centre provides a focal point (e.g. a warehouse close to the Major or
Strategic Road Networks) away from busy central areas (including the proposed CAZ area), where
stock from multiple suppliers is delivered, unpacked, consolidated, repacked and then transferred
to their final destination.
The FMZ bid also includes funding for Delivery and Service Plans (DSPs), sometimes referred to
as “Freight Travel Plans”, across the Solent area. DSPs are planning studies which identify the
operational, environmental and financial opportunities related to freight and servicing activities at a
location and are the first stage in developing sustainable consolidation approaches.
The DSPs will be used to quantify and baseline the business-as-usual (BAU) transport footprint,
service time and costs associated with the supply chain for up to 60 organisations across the
Solent region (including within the proposed CAZ boundary); and identify commodity type,
volumes, carriers, load capacity of LGVs, and origin and destination of supplies associated with
BAU logistics for these sites so that the true cost and scale of demand for goods is quantified.
They provide an opportunity to work with businesses to explore scope for more sustainable vehicle
use, and will also be used to secure ‘subsidised’ participation from between four (“do minimum”
and ten (“do maximum”) organisations operating from the Portsmouth SDC, to trial and showcase
the benefits of the consolidation centre.
The FMZ bid sets out a strong case for securing FMZ funding, for this and associated measures.
If, however, funding is not secured it is requested that the Portsmouth element of the bid is funded
through the Clean Air Fund. In the first instance, the provision of Service and Delivery Plans would
be delivered, with funding requested to enable ten businesses within the CAZ area to undertake
this measures. Following this, the long term approach would be for a consolidation centre for
Portsmouth would provide freight and delivery operators with non-compliant vehicles an alternative
to paying the proposed CAZ charge or upgrading. Given the high cost of replacing a vehicle, and
the limited opportunities to retrofit HGVs, this is expected to provide an attractive option for some
businesses, as well as delivering air quality benefits for the city.
55 The road dependent businesses are identified as Manufacturing, Construction, Retail and Wholesale, Transportation
and warehousing, Taxis and Food and beverages activities. This builds on the Highways England SRN- dependent businesses (defined in Highway England, Socio-economic analysis, future forecasts and the strategic road network, 2016) which are importers/exporters (nationally or internationally), that rely heavily on logistics and the national road system for their activities and adds in additional sectors that will be dependent on the local roads.

PORTSMOUTH CITY COUNCIL
167
The funding requested is £1,730,671 to cover:
Portsmouth Sustainable Distribution Centre (SDC) procurement / set up costs;
SDC marketing;
SDC monitoring, evaluation, and contract management;
Subsidies for early adopters;
Development of 10 Delivery & Service Plans in the Portsmouth area (targeting HGV trips in the
proposed CAZ boundary) and associated costs;
Administration costs.
b) Value for money evidence
There is a good value for money case for the SDC which could generate a range of ongoing
efficiency and wider benefits for a relatively low investment.
For example, the effective use of a SDC could help to:
Reduce the volume of commercial vehicles in central Portsmouth, with associated benefits of
reduced congestion and improved travel times and operating costs, reduced emissions, noise
and accidents.
Transfer deliveries into cleaner vehicles (as the “last mile” journey is short, potential exists to
use electric vehicles to make consolidated deliveries), further reducing emissions.
More efficiently accommodate demand from freight vehicles in loading and unloading areas
and where facilities may be over-capacity, bringing potential cost efficiencies to operators;
Improve delivery services to retailers (on-time and to-date); bringing potential cost efficiencies
to businesses.
Provide opportunities for added value services to customers, such as the removal of bulky
packaging to increase fill-rates and reduce the generation of recyclate at the point of delivery,
bringing potential increased income and reduced costs for businesses.
Moreover, bespoke Delivery and Service Plans will provide efficiencies in logistical operations and
further contribute to cost savings for businesses, as well as wider traffic and environmental
benefits.
c) Delivery plan, and state aid issues
The Future Mobility Zone bid sets out a timeframe spanning 2019/20-2022/23, with c.69.5%
(£1,019,916) of spend by Year 2021/2022. If funding is secured through the Clean Air Fund,
opportunities to accelerate delivery will be explored (for example, Portsmouth DSPs are currently
programmed to commence in Year 2 but this could commence in Year 1).
As set out in the Future Mobility Zone bid, key partners have been identified and engaged for
establishing a consolidation centre for Portsmouth. These include the Local Transport and
Education Authorities, the University of Portsmouth (UoP), the University of Southampton (UoS),
the NHS trusts across the Solent Region, and the relevant operator(s) and the National
Infrastructure Commission.

PORTSMOUTH CITY COUNCIL
168
Southampton City Council has operated the SDC consolidation centre with its partner Meachers
Global Logistics since 2013. This facility is one of the few commercially free-standing consolidation
centres in Europe. There is an established contractual relationship with Meachers Global Logistics
which will enable the consolidation centre in Southampton to be operated for the lifespan of the
FMZ funding period, and also will enable establishment of an equivalent arrangement to serve the
Portsmouth area. This arrangement will fall under Regulation 12(7) of the Public Contract
Regulations which covers joint working arrangements between Contracting Authorities and
therefore no further sourcing strategy is required. This will enable consolidation to be implemented
quickly for a variety of participating organisations and guide decisions about the scale and scope of
supply chain consolidation.
The project will focus first on quantifying and baselining existing demand for goods for participating
organisations (where further data is required). Concurrently, steps will be taken to establish the
consolidation centre in Portsmouth. BAU data would then be used to identify volumes and types of
goods appropriate for consolidation and simulate the impact and costs over the short and medium
term. These insights will enable consolidation trials for organisations in Portsmouth including use
of subsidy to mitigate any initial expense associated with the move to consolidation. Developing
management systems and infrastructure to enable joint procurement between participating
organisations as well as setting up ‘milk-rounds’ to micro-consolidation points in district centres will
be the final components of the project.
A further area which will be investigated will be whether there could be scope to use consolidation
centres to make consolidated deliveries to the sites where Transforming Cities Fund (SE Hants
Rapid Transit) projects are being constructed, helping reduce construction impacts of the TCF
proposals.
The Delivery and Service Plan element of this package will be an essential element in ensuring
that businesses are prepared for the operation of the CAZ. It is therefore anticipated that the
engagement staff would be recruited early in 2020, with them working out in the community as
soon as possible. This element could be delivered as a 'quick-win' prior to the FBC being finalised
as it could help to speed the rate of uptake of compliant vehicles in the city.
as it could help to speed the rate of uptake of compliant vehicles in the city.
Table 8-8 – Indicative delivery programme for Consolidation Centre and Service and Delivery Plans
2020 2021 2022
Q4 Q1 Q2 Q3 Q4 Q1 Q2 Q3 Q4 Q1 Q2 Q3 Q4
Recruitment of staff
Staff in post
Portsmouth SDC procurement and set up
SDC marketing
SDC monitoring, evaluation, and contract management

PORTSMOUTH CITY COUNCIL
169
Grant of subsidy for early adopters
DSP production period
DSP implementation period (ongoing)
State aid - It is considered that the measure does not constitute State aid for the following
reasons. Firstly, it is considered that the MEOP applies since the measure, by nature, has
commercial elements to the venture, i.e. by improving goods distribution efficiency, it has
commercial and cost benefits and thereby is motivated by returns on investment. MEOP says that
an economic transaction carried out by a public body does not constitute State aid if it is carried out
in line with normal market conditions. It is considered that it is possible that a market operator, of a
comparable size to the public body, operating in the normal conditions of a market economy (e.g.
motivated by returns on investment and not policy objectives) could have been prompted to enter
into the transaction on the same terms.
Notwithstanding the above, the funding award received by beneficiaries could fall below the de
minimis threshold limit (i.e. €100,000 over 3 fiscal years for the road freight transport sector).
Theoretically, the amount of financial benefit a single business operator could gain could be
£36,000 (the cost of a DSP), and an 'early adopter' subsidy (up to £500,000, though it is
considered that no single business could claim the full amount but it's likely to be divided between
10 businesses, which is also the number of programmed DSPs, and therefore up to £50,000 each),
and therefore would fall under the de minimis threshold. However, this is assuming that CAZ
exemption benefits are not included towards the total benefit amount, which could otherwise
potentially mean the de minimis threshold would be breached. Furthermore, it is acknowledged
that the 'de minimis' principle does not apply if awarded to 'export-related' activities. Even so, this
does not apply here since the logistical network is to serve the Solent area, and not across
Member States or other countries.
Additionally, recipients of the award will be required to sign a document declaring that the total
amount of financial benefit received from the government within the last 3 fiscal years is within
state aid limits, including taking into consideration any other financial benefit they may have
received from similar initiatives, which may also have been administered by other Local Authorities.
PCC will also seek legal advice during the entire process to ensure State aid regulations are
adhered to at every stage.
d) Impact on air quality
This proposal will result in greater use of sustainable vehicles for the last mile component within
the CAZ area, more sustainable service and delivery practices in general, and faster replacement
of older vehicles with cleaner alternatives. It will therefore have a positive impact on air quality in
the central areas served by the consolidation centre and the routes to them. This will potentially be
partially offset by a reduction in air quality on the roads leading to the consolidation centre which
will experience increased freight traffic. However, the non central location of the site will likely
mean that the impacts are limited due to lower baseline emissions levels than in the city centre and
a much lower prevalence of sensitive air quality receptors near to affected roads.

PORTSMOUTH CITY COUNCIL
170
8.4.4. Financial subsidies to replace or retrofit non-compliant HGVs (subject to availability of appropriate technology)
a) Description of proposed mitigation measure, role in mitigating negative impacts of CAZ, and
indicative cost
This measure aims to provide support to businesses operating non-compliant HGV vehicles
located within or who operate frequently within the CAZ (i.e. undertaking high mileage within the
CAZ and entering it frequently).
Operators of non-compliant HGVs will be able to apply for up to £16,000 in grant funding which can
be used to:
Purchase a Clean Vehicle Retrofit Accreditation Scheme (CVRAS) accredited retrofit solution
from a recognised supplier
Pay lease agreement exit fees and subsequent increased lease fees to replace a non-
compliant vehicle with a compliant vehicle
Put towards the cost of purchasing a new or second-hand compliant vehicle.
This approach has been adopted since there are still uncertainties around retrofit technology for
HGVs in terms of its maturity, and whether economic benefits would stack up compared to the cost
of retrofit. Therefore, this approach gives operators a choice in route towards compliance.
The financial support available towards replacement or retrofit of non-compliant HGVs should be
targeted at the following groups as these are identified as those that are likely to be least able to
adapt to the CAZ charges:
SMEs with older vehicles (and potentially specialist vehicles) and that are heavily impacted by
the CAZ (i.e. frequently enter the CAZ);
businesses with a strategically important role within the City, but due to the nature of their
operations would not be able to use the proposed consolidation centre;
with priority given to those committed to developing and implementing a Delivery & Service Plan
which will result in more sustainable transport operations.
The ANPR survey and forecast of natural fleet turnover suggests that in 2022 approximately 450
non-compliant HGVs would enter the small area CAZ in an average week, with 32% (144) entering
on two or more days in the week. This is based on a single week survey and so it is likely to have
not captured some HGVs that make regular visits to the CAZ area. Including an uplift of a further
third to account for this suggests a total of approximately 200 vehicles that may benefit for support
for upgrade. However, it is anticipated that only a proportion HGV owners would take up this
incentive.
The maximum cost of the proposed measure is therefore estimated at £915,000.
However, to get a better understanding of the businesses requiring support and the likely uptake of
a financial support scheme, businesses will be consulted as part of the public consultation planned
to take place in early 2020, and this will be used to determine the final form of the financial support
to be offered.
b) Value for money evidence
The financial benefit (or increase in consumer surplus) received by HGV operators to support
vehicle upgrade/retrofit as a result of this measure will be directly offset by the mitigation payments
made. In terms of direct, monetised impacts this would lead to a Benefit Cost Ratio for the
measure of 1. Combining the administration costs with the upgrade costs of £800,000 results in a
BCR of 0.88 with an NPV of -£115,000 (2018 prices and values).

PORTSMOUTH CITY COUNCIL
171
However, the overall VfM case for the measure is significantly enhanced by the fact that it would
also bring a number of wider benefits that are not attributed a monetary value, including:
Reduction in negative economic impacts for HGV operators – the cost of vehicle upgrades,
retrofit or payment of charges could have implications for the financial viability of some HGV
operators, particularly if smaller scale, locally based and/or with operational costs that are
particularly dependent on transport costs.
Reduction in negative economic impacts for businesses reliant on goods transported by HGV
operators affected by the charge. Operators would be likely to pass on some of their cost
increases to firms they supply or distribute for, increasing operational costs for a range of
businesses within the CAZ area (and potentially more widely if the operators choose to make a
more general price increase rather than focus it on businesses within the CAZ).
Emissions reduction – the measure would accelerate the shift towards compliance of the HGV
fleet, reducing NOx and PM10 emissions, with associated health benefits.
c) Delivery plan and state aid issues
Table 8-9 – Indicative delivery programme for retrofit or replacement of non-compliant HGVs
2020 2021 2022
Q4 Q1 Q2 Q3 Q4 Q1 Q2 Q3 Q4 Q1 Q2 Q3 Q4
Recruitment of staff
Staff in post
Engagement with HGV operators
Expression of interest/ registration period
Grant/interest free loan availability period
- Applications received
- Applications reviewed and decisions made
- Grants awarded
State aid - It is considered that the measure does not constitute State aid for the following
reasons. Firstly, it is considered, if awarded to commercial HGV businesses and operators that the
MEOP applies since the measure, by nature, has commercial elements to the venture, i.e. by
improving HGV efficiency and standard, it has commercial and cost benefits and thereby is
motivated by returns on investment. MEOP says that an economic transaction carried out by a
public body does not constitute State aid if it is carried out in line with normal market conditions. It
is considered that it is possible that a market operator, of a comparable size to the public body,
operating in the normal conditions of a market economy (e.g. motivated by returns on investment
and not policy objectives) could have been prompted to enter into the transaction on the same
terms.

PORTSMOUTH CITY COUNCIL
172
Notwithstanding the above, the funding award received by beneficiaries could fall below the de
minimis threshold limit (i.e. £100,000 over 3 fiscal years for the road freight transport sector).
Theoretically, the amount of financial benefit a HGV could gain for a single vehicle would be
£16,000. However, this is assuming that CAZ exemption benefits are not included towards the
total benefit amount, which could otherwise potentially mean the de minimis threshold would be
breached. Furthermore, it is acknowledged that the 'de minimis' principle does not apply if
awarded to 'export-related' activities. Therefore, applicants to the award would be required to
declare whether their business operations fall within the scope of 'export-related' activities.
Additionally, not all HGV operators may utilise their vehicles for commercial or economic activity,
i.e. offering goods or services on a market. For example, these may be vehicles operated by
public bodies or similar for logistical use. Therefore, in such scenarios, it is considered this would
not constitute State aid.
All recipients of the award will be required to sign a document declaring that the total amount of
financial benefit received from the government within the last 3 fiscal years is within state aid limits,
including taking into consideration any other financial benefit they may have received from similar
initiatives, which may also have been administered by other Local Authorities. PCC will also seek
legal advice during the entire process to ensure State aid regulations are adhered to at every
stage.
d) Impact on air quality
This proposal will result in faster upgrade of the HGV fleet in Portsmouth and will therefore have a
positive impact on air quality. No adverse impacts are anticipated.

PORTSMOUTH CITY COUNCIL
173
Clean Air Fund application overview form
8.5.1. Summary of distributional analysis
Group
impacted
How they are impacted
Taxis / PHV
drivers
We are introducing a Class B charging Clean Air Zone which will impact on non-
compliant hackney carriage (HC) and private hire vehicles (PHV) who will need to
pay a charge.
Overall, 37% of taxis (440) are currently non-compliant with the requirements of a
charging CAZ, and 63% of taxis (750) are compliant. The non-compliant fleet
comprises 53% of HCs (124) and 33% of PHVs (316).
There is a strong prevalence of taxi drivers coming from the most deprived
LSOAs. These drivers will find it particularly hard to upgrade or pay the charge.
Even those drivers residing in more affluent parts of the city are likely to be on low
incomes, and will be adversely affected by the introduction of a charging CAZ.
The Stakeholder Survey undertaken by PCC in June 2019 obtained feedback
from a small sample of 29 drivers, who own their own non-compliant vehicle, on
their likely response to a CAZ. Nine drivers said that they would retire early or
leave the taxi trade, and 8 said that they would stop working in the CAZ. These
responses need treating with caution given the relatively small scale of the
sample however they would have significant consequences for the taxi trade in
Portsmouth if representative of the wider taxi driver population.
Bus
companies
We are introducing a Class B charging Clean Air Zone which will impact on non-
compliant buses who will need to pay a charge.
The ANPR data (updated for 2022 fleet assumptions) shows 45 individual non-
compliant buses and coaches entering the Small Area CAZ in an average week,
of which 26 are making trips on at least two days a week. Increasing this figure
by a third to account for the fact that this data is based on a single week only (so
will not capture all buses), and allowing for higher numbers of leisure / tourist
coaches in warmer months, gives a figure of around 40 non-compliant vehicles.
HGV
drivers
We are introducing a Class B charging Clean Air Zone which will impact on non-
compliant HGV drivers.
The ANPR survey and forecast of natural fleet turnover suggests that in 2022
approximately 450 non-compliant HGVs would enter the small area CAZ in an
average week, with 32% (144) entering on two or more days in the week. This is
based on a single week survey and so it is likely to have not captured some HGVs
that make regular visits to the CAZ area. Including an uplift of a further third to
account for this suggests gives a figure of around 200 non-compliant vehicles.
The impact will be felt by businesses operating HGVs or reliant on HGVs. The
businesses most likely to be seriously adversely affected by operating non-
compliant vehicles after the implementation of the CAZ are those for which
transport costs are a significant proportion of the operational costs and that have
the least flexibility to respond.
This is likely to include smaller businesses with constrained available funds and
small fleet size. The risk of negative impacts is therefore increased by the fact that
the business distribution in Portsmouth and central Portsmouth includes a high
proportion of small (10 – 50 employees, approx. 20% of businesses in central
Portsmouth, excluding self-employed) and micro businesses (0-9 employees,
approx. 70% of businesses).

PORTSMOUTH CITY COUNCIL
174
The negative impacts would be further accentuated for businesses located within
the CAZ (which therefore cannot avoid travelling within it) and those that use
specialist vehicles, for which opportunities for upgrade are likely to be more
expensive and more limited.
Whilst the negative implications of the CAZ charges will be focussed on those
firms operating non-compliant HGVS, they may also be passed on to firms that
rely on the goods transported by them, which might face increased transportation
costs. Sectoral analysis of the businesses in Portsmouth and central Portsmouth
indicates that approximately 50% can be considered road dependent sectors for
which the transport of goods is significant, using HGVs either operated directly by
the firm or by other firms.
8.5.2. Summary of measures
Measure Type56 Who will it help? Cost
Financial incentives for HC
and PHV drivers to
upgrade to a compliant
vehicle
20b Drivers of non-compliant vehicles.
If necessary, funding will be
focused on drivers owning their
vehicle, and proprietors with small
fleets (<25 vehicles), who will be
most impacted.
Scheme to be refined as part of
public consultation process in
early 2020.
£1,875,000 for all
non-compliant
vehicles;
£1,405,000 for more
focused scheme.
Retrofitting of remaining
non-compliant buses and
coaches
20b Operators with non-compliant
buses, particularly small
operators who were not included
in the recent bus retrofit
programme.
Scheme to be refined as part of
public consultation process in
early 2020.
£1,015,000 for 50
non-compliant buses
and coaches.
A further £2,250,000
funding may be
required for 150
non-compliant mini-
buses, depending
on gross weight, etc.
Deliver an out-of-city
consolidation centre for
Portsmouth (macro-
consolidation), including
the development of 10
Delivery & Service Plans in
the Portsmouth area
20b A consolidation centre would
provide freight and delivery
operators with non-compliant
vehicles an alternative to paying
the proposed CAZ charge or
upgrading. Given the high cost of
replacing a vehicle, and the
limited opportunities to retrofit
HGVs, this is expected to provide
an attractive option for some
businesses.
£1,730,671, if not
funded via the
Solent Future
Mobility Zone bid.
Financial subsidies to
replace or retrofit non-
20b Operators of non-compliant
HGVs.
£915,000, for 50
non-compliant HGVs
56 See paragraph 20 in the Clean Air Fund guidance for a detailed explanation of each type.

PORTSMOUTH CITY COUNCIL
175
compliant HGVs (subject
to availability of
appropriate technology)
Targeted at the following most
impacted groups:
- SMEs with older vehicles (and
potentially specialist vehicles)
and that are heavily impacted
by the CAZ (i.e. frequently
enter the CAZ); and
- businesses with a strategically
important role within the City,
but due to the nature of their
operations would not be able
to use the proposed
consolidation centre;
- with priority given to those
committed to developing and
implementing a Delivery &
Service Plan which will result
in more sustainable transport
operations.
Scheme to be refined as part of
public consultation process in
early 2020.
(assuming 25%
take-up).