post-disaster imaged-based damage detection and repair
TRANSCRIPT

Pan et al. 1
Post-disaster imaged-based damage detection and repair
cost estimation of reinforced concrete buildings using dual
convolutional neural networks
Xiao Pana, T.Y. Yangb
a PhD candidate, Department of Civil Engineering, University of British Columbia, Vancouver, Canada
([email protected]) b Professor, Department of Civil Engineering, University of British Columbia, Vancouver, Canada ([email protected])
Abstract: Reinforced concrete buildings are commonly
used around the world. With recent earthquakes worldwide,
rapid structural damage inspection and repair cost
evaluation are crucial for building owners and policy
makers to make informed risk management decisions. To
improve the efficiency of such inspection, advanced
computer vision techniques based on convolution neural
networks have been adopted in recent research to rapidly
quantify the damage state of structures. In this paper, an
advanced object detection neural network, named YOLO-v2,
is implemented which achieves 98.2% and 84.5% average
precision in training and testing, respectively. The proposed
YOLO-v2 is used in combination with the classification
neural network, which improves the identification accuracy
for critical damage state of reinforced concrete structures by
7.5%. The improved classification procedures allow
engineers to rapidly and more accurately quantify the
damage states of the structure, and also localize the critical
damage features. The identified damage state can then be
integrated with the state-of-the-art performance evaluation
framework to quantify the financial losses of critical
reinforced concrete buildings. The results can be used by the
building owners and decision makers to make informed risk
management decisions immediately after the strong
earthquake shaking. Hence, resources can be allocated
rapidly to improve the resiliency of the community.
1 INTRODUCTION
Reinforced concrete (RC) buildings are the most prevalent
structural systems constructed worldwide. With many of
these buildings built in high seismic zones, the performance
of RC building after strong earthquake shaking is becoming
a significant concern for many building owners. When an
earthquake happens, decision makers such as city planners,
emergency management departments need first-hand
response to allocate resources to manage the damaged
infrastructure. This requires rapid performance assessments
of the facilities. Traditional post-earthquake inspections
were performed manually and the results may be relatively
coarse and highly relying on the proper training of the
inspectors and qualitative engineering judgments. The
processing time may also be very long, due to a large amount
of data processing required. These deficiencies can be
overcome if the current manual evaluation processes are
fully automated (Zhu & Brilakis, 2010). Research on
automation of inspection practices using computer vision-
based methods (Jahanshahi, Kelly, Masri, & Sukhatme,
2009; Koch, Georgieva, Kasireddy, Akinci, & Fieguth,
2015; Yeum, & Dyke, 2015; Hoskere, Park, Yoon &
Spencer, 2019) has greatly advanced in recent years. In the
past, computer vision-based methods were developed based
on conventional image processing techniques (IPTs).
However, these methods are relatively time-consuming and
not robust against background noises. Hence it is ineffective
to apply in practice.
Significant achievements have been made in recent years
in computer vision with the advancement of artificial neural
networks. The development of artificial neural network can
be generally divided into 3 phases. The first phase can be
dated back to the 1940s–1960s, where the theories of
biological learning (McCulloch and Pitts, 1943) and the first
artificial neural network such as Perceptron (Rosenblatt,
1958) was implemented. The second period happened during
the 1980–1995 period, where back-propagation technique
(Rumelhart, Hinton, & Williams, 1986) was developed to
train a neural network with one or two hidden layers. During
the 1990s, artificial neural network has evolved to deep
neural networks (DNNs), where multiple layers can be
trained through back-propagation algorithm. One such
application was the work done by LeCun, Bottou, Bengio, &
Haffner (1998) for document recognition. The third phase of
neural networks (also named deep learning) begun with the
breakthrough in 2006 when Hinton, Osindero, and Teh
(2006) demonstrated that a so-called deep belief network
could be efficiently trained using greedy layer-wise
pretraining strategy. With the fast growing and optimization
of the deep learning algorithms, the increasing size of
Pan et al. 2
training data, as well as enhanced computational power,
Convolutional Neural Network (CNN, or ConvNet), which
is a class of DNNs, has been advancing rapidly. Unlike
traditional neural networks that utilize multiple fully-
connected (FC) layers, the hidden layers of a CNN typically
include a series of convolutional layers that convolve with a
multiplication or other dot product through learnable filters.
In recent years, CNNs have dominated the fields of computer
vision, speech recognition, and natural language processing.
Within the field of computer vision, CNN such as the
AlexNet, developed by Krizhevsky, Sutskever, and Hinton
(2012), has shown a substantial increase in accuracy and
efficiency than any other algorithms. With the success of
AlexNet, CNNs have been successfully applied in computer
vision for classification, object detection, semantic
segmentation, and visual object tracking. In addition to
AlexNet, other deeper CNN networks such as VGG Net
(Simonyan & Zisserman, 2014), Google Net (Szegedy et al.,
2015), Deep Residual Net (He, Zhang, Ren, & Sun, 2016),
DenseNet (Huang, Liu, Van Der Maaten, & Weinberger,
2017) and MobileNet (Sandler, Howard, Zhu, Zhmoginov,
& Chen, 2018) have been developed.
CNNs have been successfully applied in civil engineering
applications for image classifications. These include metal
surface defects detection (Soukup & Huber-Mörk, 2014),
post-disaster collapse classification (Yeum, Dyke, Ramirez,
& Benes, 2016), joint damage detection through a one-
dimensional CNN (Abdeljaber, Avci, Kiranyaz, Gabbouj, &
Inman, 2017), concrete crack detection using a sliding
window technique (Cha, Choi, & Büyüköztürk, 2017),
pavement crack detection (Zhang et al., 2017; Vetrivel,
Gerke, Kerle, Nex, & Vosselman, 2018), structural damage
detection with feature extracted from low-level sensor data
(Lin, Nie, & Ma, 2017), structural damage classification with
the proposal of Structural ImageNet (Gao & Mosalam,
2018). Apart from the CNN-based classification, other
powerful classification algorithms such as Enhanced
Probabilistic Neural Network with Local Decision Circles
(EPNN) and the new Neural Dynamic Classification (NDC)
were successfully developed in recent years (Ahmadlou &
Adeli, 2010; Rafiei & Adeli, 2017). The noticeable
applications of such recent algorithms in civil engineering
can be found in damage detection in high-rise buildings
using neural dynamics classification (Rafiei & Adeli, 2017),
development of earthquake early warning system (Rafiei,
M.H. and Adeli, H. (2017), structural reliability analysis
(Dai, 2017), estimation of concrete properties (Rafiei,
Khushefati, Demirboga & Adeli, 2017), the global and local
assessment of structural health condition using unsupervised
deep Boltzmann machine (Rafiei & Adeli, 2018) and
construction cost estimation (Rafiei & Adeli, 2018).
In addition to classification, CNNs can be used in the field
of object detection which involves classification and
localization of an object. Prior to the use of CNNs, object
detection was dominated by the use of histogram of oriented
gradients (HOG) (Dalal, & Triggs, 2005) and scale-invariant
feature transform (SIFT) (Lowe, 2004). In 2014, Girshick,
Donahue, Darrell and Malik (2014) proposed the region-
based CNNs (R-CNNs), which utilizes the Region Proposal
Function (RPF) in order to localize and segment objects. It
significantly improved the global performance compared to
the previous best result on PASCAL Visual Object Classes
(VOC) challenge 2012. The PASCAL Visual VOC
challenge ran each year from 2005 to 2012, which provides
a benchmark in visual object category recognition and
detection with a standard dataset of images and annotation,
and standard evaluation procedures. Discussion of object
detection proposal methods can be found in Hosang,
Benenson, and Schiele (2014), Hosang, Benenson, Dollár,
and Schiele (2015). Further, the Fast R-CNN (Girshick et al.,
2015) and the Faster R-CNN (Ren, He, Girshick, & Sun,
2017) were developed to improve the speed and accuracy of
the R-CNN. Region-based CNN methods (e.g. RCNN, Fast-
RCNN, and Faster-RCNN) have been successfully
implemented in civil engineering applications. Cha, Choi,
Suh, Mahmoudkhani & Büyüköztürk (2018) used the Faster-
RCNN to detect multiple structural damage types such as
steel delamination, steel corrosion, bolt corrosion, and
concrete cracks. Xue & Li, (2018) demonstrated the
efficiency of Faster R-CNN for shield tunnel lining defects
detection compared to traditional inspection methods. Li,
Yuan, Zhang, & Yuan (2018) achieved near-real-time
concrete defect detection with geolocalization using a
unified vision-based methodology. Liang (2019) applied
deep learning with Bayesian optimization for RC bridge
damage detection.
While many previous studies can provide reasonable
accuracy, they are still relatively slow in terms of achieving
real-time practical application when the images were
recorded with high frame per second (FPS). To address this
deficiency, Redmon, Divvala, Girshick, & Farhadi, (2016)
presented YOLO (i.e. You Only Look Once) for real-time
object detection. While YOLO is extremely fast, it makes
more localization errors and achieved relatively low recall
compared to region-based CNN methods. To further
improve recall and localization accuracy, Redmon & Farhadi
(2017) developed the YOLOv2 algorithm. They have shown
that YOLOv2 significantly improves the recall and
localization accuracy while still maintaining the speed to be
10 times faster in FPS compared to Faster-RCNN on the
VOC 2007 database.
CNN-based classification for civil engineering
applications has been hampered by limited training data (Gao
& Mosalam, 2018). In general, a single classification model
can provide reasonable accuracy if the training data covers a
wide range of hidden features. However, even when the size
of the training data is sufficiently large, the classification
model may still not perform well if the training data is not
properly pre-processed to identify the localized damage (Gao
& Mosalam, 2018). For example, an image may contain

Pan et al. 3
multiple damage states where a portion of the structure has
fractured, while the other part of the structure remains
undamaged.
Moreover, although region-based CNN methods have
been widely applied in civil engineering, it remains almost
little to none attempt of the regression-based detection
methods such as YOLOv2, for structural damage detection.
Therefore, the main contributions of this paper are: (a)
established component training data that follow the codified
damage state classification of the RC columns; (b)
successfully developed and applied YOLOv2 object
detection network to identify the critical damage feature of
RC columns; (c) proposed and successfully implemented the
dual CNN methods which incorporate the classification
network and YOLOv2 object detection network to improve
the accuracy achieved by a single classification network; (d)
introduced performance-based assessment framework to
quantify financial losses, which can be used by the decision
makers for rapid emergency management and resources
allocation, thus improving the regional seismic resiliency of
the city.
2 METHODOLOGY
2.1 Rapid performance assessment framework
Figure 1 shows the framework proposed in this study to
quantify the financial loss of the RC buildings after strong
earthquake shaking. First, system-level and component-level
images for a single building are collected, which can be
achieved by unmanned aerial vehicles (UAVs) (Ham, Han,
Lin, & Golparvar-Fard, 2016). In an ideal situation, images
of the systems and components should be taken from
multiple views and the most severe damage status should be
considered to facilitate the comprehensive evaluation. The
system-level images are assessed by a system-level
classification network to confirm if the building has
collapsed. If the system-level collapse is identified, the
replacement cost of the building should be used. If the
building is identified as non-collapse, the component-level
images are fed into component-level classification and
detection networks. Once the component damage states are
identified, the corresponding repair costs for the components
were identified from the ATC-58 (2007) fragility database.
Finally, the total repair costs of the building are summed up
by adding the total repair quantities from all structural and
non-structural components taking into account their suitable
unit cost distribution. This fragility database is one of the
essential products of ATC-58 project established by the
Applied Technology Council (ATC) in contracts with the
Federal Emergency Management Agency (FEMA) to
develop FEMA P-58 Seismic Performance Assessment of
Buildings, Methodology and Implementation (also known as
Performance-based Earthquake Engineering (PBEE)).
Implementations of the PBEE framework for cost evaluation
of buildings have been widely attempted (Goulet et al., 2007;
Yang, Moehle, Stojadinovic, & Der Kiureghian, 2009;
Mitrani-Resier, Wu, & Beck, 2016). While this study focuses
on the development of dual CNN methods that employs the
state-of-the-art YOLOv2 object detection algorithms to more
accurately classify the structural damage state, it also makes
the first attempt to integrate this fragility database with the
proposed deep learning methods to facilitate cost evaluation
of RC structures.
2.2 CNN classification
In this research, CNNs were used to identify the damage
states of the building and components. Typical CNN
involves multiple types of layers, including Convolution
(Conv) layers, Rectified Linear Unit (ReLU) layers, Pooling
layers, Fully-connected (FC) layers and Loss layer (e.g.
Softmax layer). The Conv layer combined with the
subsequent layer, ReLU, constitute the essential
computational block for CNNs. This is the feature that
distinguishes CNNs from the traditional fully connected
deep learning network. One of the advantages of CNNs is
that it drastically improves the computational efficiency
from the traditional neural network because the number of
training parameters enclosed in the filter of CNNs is
significantly less than the number of weights utilized by fully
connected layers which are the only layers presented in the
traditional feed forward neural network. Besides, CNNs
preserve the spatial locality of pixel dependencies and
enforce the learnable filters to achieve the strongest response
to a local input pattern.
During the forward pass, the output from the previous
layer is convolved with each one of the learnable filters,
which yields a stack of two-dimensional arrays. Applying the
desired nonlinear activation function (such as ReLU) to these
two-dimensional arrays leads to a volume of two-
dimensional activation maps. After a single or multiple
Conv-ReLU blocks, the pooling layer is introduced which is
a form of non-linear down-sampling. The objective of the
pooling layer is to reduce the number of parameters to
Figure 1 Flowchart of cost evaluation scheme

Pan et al. 4
improve the computation efficiency. During the pooling
process, the input image is partitioned into sub-regions
which may or may not overlap with each other. If max
pooling is used, the maximum value of each sub-region is
taken.
Following several Conv-ReLU blocks and pooling layers,
the resulting layer is transposed to an FC layer. The output
can be computed as matrix multiplication followed by a bias
offset, which then substitutes into activation function. For
example, in VGG-19, the CNNs end up with 3 FC layers with
the dimension of 4096, 4096, and 1000, respectively. In
addition, due to the fact that FC layers occupy most of the
parameters in the entire CNN, they are prone to overfitting
which can be alleviated by incorporating dropout layers. The
idea of using dropout layers is to randomly remove FC
layers, which can improve the computation efficiency and
has proven to alleviate the concern for overfitting
(Srivastava, Hinton, Krizhevsky, Sutskever, &
Salakhutdinov, 2014). In VGG-19, 50% dropout is applied
to the FC layers. Finally, the output of the last FC layer is
passed to a Loss layer (i.e. Softmax in this study) which
determines the probability of each class (i.e. how confidently
the model thinks the input image being each class). The
result of the classification is recognized for the output with
the highest probability for each class.
2.3 System-level collapse recognition
Based on the CNNs presented, the status of the reinforced
concrete building can be classified as collapse or non-
collapse. Multiple pre-trained models can be used to
facilitate the training process. In this study, transfer learning
from the three pretrained models including AlexNet
(Krizhevsky, Sutskever, and Hinton, 2012), VGG-19
(Simonyan & Zisserman, 2014) and ResNet-50 (He, Zhang,
Ren, & Sun, 2016) is applied for the binary classification
task. Transfer learning is a new machine learning technique
that takes advantage of certain pretrained models in the
source domain and fine-tunes part of the parameters with a
few labeled data in the target domain, which can greatly
promote the training process in the situation of data scarcity.
In deep learning, there is a trend to develop a deeper and
deeper network which aims at solving more complex task
and improving the performance. However, research has
shown training of deep neural networks becomes difficult
and the accuracy can reach plateau or even degrade (He,
Zhang, Ren, & Sun, 2016). ResNets were developed by He,
Zhang, Ren, & Sun, (2016) to solve the problems where the
shortcut connections were proposed. It has been
demonstrated that training this form of networks is easier
than training plain deep convolutional neural networks and
the problem of accuracy deterioration is resolved. The
complete architecture of ResNet-50 adopted in this study is
shown in Figure 2. The ResNet-50 contains a sequence of
Convolution-Batch Normalization-ReLU (Conv-BN-ReLU)
blocks. Batch normalization is added right after each
convolution and before ReLU activation to stabilize training,
speed up convergence, and regularize the model. After a
series of Conv-BN-ReLU blocks, global average pooling
(GAP) is performed to reduce the dimensionality, which is
then followed by the FC layer associated with softmax
function.
Due to the limited number of images for civil engineering
applications, 686 images are collected from
datacenterhub.org at Purdue University and google images,
of which 240 images are related to the collapse of buildings,
while 446 images of non-collapsed buildings. The image
preprocessing is conducted to reduce the inconsistency in
image classification following the same approach adopted by
Gao & Mosalam (2018). The preprocessed images will be
resized appropriately to 224x224 or 227x227 pixels
(depending on what network is chosen) before being fed into
the CNNs for state and damage classification. The
performance of the model is verified through the training and
validation process. In this case, 80% of the collected images
are chosen as the training data and the rest is chosen as the
testing data. Further, within the training set, 20% of the
images are set as the validation data and the remaining
images are used to train the model. Therefore, 686 × 0.8 ×
0.8 ≈ 439, 492 × 0.8 × 0.2 ≈ 110, and 492 × 0.2 ≈ 137 images
are allocated for training, validation, and testing purposes,
respectively.
Figure 2 Architecture of ResNet-50

Pan et al. 5
2.4 Component-level damage state identification
As per the proposed evaluation scheme depicted in Figure
1, if the RC building is identified as non-collapse, the
subsequent step is to determine the damage state of the
structural components. In this study, the definition of several
damage states for RC structural columns is introduced as
shown in Table 1, which follows the ATC-58 damage state
(DS) statement for reinforced concrete beam-column joints.
Similar evaluation approaches have been shown and
practically implemented for many years as demonstrated by
Nakano, Maeda, Kuramoto, & Murakami, M. (2004) and
Maeda, Matsukawa, & Ito (2014).
The RC columns, the critical gravity supporting
components of the RC buildings, are selected to demonstrate
the component-level classification, detection, as well as cost
evaluation. In this regard, a novel dual CNN-based
inspection approach (Figure 3) is proposed to facilitate the
process. On one hand, the classification model is trained
across all the damage states as defined in Table 1. On the
other hand, localization of steel bars is implemented using
the YOLOv2 object detection approach. The advantage of
the object detection approach is its ability to focus on
damage-sensitive features (i.e. exposed reinforcement bars
in this case) which distinguish DS 3 from DS 0, DS 1 and DS
2. It is noted that the detection of exposed reinforcement is
crucial because most of the tensile stiffness and strength of
the reinforced concrete components are contributed by the
reinforcement. Therefore, CNN-based detection is employed
to reinforce the identification of DS 3 in case the
classification fails to classify it. In fact, from the safety point
of view, identification of components in DS 3 condition is
critical after the event of earthquake because these
components are prone to fail completely in the aftershocks,
which may lead to partial or complete collapse of the
building and consequently significant increase of repair cost,
injuries and death rate. In other words, it is more
conservative to maintain the second object detection network
even if in some rare cases, the final damage state is identified
as DS3 while the ground truth label is one of the others.
In total, there are 2260 images collected from the damage
survey conducted by Sim, Laughery, Chiou, Weng (2018),
EERI Learning from Earthquake Reconnaissance Archive
and Google Image. The number of images for DS 0, DS 1,
DS 2 and DS 3 is 496, 404, 580 and 780, respectively.
Similar as before, image preprocessing and resizing are
applied before training. Also, 80% of the acquired images for
each damage class is chosen as its training set and 20% as
the testing set. The validation set is chosen as 20% of the
training set and the rest of the training set is used to train the
model.
2.4.1 Damage state classification
As shown in Table 1, four DS classes need to be
distinguished. Similar to system-level classification, the
pretrained AlexNet, VGG nets, and ResNet-50 are selected
for transfer learning.
The trained model with the highest test accuracy is
adopted to demonstrate the applicability of the classification
of multiple damage states. The construction of the network
is similar to the previous one except the last three layers, a
fully connected layer, a Softmax layer, and a classification
output layer are updated with new labels and the new number
of classes (i.e. 4 damage states in this case).
2.4.2 Steel reinforcement object detection
In addition to damage state classification, a CNN-based
object detection model is also introduced in this study to
identify steel reinforcement exposed due to concrete
spalling. In comparison to image classification, object
detection is one step further which localizes the object within
an image and predicts the class label of the object. The output
of object detection would be different bounding boxes with
their labels in the image. While R-CNN methods (i.e. R-
CNN, Fast R-CNN, Faster R-CNN) have been widely
attempted in civil engineering applications, they are still
relatively slow for real-time applications. This study
designed and applied a specific YOLOv2 object detection
network for identification of reinforcement exposure.
Compared to R-CNN methods, A detailed comparison of
Figure 3 Flowchart of component damage state inspection
scheme
Table 1 Description of damage state classes
DS
index
Description
0 No damage
1 Light damage: visible narrow
cracks and/or very limited spalling of
concrete
2 Moderate damage: cracks, large
area of spalling concrete cover
without exposure of steel bars
3 Severe Damage: crushing of core
concrete, and or exposed
reinforcement buckling or fracture
Pan et al. 6
object detection networks is presented in Redmon & Farhadi
(2017).
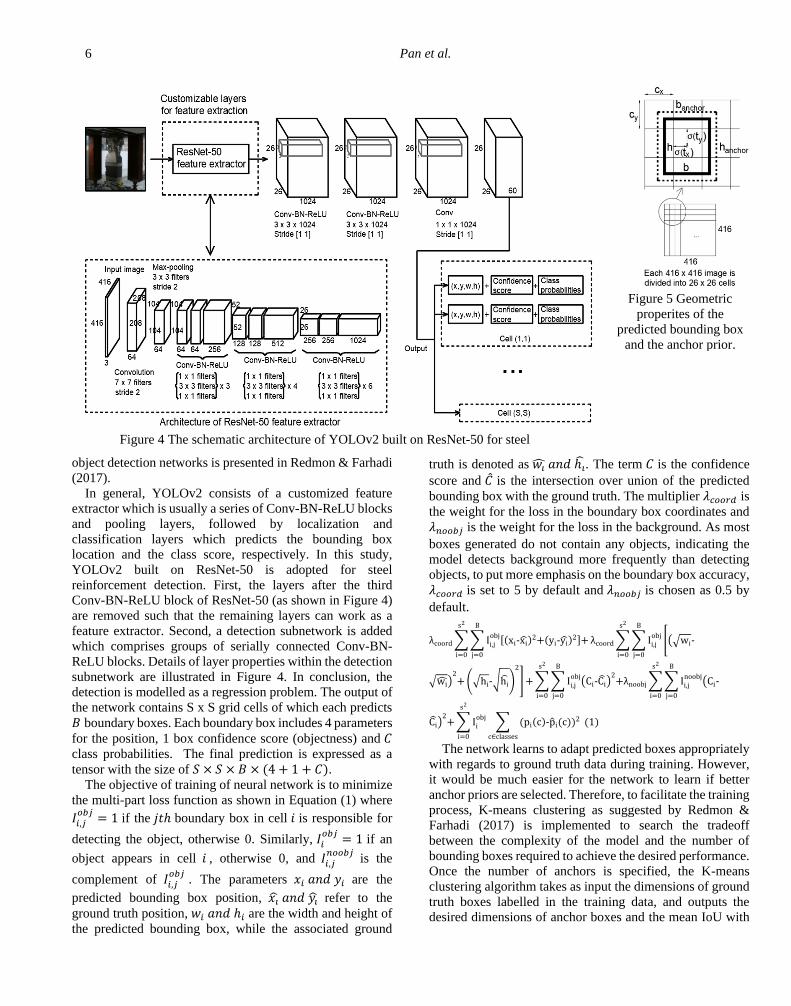
In general, YOLOv2 consists of a customized feature
extractor which is usually a series of Conv-BN-ReLU blocks
and pooling layers, followed by localization and
classification layers which predicts the bounding box
location and the class score, respectively. In this study,
YOLOv2 built on ResNet-50 is adopted for steel
reinforcement detection. First, the layers after the third
Conv-BN-ReLU block of ResNet-50 (as shown in Figure 4)
are removed such that the remaining layers can work as a
feature extractor. Second, a detection subnetwork is added
which comprises groups of serially connected Conv-BN-
ReLU blocks. Details of layer properties within the detection
subnetwork are illustrated in Figure 4. In conclusion, the
detection is modelled as a regression problem. The output of
the network contains S x S grid cells of which each predicts
𝐵 boundary boxes. Each boundary box includes 4 parameters
for the position, 1 box confidence score (objectness) and 𝐶
class probabilities. The final prediction is expressed as a
tensor with the size of 𝑆 × 𝑆 × 𝐵 × (4 + 1 + 𝐶).
The objective of training of neural network is to minimize
the multi-part loss function as shown in Equation (1) where
𝐼𝑖,𝑗𝑜𝑏𝑗
= 1 if the 𝑗𝑡ℎ boundary box in cell 𝑖 is responsible for
detecting the object, otherwise 0. Similarly, 𝐼𝑖𝑜𝑏𝑗
= 1 if an
object appears in cell 𝑖 , otherwise 0, and 𝐼𝑖,𝑗𝑛𝑜𝑜𝑏𝑗
is the
complement of 𝐼𝑖,𝑗𝑜𝑏𝑗
. The parameters 𝑥𝑖 𝑎𝑛𝑑 𝑦𝑖 are the
predicted bounding box position, 𝑥�� 𝑎𝑛𝑑 𝑦�� refer to the
ground truth position, 𝑤𝑖 𝑎𝑛𝑑 ℎ𝑖 are the width and height of
the predicted bounding box, while the associated ground
truth is denoted as 𝑤�� 𝑎𝑛𝑑 ℎ��. The term 𝐶 is the confidence
score and �� is the intersection over union of the predicted
bounding box with the ground truth. The multiplier 𝜆𝑐𝑜𝑜𝑟𝑑 is
the weight for the loss in the boundary box coordinates and
𝜆𝑛𝑜𝑜𝑏𝑗 is the weight for the loss in the background. As most
boxes generated do not contain any objects, indicating the
model detects background more frequently than detecting
objects, to put more emphasis on the boundary box accuracy,
𝜆𝑐𝑜𝑜𝑟𝑑 is set to 5 by default and 𝜆𝑛𝑜𝑜𝑏𝑗 is chosen as 0.5 by
default.
λcoord ∑ ∑ Ii,jobj[(xi-xi)
2+(yi-yi)2]+
B
j=0
s2
i=0
λcoord ∑ ∑ Ii,jobj
[(√wi-
B
j=0
s2
i=0
√wi)2+ (√hi-√hi)
2
] + ∑ ∑ Ii,jobj
(Ci-Ci)2+λnoobj ∑ ∑ Ii,j
noobj(Ci-
B
j=0
s2
i=0
B
j=0
s2
i=0
Ci)2+ ∑ Ii
obj∑ (pi(c)-pi(c))2
c∈classes
s2
i=0
(1)
The network learns to adapt predicted boxes appropriately
with regards to ground truth data during training. However,
it would be much easier for the network to learn if better
anchor priors are selected. Therefore, to facilitate the training
process, K-means clustering as suggested by Redmon &
Farhadi (2017) is implemented to search the tradeoff
between the complexity of the model and the number of
bounding boxes required to achieve the desired performance.
Once the number of anchors is specified, the K-means
clustering algorithm takes as input the dimensions of ground
truth boxes labelled in the training data, and outputs the
desired dimensions of anchor boxes and the mean IoU with
Figure 4 The schematic architecture of YOLOv2 built on ResNet-50 for steel
reinforcement detection
Figure 5 Geometric
properites of the
predicted bounding box
and the anchor prior.

Pan et al. 7
the ground truth data. Clearly, the selection of more anchor
boxes provides higher mean IoU, but also causes more
computational cost. Through the parametric study on the
number of anchors, the relationship between the mean
Intersection-over-Union (IoU) and the number of anchors is
established in Figure 6, which shows the number of 10
anchors is a reasonable choice, where the mean IoU can
reach about 0.8. It should be noted that unlike the original
work by Redmon & Farhadi (2017) where the network
utilizes 5 box priors to classify and localize 20 different
classes, this study only focuses on the detection of one class
(i.e. steel reinforcement), indicating more anchors can be
used without losing too much computational efficiency.
Figure 7 depicts the dimensional properties of each ground
truth box as well as its associated clustering. Anchor
dimensions corresponding to each cluster, determined by K-
means clustering approach are reported in Table 2. These
anchors will be utilized to determine the bounding box
properities as shown in equations (2) to (6). In summary, 𝐵
is chosen as 10. 𝐶 is equal to 1 which corresponds to steel
exposure. As a result, the predicted tensor has the size of
26 × 26 × 60.
The network predicts 10 bounding boxes at each cell in the
output feature map. For each bounding box, 5 coordinates
are predicted including 𝑡𝑥, 𝑡𝑦, 𝑡𝑤, 𝑡ℎ and 𝑡0. As illustrated in
Figure 5, the bold solid box is the predicted boundary box
and the dotted rectangle is the anchor prior. Assuming the
cell is offset from the top left corner of the image by (𝑐𝑥, 𝑐𝑦)
and the anchor box prior has a width of 𝑏𝑎𝑛𝑐ℎ𝑜𝑟 and height
of ℎ𝑎𝑛𝑐ℎ𝑜𝑟 , then equations (2) to (6) can be derived.
Equations (2)-(3) predict the location of the bounding box
and (4)-(5) predict the dimensions of the bounding box based
on anchor box dimensions. Equation (6) is related to
objectness prediction involves the IoU of the ground truth
and the proposed box, and the conditional probability of the
class given that there is an object.
𝑏𝑥 = 𝜎(𝑡𝑥) + 𝑐𝑥 (2)
𝑏𝑦 = 𝜎(𝑡𝑦) + 𝑐𝑦 (3)
𝑏 = 𝑏𝑎𝑛𝑐ℎ𝑜𝑟𝑒𝑡𝑤 (4)
ℎ = ℎ𝑎𝑛𝑐ℎ𝑜𝑟𝑒𝑡ℎ (5)
Pr(𝑜𝑏𝑗𝑒𝑐𝑡) ∗ 𝐼𝑜𝑈(𝑏, 𝑜𝑏𝑗𝑒𝑐𝑡) = 𝜎(𝑡0) (6)
Similar to other CNN models, the YOLOv2 is trained by
back-propagation and stochastic gradient descent (SGD).
The learning rate is constant and set to 10−4 and mini-batch
size is set to 16. The input image size is 416 x 416, which is
identical to what has been adopted by Redmon & Farhadi
(2017) for finetuning detection subnetwork. The training and
testing images of YOLOv2 are taken separately from the DS
3 images which have been used in training and testing of the
DS classification model. Data augmentation such as
cropping, flipping, small rotation is applied such that the
augmented images still contain the object that needs to be
detected. The training is implemented in MATLAB R2019a
on two computers: Alienware Aurora R8 (a Core i7-9700K
@ 3.60 GHz, 16 GB DDR4 memory and 8 GB memory
GeForce RTX 2070 GPU) and a Lenovo Legion Y740 (a
Figure 6 Relationship between Mean IoU and number of
dimension priors
Figure 7 Illustration of K-means clustering results with 10
anchor sizes
Table 2 Selection of Anchor properties
Group 1 2 3 4 5 6 7 8 9 10
Width
[pixels] 104 174 174 107 105 67 274 208 138 54
Height
[pixels] 98 309 132 285 167 206 338 213 199 77

Pan et al. 8
Core i7-8750H @2.20 GHz, 16 GB DDR4 memory and 8
GB memory GeForce RTX 2070 max-q GPU).
2.4.3 Damage state determination
Post-earthquake cost evaluation of the RC building
strongly relies on the classification accuracy of damage state.
A single classification model generally performs well if
trained on the large dataset which covers a wide range of
hidden features. Besides, it is required the image scene is
properly pre-processed such that the targeted region (i.e. RC
column with/without damage in this study) dominates the
entire image. Moreover, the classification model may not
perform well if different classes have obvious shared
features. In case of multiple irrelevant objects in the
background or a column with multiple damage features
presented in a single image (i.e. crack feature is shared by
DS 1, DS2 and DS3; the spalling feature is shared by DS2
and DS3), the classification model may fail to identify the
damage state class correctly. For example, an image of
column is shown in Figure 8 that shows a lot of small cracks
and small spalling, and at the same time also presents
exposure of evident steel bars concentrated in relatively
small regions, the classification model fails to identify it as
DS 3 (i.e. ground truth label) in our experiments. This is
interpretable because in this case, the damage features of DS
1, DS 2 and DS 3 are all included in one single image, leading
to the fact that the predicted probability for DS 3 is not the
highest. This is the moment when detection of steel bars is
needed to reinforce the severe damage state identification for
DS 3 where the exposed reinforcement needs to be
specifically captured.
In this study, the results of the classification model
including the label and its associated probability are
obtained. Meanwhile, the reinforcement detection model
checks the existence of exposed steel bars. The final decision
on the damage state is taking advantage of both outcomes
from the classification model and object detection model. As
shown in Figure 3, each image is evaluated by the two
models in parallel. For a given image, it is first resized to fit
the size of input layers of the classification networks and
object detection networks, respectively. The classification
model predicts the probability of being each damage state
and takes the one with the highest probability as the result.
Meanwhile, the object detection model aims at detecting the
exposed steel bars. If the steel bars are not detected, the
classification result is directly output as the final inspection
outcome. If the steel bars are captured by the detection
model, then DS 3 should be returned as the final decision.
The proposed dual CNN-based framework builds on the
traditional damage classification model, and extends the
evaluation scope by analyzing the local details (i.e. steel bars
in this case). The object detection model does not change the
fundamental diagnosis logic of the classification model but
reinforces the identification of DS 3 through localization of
exposed bars on top of the classification model. This comes
from three bases. First, object detection is a more complex
task than classification because it involves both localizing
and classifying the target in the scene. Solely relying on
object detection results is more likely to lower the overall
evaluation accuracy (potentially caused by insufficient
recall). Second, there are some other damage features of DS
3 such as crushing of concrete, substantial shear failure
mechanism while the proposed object detection model is
trained to detect exposed steel bars only. The identification
of such multiple features still partly relies on the
classification model. Third, steel reinforcement is one of the
most essential load-carrying components in RC columns.
The proposed detection network of steel bars introduces one
redundancy to reinforce the identification of the most severe
damage case which is more likely to cause an unexpected
system failure in response to aftershocks, and consequently
higher chances of injuries and death, as well as substantial
repair cost and longer repair time.
2.5 Cost evaluation framework
Once the damage state is identified, the repair costs can be
calculated using the fragility data presented in the FEMA P-
Figure 8 Sample images of RC columns that
classification model wrongly identifies as DS 2 while
ground truth is DS3

Pan et al. 9
58 project (ATC-58, 2007). Table 3 shows an example of the
damage state and repair cost for the RC column specified in
FEMA P-58 project. The dispersion is defined as the
standard deviation of the logarithmic value of the cost (i.e.
𝜎).
FEMA P-58 divided all vulnerable structural components,
nonstructural components into fragility groups and
performance groups. A fragility group is defined as a group
of components, that have similarity in construction and
installation techniques, modes of damage, probability of
inducing damage modes as well as damage consequences.
Besides, a performance group is a subset of fragility group
components that are subjected to the same earthquake
demands such as story drift or acceleration at a specific floor,
in a specific direction.
The consequence function for repair cost as defined by
FEMA P-58 is shown in Figure 9. The minimum cost refers
to the unit cost to conduct a repair action, considering all
possible economies of scale (which corresponds to
maximum quantity) and operation efficiencies. On the
contrary, the maximum cost is the unit cost with no benefits
from scale and operation efficiencies, which corresponds to
the minimum quantity. If needed, unit repair costs
uncertainties can be accounted for using normal or
lognormal distribution.
In this study, the cost evaluation scheme is inspired by part
of the seismic performance assessment methodology from
FEMA P-58. To initiate the proposed cost evaluation
scheme, the global images of the building should be assessed
by the global classification model to identify whether the
building experiences collapse. If collapse occurs, the
replacement cost of the building is reported. If the building
does not have global failure, the damage state inspection
approach is continued. In this case, the images of
components are processed by the local damage classification
model and object detection model in parallel to identify the
damage state. The cost of the component is retrieved based
on the damage state identified. Finally, the total repair cost
of the building is calculated as the sum of each performance
group which contains structural or non-structural
components.
𝑇𝑜𝑡𝑎𝑙 𝑟𝑒𝑝𝑎𝑖𝑟 𝑐𝑜𝑠𝑡 = ∑ ∑ ∑ 𝐶𝑖,𝑗,𝑘(~𝑙𝑜𝑔𝑁(𝜇, 𝜎2))
𝑛
𝑘
𝑚
𝑗
𝑙
𝑖
(7)
Where 𝑙 denotes the number of fragility groups, 𝑚
denotes the number of performance groups and 𝑛 denotes the
number of components within each performance group. The
term 𝐶𝑖,𝑗,𝑘 is the repair cost drawn from the normal or
lognormal distribution based on the identified damage state.
Finally, the Monte Carlo process is repeated in accordance
with the assumed unit cost distribution for a large number of
realizations, of which each represents one total loss value.
These realizations are sorted in ascending order and a
lognormal distribution is fitted to facilitate the calculation of
the probability that total loss will be less than any specific
value. The results are presented in a loss curve which can be
used for risk management decisions.
3 EXPERIMENTS AND RESULTS
3.1 System-level failure classification
This subsection presents the results from three different
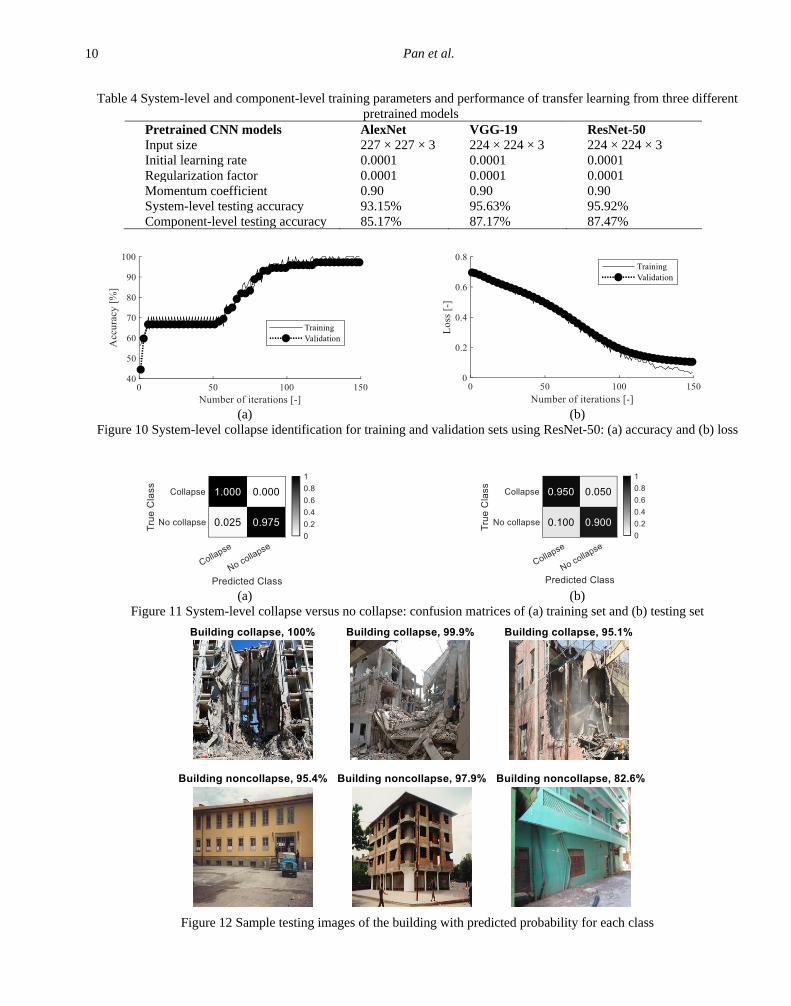
pretrained models as shown in Table 4. Although the testing
accuracy among all three pretrained models is relatively
close, the ResNet-50 which has the deepest architecture,
yields slightly higher accuracy than the other two CNN
models. The loss and accuracy of ResNet-50 during training
are presented in Figure 10. Both the training and validation
accuracy exceeds 90% after around 80 epochs of training and
approaches 100% at the end. It is generally acknowledged
that the validation dataset can provide an unbiased
assessment of a model fit on the training dataset (Krizhevsky,
Sutskever, and Hinton, 2012; He, Zhang, Ren, & Sun, 2016).
Increase in the error on the validation dataset is a sign of
overfitting to the training dataset. A high and stable
validation accuracy of the validation is observed in Figure 10
which demonstrates the applicability of the system-level
classification model for collapse identification. Figure 11
compares the confusion matrices (Kohavi & Provost, 1998)
between training and testing results. For instance, 95% of the
testing images which have ground-truth labels as collapse are
successfully predicted while only 5% of these images are
misclassified as “no collapse”. Moreover, sample testing
images with probability for its associated class are shown in
Figure 12. The trained model can predict the correct class for
the images with high probability.
Table 3 Mean value and dispersion of repair cost of
reinforced concrete column (e.g. component ID:
B1041.031a) at each damage state (ATC-58, 2007)
Damage
state index
Mean Cost
(USD$) at
minimum
quantity
Mean Cost
(USD$) at
maximum
quantity
Dispersion
DS 0 0 0 0
DS 1 25704 20910 0.39
DS 2 38978 25986 0.32
DS 3 47978 31986 0.3
Figure 9 Typical consequence function for repair
costs
Pan et al. 10
Table 4 System-level and component-level training parameters and performance of transfer learning from three different
pretrained models
Pretrained CNN models AlexNet VGG-19 ResNet-50
Input size 227 × 227 × 3 224 × 224 × 3 224 × 224 × 3
Initial learning rate 0.0001 0.0001 0.0001
Regularization factor 0.0001 0.0001 0.0001
Momentum coefficient 0.90 0.90 0.90
System-level testing accuracy 93.15% 95.63% 95.92%
Component-level testing accuracy 85.17% 87.17% 87.47%
(a) (b)
Figure 10 System-level collapse identification for training and validation sets using ResNet-50: (a) accuracy and (b) loss
(a) (b)
Figure 11 System-level collapse versus no collapse: confusion matrices of (a) training set and (b) testing set
Figure 12 Sample testing images of the building with predicted probability for each class
Pan et al. 11
(a) (b)
Figure 13 Component-level DS classification for training and validation sets using ResNet-50: (a) accuracy and (b) loss
(a) (b)
Figure 14 Component-level damage state identification: confusion matrices of (a) training (left) and (b) testing set.
Figure 15 Reasonable prediction of sample testing images of the building with predicted probability for each class
Figure 16 Unreasonable prediction of sample testing images with ground truth of “Severe Damage” as shown in Figure 8
Pan et al. 12
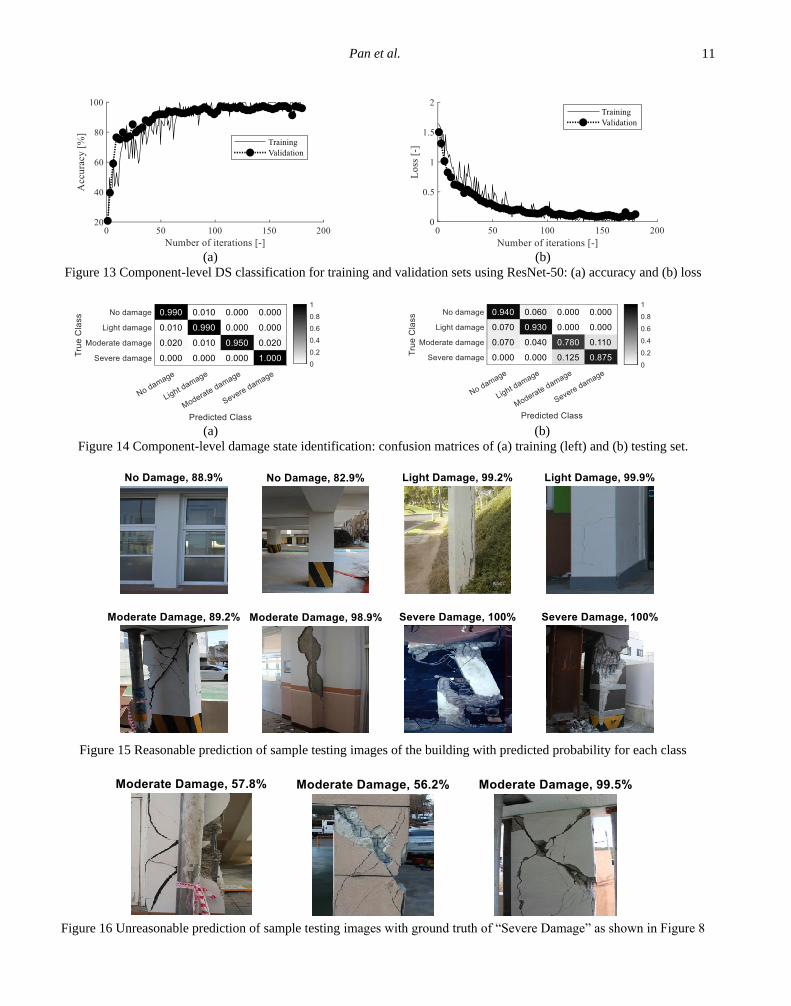
3.2 Component-level damage state identification
3.2.1 Damage state classification
Similar to the system-level failure classification, Table 4
presents the identical training parameters and performance
comparison of three different pretrained models (AlexNet,
VGG-19, ResNet-50) for the classification of the component
damage states. In general, all three models have high
accuracy, while the ResNet-50 has slightly higher accuracy
than AlexNet and VGG-19. The loss and accuracy for
ResNet-50 during the training process are presented in
Figure 13, which shows both the training and validation
accuracy are approaching 100% at the end. The performance
of the trained model is confirmed by the confusion matrix for
training and testing as shown in Figure 14. Figure 15 shows
the classification of a few sample images with correct
prediction. The results show that the trained model is able to
classify different damage states with reasonably high
accuracy, although the classification accuracy with respect
to moderate damage (i.e. DS 2) and severe damage (i.e. DS
3) are not as high as that regarding the class of no damage
(i.e. DS 0) and light damage (i.e. DS 1). The results reflect
there is an increasing difficulty in detecting damage features
from DS 0 to DS 3. Basically, there is no damage feature in
DS 0 when RC columns are in almost perfect condition in
which case the trained CNN model only needs to identify
column profile without any extra damage features. Similarly,
only cracks and very limited spalling are enclosed in DS 1,
where slightly more damage features are introduced
compared to DS 0. However, more features are usually
observed in DS 2, such as light or severe cracks and a large
area of spalling. In the case of DS 3, the model performs
reasonably well to detect its own damage features which
include exposure of significant length of steel bars, crushing
of concrete and buckling or fracture of reinforcement.
However, it occasionally misclassifies the damage state as
DS 2, while the ground truth is DS 3 (Figure 16). There are
two potential reasons. First, DS 2 and DS 3 have many
common damage features, such as cracks and a large amount
of concrete spalling. Second, exposure of steel reinforcement
is not evident in some cases while cracks or significant
spalling may be dominant the entire image (Figure 8). To
overcome such deficiency, a novel object detection
technique is implemented and combined with the
classification technique to identify the damage states (Figure
3). Details of the integrated method are described in Session
3.2.3.
3.2.2 Steel reinforcement object detection
This subsection presents the results regarding the
detection of exposed longitudinal reinforcement in RC
columns to demonstrate the applicability of YOLOv2 in this
scenario. The performance of an object detector is usually
evaluated using a precision-recall curve (Everingham, Van
Gool, Williams, Winn, & Zisserman, 2010). A low false
positive rate leads to high precision and low false negative
rate results in a high recall. In other words, a large area under
the recall-precision curve indicates the high performance of
the detector with both high recall and precision. A detector
with high recall but low precision retrieves many results, but
most of its predicted labels are incorrect (e.g. incorrect
bounding box locations, low IoU). A detector with high
precision but low recall can localize the object very
accurately once the object is successfully recalled, but only
a very few results can be recalled. The average precision
(AP) is often used to quantify the performance of an object
detector (Girshick, 2015; Ren, He, Girshick, & Sun, 2017),
which is determined as the area under the precision-recall
curve. Mean AP (mAP) is defined as the mean of calculated
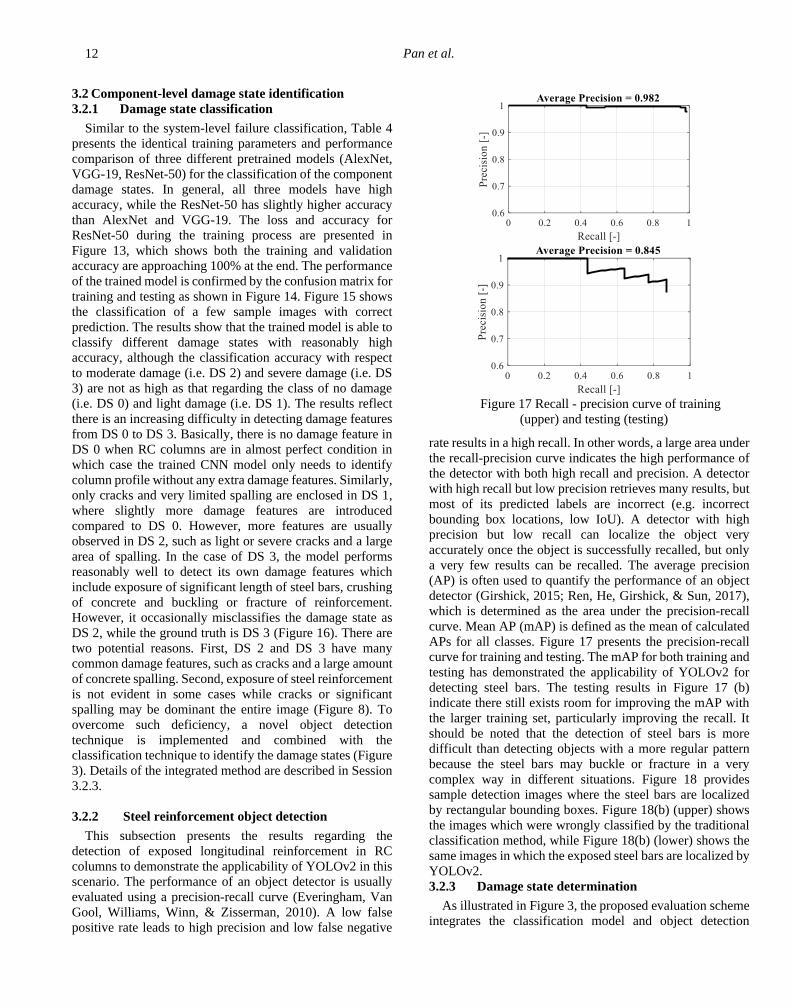
APs for all classes. Figure 17 presents the precision-recall
curve for training and testing. The mAP for both training and
testing has demonstrated the applicability of YOLOv2 for
detecting steel bars. The testing results in Figure 17 (b)
indicate there still exists room for improving the mAP with
the larger training set, particularly improving the recall. It
should be noted that the detection of steel bars is more
difficult than detecting objects with a more regular pattern
because the steel bars may buckle or fracture in a very
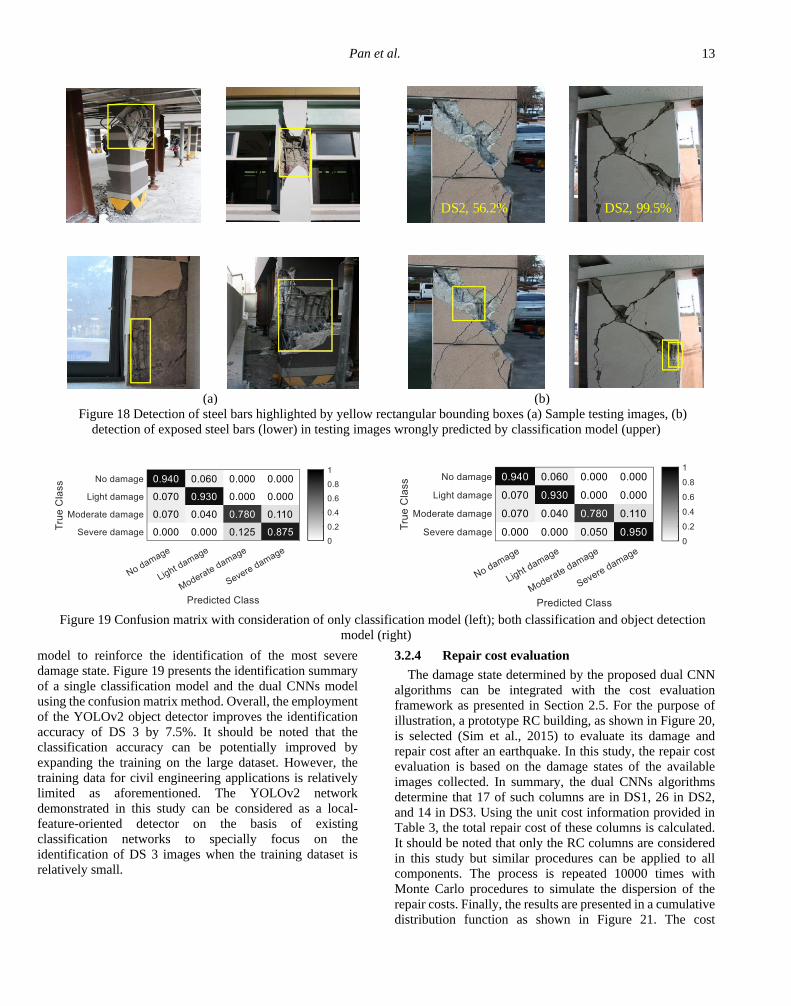
complex way in different situations. Figure 18 provides
sample detection images where the steel bars are localized
by rectangular bounding boxes. Figure 18(b) (upper) shows
the images which were wrongly classified by the traditional
classification method, while Figure 18(b) (lower) shows the
same images in which the exposed steel bars are localized by
YOLOv2.
3.2.3 Damage state determination
As illustrated in Figure 3, the proposed evaluation scheme
integrates the classification model and object detection
Figure 17 Recall - precision curve of training
(upper) and testing (testing)
Pan et al. 13
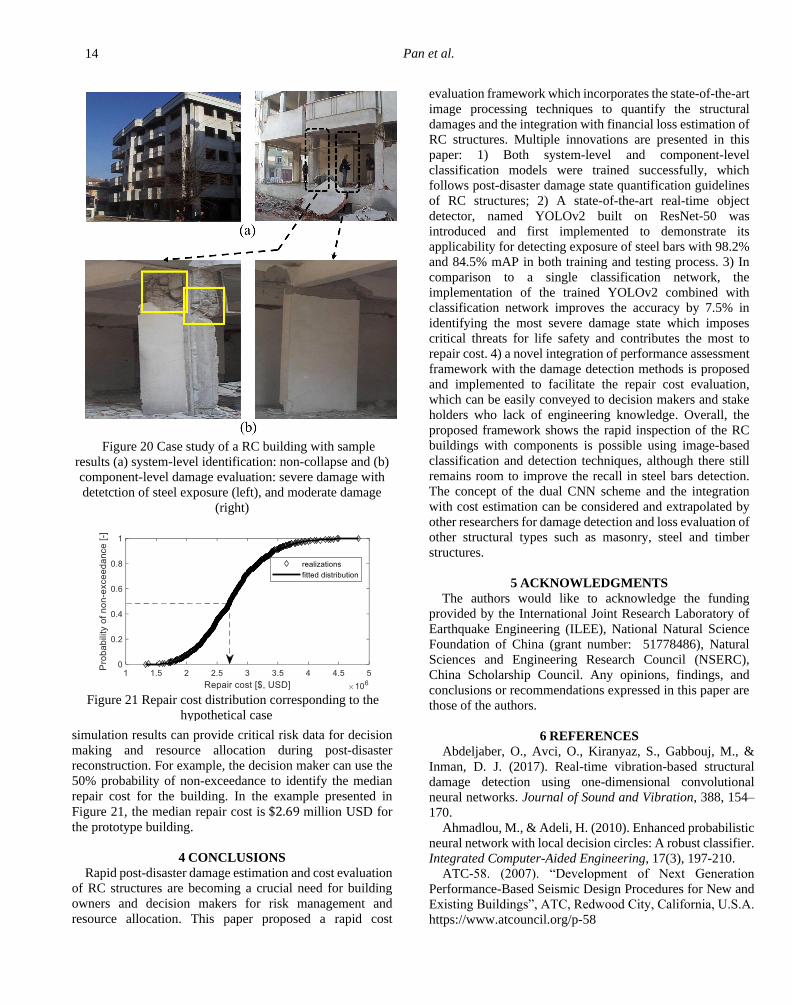
model to reinforce the identification of the most severe
damage state. Figure 19 presents the identification summary
of a single classification model and the dual CNNs model
using the confusion matrix method. Overall, the employment
of the YOLOv2 object detector improves the identification
accuracy of DS 3 by 7.5%. It should be noted that the
classification accuracy can be potentially improved by
expanding the training on the large dataset. However, the
training data for civil engineering applications is relatively
limited as aforementioned. The YOLOv2 network
demonstrated in this study can be considered as a local-
feature-oriented detector on the basis of existing
classification networks to specially focus on the
identification of DS 3 images when the training dataset is
relatively small.
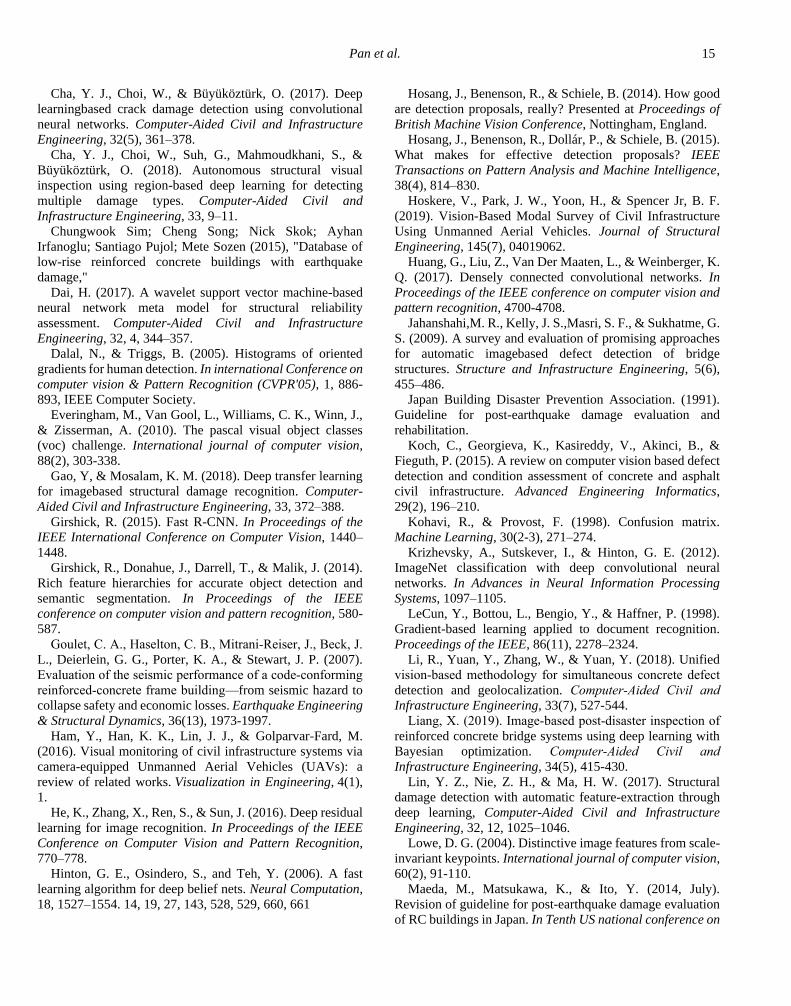
3.2.4 Repair cost evaluation
The damage state determined by the proposed dual CNN
algorithms can be integrated with the cost evaluation
framework as presented in Section 2.5. For the purpose of
illustration, a prototype RC building, as shown in Figure 20,
is selected (Sim et al., 2015) to evaluate its damage and
repair cost after an earthquake. In this study, the repair cost
evaluation is based on the damage states of the available
images collected. In summary, the dual CNNs algorithms
determine that 17 of such columns are in DS1, 26 in DS2,
and 14 in DS3. Using the unit cost information provided in
Table 3, the total repair cost of these columns is calculated.
It should be noted that only the RC columns are considered
in this study but similar procedures can be applied to all
components. The process is repeated 10000 times with
Monte Carlo procedures to simulate the dispersion of the
repair costs. Finally, the results are presented in a cumulative
distribution function as shown in Figure 21. The cost
Figure 19 Confusion matrix with consideration of only classification model (left); both classification and object detection
model (right)
(a) (b)
Figure 18 Detection of steel bars highlighted by yellow rectangular bounding boxes (a) Sample testing images, (b)
detection of exposed steel bars (lower) in testing images wrongly predicted by classification model (upper)
DS2, 56.2% DS2, 99.5%
Pan et al. 14
simulation results can provide critical risk data for decision
making and resource allocation during post-disaster
reconstruction. For example, the decision maker can use the
50% probability of non-exceedance to identify the median
repair cost for the building. In the example presented in
Figure 21, the median repair cost is $2.69 million USD for
the prototype building.
4 CONCLUSIONS
Rapid post-disaster damage estimation and cost evaluation
of RC structures are becoming a crucial need for building
owners and decision makers for risk management and
resource allocation. This paper proposed a rapid cost
evaluation framework which incorporates the state-of-the-art
image processing techniques to quantify the structural
damages and the integration with financial loss estimation of
RC structures. Multiple innovations are presented in this
paper: 1) Both system-level and component-level
classification models were trained successfully, which
follows post-disaster damage state quantification guidelines
of RC structures; 2) A state-of-the-art real-time object
detector, named YOLOv2 built on ResNet-50 was
introduced and first implemented to demonstrate its
applicability for detecting exposure of steel bars with 98.2%
and 84.5% mAP in both training and testing process. 3) In
comparison to a single classification network, the
implementation of the trained YOLOv2 combined with
classification network improves the accuracy by 7.5% in
identifying the most severe damage state which imposes
critical threats for life safety and contributes the most to
repair cost. 4) a novel integration of performance assessment
framework with the damage detection methods is proposed
and implemented to facilitate the repair cost evaluation,
which can be easily conveyed to decision makers and stake
holders who lack of engineering knowledge. Overall, the
proposed framework shows the rapid inspection of the RC
buildings with components is possible using image-based
classification and detection techniques, although there still
remains room to improve the recall in steel bars detection.
The concept of the dual CNN scheme and the integration
with cost estimation can be considered and extrapolated by
other researchers for damage detection and loss evaluation of
other structural types such as masonry, steel and timber
structures.
5 ACKNOWLEDGMENTS
The authors would like to acknowledge the funding
provided by the International Joint Research Laboratory of
Earthquake Engineering (ILEE), National Natural Science
Foundation of China (grant number: 51778486), Natural
Sciences and Engineering Research Council (NSERC),
China Scholarship Council. Any opinions, findings, and
conclusions or recommendations expressed in this paper are
those of the authors.
6 REFERENCES
Abdeljaber, O., Avci, O., Kiranyaz, S., Gabbouj, M., &
Inman, D. J. (2017). Real-time vibration-based structural
damage detection using one-dimensional convolutional
neural networks. Journal of Sound and Vibration, 388, 154–
170.
Ahmadlou, M., & Adeli, H. (2010). Enhanced probabilistic
neural network with local decision circles: A robust classifier.
Integrated Computer-Aided Engineering, 17(3), 197-210.
ATC-58. (2007). “Development of Next Generation
Performance-Based Seismic Design Procedures for New and
Existing Buildings”, ATC, Redwood City, California, U.S.A.
https://www.atcouncil.org/p-58
Figure 21 Repair cost distribution corresponding to the
hypothetical case
Figure 20 Case study of a RC building with sample
results (a) system-level identification: non-collapse and (b)
component-level damage evaluation: severe damage with
detetction of steel exposure (left), and moderate damage
(right)
Pan et al. 15
Cha, Y. J., Choi, W., & Büyüköztürk, O. (2017). Deep
learningbased crack damage detection using convolutional
neural networks. Computer-Aided Civil and Infrastructure
Engineering, 32(5), 361–378.
Cha, Y. J., Choi, W., Suh, G., Mahmoudkhani, S., &
Büyüköztürk, O. (2018). Autonomous structural visual
inspection using region-based deep learning for detecting
multiple damage types. Computer-Aided Civil and
Infrastructure Engineering, 33, 9–11.
Chungwook Sim; Cheng Song; Nick Skok; Ayhan
Irfanoglu; Santiago Pujol; Mete Sozen (2015), "Database of
low-rise reinforced concrete buildings with earthquake
damage,"
Dai, H. (2017). A wavelet support vector machine-based
neural network meta model for structural reliability
assessment. Computer-Aided Civil and Infrastructure
Engineering, 32, 4, 344–357.
Dalal, N., & Triggs, B. (2005). Histograms of oriented
gradients for human detection. In international Conference on
computer vision & Pattern Recognition (CVPR'05), 1, 886-
893, IEEE Computer Society.
Everingham, M., Van Gool, L., Williams, C. K., Winn, J.,
& Zisserman, A. (2010). The pascal visual object classes
(voc) challenge. International journal of computer vision,
88(2), 303-338.
Gao, Y, & Mosalam, K. M. (2018). Deep transfer learning
for imagebased structural damage recognition. Computer-
Aided Civil and Infrastructure Engineering, 33, 372–388.
Girshick, R. (2015). Fast R-CNN. In Proceedings of the
IEEE International Conference on Computer Vision, 1440–
1448.
Girshick, R., Donahue, J., Darrell, T., & Malik, J. (2014).
Rich feature hierarchies for accurate object detection and
semantic segmentation. In Proceedings of the IEEE
conference on computer vision and pattern recognition, 580-
587.
Goulet, C. A., Haselton, C. B., Mitrani‐Reiser, J., Beck, J.
L., Deierlein, G. G., Porter, K. A., & Stewart, J. P. (2007).
Evaluation of the seismic performance of a code‐conforming
reinforced‐concrete frame building—from seismic hazard to
collapse safety and economic losses. Earthquake Engineering
& Structural Dynamics, 36(13), 1973-1997.
Ham, Y., Han, K. K., Lin, J. J., & Golparvar-Fard, M.
(2016). Visual monitoring of civil infrastructure systems via
camera-equipped Unmanned Aerial Vehicles (UAVs): a
review of related works. Visualization in Engineering, 4(1),
1.
He, K., Zhang, X., Ren, S., & Sun, J. (2016). Deep residual
learning for image recognition. In Proceedings of the IEEE
Conference on Computer Vision and Pattern Recognition,
770–778.
Hinton, G. E., Osindero, S., and Teh, Y. (2006). A fast
learning algorithm for deep belief nets. Neural Computation,
18, 1527–1554. 14, 19, 27, 143, 528, 529, 660, 661
Hosang, J., Benenson, R., & Schiele, B. (2014). How good
are detection proposals, really? Presented at Proceedings of
British Machine Vision Conference, Nottingham, England.
Hosang, J., Benenson, R., Dollár, P., & Schiele, B. (2015).
What makes for effective detection proposals? IEEE
Transactions on Pattern Analysis and Machine Intelligence,
38(4), 814–830.
Hoskere, V., Park, J. W., Yoon, H., & Spencer Jr, B. F.
(2019). Vision-Based Modal Survey of Civil Infrastructure
Using Unmanned Aerial Vehicles. Journal of Structural
Engineering, 145(7), 04019062.
Huang, G., Liu, Z., Van Der Maaten, L., & Weinberger, K.
Q. (2017). Densely connected convolutional networks. In
Proceedings of the IEEE conference on computer vision and
pattern recognition, 4700-4708.
Jahanshahi,M. R., Kelly, J. S.,Masri, S. F., & Sukhatme, G.
S. (2009). A survey and evaluation of promising approaches
for automatic imagebased defect detection of bridge
structures. Structure and Infrastructure Engineering, 5(6),
455–486.
Japan Building Disaster Prevention Association. (1991).
Guideline for post-earthquake damage evaluation and
rehabilitation.
Koch, C., Georgieva, K., Kasireddy, V., Akinci, B., &
Fieguth, P. (2015). A review on computer vision based defect
detection and condition assessment of concrete and asphalt
civil infrastructure. Advanced Engineering Informatics,
29(2), 196–210.
Kohavi, R., & Provost, F. (1998). Confusion matrix.
Machine Learning, 30(2-3), 271–274.
Krizhevsky, A., Sutskever, I., & Hinton, G. E. (2012).
ImageNet classification with deep convolutional neural
networks. In Advances in Neural Information Processing
Systems, 1097–1105.
LeCun, Y., Bottou, L., Bengio, Y., & Haffner, P. (1998).
Gradient-based learning applied to document recognition.
Proceedings of the IEEE, 86(11), 2278–2324.
Li, R., Yuan, Y., Zhang, W., & Yuan, Y. (2018). Unified
vision‐based methodology for simultaneous concrete defect
detection and geolocalization. Computer‐Aided Civil and
Infrastructure Engineering, 33(7), 527-544.
Liang, X. (2019). Image‐based post‐disaster inspection of
reinforced concrete bridge systems using deep learning with
Bayesian optimization. Computer‐Aided Civil and
Infrastructure Engineering, 34(5), 415-430.
Lin, Y. Z., Nie, Z. H., & Ma, H. W. (2017). Structural
damage detection with automatic feature-extraction through
deep learning, Computer-Aided Civil and Infrastructure
Engineering, 32, 12, 1025–1046.
Lowe, D. G. (2004). Distinctive image features from scale-
invariant keypoints. International journal of computer vision,
60(2), 91-110.
Maeda, M., Matsukawa, K., & Ito, Y. (2014, July).
Revision of guideline for post-earthquake damage evaluation
of RC buildings in Japan. In Tenth US national conference on
Pan et al. 16
earthquake engineering, frontiers of earthquake engineering.
Anchorage, Alaska, 21-25.
McCulloch, W. S. and Pitts, W. (1943). A logical calculus
of ideas immanent in nervous activity. Bulletin of
Mathematical Biophysics, 5, 115–133. 14, 15.
Mitrani-Resier, J., Wu, S., & Beck, J. L. (2016). Virtual
Inspector and its application to immediate pre-event and post-
event earthquake loss and safety assessment of buildings.
Natural Hazards, 81(3), 1861-1878..
Nakano, Y., Maeda, M., Kuramoto, H., & Murakami, M.
(2004, August). Guideline for post-earthquake damage
evaluation and rehabilitation of RC buildings in Japan. In 13th
World Conference on Earthquake Engineering (No. 124).
Rafiei, M. H., & Adeli, H. (2017). A new neural dynamic
classification algorithm. IEEE transactions on neural
networks and learning systems, 28(12), 3074-3083.
Rafiei, M. H., & Adeli, H. (2017). A novel machine
learning‐based algorithm to detect damage in high‐rise
building structures. The Structural Design of Tall and Special
Buildings, 26(18), e1400.
Rafiei, M. H., & Adeli, H. (2017). NEEWS: a novel
earthquake early warning model using neural dynamic
classification and neural dynamic optimization. Soil
Dynamics and Earthquake Engineering, 100, 417-427.
Rafiei, M. H., & Adeli, H. (2018). A novel unsupervised
deep learning model for global and local health condition
assessment of structures. Engineering Structures, 156, 598–
607.
Rafiei, M. H., Khushefati, W. H., Demirboga, R., & Adeli,
H. (2017). Supervised Deep Restricted Boltzmann Machine
for Estimation of Concrete. ACI Materials Journal, 114(2).
Rafiei, M.H. and Adeli, H. (2018), “A Novel Machine
Learning Model for Construction Cost Estimation Taking
Into account Economic Variables and Indices,” Journal of
Construction Engineering and Management, 144:12, 2018,
04018106 (9 pages)
Redmon, J., & Farhadi, A. (2017). YOLO9000: better,
faster, stronger. In Proceedings of the IEEE conference on
computer vision and pattern recognition, 7263-7271.
Redmon, J., Divvala, S., Girshick, R., & Farhadi, A.
(2016). You only look once: Unified, real-time object
detection. In Proceedings of the IEEE conference on
computer vision and pattern recognition, 779-788.
Ren, S., He, K., Girshick, R., & Sun, J. (2017). Faster R-
CNN: Towards real-time object detection with region
proposal networks. IEEE Transactions on Pattern Analysis
and Machine Intelligence, 39(6), 1137–1149.
Rosenblatt, F. (1958). The perceptron: A probabilistic
model for information storage and organization in the brain.
Psychological Review, 65, 386–408. 14, 15, 27.
Rumelhart, D., Hinton, G., and Williams, R. (1986).
Learning representations by back-propagating errors. Nature,
323, 533–536. 14, 18, 23, 204, 225, 373, 476, 482.
Sandler, M., Howard, A., Zhu, M., Zhmoginov, A., &
Chen, L. C. (2018). Mobilenetv2: Inverted residuals and
linear bottlenecks. In Proceedings of the IEEE Conference on
Computer Vision and Pattern Recognition (pp. 4510-4520).
Sim, C., Laughery, L., Chiou, T. C., Weng, P. (2018),
"2017 Pohang Earthquake - Reinforced Concrete Building
Damage Survey," https://datacenterhub.org/resources/14728.
Simonyan, K., & Zisserman, A. (2014). Very deep
convolutional networks for large-scale image recognition.
arXiv preprint arXiv:1409.1556.
Soukup, D., & Huber-Mörk, R. (2014). Convolutional
neural networks for steel surface defect detection from
photometric stereo images. International Symposium Visual
Computing, NewYork, NY: Springer International
Publishing, 668–677.
Szegedy, C., Liu, W., Jia, Y., Sermanet, P., Reed, S.,
Anguelov, D., … Rabinovich, A. (2015). Going deeper with
convolutions. In Proceedings of the IEEE Conference on
Computer Vision and Pattern Recognition, 1–9.
Vetrivel, A., Gerke, M., Kerle, N., Nex, F. C., &
Vosselman, G. (2018). Disaster damage detection through
synergistic use of deep learning and 3Dpoint cloud features
derived fromvery high resolution oblique aerial images, and
multiple-kernel-learning, ISPRS Journal of Photogrammetry
and Remote Sensing, 140, 45–59.
Xue, Y. D., & Li, Y. C. (2018). A fast detection method via
region-based fully convolutional neural networks for shield
tunnel lining defects. Computer-Aided Civil and
Infrastructure Engineering, 33, 8.
Yang, T. Y., Moehle, J., Stojadinovic, B., & Der
Kiureghian, A. (2009). Seismic performance evaluation of
facilities: methodology and implementation. Journal of
Structural Engineering, 135(10), 1146-1154.
Yeum, C. M., & Dyke, S. J. (2015). Vision‐based
automated crack detection for bridge inspection. Computer‐
Aided Civil and Infrastructure Engineering, 30, 10, 759-770.
Yeum, C. M., Dyke, S. J., Ramirez, L., & Benes, B. (2016).
Big visual data analysis for damage evaluation in civil
engineering. In International Conference on Smart
Infrastructure and Construction, Cambridge, U.K., June 27–
29.
Zeiler, M. D., & Fergus, R. (2014, September). Visualizing
and understanding convolutional networks. In European
conference on computer vision, 818-833. springer, Cham.
Zhang, A., Wang, K. C. P., Li, B., Yang, E., Dai, X., Peng,
Y., … Chen, C. (2017). Automated pixel-level pavement
crack detection on 3D asphalt surfaces using a deep-learning
network. Computer-Aided Civil and Infrastructure
Engineering, 32(10), 805–819.
Zhou, B., Khosla, A., Lapedriza, A., Oliva, A., & Torralba,
A. (2016). Learning deep features for discriminative
localization. In Proceedings of the IEEE conference on
computer vision and pattern recognition, 2921-2929.
Zhu, Z., & Brilakis, I. (2010). Concrete column recognition
in images and videos. Journal of Computing in Civil
Engineering, 24(6), 478– 487.