postal and telecommunications regulatory …
TRANSCRIPT

POSTAL AND
TELECOMMUNICATIONS
REGULATORY AUTHORITY OF
ZIMBABWE
(POTRAZ)
ABRIDGED POSTAL & TELECOMMUNICATIONS
SECTOR PERFORMANCE REPORT
FOURTH QUARTER 2020
Disclaimer:
This report has been prepared based on data provided by service providers. The information
provided in this quarterly report is subject to alteration in case of any revisions or updates
from the service providers. Whilst the Authority has taken effort to ensure accuracy of the data
contained in this report, it is not liable for the inaccuracy of any information.

1 | P a g e
TABLE OF CONTENTS
LIST OF TABLES ..................................................................................................................... 2
LIST OF FIGURES ................................................................................................................... 2
MAJOR HIGHLIGHTS ............................................................................................................. 4
1. FIXED TELEPHONE SERVICE .......................................................................................... 5
1.1 SUBSCRIPTIONS ........................................................................................................... 5
1.2 FIXED NETWORK TRAFFIC ........................................................................................ 6
1.3 FIXED TELEPHONE REVENUES, INVESTMENT & COSTS ................................... 8
2. MOBILE TELEPHONY ........................................................................................................ 8
2.1 MOBILE SUBSCRIPTIONS ........................................................................................... 8
2.2 MOBILE VOICE TRAFFIC .......................................................................................... 10
2.3 MOBILE INTERNET & DATA .................................................................................... 11
2.4 MOBILE REVENUES, COSTS & INVESTMENT...................................................... 12
2.5 MOBILE TELEPHONY INFRASTRUCTURE ............................................................ 13
2.6 MOBILE MONEY ......................................................................................................... 14
2.6.1 MOBILE MONEY SUBSCRIPTIONS................................................................... 14
2.6.2 MOBILE MONEY TRANSACTIONS ................................................................... 16
3. DATA & INTERNET SERVICES ...................................................................................... 17
3.1 SUBSCRIPTIONS ......................................................................................................... 17
3.2 INTERNATIONAL INTERNET CONNECTIVITY .................................................... 18
3.3 IAP REVENUES & OPERATING COSTS .................................................................. 19
4. POSTAL & COURIER ........................................................................................................ 19
4.1 POSTAL & COURIER VOLUMES .............................................................................. 19
4.2 POSTAL DENSITY ....................................................................................................... 20
5. OUTLOOK .......................................................................................................................... 21

2 | P a g e
LIST OF TABLES
Table 1: Fixed Telephone Subscriptions.................................................................................... 5
Table 2: Fixed Voice Traffic...................................................................................................... 6
Table 3: Active Mobile Subscriptions ....................................................................................... 8
Table 4: Mobile Telephone Traffic .......................................................................................... 10
Table 5: Mobile Network Operating Costs .............................................................................. 13
Table 6: Mobile Base Stations ................................................................................................. 13
Table 7: Active Mobile Money Subscriptions ......................................................................... 14
Table 8: Mobile Money Transactions ...................................................................................... 16
Table 9: Market Share of Mobile Money Transactions ........................................................... 16
Table 10: Active Internet Subscriptions .................................................................................. 17
Table 11: IAP Revenues & Operating Costs ........................................................................... 19
Table 12: Postal and Courier Volumes .................................................................................... 19
LIST OF FIGURES
Figure 1: Decline in Fixed Telephone Subscriptions .............................................................................. 5
Figure 2: Active Fixed Telephone Subscriptions .................................................................................... 6
Figure 3: Fixed Network Traffic ............................................................................................................. 7
Figure 4: Contribution to Revenue by Service ........................................................................................ 8
Figure 5: Mobile Penetration Rate .......................................................................................................... 9
Figure 6: Market Share of Mobile Subscribers ....................................................................................... 9
Figure 7: Voice Traffic Market Share ................................................................................................... 11
Figure 8: Mobile Data & Internet Usage .............................................................................................. 11
Figure 9: Market Share of Internet & Data Traffic ............................................................................... 12
Figure 10: Mobile Revenue Contribution per Service .......................................................................... 12
Figure 11: Market Share of Mobile Base Station Infrastructure ........................................................... 14
Figure 12: Growth in Active Mobile Money Subscriptions .................................................................. 15
Figure 13: Market Share of Active Mobile Money Subscriptions ........................................................ 15
Figure 14: Internet Penetration Rate ..................................................................................................... 17
Figure 15: Market Share of Equipped International Internet Bandwidth Capacity .............................. 18
Figure 16: Market Share of Used International Internet Capacity ........................................................ 18
Figure 17: Postal & Courier Volumes ................................................................................................... 20
Figure 18: Post Offices ......................................................................................................................... 20

3 | P a g e
LIST OF ACRONYMS
2G…………………………..Second Generation
3G………..............................Third Generation
ACPU…................................Average Cost per User
AMPU……………………...Average Margin per User
ARPU…................................Average Revenue per User
ADSL……………………….Asymmetric Digital Subscriber Line
GB…………………………..Gigabyte
LTE…………………………Long Term Evolution
MB………………………….Megabyte
TB…………………………..Terabyte
Mbps……………………….. Megabits per second
VoIP………………………..Voice Over Internet Protocol

4 | P a g e
MAJOR HIGHLIGHTS
The following are the main sector trends for the fourth quarter of 2020 compared to the third
quarter of 2020:
Active fixed telephone lines declined by 1.7% to record 252,067 from 256,356; the fixed
tele-density declined by 0.1% to reach 1.7% from 1.8%.
The total number of active mobile subscriptions increased by 3.2% to reach 13,191,708
from 12,783,785; hence, the mobile penetration rate increased by 2.8% to reach 90.5%
from 87.7% recorded in the previous quarter.
Active Internet and data subscriptions grew by 1.7% to reach 8,875,649 from 8,726,904
recorded in the previous quarter. As a result, the Internet penetration rate increased by 1%
to reach 60.9% from 59.9% recorded in the previous quarter.
Fixed telephone voice traffic grew by 8.3% to record 98.2 million minutes in the fourth
quarter of 2020 from 90.6 million minutes in the third quarter of 2020.
Total mobile voice traffic declined by 3.3% to record 1.51 billion minutes in the fourth
quarter of 2020 from 1.56 billion minutes recorded in the third quarter of 2020
Mobile Internet and data traffic grew by 13.1% to record 16,834TB in the fourth quarter
of 2020 from 14,878TB recorded in the third quarter of 2020.
Used International Outgoing Internet Bandwidth Capacity grew by 27.9% to reach
51,075Mbps from 40,033Mbps; Used International Incoming Bandwidth Capacity also
grew by 6.7% to record 149,665Mbps from 149,665Mbps recorded in the previous
quarter.
Total postal and courier volumes increased by 33.4% to record 396,975 items in the
fourth quarter of 2020 from 297,680 items recorded in the third quarter of 2020.
Total mobile operator revenues grew by 37.5% to record ZWL12.3 billion from ZWL8.94
billion; On the other hand, mobile network operating costs grew by 125.5% to record
ZWL5.7 billion from ZWL2.5 billion recorded in the previous quarter.
Revenue generated by the fixed telephone network grew by 41.7% to record ZWL1.4
billion from ZWL990.4 million; On the other hand, fixed network operating costs
increased by 76.1% to record ZWL1.37 billion from ZWL775.2 million recorded in the
previous quarter.

5 | P a g e
IAP revenues grew by 59.5% to record ZWL4.6 billion from ZWL2.9 billion; meanwhile,
total operating costs for IAPs also grew by 31.6% to record ZWL2.5 billion from
ZWL1.9 billion recorded in the third quarter of 2020.
1. FIXED TELEPHONE SERVICE
1.1 SUBSCRIPTIONS
The total number of fixed telephone lines declined by 1.7% to reach 252,067 as at 31
December 2020, from 256,356 recorded as at 30 September 2020. As a result, the fixed tele-
density declined by 0.1% to reach 1.7% from 1.8%. There was a decline in both residential
and corporate subscriptions as shown in Table 1 below:
Table 1: Fixed Telephone Subscriptions
Subscriber category 3rd Quarter 2020 4th
Quarter 2020 % Growth
Residential 147,398 145,502 -1.3%
Corporate 108,958 106,565 -2.2%
Total Active 256,356 252,067 -1.7%
There has been a consistent decline in total active fixed telephone subscriptions over the past
year as shown in Figure 1 below:
Figure 1: Decline in Fixed Telephone Subscriptions
156,675 152,990 151,784 147,398 145,502
109,059 107,969 108,758 108,958 106,565
265,734 260,959 260,542 256,356 252,067
-
50,000
100,000
150,000
200,000
250,000
300,000
Oct-19 Dec-19 Jan-20 Mar-20 Apr-20 Jun-20 Aug-20 Sep-20 Nov-20 Jan-21
Act
ive
Su
bsc
rip
tio
ns
Residential Subscriptions Corporate Subscriptions Total Active Subscriptions
6 | P a g e
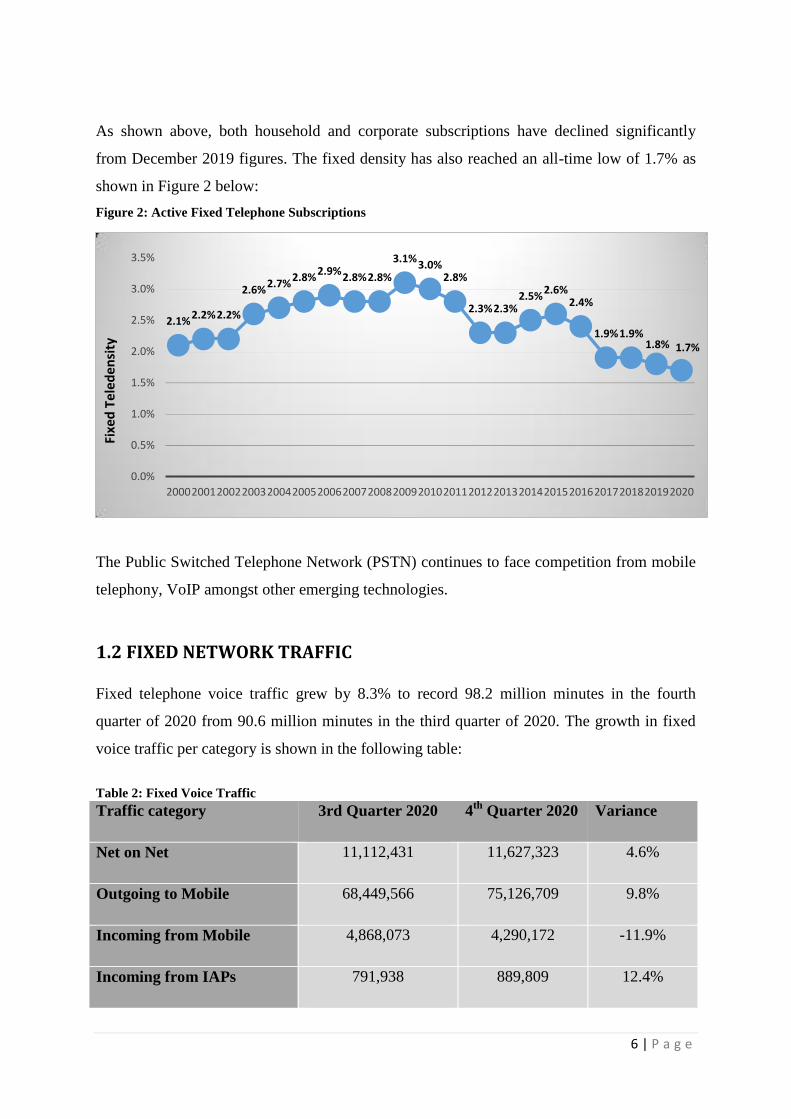
As shown above, both household and corporate subscriptions have declined significantly
from December 2019 figures. The fixed density has also reached an all-time low of 1.7% as
shown in Figure 2 below:
Figure 2: Active Fixed Telephone Subscriptions
The Public Switched Telephone Network (PSTN) continues to face competition from mobile
telephony, VoIP amongst other emerging technologies.
1.2 FIXED NETWORK TRAFFIC
Fixed telephone voice traffic grew by 8.3% to record 98.2 million minutes in the fourth
quarter of 2020 from 90.6 million minutes in the third quarter of 2020. The growth in fixed
voice traffic per category is shown in the following table:
Table 2: Fixed Voice Traffic
Traffic category 3rd Quarter 2020 4th
Quarter 2020 Variance
Net on Net 11,112,431 11,627,323 4.6%
Outgoing to Mobile 68,449,566 75,126,709 9.8%
Incoming from Mobile 4,868,073 4,290,172 -11.9%
Incoming from IAPs 791,938 889,809 12.4%
2.1% 2.2% 2.2%
2.6% 2.7%
2.8% 2.9%
2.8% 2.8%
3.1% 3.0%
2.8%
2.3% 2.3% 2.5%
2.6% 2.4%
1.9% 1.9% 1.8% 1.7%
0.0%
0.5%
1.0%
1.5%
2.0%
2.5%
3.0%
3.5%
2000 2001 2002 2003 2004 2005 2006 2007 2008 2009 2010 2011 2012 2013 2014 2015 2016 2017 2018 2019 2020
Fixe
d T
eled
ensi
ty

7 | P a g e
Outgoing to IAPs 820,702 825,608 0.6%
Total National Voice Traffic 86,042,710 92,759,621 7.8%
International Incoming 3,077,507 3,763,853 22.3%
International Outgoing 1,519,366 1,672,951 10.1%
Total traffic 90,639,583 98,196,425 8.3%
The volume of fixed voice traffic has been gradually improving after the huge slump
recorded in the second quarter of 2020 as shown below:
Figure 3: Fixed Network Traffic
The growth in fixed voice traffic is attributable to the upscaling of business operations and
the increased number of workforce back at work following the relaxation of COVID-19
restrictions in the quarter under review.
-
20,000,000
40,000,000
60,000,000
80,000,000
100,000,000
120,000,000
1st Quarter 2nd Quarter 3rd Quarter 4th Quarter
112,053,302
80,925,112
90,639,583 98,196,425
Min
ute
s o
f U
se

8 | P a g e
1.3 FIXED TELEPHONE REVENUES, INVESTMENT & COSTS
Fixed network revenue grew by 41.7%, whereas operating costs grew by a higher margin of
76.1%. The growth in revenue is attributable to an increase in usage traffic as highlighted in
Section 2.2 above. The revenue contribution of Internet and data to total fixed telephone
revenue increased, whereas the contribution of voice service declined as shown below:
Figure 4: Contribution to Revenue by Service
Data has become the main revenue contributor for the fixed network. The increased adoption
of e-learning and telecommuting has resulted in increased data consumption and revenues,
therefrom.
2. MOBILE TELEPHONY
2.1 MOBILE SUBSCRIPTIONS
There was a 3.2% growth in active mobile telephone subscriptions in the quarter under
review, reaching 13,191,708 from 12,798,298 recorded in the third quarter of 2020. All the
mobile operators recorded an increase in active subscriptions as shown in the table below:
Table 3: Active Mobile Subscriptions
Operator 3rd Quarter 2020 4th
Quarter 2020 Variance (%)
Econet 8,603,084 8,773,300 2.0%
NetOne 3,455,277 3,691,314 6.8%
Telecel 725,424 727,094 0.2%
Total 12,783,785 13,191,708 3.2%

9 | P a g e
The mobile penetration rate increased by 2.8% to reach 90.5% from 87.7% recorded in the
previous quarter. Although an increase in the penetration rate was recorded in the final
quarter of 2020, an annual comparison shows a decline in year-on-year mobile penetration
rate as shown in Figure 5 below:
Figure 5: Mobile Penetration Rate
The decline in the annual penetration rate as shown above, is attributable to the slump in
active mobile subscriptions experienced in the second quarter of 2s020, as the COVID-19
pandemic affected consumption; this saw a reduction in multi-SIM use. Figure 6 below
shows a quarterly comparison of the market share of active mobile subscriptions:
Figure 6: Market Share of Mobile Subscribers
2.3% 2.7% 2.9% 3.1% 3.7% 5.6% 7.3% 9.8% 10.2%
25.1%
50.4%
60.6%
80.0% 84.3%
90.3% 94.4% 94.8%
102.7%
93.1% 90.6% 90.5%
0.0%
20.0%
40.0%
60.0%
80.0%
100.0%
120.0%
2000 2001 2002 2003 2004 2005 2006 2007 2008 2009 2010 2011 2012 2013 2014 2015 2016 2017 2018 2019 2020
Mo
bile
Pe
ne
trat
ion
Rat
e (
%)

10 | P a g e
As shown above, NetOne gained market share by 1%, whereas Econet and Telecel lost
subscriber market share by 0.8% and 0.2%, respectively.
2.2 MOBILE VOICE TRAFFIC
Total mobile voice traffic declined by 3.3% to record 1.51 billion minutes in the fourth
quarter of 2020 from 1.56 billion minutes recorded in the third quarter of 2020. A quarterly
comparison of the mobile voice traffic by category is shown in Table 4 below:
Table 4: Mobile Telephone Traffic
Traffic Category
3
rd Quarter 2020 4
th Quarter 2020 Variance (%)
Net on Net 1,122,142,287 1,096,793,811 -2.3%
Mobile to Fixed 4,816,400 4,290,172 -10.9%
Incoming from Fixed 68,472,673 75,126,709 9.7%
Mobile to Other Mobile (by
termination)
297,125,779 262,408,191 -11.7%
Outgoing to IAPs 2,576,319 2,159,062 -16.2%
Incoming from IAPs 29,898,228 31,764,197 6.2%
TOTAL NATIONAL 1,525,031,686 1,472,542,142 -3.4%
International Incoming 29,865,846 30,548,389 2.3%
International Outgoing 4,456,366 5,188,938 16.4%
Inbound Roaming 470,073 649,132 38.1%
Outbound Roaming 76,118 183,257 140.8%
Total 1,559,900,089 1,509,111,858 -3.3%
Although national traffic declined, international voice and roaming voice traffic grew.
Outbound roaming traffic recorded the biggest growth of 140.8%; this is attributable to
improved intercountry movement of persons following the relaxation of travel restrictions. A
quarterly comparison of the voice traffic market share is shown in Figure 7 below:

11 | P a g e
Figure 7: Voice Traffic Market Share
As shown above, Econet and Telecel lost voice traffic market share by 0.7% and 0.2%,
respectively, whereas NetOne gained market share of voice traffic by 0.9%.
2.3 MOBILE INTERNET & DATA
A total of 16,834 Terabytes of mobile Internet and data was consumed in the fourth quarter of
2020. This represents a 13.1% increase from 14,878 Terabytes consumed in the third quarter
of 2020. The growth in mobile Internet and data usage over the course of the year is
illustrated below:
Figure 8: Mobile Data & Internet Usage
In-bundle data constituted 97.1% of total mobile Internet and data usage, up from 95.1%
recorded in the third quarter of 2020. A quarterly comparison of the market share of mobile
Internet and data usage is shown in Figure 9 below:
0
2,000
4,000
6,000
8,000
10,000
12,000
14,000
16,000
18,000
1st Quarter 2020 2nd Quarter 2020 3rd Quarter 2020 4th Quarter 2020
6,661
10,407
14,878
16,834
Terr
abyt
es
12 | P a g e
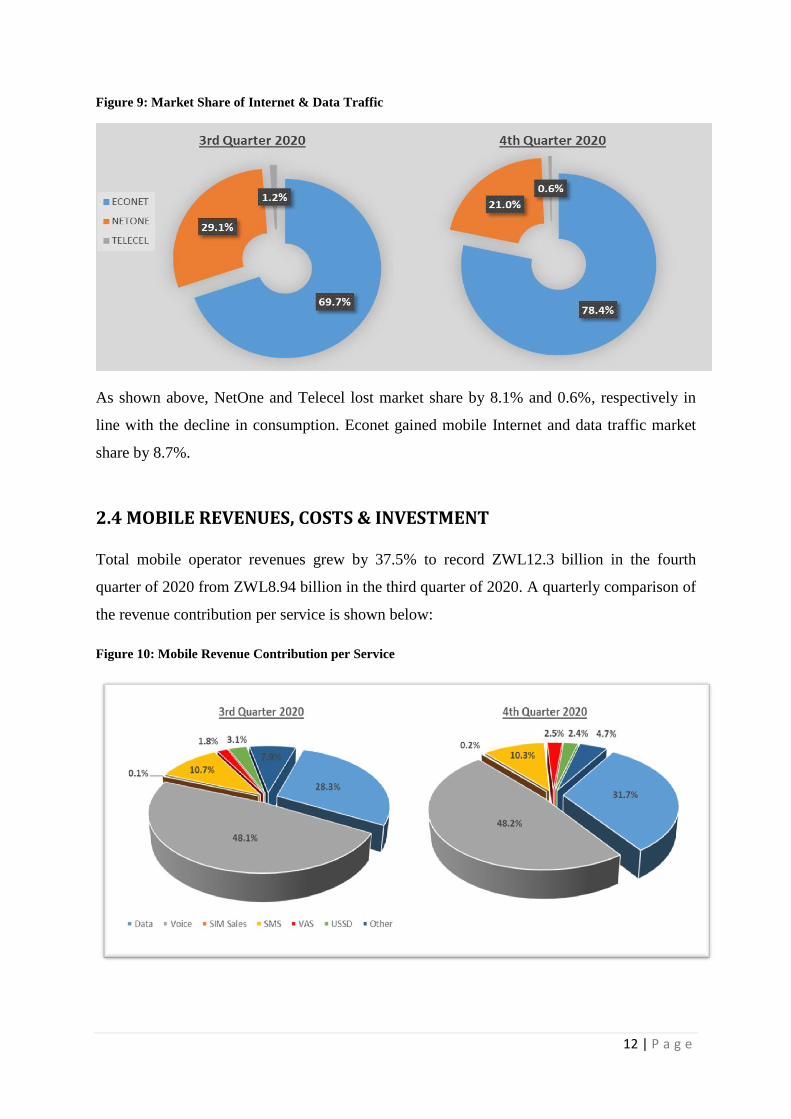
Figure 9: Market Share of Internet & Data Traffic
As shown above, NetOne and Telecel lost market share by 8.1% and 0.6%, respectively in
line with the decline in consumption. Econet gained mobile Internet and data traffic market
share by 8.7%.
2.4 MOBILE REVENUES, COSTS & INVESTMENT
Total mobile operator revenues grew by 37.5% to record ZWL12.3 billion in the fourth
quarter of 2020 from ZWL8.94 billion in the third quarter of 2020. A quarterly comparison of
the revenue contribution per service is shown below:
Figure 10: Mobile Revenue Contribution per Service

13 | P a g e
As shown above, the revenue contribution of Internet and data recorded the biggest growth of
3.4%. Operating costs incurred by mobile operators in the fourth quarter of 2020 are shown
below:
Table 5: Mobile Network Operating Costs
Operator
Operating costs
(exclusive of foreign currency losses)
Operating costs
(inclusive of foreign currency losses)
3rd
Quarter 4th
Quarter Variance 3rd
Quarter 4th
Quarter Variance
Total 2,533,700,425 5,713,516,935 125.5% 16,161,942,218 16,216,960,882 0.3%
Staff costs, depreciation and bandwidth costs constituted the bulk of mobile network
operating costs. Capital expenditure by the mobile operators in the fourth quarter of 2020 was
ZWL74,794,610. This is a marked growth from ZWL9,777,643 invested in the third quarter
of 2020. The investment was mainly in national transmission, as well as computer hardware
and software.
2.5 MOBILE TELEPHONY INFRASTRUCTURE
The growth in base stations per technology and per operator, in the fourth quarter of 2020 is
shown in Table 6 below:
Table 6: Mobile Base Stations
Operator
2G 3G LTE
Q3
2020
Q4
2020
Net
Addition
Q3
2020
Q4
2020
Net
Addition
Q3
2020
Q4
2020
Net
Addition
Econet 2,627 2,627 - 1,640 1,650 10 725 726 1
Telecel 664 664 - 435 437 2 17 17 -
NetOne 1,674 1,674 - 830 839 9 330 343 13
Total 4,965 4,965 - 2,905 2,926 21 1,072 1,086 14
As shown above, twenty-one new 3G and fourteen new LTE eNode Bs were deployed in the
fourth quarter of 2020. Of these, two 3G base stations and three LTE eNode Bs were
deployed in rural areas. The market share of mobile base stations was as follows:

14 | P a g e
Figure 11: Market Share of Mobile Base Station Infrastructure
There was no change in the market share of 2G base stations as no new deployments were
made. There was little change in the market share of 3G base stations as NetOne gained
0.1%, Telecel lost 0.1% and Econet`s market share remained constant. In terms of LTE,
Econet lost 0.8% which was gained by NetOne. Telecel`s market share remained unchanged.
2.6 MOBILE MONEY
2.6.1 MOBILE MONEY SUBSCRIPTIONS
The total number of active mobile money subscriptions as at 31 December 2020, was
6,495,682. This represents a 2.7% growth from 6,325,666 recorded as at 30 September 2020.
The growth in active mobile money subscriptions per operator is shown in the following
table:
Table 7: Active Mobile Money Subscriptions
OPERATOR 3rd
Quarter 2020 4th
Quarter 2020 Variance (%)
ECOCASH 5,452,148 5,553,981 1.9%
ONE MONEY 854,320 936,479 9.6%
TELECASH 19,198 5,222 -72.8%
TOTAL 6,325,666 6,495,682 2.7%
15 | P a g e
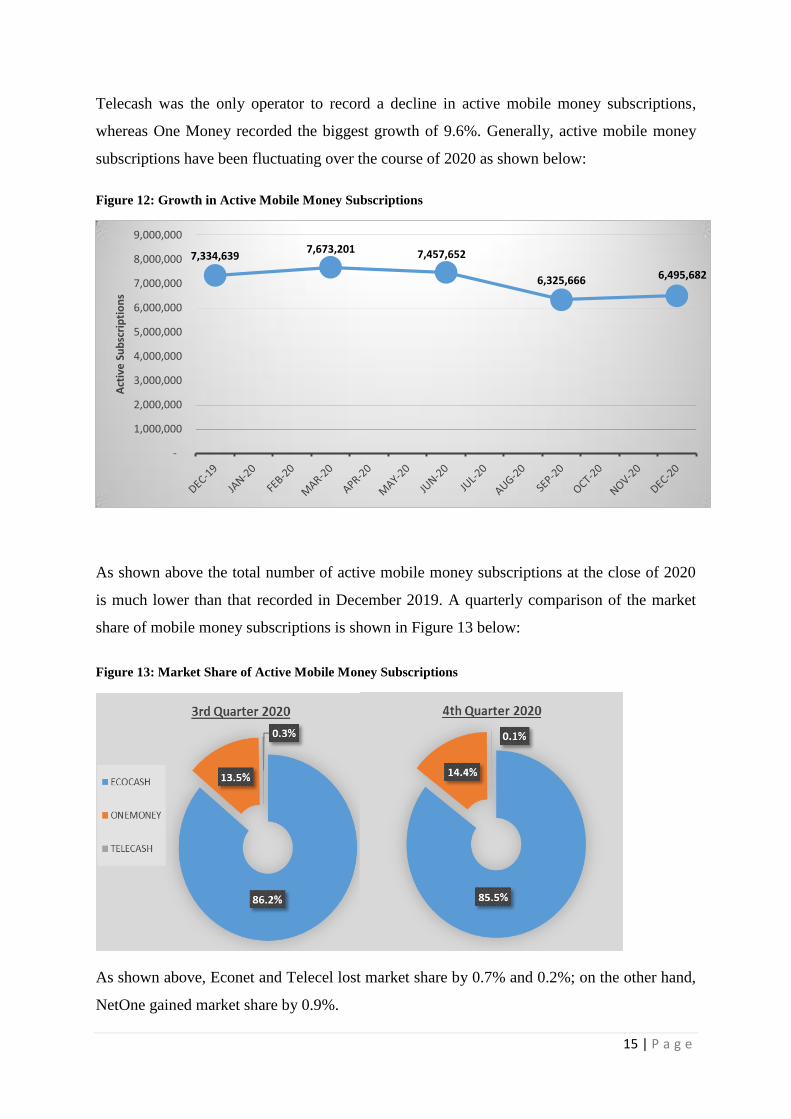
Telecash was the only operator to record a decline in active mobile money subscriptions,
whereas One Money recorded the biggest growth of 9.6%. Generally, active mobile money
subscriptions have been fluctuating over the course of 2020 as shown below:
Figure 12: Growth in Active Mobile Money Subscriptions
As shown above the total number of active mobile money subscriptions at the close of 2020
is much lower than that recorded in December 2019. A quarterly comparison of the market
share of mobile money subscriptions is shown in Figure 13 below:
Figure 13: Market Share of Active Mobile Money Subscriptions
As shown above, Econet and Telecel lost market share by 0.7% and 0.2%; on the other hand,
NetOne gained market share by 0.9%.
7,334,639 7,673,201 7,457,652
6,325,666 6,495,682
-
1,000,000
2,000,000
3,000,000
4,000,000
5,000,000
6,000,000
7,000,000
8,000,000
9,000,000
Act
ive
Su
bsc
rip
tio
ns

16 | P a g e
2.6.2 MOBILE MONEY TRANSACTIONS
Although growth in the value of mobile money transactions was recorded in the quarter under
review, the volume (number) of processed transactions declined as shown in the Table 8
below:
Table 8: Mobile Money Transactions
3rd
Quarter 2020
4th
Quarter 2020 Variance
Airtime, Bill & Merchant
Payments
ZWL12,799,339,473 ZWL19,374,126,186 51.4%
Cross Network Transactions ZWL200,833 ZWL385,831 92.1%
Number of transactions 328,137,616 295,205,189 -10.0%
Cross network mobile money transactions recorded the biggest growth of 92.1%; cross
network mobile money transactions are expected to increase gradually as interoperability is
fully implemented in line with Statutory Instrument 80 of 2020 on Banking Money
Transmission, Mobile Banking and Mobile Money Interoperability Regulations. The market
share of mobile money transactions is shown in Table 9 below:
Table 9: Market Share of Mobile Money Transactions
Operator
Number of Transactions
Value of Transactions
3rd
Quarter 4
th Quarter Variance 3
rd Quarter 4
th Quarter Variance
Ecocash 98.26% 97.98% -0.28% 95.75% 95.79% 0.04%
OneMoney 1.71% 1.98% 0.27% 4.16% 4.10% -0.06%
Telecash 0.03% 0.04% 0.01% 0.09% 0.11% 0.02%
Total 100% 100% - 100% 100% -
As shown above, there was no material change in the market share of the value and volume
of mobile money transactions.
17 | P a g e
3. DATA & INTERNET SERVICES
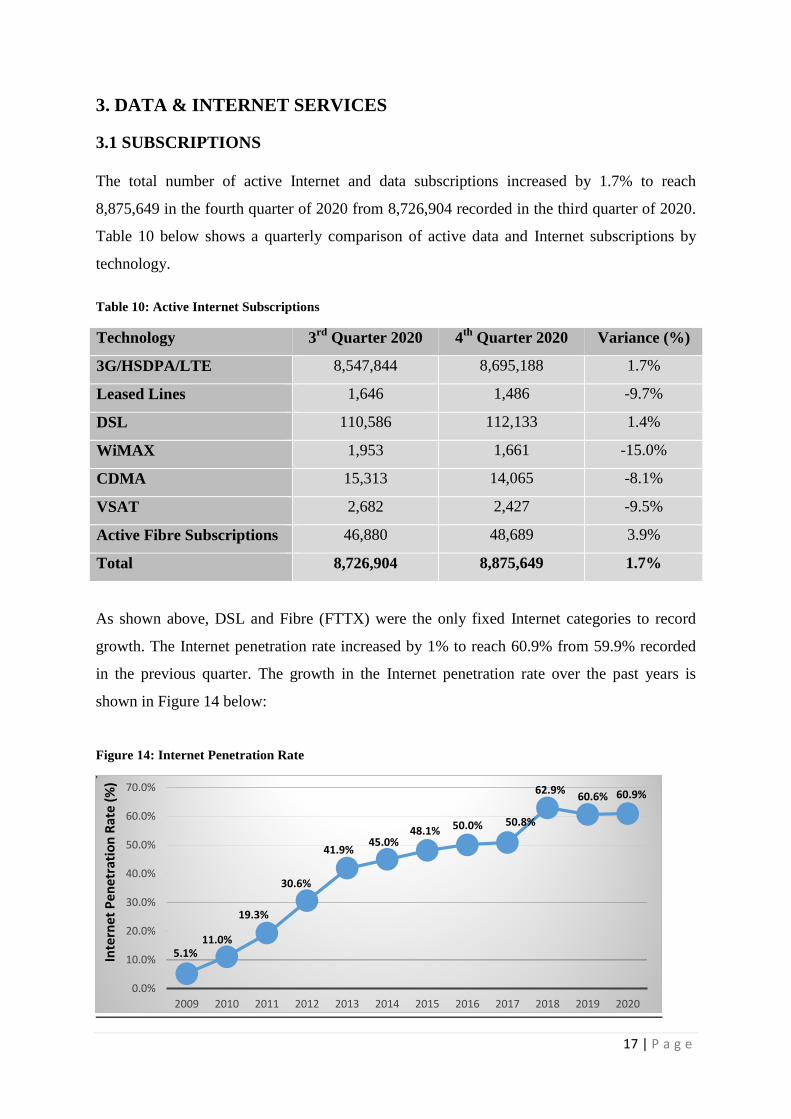
3.1 SUBSCRIPTIONS
The total number of active Internet and data subscriptions increased by 1.7% to reach
8,875,649 in the fourth quarter of 2020 from 8,726,904 recorded in the third quarter of 2020.
Table 10 below shows a quarterly comparison of active data and Internet subscriptions by
technology.
Table 10: Active Internet Subscriptions
Technology 3rd
Quarter 2020 4th
Quarter 2020 Variance (%)
3G/HSDPA/LTE 8,547,844 8,695,188 1.7%
Leased Lines 1,646 1,486 -9.7%
DSL 110,586 112,133 1.4%
WiMAX 1,953 1,661 -15.0%
CDMA 15,313 14,065 -8.1%
VSAT 2,682 2,427 -9.5%
Active Fibre Subscriptions 46,880 48,689 3.9%
Total 8,726,904 8,875,649 1.7%
As shown above, DSL and Fibre (FTTX) were the only fixed Internet categories to record
growth. The Internet penetration rate increased by 1% to reach 60.9% from 59.9% recorded
in the previous quarter. The growth in the Internet penetration rate over the past years is
shown in Figure 14 below:
Figure 14: Internet Penetration Rate
5.1% 11.0%
19.3%
30.6%
41.9% 45.0%
48.1% 50.0% 50.8%
62.9% 60.6% 60.9%
0.0%
10.0%
20.0%
30.0%
40.0%
50.0%
60.0%
70.0%
2009 2010 2011 2012 2013 2014 2015 2016 2017 2018 2019 2020
Inte
rnet
Pe
net
rati
on
Rat
e (
%)

18 | P a g e
3.2 INTERNATIONAL INTERNET CONNECTIVITY
Equipped incoming international Internet capacity increased by 3.1% to reach 333,416Mbps
in the fourth quarter of 2020, from 323,416Mbps recorded in the third quarter of 2020. IAPs
will need to continue expanding their bandwidth capacities to meet the demand. TelOne
gained market share relative to the other Internet Access Providers due to expansion in the
equipped international Internet bandwidth capacity as shown in Figure 15 below:
Figure 15: Market Share of Equipped International Internet Bandwidth Capacity
Used international outgoing bandwidth capacity also increased by 27.5% to reach
51,075Mbps in the quarter under review, from 40,033Mbps in the previous quarter. This
implies growth in the consumption of local content online. Used international incoming
bandwidth capacity also increased by 6.7% to record 159,665 from 149,665 in the third
quarter of 2020. The market share of used international Internet capacity is shown in Figure
16 below:
Figure 16: Market Share of Used International Internet Capacity
60.0%
35.5%
3.2% 1.3%
LIQUID
TELONE
DANDEMUTANDE
POWERTEL

19 | P a g e
Used international Internet bandwidth capacity is expected to continue increasing due to the
growing demand for data and Internet services and the growing availability of local online
content.
3.3 IAP REVENUES & OPERATING COSTS
Internet Access Providers recorded a 59.5% growth in revenues vis-à-vis a 31.6% growth in
operating costs. Capital expenditure grew considerably as IAPs expanded their networks and
capacities. Table 11 below shows a quarterly comparison of IAP revenue, costs and capital
expenditure:
Table 11: IAP Revenues & Operating Costs
3rd
Quarter 2020 4th
Quarter 2020 Variance (%)
Revenue 2,854,599,176
4,553,042,985 59.5%
Operating Costs 1,919,407,734 2,525,290,742 31.6%
Capital Expenditure 87,261,701 291,280,715 233.8%
IAP revenues rose on the back of increased demand for Internet and data.
4. POSTAL & COURIER
4.1 POSTAL & COURIER VOLUMES
Total postal and courier volumes improved by 33.4% to record 396,975 items in the fourth
quarter of 2020 from 297,680 items recorded in the third quarter of 2020. There was a
significant improvement in international courier volumes as shown in Table 12 below:
Table 12: Postal and Courier Volumes
Postal and Courier Service 3rd
Quarter 2020 4th
Quarter 2020 % Growth
Domestic postal letters 156,939 185,702 18.3%
Domestic courier 78,375 91,028 16.1%
International incoming courier 52,185 92,754 77.7%
International outgoing courier 11,181 19,491 74.3%
Total Postal & Courier 297,680 396,975 33.4%

20 | P a g e
The growth in mail volumes, particularly international courier, is attributable to the improved
ease of channelling courier items to and fro several destinations as lockdown policies were
relaxed in various countries in the final quarter of 2020. The application of COVID-19
restrictions affected the channelling of mail and caused a huge dip in mail volumes in the
second quarter of 2020 as shown below:
Figure 17: Postal & Courier Volumes
Despite the growth recorded in the quarter under review, postal and courier volumes are still
way below the quarterly average of over 1 million prior to the COVID-19 era as shown
above.
4.2 POSTAL DENSITY
The number of postal outlets remained at 219; hence, the postal density was 66,539. This
implies that there is one post office per 66,539 people, which is relatively high. The post
offices are broken down as follows:
Figure 18: Post Offices
-
200,000
400,000
600,000
800,000
1,000,000
1,200,000
1,400,000
Q1 2020 Q2 2020 Q3 2020 Q4 2020
1,342,957
232,468 298,680
396,975
Vo
lum
e o
f M
ail
0
50
100
150
200
250
POST OFFICES IN RURAL POST OFFICES IN URBAN TOTAL NUMBER OF POST OFFICES
77
142
219
nu
mb
er
of
po
st o
ffic
es

21 | P a g e
The number of post offices with Internet connection remained 152. More still needs to be
done by the designated postal operator to connect all post offices. This will enable expansion
in the scope of services offered within post offices.
5. OUTLOOK
The COVID-19 pandemic negatively affected various sectors posing economic hardship for
consumers, businesses and communities across the globe. The telecommunications sector was
not an exception. Like most essential sectors, the industry found itself on the frontline, using
all of its capacity to deliver connectivity to homes, businesses and governments, to keep
nations afloat as the pandemic raged on. IP networks in particular, have come to play a life-
saving role in this pandemic, enabling simple data communications to transfer critical
information, provide media and entertainment content, connect remote endpoints, and enable
financial transactions, enterprise operations, government administration, healthcare and
communications.
COVID-19 will not to go away so soon but its spread will decrease owing to ongoing
vaccinations across the globe and at national level. Hence, prospects for economic recovery
are bright especially given the expectation of a maize bumper harvest. This will boost agro-
based production, which has not been the case for a long time. The anticipated increase in
economic activity will create more employment opportunities and increase disposable
incomes, which will help boost aggregate demand.
Resultantly, we are likely to witness a surge in demand for communication services, in
particular data and courier volumes as consumers adapt to the new normal of life. Hence,
digitalisation is likely to be scaled up, with operators repositioning themselves by upgrading
and automating their networks to enhance agility to deliver new services/ applications to meet
fast changing and versatile consumer demands. Coverage only, will no longer be a key
strategic factor, hence we may see operators investing more in faster broadband technologies
such as 4G and probably, 5G. Given the demand in broadband, and the competition in its
provision, there will be renewed focus on customers’ needs by taking a more refined
approach to customer engagement.
Notably, the COVID-19 pandemic has exposed the extent of exclusion and deepened pre-
existing inequalities in access to digital services. The broadband gap between the urban and

22 | P a g e
rural areas is more evident and is an obstacle towards the implementation of programs such
as e learning at national level. Accordingly, we are likely to witness increased efforts
towards efforts to accelerate the speed of connecting underserved areas. Closing this access
gap will be of critical importance in 2021.