potential of high accruals through managed credits
TRANSCRIPT

September 2014
Potential of High Accrual
through Managed Credit
We recommend you read the presentation in entirety

1
Why does an investor invest?
The Prudent Investor manages risk in order to generate return
Aim of an Investor: To generate returns so as to grow his purchasing power
Investment Returns Inflation Destroy purchasing power
Investment Returns Inflation Maintain purchasing power
Investment Returns Inflation Enhance purchasing power
< <
CLICK HERE TO INVEST NOW

This risk is less apparent to an investor as it is an indirect
risk.
India has seen high levels of Consumer Price Inflation in
the past 2.5 years.
2
What are the key Risks, an investor needs to be aware of?
7.55%
11.24%
7.31%
6.00%
7.00%
8.00%
9.00%
10.00%
11.00%
12.00%
1-J
an-1
2
1-M
ar-
12
1-M
ay-1
2
1-J
ul-1
2
1-S
ep-1
2
1-N
ov-1
2
1-J
an-1
3
1-M
ar-
13
1-M
ay-1
3
1-J
ul-1
3
1-S
ep-1
3
1-N
ov-1
3
1-J
an-1
4
1-M
ar-
14
1-M
ay-1
4
CPI Inflation in India
CPI Inflation (Y-o-Y)
An obvious risk from the perspective of an
investor.
In case of some investment products, the value
of investment can rise or fall depending on the
market conditions.
Volatility of Capital is the risk that value of
investment may fall when the investor needs
the capital
While making investment decisions, investors should take into account both risks:
The Volatility of Capital and The Risk of Inflation reducing the purchasing power. Source (latest available date): CPI Inflation RBI – from Jan 2012 – June 2014
VOLATILITY OF CAPITAL RISK OF INFLATION REDUCING THE
PURCHASING POWER
CLICK HERE TO INVEST NOW

What are the Components of Return?
3
The Invested Capital Remains constant, income is
earned in the form of regular payments
The Value of Invested Capital fluctuates with no regular
income
For a detailed explanation of Accrual and Capital Return, please refer Appendix
Capital
Gain/Loss
Accrual
Income Total Return
The Accrual – Capital Appreciation Spectrum
TOTAL
RETURN
The Accrual Component of Return
The Capital Gain/Loss on the Invested Capital
ACCRUAL
CAP
GAIN/LOSS
CLICK HERE TO INVEST NOW

4
What are the Investment Options available?
Typical Investment Options
Bank Fixed Deposits
Where do these Investments lie along the Accrual – Capital Appreciation Spectrum?
Public Provident Fund
National Savings Certificate
Corporate Deposits
Corporate Bonds
Government Bonds
Debt Mutual Funds
Debt Equity Real Estate Gold
Listed Shares
Equity Mutual Funds
Private Equity
Self-Occupied
Let-out Property
Physical Gold
Gold ETFs
CLICK HERE TO INVEST NOW

5
Accrual – Capital Gains Spectrum
TOTAL
RETURN
ACCRUAL
CAP
GAIN/LOSS
Increased Volatility of Capital
• Debt Mutual
Funds
• Corporate
Bonds
• Government
Bonds
• Bank Fixed
Deposits
• PPF
• NSC
• Corporate
Deposits
• Listed
Shares
• Equity
Mutual
Funds
• Private Equity
• Self-Occupied
Real Estate
• Physical Gold
& Gold ETFs
Potential to Generate Higher Returns
Dividend
component of
Equity Products
CLICK HERE TO INVEST NOW

6
How do Debt Mutual Funds Generate α? By Managing Risks
Man
ag
ing
Cre
dit
Ris
k
Managing Interest Rate Risk
Accrual Return can be generated
by investing in fixed-income
securities with Higher Yield
Capital Gains can be generated
by actively managing portfolio*
in line with Interest Rate
movement
*Actively managing Maturity of the portfolio to capitalize on opportunities. For example,
• if market yields are expected to fall, increase the portfolio maturity with an aim to benefit from the rise in value of the bonds.
• If market yields are expected to rise, reduce the portfolio maturity with an aim to minimize capital losses
This slide is for illustration purposes only and should not be construed as an investment strategy / investment advice.
CLICK HERE TO INVEST NOW
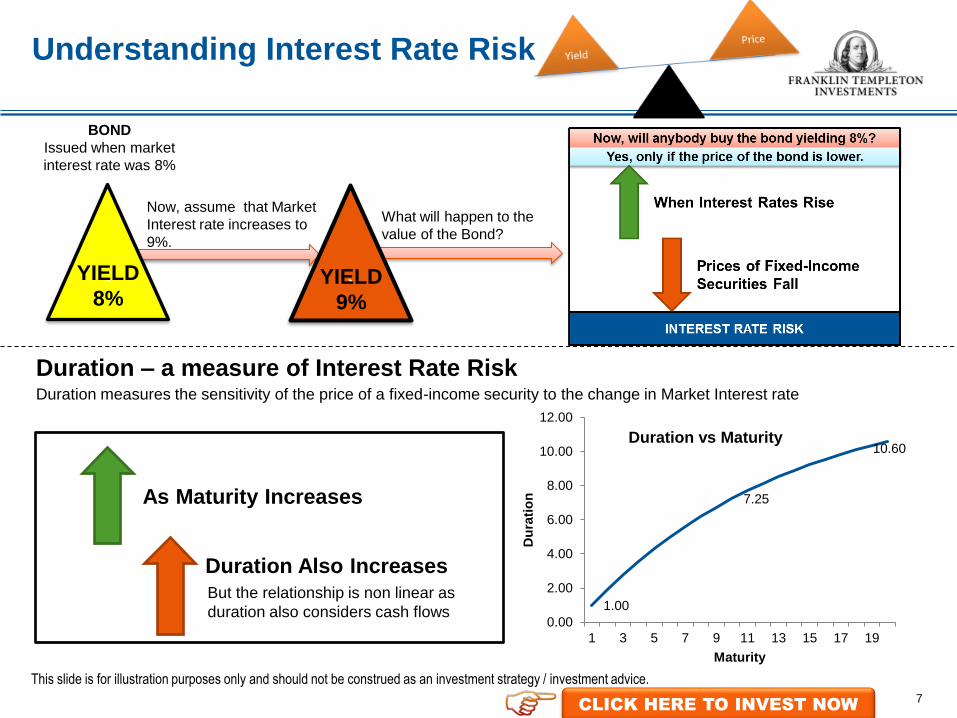
Duration – a measure of Interest Rate Risk Duration measures the sensitivity of the price of a fixed-income security to the change in Market Interest rate
Understanding Interest Rate Risk
1.00
7.25
10.60
0.00
2.00
4.00
6.00
8.00
10.00
12.00
1 3 5 7 9 11 13 15 17 19
Du
rati
on
Maturity
Duration vs Maturity
As Maturity Increases
Duration Also Increases
But the relationship is non linear as
duration also considers cash flows
` YIELD
8% `
YIELD
9%
BOND
Issued when market
interest rate was 8%
Now, assume that Market
Interest rate increases to
9%.
What will happen to the
value of the Bond?
This slide is for illustration purposes only and should not be construed as an investment strategy / investment advice.
7 CLICK HERE TO INVEST NOW

8
Popular Strategies followed by Debt Mutual Funds to generate α
High Accrual-led Strategies aim to generate α by managing Credit Risk while minimizing Interest Rate Risk
High Accrual Led Strategies
TOTAL RETURN
Primary objective is to generate returns by actively
managing portfolio duration based on market
outlook without taking substantial credit risk
Higher Yield is obtained by Managing Credit
Risk through bottom-up security selection
Capital Gains are obtained by Managing
Interest Rate Risk through top-down Macro
analysis
Buy & Hold – Investments are generally held till
Maturity
Active Management based on Market Outlook
Accrual strategies are generally market timing
agnostic
Capital appreciation strategies focus on market
timing
ACCRUAL CAP GAIN/LOSS
TOTAL RETURN
CAPITAL GAINS ACCRUAL
Primary objective is to generate accrual returns
by investing in securities with higher yields and
potential for capital gains over the long term.
Capital Appreciation Led strategies
This slide is for illustration purposes only and should not be construed as an investment strategy / investment advice.
CLICK HERE TO INVEST NOW

9
Why High Accrual Led Strategies?
• Bank Fixed
Deposits
• PPF
• NSC
• Dividend
Paying
Stocks
• Equity
Mutual
Funds
• Private Equity
• Self-Occupied
Real Estate
• Physical Gold
& Gold ETFs
Increased Volatility of Capital
• Debt Mutual
Funds
• Corporate
Bonds
• Government
Bonds TOTAL
RETURN
ACCRUAL
CAP APP
High
Accrual
Led
Strategies
Capital
Appreciation
Led
Strategies Anchor Your Portfolio
Managed Credit Helps identifying securities with Higher Yields
Potential of generating less Volatile Returns across Market
Conditions
Potential of Capital Gains in the Long Term
Advantages of High
Accrual Led Strategies
Potential to Generate Higher Returns
CLICK HERE TO INVEST NOW

10
Higher Yields through Managed Credit But isn’t Managed Credit inherently Risky?
Source
of α
Level of Risk
Credit
Risk
Interest
Rate Risk
Capital
Gains Low High
Cre
dit
Ris
k
Interest Rate Risk
Source
of α Level of Risk
Higher
Yield +
Capital
Gains
Credit Risk Interest
Rate Risk
Medium Low to
Medium
High Accrual Led Strategies
Capital Appreciation Led strategies
through G-Sec/AAA bonds
Level of Risk for High Accrual Led strategies may be relatively lower than the risk for High
Credit (through G-Sec/AAA bonds) Capital Appreciation Led funds
CLICK HERE TO INVEST NOW

11
High Accrual Led Strategies tend to generate stable Returns
The aforesaid portfolios are for illustration purposes only and should not be construed as investment strategies / investment advice. Investors should
consult their investment advisor and construct their portfolios based on their risk appetite, time horizon, investment goals, etc.
Returns – High Accrual Led vs Capital Appreciation Led Strategies Hypothetical Returns over an Interest rate Cycle assuming that Interest Rates increased by 50bps in Years 4,8,10 and
decreased by 50 bps in Years 2,5,6 and remained constant in other years.
Due to lower volatility of Capital and Higher Yields, High Accrual Led
Strategies aim to deliver less volatile returns
-10%
-5%
0%
5%
10%
15%
20%
Year1 Year2 Year3 Year4 Year5 Year6 Year7 Year8 Year9 Year10
Accrual Led Strategy
Accrual Return Capital Return Total Return
-10%
-5%
0%
5%
10%
15%
20%
Year1 Year2 Year3 Year4 Year5 Year6 Year7 Year8 Year9 Year10
Capital Appreciation Led Strategy
Accrual Return Capital Return Total Return
Lower Volatility of Capital Gains/Losses
Higher Yields
Compounded Annual Return: 9.55%
Standard Deviation: 0.71% Compounded Annual Return: 9.55%
Standard Deviation: 5.28%
12
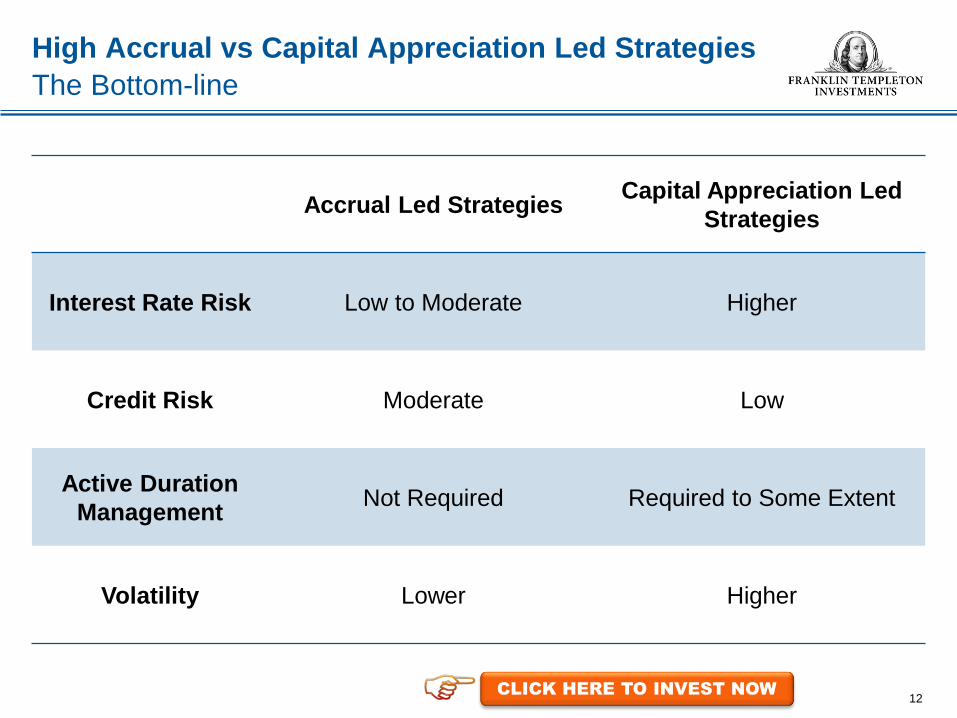
Accrual Led Strategies Capital Appreciation Led
Strategies
Interest Rate Risk Low to Moderate Higher
Credit Risk Moderate Low
Active Duration
Management Not Required Required to Some Extent
Volatility Lower Higher
High Accrual vs Capital Appreciation Led Strategies
The Bottom-line
CLICK HERE TO INVEST NOW

Factor Open-Ended Closed-Ended
Liquidity Management Does the fund need active liquidity management to meet redemptions? Yes No
Portfolio Management Does the fund manager have flexibility to benefit from market opportunities? Yes Limited
(buy & hold strategy)
Maturity profile constraints Does the constraint of maturity date restrict the investment opportunities? No Yes
Relative ease of redemption Can an investor redeem in case of emergency? Yes
Limited (has to be sold over the
stock exchange)
Open-Ended Accrual Led Debt Funds – Stand to benefit
In light of the recent tax-amendments in Union Budget FY15
The change in holding period for Long Term Capital Gain benefit will reduce liquidity pressures/risk,
especially for short term debt funds.
13
Open-ended debt funds: Offer liquidity and LTCG benefit (for >36 months) without any re-investment hassles
Close-ended debt funds: Require re-deployment of maturity receipts for minimum 36 months to qualify for LTCG.
CLICK HERE TO INVEST NOW

8.00%
8.50%
9.00%
9.50%
10.00%
10.50%
11.00%
0 1.5 3 4.5 6 7.5 9
Duration
Yie
ld t
o M
atu
rity
Franklin Templeton’s Fixed Income Product Range
YTM and Duration as of 28-August-2014
14
Past performance may or may not be sustained in the future.
Depending on the investment horizon and risk appetite, an investor can choose any of
Franklin Templeton’s Accrual Led Products
Accrual Led Products
FILDF
FIUBF
FISTIP
FIIOF
FICBOF
FIIBA FIINCF
FIGSF-LT
FIBPDF
FIGSF - CP/PF FISPF
FITMA
CLICK HERE TO INVEST NOW

Product Labels
15
BROWN: Investors understand that their principal will be at high risk
YELLOW: Investors understand that their principal will be at medium risk
BLUE: Investors understand that their principal will be at low risk
*Investors should consult their financial advisers if in doubt about whether the product is suitable for them. **Note: Risk may be represented as:
Historical Fund Name Name w.e.f. June 30, 2014 This product is suitable for investors who are seeking* (level of risk)
Templeton India Income Fund (TIIF)
Franklin India Income Fund (FIINCF)
• Medium term capital appreciation with current income • A long bond fund investing in quality fixed income instruments across segments.
Templeton India Income Builder Account (TIIBA)
Franklin India Income Builder Account (FIIBA)
• Medium term capital appreciation with current income • A long bond fund – focuses on Corporate/PSU Bonds.
Templeton India Short-Term Income Plan (TISTIP)
Franklin India Short Term Income Plan (FISTIP)
• Regular income for medium term • A fund that invests in short term corporate bonds including PTCs
Templeton India Ultra-short Bond Fund (TIUBF)
Franklin India Ultra Short Bond Fund (FIUBF)
• Regular income for short term • A fund that invests in short term debt and money market instruments
Franklin India Savings Plus Fund (FISPF)
- • Regular income for short term • A fund that invests primarily in floating and short term fixed rate debt instruments
Templeton India Government Securities Fund (TGSF)
Franklin India Government Securities Fund (FIGSF)
• Medium term capital appreciation with current income • A fund that invests in Indian government securities
Templeton India Low Duration Fund (TILDF)
Franklin India Low Duration Fund (FILDF)
• Regular income for short term • An income fund focusing on low duration securities.
FT India Monthly Income Plan (FTIMIP) (with no assured returns)
Franklin India Monthly Income Plan (FIMIP) (with no assured returns)
• Medium term capital appreciation with current income • An MIP investing predominantly in debt instruments with marginal equity exposure
Templeton India Income Opportunities Fund (TIIOF)
Franklin India Income Opportunities Fund (FIIOF)
• Medium term capital appreciation with current income • A fund that invests across the yield curve - focusing on high accrual securities
Templeton India Corporate Bond Opportunities Fund (TICBOF)
Franklin India Corporate Bond Opportunities Fund (FICBOF)
• Medium to long term capital appreciation with current income • A bond fund focusing on corporate securities
Templeton India Treasury Management Account (TITMA)
Franklin India Treasury Management Account (FITMA)
• Regular income for short term • A liquid fund that invests in short term and money market instruments
Franklin India Banking & PSU Debt Fund (FIBPDF)
- • Regular Income for medium term • An income fund that invests predominantly in debt and money market instruments
issued by Banks and Public Sector Undertakings.

16
Franklin Templeton’s Accrual Led Products Overview
Franklin India Short Term
Income Plan
Franklin India Income
Opportunities Fund
Franklin India Corporate Bond
Opportunities Fund
Positioning Matrix
Investment Objective
Nature of Scheme
Risks: Interest Rate Risk
Risks: Credit Risk
12-15 Months 18-21 Months >30 Months
To Provide Stable returns
by investing in fixed
income securities
Regular income and capital
appreciation by investing in
fixed income securities
across the yield curve
Regular income and capital
appreciation by investing
predominantly in corporate
securities
Regular Income
Capital
appreciation with
current income
Capital
appreciation with
current income
Low to Moderate Low to Moderate Moderate
Low to Moderate Moderate Moderate
Indicative Investment
Horizon
CLICK HERE TO INVEST NOW
17
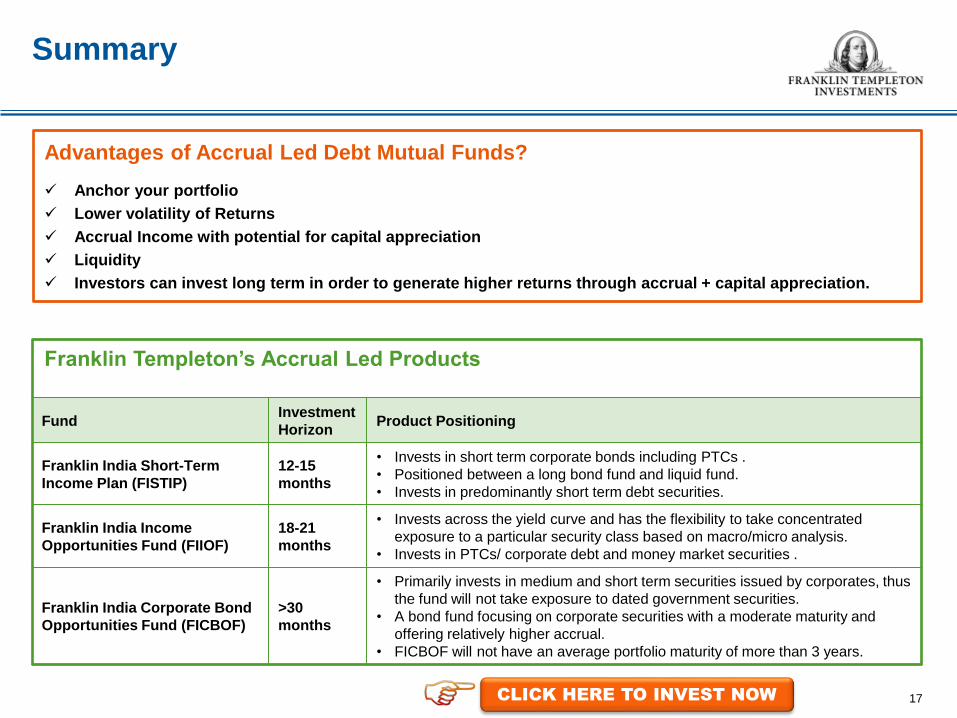
Summary
Advantages of Accrual Led Debt Mutual Funds?
Anchor your portfolio
Lower volatility of Returns
Accrual Income with potential for capital appreciation
Liquidity
Investors can invest long term in order to generate higher returns through accrual + capital appreciation.
Franklin Templeton’s Accrual Led Products
Fund Investment
Horizon Product Positioning
Franklin India Short-Term
Income Plan (FISTIP)
12-15
months
• Invests in short term corporate bonds including PTCs .
• Positioned between a long bond fund and liquid fund.
• Invests in predominantly short term debt securities.
Franklin India Income
Opportunities Fund (FIIOF)
18-21
months
• Invests across the yield curve and has the flexibility to take concentrated
exposure to a particular security class based on macro/micro analysis.
• Invests in PTCs/ corporate debt and money market securities .
Franklin India Corporate Bond
Opportunities Fund (FICBOF)
>30
months
• Primarily invests in medium and short term securities issued by corporates, thus
the fund will not take exposure to dated government securities.
• A bond fund focusing on corporate securities with a moderate maturity and
offering relatively higher accrual.
• FICBOF will not have an average portfolio maturity of more than 3 years.
CLICK HERE TO INVEST NOW

18
The information contained in this presentation is not a complete representation of every material fact regarding any industry,
security or the fund and is neither an offer for units nor an invitation to invest. This communication is meant for use by the
recipient and not for circulation/reproduction without prior approval. The views expressed by the portfolio managers are
based on current market conditions and information available to them and do not constitute investment advice.
Scheme Classification and Objective: Franklin India Short Term Income Plan (FISTIP) is an open end income scheme
with an objective to provide stable returns by investing in fixed income securities. Franklin India Income Opportunities
Fund (FIIOF) is an open end income fund that seeks to provide regular income and capital appreciation by investing in fixed
income securities across the yield curve. Franklin India Corporate Bond Opportunities Fund (FICOBF) is an open-end
income fund which seeks to provide regular income and capital appreciation through a focus on corporate securities.
Load Structure: The investors are requested to check the prevailing load structure of the scheme before investing. Please
refer website/latest SID/addenda for the latest load structure of the respective schemes.
Risk Factors: Mutual Fund investments are subject to market risks, read all scheme related documents carefully.
The NAVs of the schemes may go up or down depending upon the factors and forces affecting the securities market. The
Mutual Fund is not guaranteeing or assuring any dividend under any of the schemes and the same is subject to the
availability and adequacy of distributable surplus. The past performance of the mutual funds managed by the Franklin
Templeton Group and its affiliates is not necessarily indicative of future performance of the schemes. Investors are
requested to review the prospectus carefully and obtain expert professional advice with regard to specific legal, tax and
financial implications of the investment/participation in the scheme.
Risk Factors
18

© 2014 Franklin Templeton Investments. All rights reserved.
Franklin Templeton Asset Management (India) Pvt. Ltd.
Indiabulls Finance Centre, Tower 2,
12th and 13th floor, Senapati Bapat Marg,
Elphinstone (W)
Mumbai 400013
Tel (91-22) 6751 9100
Fax (91-22) 6639 1281
www.franklintempletonindia.com
19