potential on-time performance improvements at the
TRANSCRIPT

Potential On-Time Performance Improvements at the Lufthansa Station at Frankfurt Airport
A Human Factors Approach
A thesis presented in partial fulfilment of the requirements for the degree of
Master of Aviation
at Massey University, Auckland (Albany),
New Zealand
Joerg Speri
2006

On-Time Performance Jörg Speri
- ii -
Acknowledgements
At this place I would like to take the opportunity to thank the people who have helped
me to write this thesis.
First of all thank you my tutors, Mrs. Karin Krestan, punctuality manager at the
Lufthansa station at Frankfurt Airport, Germany, and Mr. Bernie Frey, PhD at the
Department of Aviation, at Massey University, Auckland, New Zealand, who devoted
some of their limited time, and assisted me with their guiding advice and
assessments.
Moreover, special thanks to Mr. Jürgen Bier, Bastian Kraemer and Lovro Orajic, they
are standing for all the colleagues at Lufthansa who helped me with useful inputs and
advice.
I would also like to thank all Flight Managers, Assistant Flight Managers, and Section
Leaders that participated in the survey. Their ideas and spirit are at the core of this
thesis.
Also thanks to Lufthansa, who allowed me to do research at their station at Frankfurt
Airport. Thanks to the station manager and his departmental managers.
And finally thanks to my friends who supported me during the process of writing this
thesis and to my parents without their help none of this would have been possible.
Thanks to all of you

On-Time Performance Jörg Speri
- iii -
Abstract
Departure punctuality has increasingly gained attention over the last few years. This
development is due to the realization what important role this issue plays in the
economics of the airline industry. Punctuality is not just a sound performance
indicator but also allows airlines to differentiate themselves from their competitors. In
addition the issue holds a significant potential for cost savings.
For this reason many airlines have started special programmes to improve their
punctuality performance, and so did Lufthansa. However, despite this increasing
attention, outbound punctuality levels have not yet reached satisfactory levels.
Therefore, this study aimed at contributing to this process by identifying potential on-
time performance improvements at the Lufthansa station at Frankfurt Airport.
As an underlying framework, a Human Factors approach was chosen. Central issues
in the focus of the study were the individual perceptions and attitudes towards
punctuality by the relevant front line staff. In order to examine these issues a survey
among the Flight Managers, Assistant Flight Managers, and Section leaders was
carried out. The results of this survey were then put into correlation with the delay
statistics published.
The results of the survey indicate a potential lack of communication among the front
line staff as well as between them and higher organizational entities. Moreover,
certain distrust towards the delay statistics became evident. Although the staff
members seem quite well motivated, they feel a lack of commitment by their
superiors. In addition, the survey gathered some interesting ideas for punctuality
improvements held by the front line staff members.
Besides very concrete topics for discussion, the central outcome of the study was the
recommendation to analyze all relevant processes at the Lufthansa station from a
Human Factors perspective in order to improve the communicative situation.
Moreover, the study suggests introducing appropriate incentive schemes in order to
promote better on-time performance. Altogether these should result in a noticeable
improvement of the punctuality situation at the Lufthansa station.
On-Time Performance Jörg Speri
- iv -
Table of Contents
Acknowledgements ii Abstract iii Table of Contents iv Tables & Figures v Abbreviations & Operational Terms vi Preface viii 1. Introduction.......................................................................................................... 1
1.1. Disposition.................................................................................................... 1 1.2. Introduction Lufthansa & Frankfurt Airport.................................................... 2
1.2.1. Lufthansa German Airlines – a Journey down Memory Lane ............ 2 1.2.2. FRA ST – the Lufthansa Station at Frankfurt Airport ......................... 6 1.2.3. The Aircraft and Passenger Handling Process in Frankfurt ............. 11
1.3. Statement of Problem................................................................................. 14 1.4. Significance of the Work............................................................................. 15 1.5. Assumptions and Limitations...................................................................... 15 1.6. Delimitations............................................................................................... 16
2. Literature Review and Theoretical Background................................................. 17 2.1. General Background .................................................................................. 17 2.2. Theory ........................................................................................................ 18
2.2.1. Human Factors History .................................................................... 18 2.2.2. Human Factors in complex sociotechnical Systems........................ 22 2.2.3. The Human Factor – Kim Vicente.................................................... 24 2.2.4. Airport and Airline Management ...................................................... 28 2.2.5. Punctuality Management ................................................................. 33 2.2.6. Quality Management ....................................................................... 37 2.2.7. Surveys in Organizations................................................................. 38
2.3. Conclusions................................................................................................ 41 3. Methodology and Procedure ............................................................................. 43
3.1. Introduction ................................................................................................ 43 3.2. Research Approach: Quantitative and Qualitative...................................... 43 3.3. Data Collection Procedures........................................................................ 45
3.3.1. The Delay Codes............................................................................. 45 3.3.2. The Survey ...................................................................................... 47
3.4. Data Analysis Procedures .......................................................................... 51 3.5. Reliability and Validity ................................................................................ 53 3.6. Outline of the Research Process................................................................ 55
4. Data Analysis .................................................................................................... 56 4.1. Graphical Analysis of the Delay Statistics .................................................. 56 4.2. Analysis of the Questionnaires................................................................... 64
5. Discussion ......................................................................................................... 83 6. Conclusions and Recommendations ................................................................. 90 Appendix

On-Time Performance Jörg Speri
- v -
Tables & Figures Table 1: Factors AEA Safety Assessment Tool (van Steen, 1996)........................................48 Table 2: Underlying structure of the questionnaire.................................................................49 Table 3: Figures of Participants..............................................................................................50 Table 4: Questions B..............................................................................................................66 Table 5: Multivariate Tests B Section.....................................................................................68 Table 6: Questions C..............................................................................................................68 Table 7: Answers to Question C03.........................................................................................70 Table 8: Multivariate Tests C Section.....................................................................................70 Table 9: Questions D..............................................................................................................71 Table 10: Multivariate Tests D Section...................................................................................73 Table 11: Questions E............................................................................................................73 Table 12: Multivariate Tests E Section...................................................................................75 Table 13: Test of Between-Subjects Effects ..........................................................................76 Table 14: Comparison of Means for E07................................................................................77 Table 15: Comparison of Means for E07 & E05.....................................................................77 Table 16: Questions F ............................................................................................................78 Table 17: Answers to Question F02 .......................................................................................79 Table 18: Answers to Question F05 .......................................................................................80 Table 19: Multivariate Tests F Section ...................................................................................80 Figure 1: Airlines handled by Lufthansa at Frankfurt Airport (Lufthansa, 2005).......................7 Figure 2: Extension Plans at Frankfurt Airport (Fraport, 2005) ................................................8 Figure 3: Views of Frankfurt Airport (Lufthansa, 2005) ............................................................9 Figure 4: Lufthansa station Frankfurt – Organization chart (Lufthansa, 2005).......................10 Figure 5: Reference Model for the Ground Handling (Lufthansa, 2005) ................................11 Figure 6: The Human Tech Ladder (Vicente, 2003)...............................................................25 Figure 7: Model of Airport Relationships (Ashford, Stanton, and Moore, 1997).....................30 Figure 8: Model of an Airport (Ashford, Stanton, and Moore, 1997) ......................................31 Figure 9: Outline Research Process ......................................................................................55 Figure 10: Punctuality statistics 2005 LH Station Frankfurt....................................................56 Figure 11: Boarded Guests vs. Take offs (Lufthansa, 2005)..................................................57 Figure 12: Delay Reasons 2005 (cumulative August 2005) ...................................................58 Figure 13: Delay Reasons 2004.............................................................................................59 Figure 14: Delays Handling (Codes 11-39) ............................................................................60 Figure 15: Technical Delay (41-49) ........................................................................................60 Figure 16: ATC Delays (Codes 2, 81-84, 89) .........................................................................61 Figure 17: Connex Delays (Codes 91-93)..............................................................................62 Figure 18: Airport Delays (Codes 85 - 88)..............................................................................63 Figure 19: General Questions ................................................................................................65 Figure 20: Information/ Communication .................................................................................67 Figure 21: Means Information/ Communication .....................................................................67 Figure 22: Central Hub Control ..............................................................................................69 Figure 23: Means Central Hub Control...................................................................................69 Figure 24: Ideas and Motivation .............................................................................................71 Figure 25: Means Ideas and Motivation .................................................................................72 Figure 26: Results D08...........................................................................................................72 Figure 27: Answers E01 and E02...........................................................................................74 Figure 28: Punctuality Management.......................................................................................74 Figure 29: Means Punctuality Management...........................................................................75 Figure 30: Delay Reasons......................................................................................................78 Figure 31: Results G01 ..........................................................................................................82

On-Time Performance Jörg Speri
- vi -
Abbreviations & Operational Terms A/C: Aircraft
AEA: Association of European Airlines
AFM: Assistant Flight Manager
APIS: Advanced Passenger Information System
ACARS: Aircraft Communications Advising and Reporting System
ATC: Air Traffic Control
Connex: Connecting
Cont: Continental
DASGO: Data Access for Ground Operations Dom: Domestic
Df: Degrees of Freedom
etc.: et cetera
ex: coming from/ out of
FAA: Federal Aviation Authorities
FM: Flight Manager
FRA SE: department for the operative station control and management
FRA SO: department for the aircraft handling at the Lufthansa station at Frankfurt
Airport – head: Mr. Rolf-Dieter Gettert
FRA ST: central department of the Lufthansa station at Frankfurt Airport – head: Mr.
Andreas Döpper
FRA SV: department for the passenger handling at the Lufthansa station at Frankfurt
Airport head: Mr. Markus Vaagt
GDR: German Democratic Republic – former East Germany
GSS: GepäckSortierSystem – luggage sorting system
HCC: Hub Control Center – special facility from where all operations at Frankfurt
Airport are monitored and commanded
HFES: Human Factors & Ergonomics society
HON Circle: top customer program of Lufthansa – persons need to fulfil certain
requirements to get admission to special lounges, terminals and unique
services
IATA: International Air Transportation Association
Icont: intercontinental
On-Time Performance Jörg Speri
- vii -
LH: Lufthansa German Airlines
LSG: Lufthansa Service Gesellschaft – Catering subsidiary of Lufthansa
MANCOVA: Multivariate Analysis of Co-Variance
MCT: Minimum Connecting Time
Min.: Minutes
MIT: Massachusetts Institute of Technology
MS: Mean of Squares
N: Number
Participants: Part of the population that was actually available for the survey
PAX: Passenger
Population: Staff in the respective positions under investigation in this project (FM,
AFM, SLSO)
Respondents: Part of the participants who actually returned their questionnaires
SARS: Severe Acute Respiratory Syndrome
Sig.: Level of significance
SLSO: Section leader at FRA SO
SS: Sum of Squares
ULD: cargo containers used in aircraft
U.S.: United States (of America)
USA: United States of America
VIC: highly valuable cargo – underlies special regulations

On-Time Performance Jörg Speri
- viii -
Preface
“A pro at the steering wheel” By Ephraim Kishon “Best Driver Stories“ (2001)
(Translation from German by Jörg Speri)
People, who do not know the old Lustig better, think of him as a normal cab driver. In
principle he is badly shaved, his eyes are ostentatiously red and swollen, because he
intentionally does not sleep enough. When he walks, numerous car keys jingle in his
pockets and if he sits, then just behind the steering wheel of his black cab. Strictly
speaking Lustig is a cab driver indeed. However, this succinct definition does not
nearly do justice to the facts.
De facto Lustig manages the international airport of Tel Aviv.
I found out about this through my own experience, when my car refused to start last
week and I entered his cab, of all cabs, to get to the airport.
I was supposed to pick up a distantly related uncle of mine, whose arrival was
scheduled for 7:30 am. “Don’t worry, stay calm” Lustig said as we came closer to the
airport. “Lustig knows about how the things work. Which airline does your uncle fly?”
“As far as I know with Sabena.” ”And that’s why I had to hurry?” Lustig took his foot
off the accelerator. “The flight will not arrive until 8:40. Thursdays Sabena is always 1
hour and 10 minutes late. Air France 25 minutes and TWA 1 hour and 12 minutes.
Passport control and customs clearance won’t take too much time, as the local
customs labour union committee will hold its every morning meeting. Your uncle will
be a bit exhausted after the storm over Greece, apart from that, well and happy,
although upset by the sour red wine that the slovenly air hostess has served him.”
“How do you know all that?”
“How Lustig knows about all that, he asks! Dear Sir, I have been driving to the airport
for more than 40 years now. Today I am able to tell you everything about people just
by looking into their faces, where they come from, how much money they have, and
what they smuggle. One quick look and I know: 5 suitcases and a hatbox. I haven’t
been out by more than one piece of hand luggage, never. Bear in mind, 40 years…”
We approach the airport. A guard wants to see my ID, by contrast he salutes Lustig.
“At the moment a lot of things are going on here” Lustig said “It’s because of the

On-Time Performance Jörg Speri
- ix -
numerous immigrants from Eastern Europe. You can experience a lot – some
moments are really touching. Last Monday for example an old lady arrived who had
not seen her daughter for more than 25 years. 25 years, Sir! They embraced each
other for more than 10 minutes, laughing and crying at the same time…”
In this moment, a crowd of passengers comes out of the arrival hall. A young man is
making his way through the crowd and rushes into the arms of a long bearded man –
both break out in tears. Lustig is watching them silently. Then he says: “13 years!”

On-Time Performance Jörg Speri
1
1. Introduction
1.1. Disposition
Chapter 1 introduces the setting of the thesis, and gives introductory information
about Lufthansa German Airlines and the Lufthansa Station at Frankfurt Airport.
Moreover, the problem under investigation is introduced; the assumptions and
limitations of the work are presented, and the thesis is delimited from previous
research.
Chapter 2 is providing the theoretical background and literature review of this
project. First of all, general information about the theoretical background is given.
This is complemented by a review of relevant literature about Human Factors
science, airport and punctuality management from various perspectives. The chapter
closes with a review of the theoretical literature about the research instruments used
during this work.
Chapter 3 deals with the method and procedures applied in the research process.
The chapter starts with a philosophical derivation of the overall research approach.
The questionnaires used in the survey are presented and the progress of the
research process is described. The chapter finally gives a critical account of the
reliability and validity of the results obtained.
Chapter 4 is divided into two subchapters. The first one presents a detailed analysis
of the punctuality situation at the station, on the basis of the delay statistics. The
second one is concerned with the analysis of the outcomes of the survey among the
staff at the station. Both sub-chapters provide the foundation for the further
discussion.
Chapter 5 presents the discussion of the outcomes of the data analysis performed in
chapter four. All major issues are scrutinized and put into relationship to each other.
Chapter 6 concludes the thesis and presents recommendations and implications
derived from the discussion. Moreover, points of departure for further research are
pointed out.
On-Time Performance Jörg Speri
2
1.2. Introduction Lufthansa & Frankfurt Airport
1.2.1. Lufthansa German Airlines – a Journey down Memory Lane
Talking about Lufthansa’s past actually means talking about two different companies.
It also means talking about European - particularly German economic and political
history. The following subchapter will provide a brief introduction to Lufthansa’s
eventful history – preparing the basis and setting for further discussion. As Lufthansa
provides extensive information through its intranet web pages, this source was used
for the majority of the information in this subchapter.
The “old” Lufthansa – the years from 1926 – 1945
At the beginning of the 20th century, only years after the Wright brothers’ first
motorized flight in 1903, aviation started to change the world. Already in the early
1920s, a remarkable number of aviation related companies had been founded. The
aviation industry – aircraft manufacturers and early airlines – had turned out to be an
engine for progress. Germany was one of the countries these developments started
from. Soon a strong aviation industry built up. Big names such as Junkers, still well
known today, appeared on the stage. Based on this background, it was only a matter
of time until a first national carrier was born.
On 6th of January 1926 “Deutsche Luft Hansa Aktiengesellschaft” was founded – a
merger between “Deutsche Aero Lloyd” (DAL) and “Junkers Luftverkehr”. The new
airline inherited its crane logo, designed by “Deutsche Luft Reederei” in 1919, from
DAL, and the blue-and-yellow house colors from Junkers. The signatures under the
corporate charter were set in Berlin’s famous Hotel “Kaiserhof”.
On 6th April 1926 the airline took off for the first time - serving eight routes which were
supplemented during the following weeks. In the first year of operations, Luft Hansa
aircraft flew 6,537,434 kilometres and transported 56,268 passengers, 946 tons of
mail and freight. The company had 1,527 employees at this time. During the early
1930s the company experienced tremendous growth. November 1st 1932 was an

On-Time Performance Jörg Speri
3
important date for the company – on this day Luft Hansa introduced the famous JU52
aircraft, better known as “Aunty JU” in Germany, on the Alpine Route. JU52 was the
first whole-metal aircraft used for scheduled air transport and is still part of today’s
Lufthansa fleet. The 3rd of February 1934 marks another milestone in the company’s
history – Luft Hansa opened a new chapter in aviation with the initiation of a
scheduled air-mail-service crossing the South Atlantic. And the history of introducing
innovations had just begun. It was in June 1938 that the first stewardesses started
taking care of the well-being of the passengers aboard Luft Hansa’s aircraft. Over the
years the young airline extended its route network more and more – culminating in
the introduction of scheduled flight services on a route from Berlin to Bangkok in
1939. This was the highpoint of the “old” Luft Hansa.
The next ten years would be part of the darkest time in German history. On August
31st 1939 just days before the beginning of World War II Luft Hansa suspended all its
flight services. The flights were to be reintroduced later in September but the route
network never reached its state of the pre-war times. As Germany had declared war
on almost all the countries Luft Hansa was serving, just a few routes to neutral
countries were left. A further setback for the company emerged when the longer the
war took, the more engineers, pilots, and aircraft were called up for military service.
These developments came to a heed in 1944 when almost no aircraft was left to be
in service for civil purposes. Following the surrender in 1945, the manufacture,
ownership and operation of aircraft in Germany was generally prohibited – therefore
the surrender of Germany also marked the fall of the “old” Luft Hansa. In 1965 the
company was finally erased from the Berlin commercial register. A remarkable part of
aviation history had come to an end.
The “Deutsche Lufthansa AG” – a new beginning from 1953 to now
The history of the “modern” Lufthansa dates back to the early 1950s. In 1951 a
committee was set up to prepare for the resumption of air traffic in postwar Germany.
A new company to run air services and named "Aktiengesellschaft für
Luftverkehrsbedarf" (Luftag) was founded in Cologne on January 6, 1953. The
company changed its name to the more traditional "Deutsche Lufthansa
On-Time Performance Jörg Speri
4
Aktiengesellschaft" in 1954, and resumed scheduled flights on April 1, 1955. Just ten
years after a devastating war that had changed the world like no other, Lufthansa
took off again with a fleet of short- and medium-haul and four long-distance aircraft.
Just one year later Lufthansa had transported more than a hundred thousand
passengers. By 1959 the network had expanded to almost 93000km and about
786000 passengers that year. Once again Lufthansa was experiencing a phase of
extraordinary growth. Its services were well recognized again and were regarded as
exemplary.
At the end of the 1950s the first jet-engine aircraft were bought and from the 1960s
the legendary Boeing 707 was serving Lufthansa’s long haul routes. The dawn of the
jet era brought a first restructuring phase to the company as the route network was
adapted to the new faster and longer range jet aircraft. Until the end of this decade
Lufthansa experienced steady growth culminating in 1969 with an 18% upturn. The
26th of April 1970 marked another remarkable step in the history of the airline – the
introduction of Boeings 747 “Jumbo-jet” on the routes from Frankfurt to New York
and Asia opened a new era of flying. The oil crisis in the mid ‘70s and the following
developments in the world-economy made it increasingly hard for Lufthansa to
succeed. Nevertheless, due to outstanding management decisions the crisis was
mastered before the end of the decade.
The 1980s increasingly changed Lufthansa into a more service-orientated
organisation. With the modernization of the fleet the company enjoyed stable growth
and relatively calm years. At this stage the airline began to cooperate with other
airlines to provide its passengers a richer variety of destinations all over the globe.
The reunification of Germany in 1990 was a chance and a challenge for Lufthansa at
the same time. While being allowed to fly to Eastern Germany for the first time since
its foundation and while winning new markets in Eastern Europe, the company had
also to deal with the burden of the former German Democratic Republic’s (GDR) past
aviation industry. This process was negatively affected by the first Gulf War which
caused a drastic decline in demand for international air travel. It took the company
until 1993 to master the crisis. In the same year Lufthansa signed a first contract over

On-Time Performance Jörg Speri
5
cooperation with United Airlines – this can be considered as the first step towards the
foundation of the Star Alliance.
During the 1990s Lufthansa started to found a number of aviation – related
companies apart from their core business. Among them is Lufthansa Technik, the
world’s leading provider of aircraft maintenance and overhaul services. Furthermore,
Lufthansa Service Gesellschaft (LSG) is the largest airline caterer in the world. Some
of these companies have become leaders in their markets and contribute very much
to the success of the Lufthansa Aviation Group.
September 11th 2001 marked one of the worst days in the aviation history to date. In
the middle of an already existing worldwide crisis, the airline industry and with it
Lufthansa, was hit without warning. The devastating terror acts of September 11th
caused a cut in worldwide air travel demand never experienced before. Nevertheless,
by implementing comprehensive cost and capacity measures the company was able
to successfully deal with the crisis. Contrary to the USA and most other European
airlines, at Lufthansa no mass dismissals were considered necessary. Before the
company recovered fully, it was hit by the effects of the Severe Acute Respiratory
Syndrome (SARS) crisis in early 2003 and later that year suffered from the new war
in Iraq.
Today the company is facing new challenges, such as extremely high kerosene
prices, a very competitive market environment on the European market with the rise
of the no-frills carriers (e.g. Ryanair, Easy Jet), and finally economic pressure on the
long-haul routes from other consolidated European carriers (e.g. Air France & KLM)
and the uprising competitors from the Middle East region (e.g. Emirates, Qatar
Airways). Besides, Lufthansa is currently also working on the settlement of the
merger with SWISS International Airlines. Altogether, these developments will
certainly require continuous change and adaptation, a process challenging any
organisation (Lufthansa, 2005).

On-Time Performance Jörg Speri
6
Following this brief historic overview the next chapter will present the Lufthansa
Station at Frankfurt Airport, central hub of the “Lufthansa world” and setting for this
specific research project.
1.2.2. FRA ST – the Lufthansa Station at Frankfurt Airport
As Frankfurt Airport is the central hub and basis of the Lufthansa network, the station
at this airport is of outstanding importance for the airline. With about 2900 employees
the station as such is larger than the total number of employees of some of the
competitors of Lufthansa. The station offers wide-ranging services from passenger
handling to aircraft handling.
Concerning passenger handling, the station provides all sorts of services from
ticketing, lounge operations, to special services for handicapped passengers or care
for unattended minors. A very special service is the unique Top Customer Service
that Lufthansa established just about a year ago. First Class passengers and special
HON Circle members are attended to in a separate top customer terminal that is
more like a five star luxury lounge rather than an ordinary airport terminal. This list
could be extended much further.
Regarding aircraft handling, the station is closely working together with the airport
owner FRAPORT. It offers services such as ramp agents, baggage handling, weight
& balance, and load control. Although Lufthansa as an airline has outsourced major
parts of this business, it is still keeping the above mentioned key services alive.
All the above mentioned services are not just offered to Lufthansa and its Regional
airline Lufthansa CityLine but also to customer airlines. About forty airlines use the
handling services of Lufthansa for their operations at Frankfurt Airport. A sample of
them is represented in Figure 1.

On-Time Performance Jörg Speri
7
Figure 1: Airlines handled by Lufthansa at Frankfurt Airport (Lufthansa, 2005)
To give the reader an impression of the dimensions of the operation, the following
figures will be useful: The Lufthansa station at Frankfurt Airport is responsible for the
handling of about 400 continental and domestic departure flights each day. On top of
this the station handles about 70 intercontinental flights each day. Altogether, this
adds up to about 56000 passengers per day on average; in peaks up to nearly
70000. Approximately 7250 guests visit the lounges day by day. About 1100
passengers get special assistance and care every day (e.g. handicapped persons).
Some fun facts in this regard: the Lufthansa station sells 108800 litres of beer each
year, 20240 pounds of coffee are scalded every year, and finally, more than 90000
showers are taken in the lounges yearly (Lufthansa, 2005).
These figures become even more impressive if one takes into consideration that the
operation takes place on a relatively crowded hub with limited infrastructure
availability. The terminal used by Lufthansa dates back to the early 1970s and is
basically running close to or above maximum capacity day by day. The same goes
for the 2.5 runway system of the airport. Each factor alone would be critical; in sum
they create a very challenging and complex environment for sound operations. In
On-Time Performance Jörg Speri
8
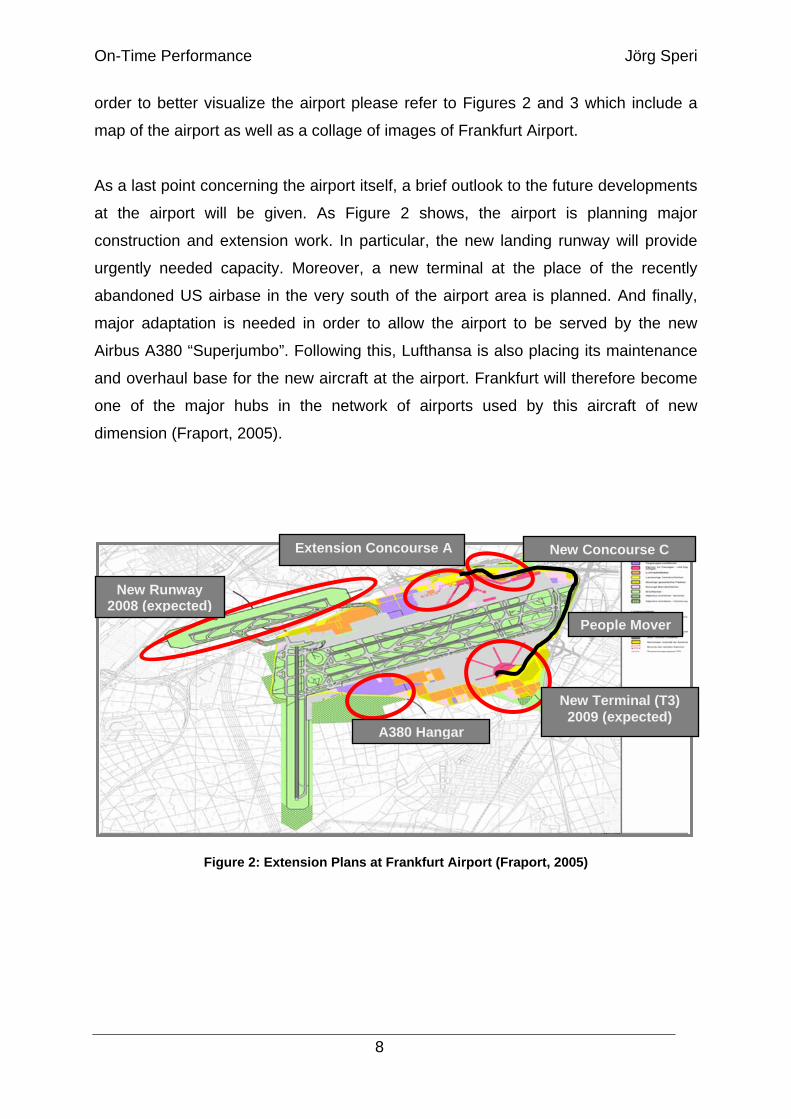
order to better visualize the airport please refer to Figures 2 and 3 which include a
map of the airport as well as a collage of images of Frankfurt Airport.
As a last point concerning the airport itself, a brief outlook to the future developments
at the airport will be given. As Figure 2 shows, the airport is planning major
construction and extension work. In particular, the new landing runway will provide
urgently needed capacity. Moreover, a new terminal at the place of the recently
abandoned US airbase in the very south of the airport area is planned. And finally,
major adaptation is needed in order to allow the airport to be served by the new
Airbus A380 “Superjumbo”. Following this, Lufthansa is also placing its maintenance
and overhaul base for the new aircraft at the airport. Frankfurt will therefore become
one of the major hubs in the network of airports used by this aircraft of new
dimension (Fraport, 2005).
Figure 2: Extension Plans at Frankfurt Airport (Fraport, 2005)
New Runway 2008 (expected)
New Terminal (T3) 2009 (expected)
Extension Concourse A New Concourse C
People Mover
A380 Hangar

On-Time Performance Joerg Speri
9
Terminal 1 Concourse B (East & West) Aerial View of Terminal 1 and Terminal 2
Frankfurt Airport Aerial View Terminal 1 Concourse C and Terminal 2 (from the left)
Lufthansa Aircraft at Terminal 1 (Concourse A) Hub Control Center (HCC) at Frankfurt Airport
Inside Terminal 1 (Concourse A) Inside Terminal 1 (LH Gates at Concourse B)
Figure 3: Views of Frankfurt Airport (Lufthansa, 2005)

On-Time Performance Joerg Speri
10
To run such complex operations under these circumstances a sound base
organization is of central importance. For this reason the station is organized into five
departments, each responsible for a very specific field of operation.
Figure 4: Lufthansa station Frankfurt – Organization chart (Lufthansa, 2005)
Figure 4 shows the organizational structure of the Lufthansa station including the
pictures of the departmental managers as of December 2005 (Lufthansa, 2005).
Of specific importance in this regard is the department Central Hub Control that is
responsible for running the so called Hub Control Center (HCC). To speak in naval
terms, this Center is the bridge of the hub. From here, all daily hub operations of
Lufthansa and its partners are controlled, supervised, and managed. A closer
description of this Center will follow in the next chapter.
Concluding this chapter, one can say that the Lufthansa station at Frankfurt Airport is
the one of the very central parts of the airline, responsible for a major amount of the
operations. As the later chapters will show this is a very challenging task.
Station Manager FrankfurtFRA ST
Andreas Döpper
Mrs. Jutta Zimbrich
Aircraft Handling FRA SO Staff 393
Central Hub Control FRA SE
Staff 134
Passenger Handling FRA SV
Staff 1.510
Sales & Special Svc. FRA SX Staff 743
Top Customer Svc. FRA SM Staff 81
Mr. Rolf Gettert
Mr. Marcus Vaagt
Mr. Daniel Mugler
Mr. Michael Knauf

On-Time Performance Joerg Speri
11
1.2.3. The Aircraft and Passenger Handling Process in Frankfurt
The aircraft and passenger handling is a complex logistical process. Various
streams, soft- as well as hardware, need to be coordinated and delivered on-time in
order to “produce” a punctual departure.
Figure 5 shows the “Reference Model” for the handling of intercontinental flights
operated by Lufthansa from Frankfurt Airport. From this chronological table all
sequential steps in the various streams can be derived. All employees involved in the
processes are trained according to this model. However, this model, like any other,
just reflects a simplified image of reality. There are several processes not included,
nor are there any communication processes represented.
Figure 5: Reference Model for the Ground Handling (Lufthansa, 2005)
The model is based on experimental measurements and field studies. It is
undergoing constant change and adaptation. However, it is not undisputed as reality
has shown that some of the underlying assumptions are critical (e.g. time for closing
the flight, time for boarding process, etc.).
40 30 35 25 20 15 10 5 0 50
Unloading, Loading
Catering, Cleaning
Fueling
Crew
…60
Gate, Boarding
5
Doors closed
max. 40 Min.
4455 38
max. 45 Min.
35
35 8
Last ULD-Freight
8 Arrival first bus at A/C
Arrival last bus at A/C
45 30
Last Bulk-Freight/ last Mail at A/C
Last VIC Bulk Freight
8 15
Last Scan
38
90
First PAX onboard
Doors closed, withdrawel bridges
Reference model Icont
„Aircraft not ready for boarding“ meassage
First PAX onboard Bridge
First PAX onboard Ramp
all numbers are minutes prior to departure off blocks

On-Time Performance Joerg Speri
12
Nevertheless, the model has proved its usefulness in the daily routines. Each partner
involved in the handling process is working according to it, which brings us back to
the Hub Control Center mentioned in the previous chapter. As said before, the HCC
represents the bridge of the hub. The overall aim of setting up such a center was to
improve the communication and information flow on the hub by putting all relevant
players together in one room. Therefore, all major players in the handling process
have manned workstations there. The HCC is also the hub of the communications
system at the Lufthansa station. Through computer networks a flood of incoming
information from various subsystems is filtered and provided to the process owner
responsible. Before, information had to be transferred by means of
telecommunication or radio, sometimes parallel or overlapping, however often time-
consuming. Today all information is shared instantly. Nevertheless, this institution is
not free of mistakes either and as the later discussion (see chapter 5) will show there
is room for improvements (Lufthansa, 2005).
It is now necessary to introduce two of the major players in the handling process as
they will be of critical importance for the research process. They are the central
managers of the passenger respectively aircraft handling processes.
Flight Managers play one of the most important roles in the daily operational
management at Frankfurt Airport. They have the task to independently control,
monitor, and supervise all passenger and aircraft handling processes concerned with
the flights allocated to their teams within their shifts. This includes processes such as
loading, catering, boarding, seat allocation, check-in and many more. The overall aim
of their duty is to ensure a safe, punctual, and customer friendly service at the airport.
As supervisors, they have to lead their teams of 8 to 10. It is also their task to monitor
and if necessary, improve the performance of their teams. Flight Managers also have
to deal with all administrative work which results from their operational duties.
In order to ensure a high quality service, Lufthansa has developed a set of strict
requirements one has to fulfil in order to become a Flight Manager. Besides long
working experience in the field of aircraft- and passenger handling, candidates must
have distinct qualities in the fields of personal organization, personnel leadership,

On-Time Performance Joerg Speri
13
and working in highly complex environments. These requirements are complemented
by further soft skills such as self confidence and appropriate appearance. To ensure
the suitability of a candidate, a specially designed psychological test has to be
passed by each applicant (Lufthansa, 2005).
The Assistant Flight Managers play a similar role to that of the Flight Managers. Their
task is to support the Flight Managers. They independently perform the tasks as
described above – however, just for the flights allocated to them by their Flight
Manager. In order to do so, similar requirements are set for this position. Usually the
position of Assistant Flight Manager is a waypoint on the way to become a Flight
Manager (Lufthansa, 2005).
The second group I would like to mention in this regard are the Section leaders at
FRA SO. They have a similar position to the one of the Flight Managers on the
aircraft side of the handling process. Their central task is the supervision of the
aircraft handling process. This comprises the leadership of their teams who are
dealing with issues such as weight & balance, fuelling, or apron surveillance. Section
leaders usually work in shifts as well. In order to perform well, Lufthansa has
developed as set of skills and characteristics a candidate needs to fulfil. This includes
long working experience in the field, technical knowledge, and a sound qualification
in the corresponding procedures. Moreover, candidates must have distinct qualities
in the fields of personal organization, personnel leadership, and need to be able to
work in high complexity environments. Of course it is also compulsory for them to
handle all administrative work concerned with their tasks (Lufthansa, 2005).

On-Time Performance Joerg Speri
14
1.3. Statement of Problem
In times of constantly rising passenger numbers, crowded hubs have become a
major issue in the aviation world. Similarly to logistics, seamless travel is becoming
more and more important. Therefore, punctuality has become a major indicator of the
quality of an airline. A high punctuality performance enables the carriers to
differentiate themselves in a more and more competitive market environment.
There are two related perspectives on this problem. From passengers’ points of view,
on-time inbound performance is of central interest as the punctual arrival at their
destination is within their focus. From an airline’s point of view, the importance of on-
time outbound performance is increasing as studies have shown (Niehues et. al.,
2001) that the tying up of resources due to departure delays has become a major
cost issue.
The major problem under investigation in this thesis will be the level of departure
punctuality on long-haul flights operated by Lufthansa ex Frankfurt Airport. As this
thesis will show, there are various reasons perceived and actual shortcomings in this
area of performance – internal and external ones. This issue causes numerous
further problems for the network system of the airline, inconvenience for the
passengers, and by far most important, tremendous delay costs for the airline.
Therefore the problem has a direct influence on the economic success of Lufthansa –
from a short-term as well as a long-term perspective.
On-Time Performance Joerg Speri
15
1.4. Significance of the Work
The overall aim of the work is to make a significant contribution to the management
process taking place at the Lufthansa station at Frankfurt Airport in order to improve
the on-time departure performance on flights operated by Lufthansa ex Frankfurt
Airport.
From a scientific point of view the significance of the study is rooted in the application
of Human Factors methods to a new field. Although Human Factors’ methods have
been applied in organizational research in business environments before, an
application in process engineering, namely punctuality management is new and
innovative.
Besides, as the later review of the relevant literature will show (see section 2.2),
punctuality management as such, has to date received rather insufficient attention
from researchers. The study therefore also aims to close this gap and help to
conceptualize the problem.
1.5. Assumptions and Limitations
The study was locally limited to the Lufthansa Station at Frankfurt Airport, Germany.
The overall time span of the research process went from March 2005 to August
2005, the time the researcher was on site. The actual survey was carried out from
June 20th 2005 to the 31st of July 2005.
Survey participants were the Flight Managers, Assistant Flight Managers, and
Section leaders of the Lufthansa station. A detailed description of the sample will
follow in chapter three. Flights under investigation were departures ex Frankfurt
operated by Lufthansa & Lufthansa CityLine.
Special focus was attached to the intercontinental flights. The study was further
restricted by the availability and admittance to information due to company policies.

On-Time Performance Joerg Speri
16
The central assumption of the study is the existence of something like an underlying
punctuality culture as part of the overall corporate culture. This culture like any other
is supposed to represent a set of shared attitudes and beliefs in a certain topic.
Moreover, the study assumes that this culture can be measured by appropriate
means. This existence of this culture is essential to this study as it marks the point of
start for the change process to be initiated
1.6. Delimitations
Contrary to previous studies on on-time performance, this one is starting from an
intra-organizational point of departure (e.g. de Neufeville and Odoni, 2003). While
most studies start from a global perspective trying to avoid inner-organizational
involvement (e.g. Niehues, et. al., 2001), this study aims at using the knowledge held
by staff working in the frontline. Their experience and understanding of daily routines
and processes are of central interest for this research project.
Therefore, the perceptions of the problems and shortcomings on the one hand, and
the advantages of the current process design on the other hand, which is held by the
relevant staff, will be within the focus in the research process.
Moreover, the study endeavours to find routines developed by the staff that are not
part of the official process design but have proved to be useful in reality (best
practices). In this regard the study distinguishes itself from approaches usually used
by consultants, or researchers.
On-Time Performance Joerg Speri
17
2. Literature Review and Theoretical Background
2.1. General Background
As the above introduction has shown, the operation of an airport is a rather complex
thing to manage. The numerous sub-processes of the system need to be well
designed in order to run smoothly – not dissimilar to the musicians of an orchestra.
Only with a well designed arrangement, the “tones” will fit together to a piece of
“music”.
When the researcher first came to Frankfurt Airport he thought that it was actually a
wonder that this system performs well – at least to a certain extent – each day.
Actually it was quite impressive especially as there was no obvious conductor
apparent. To approach such a system from a theoretical perspective seemed to be at
least as complicated as managing it.
A first look into the available figures and statistics showed that it was rather easy to
measure the punctuality performance – however, the influencing factors became not
as easily obvious. Therefore, the question arose how to conceptualize the problem
and in the end, if not solve it, at least improve the situation.
As the problem under investigation in this study is concerned with complex system
interactions, an organizational approach seemed to be advisable. However, the
researcher’s choice was not only to use a traditional organizational approach but to
apply a Human Factors perspective – a modern and widely accepted way (HFES,
2006).
The following subchapters aim at giving the reader the necessary theoretical
background to the topic, and in addition deep insights about how the problem was
tackled and conceptualized by the author. It will explain why this specific approach
was chosen and how previous research has used it. Moreover, the chapters will
present a theoretical account used during the research process.
On-Time Performance Joerg Speri
18
2.2. Theory
2.2.1. Human Factors History
“…Human Factors, ergonomics, and engineering psychology are roughly equivalent
terms for the field of science concerned with the optimization of the relation between
people and the machines they operate through the systematic application of human
sciences integrated in the framework of systems engineering” (Jensen, 1997)
The above definition already indicates what a wide field Human Factors science is.
Nevertheless for the purpose of this study it is still too narrow as the course of the
work will show.
Kim Vicente provides an even broader view on the topic that will be the basis of this
research. In his work “The human factor: Revolutionizing the Way People Live with
Technology” (Vicente, 2003) he widens the application of Human Factors to
“systems” in general. For a detailed discussion of his book please refer to the
following chapters. This chapter, however, aims at providing the reader with a sound
understanding of the development of Human Factors.
Boff (2006) supports the opinion that Human Factors as a concept is nearly as old as
mankind itself. He argues that the production and design of early weapons showed
first evidence for the application of Human Factors. Of course the application at this
early stage was of rather intuitive nature.
During the time of the early industrialisation first efforts were made in order to
conceptualize ergonomics as a measure to improve worker efficiency and
productivity (Jastrzebowski, 1857).
However, there is common agreement amongst today’s researchers in the field that
Human Factors as a science emerged from the systematic psychological research
carried out during World War II (Smith 1987). The basis for the development of

On-Time Performance Joerg Speri
19
Human Factors as a distinct field of research provided military aviation psychology
which became more and more important throughout and after the war.
Roscoe dates the “birth” of the field back to early experimental studies carried out
under the leadership of Sir Frederick Bartlett in 1939 (Roscoe, 1997). During the
1940s the US Army set up first programs for aviation psychology commissioning
leading psychologists such as Arthur Melton, Frank Geldard, and Paul Horst
(Koonce, 1984).
The central point of interest at that time was – how to select and test men capable of
withstanding the forces and the stress of combat flying in a more and more
accelerated environment. Men had to fit the machinery.
During world war two the Royal British Air Force as well as the United States Navy
and Army experienced severe losses through “pilot errors”. Therefore a team under
Lt. A. Chapanis was set up to investigate the reasons for these problems. Chapanis’
team soon realized that underlying reasons for the specific problem under
investigation was the poor cockpit design resulting in faulty operation (Roscoe,
1997). Immediate changes in the cockpit design resulted in a clear improvement of
the situation.
With increasing technological progress, engineers soon had to realize that the human
being with its physiological and psychological characteristics had become a major
limiting factor and source of error. Therefore, it attempted to test and find these limits
in order to improve the human-machine-interface to enhance the interaction with the
human being. This “physical fit” as it is attributed by Boff marks the first generation of
Human Factors (Boff, 2006). Boff claims that there are four generations of Human
Factors coexisting at present time, however being in different maturity phases (Boff,
1997).
As explained above generation one, which Boff assumes to be in its maturity phase
is concerned with the “physical fit” aiming at adapting equipment, workplaces and
tasks to the capabilities and limitations of the human being regarding physical

On-Time Performance Joerg Speri
20
aspects such as power, size, etc.. It is this generation that is covered by the above
mentioned definition of Human Factors by Jensen. Representatives of this first
generation are Chapanis, Grether, Fleishman, and Kraft among others (Meister,
1999).
Generation two is concerned with the “cognitive fit” thus integrating the factors
human being, technology, and work in such a way that enables systems to be
effective. Contrary to the first generation this one is focused on cognition and
systems, in particular on cognitive systems integration (Meister, 1999). This new
widening of the perspective (Maurino et al, 1995) comprised the inclusion of the
organizational, cultural, and systemic environment of the individual as a source of
defining inputs for certain behaviours, actions, and decisions. It is also called
ecological approach (Flach, 1995). The basis for this change was laid by Reason
(1990). Central driver for the development of this generation of Human Factors was
the increased complexity that arose from the introduction of IT-systems to a wide
range of working environments (Rasmussen et. al., 1994). Key players of this
generation are among others James Reason, David Meister, Jens Rasmussen, and
Gary Klein. Boff (2006) considers this generation as currently being in its growth
phase.
Generation three Human Factors is similar to generation two as it is also adopting a
systemic approach. However, according to Boff generation three is “marked by a shift
from building better work environments towards enabling humans to work better”
(Boff, 2006). Contrary to generation two which was focused on cognitive fit,
generation three is aiming to find a neural fit between equipment and the human
central nervous system (Boff, 2006). The idea of a “cyborg” or bionic system, an
enhanced human being by means of aiding or amplifying equipment to overcome the
limitation of the human nature, is the central concept of this generation. This
comprises implanted as well as external technologies. Boff (2006) considers this
generation as to be currently emerging, however also referring to the fact that from a
technical perspective many people, being connected to means like pacemakers,
bionic joints or artificial limbs, are “cyborgs” in a wider sense already today.

On-Time Performance Joerg Speri
21
Boff’s fourth generation is at a very early stage of development that he refers to as
“embryonic” (Boff, 2006). As the three previously mentioned generations, the fourth is
also concerned with maximizing human effectiveness. However, generation four is
trying to biologically modify human beings both physically as well as mentally by
means such as advanced genetics or bio-molecular technologies (Boff, 2006). At
present this generation of Human Factor scientists is focused on the application of
pharmacology, bio technology, and genetics to slow down, reverse or modify the
effects of disease or ageing. Sports doping is one of the negative outcomes that
came along with the progress in this field (Eichner, 1997).
One can summarize the four generations briefly, as the first being concerned with
building equipment or work spaces that fit the human body, while the second
generation tries to develop working environments that fit the human brain. Both have
in common that they try to alter the environment of the human being not the human
being itself. Contrary to that generation three and four start exactly from this
perspective – namely actively enhancing the capabilities of the human body. While
the latter is approaching the human body from an intra-biological level the first is
trying to reach the intended enhancements by combing the human body with
technology.
The growing importance of organizational science in various fields but especially in
business science and economics has brought impetus in recognition of Human
Factors as well (Klein et. al., 1993). As the later discussion will show this study is
aiming at finding a physical as well as a cognitive fit in the working environment at
Frankfurt Airport. It can therefore be characterized as generation one and two Human
Factors approach, however with main focus on generation two.
The wide spread application of Human Factors in various fields has led to a
comprehensive preoccupation with the topic in academia (Roscoe, 1997). Following
World War II the utilization of Human Factors specialists began to spread over the
military to civil fields as well, including architecture, environmental design,
transportation, medical systems, office automation, nuclear power plants, mining, oil
field operations, and consumer products to name just a few (Roscoe, 1997).

On-Time Performance Joerg Speri
22
Thousands of positions all over different industries were created. Therefore, the
planning for a society to enhance the cooperation of Human Factors scientists as
well as practitioners began in 1955. The Human Factors and Ergonomics Society
(HFES) was then found on September 25th in 1957 in Tulsa, Oklahoma. 90 people
attended this first meeting. Today there are about 4500 members in more than 50
chapters all over the world (HFES, 2006).
HFES aims at promoting the discovery and exchange of know how concerning the
characteristics of human beings, which are applicable to the design of systems and
devices of all kinds (HFES, 2006). Special attention is laid on systems performance;
information presentation, detection and recognition; related action controls;
workspace arrangement; and the required skills (HFES, 2006).
Since 1958 the society publishes two major periodicals: the Journal of Human
Factors (quarterly) and the Human Factors and Ergonomics Society Bulletin
(monthly).
This overview about the history of Human Factors science aimed at providing a
sound basis for the further literature review. In particular there are two major works
that will be examined closer as they will supply the underlying concepts for this study.
The first is an article by Carayon (2006) from the Journal of Applied Ergonomics. The
second is a detailed account of Kim Vicentes book “The Human Factor –
Revolutionizing the way people live with technology” (Vicente, 2003) and his concept
of “Human-Tech”.
2.2.2. Human Factors in complex sociotechnical Systems
This chapter deals with an article recently published by Pascale Carayon in the
journal “Applied Ergonomics” (Carayon, 2006). Carayons article is based on Vicentes
work from 1999 on work system complexity (Vicente, 1999). Carayons claims that the
increasing work system complexity has a direct effect on the design, implementation
and maintenance of so-called sociotechnical systems. He defines sociotechnical

On-Time Performance Joerg Speri
23
systems as systems where technical as well as social or organizational factors form
working environments for human beings.
Carayon adapted Vicentes dimensions of work complexity such as:
- Large problem spaces: defined by many different elements and forces (e.g.
the number of different passengers at the airport and their complex problems)
- Social systems: defined by the composition of different people that work
together
- Heterogeneous perspectives: from employees with various backgrounds
- Distributed systems: spatial division of employee and work (e.g. weight &
balance center for Frankfurt Airport is located in Capetown, South Africa)
- Hazardous systems: safety and security issues at the airport
- Coupling: defined by highly interdependent processes such as the ground
handling chain (compare Figure 5)
- Automation: defined by highly automated systems (e.g. the computerized
check-in system)
- Uncertain data: uncertainty in data available to the employee (e.g. information
from computer systems about the actual status of an aircraft)
- Mediated interaction: systems that are not directly observable by the
employee (e.g. the baggage processing system for the gate staff)
- Disturbances: employees dealing with unexpected events (e.g. technical
failure, wrong bookings, etc.)
According to Carayon there are two emerging trends at present: First the trend
towards working across organizational, geographical, cultural, and temporal
boundaries. Second an increasing role of the customer in product / service design.
Especially the first trend can be clearly observed in the working environment at
Frankfurt Airport. It will therefore play a central role in the later discussion.
Friedman refers to this first trend as “flattening” of the world (Friedman, 2005).
According to Carayon (2006) services and products are increasingly produced in
processes including various entities or organizations that work together across
On-Time Performance Joerg Speri
24
boundaries. This results in an increased number of interfaces thus amplifying the
complexity of work.
From a Human Factors perspective these “complex sociotechnical systems” require
a clear focus on all dimensions involved in the process (e.g. physical, cognitive,
psychosocial, etc.) (Carayon, 2006).
This also means that system interactions become more and more important. Wilson
(2000) claims that the nature of ergonomics is to understand people and their
interactions, as well as the relationship between these interactions. However, his
model of interactions is not the only one in this field. Also Rasmussen (2000), Moray
(2000) and Smith together with Carayon (2000) among others have developed such
models.
All these models have in common a perspective on work systems comprising the
factors:
- Individual
- Technical work environment
- Organizational work environment
- External environment.
Moreover, especially Rasmussen and Moray put strong emphasis on the cross-
disciplinary nature of such research thus demanding cooperation of Human Factors
scientists with related domains such as organizational science, etc. It is this spirit
that will also be guiding principle for this research.
2.2.3. The Human Factor – Kim Vicente
The review of the literature in the field showed that especially one author had
conceptualized a broadened perspective in an easy to grasp way. In his book “The
human factor – Revolutionizing the way people live with technology” Kim Vicente
(2003) introduced his concept of Human-Tech. Central model of this approach is his

On-Time Performance Joerg Speri
25
Human-Tech Ladder (Figure 6). The following paragraphs will introduce his idea as
the underlying framework for this research project.
Figure 6: The Human Tech Ladder (Vicente, 2003)
Vicente defines five steps on his ladder which represent a hierarchical system of sub-
factors that all together built up the human factor as a whole. In his model, higher
factors require the fulfilment of the corresponding lower level demands. The overall
aim of his concept is “to build a harmonious relationship” (Vicente, 2003, p.54)
between technology and the human operator or user respectively, in order to raise
the likelihood that the technology can fulfil its intended purpose. However, this view is
not only limited to hardware systems and technology but also to organizational
systems.
Moreover, Vicente broadened the view of Human Factors science from a man-
machine focus to a man-system focus. He claims that from a Human Factors
perspective all man-system relationships and interactions are subject to the same
underlying concepts regardless of the nature of the system. Therefore, from his point
of view an organization is not different from a machine – both need to be designed in

On-Time Performance Joerg Speri
26
a way that the people working with them are capable of handling them.
Consequently, the design of a working schedule, for example, is as important as the
design of a joystick or lever of a machine.
At the lowest level of his ladder, physical requirements of a design are of interest.
Vicente claims that at this lowest level, a design has to first of all fit the physical
characteristics of the human body aimed at performing within that design.
Dimensions of this sub-factor are for example: size, shape, location, weight, colour,
and material (compare parallels to generation one Human Factors).
The second level applies a psychological perspective to the design of a given
system. Vicente claims that keeping the psychological capabilities and limitations of
the human being in mind when designing a new system is not just necessary but
crucial. Factors such as the limited capabilities of human short or long-term memory
as well as the limited capability of performing mental calculations or the capacity of
pattern recognition, all these and many more – most of them well known and
researched – should be taken into consideration at this stage.
On the third level a first external non-individual-based factor is introduced – namely
the team perspective. As Vicente claims, the importance of this factor should not be
underestimated. As today’s working environment is largely organized in teamwork –
interactions among the members of a team are of central importance. There is a wide
range of factors that need to be taken into account on this level: team
communications, team coordination, team interaction, and many more. Vicente
explains that from his point of view; first of all an agreement about the common goal
of the team is necessary in order to achieve the overall aim of any teamwork –
namely synergistic effects.
Level four is concerned with organizational issues. As teams do not usually exist
without links to their environment, their organizational embedment is of certain
influence and therefore interest as well. At this level Vicente introduces concepts
such as visions, leadership, incentives, disincentives, and intra-organizational
information flow. To create affinity with people is the overall aim at this level. There

On-Time Performance Joerg Speri
27
are various pitfalls waiting at this level causally emerging from human nature such as
the human tendency to “shoot the messenger”, to still keep on going while it is
actually already too late. These issues would not be as important if the decisions at
the organizational level had not had such a strong influence on the lower levels.
Decisions made at the organizational level have severe consequences for the whole
system –Vicente provides the example of the working schedule which according to
him is at least as important as the design of a switch or lever at a machine in order to
run the system.
At the topmost rung of Vicente’s Human-Tech Ladder, political considerations need
to be taken into account. These comprise issues such as public opinion, social
values, and cultural norms. One could argue that these patterns or concepts have
nothing to do with the design of a system as they are external factors. However, this
is exactly Vicente’s point. He claims that these virtual factors which are rather hard to
grasp and are definitely not physical, do exist and moreover, have strong influence
on the functioning of all systems. As an impressive example, Vicente puts forward
the laws of prohibition in the USA in the 1920s and 1930s. According to him, these
laws mainly failed due to the ignorance of the societal value of freedom and self-
determination. Vicente continues with a comparison that designing such a law under
the given circumstances in the United States at the given time was the political
equivalent of designing a technological system requiring the operators to lift three
tons with their bare hands (Vicente, 2003).
Theoretical support for Vicente’s work comes from the field of Social Psychology.
Commitment and organizational theory provide useful concepts for the understanding
of the problem under investigation.
Organizational theory is concerned with the interactions within and between
organizations. It can therefore be very helpful to understand and explain the
interactions at the team as well as the organizational level of the human tech ladder.
The roots of the field date back to the days of Max Weber. After the First World War,
the focus of organizational studies shifted to analysis of how Human Factors and
psychology affected organizations, a transformation propelled by the discovery of the
On-Time Performance Joerg Speri
28
Hawthorne Effect. This Human Relations Movement focused more on teams,
motivation, and the actualization of the goals of individuals within organizations.
Leading theorists from the field are Fayol, Maslow and Herzberg.
Commitment theory is the last theory that is going to be presented here. This theory
explains how attitudes (opinions, beliefs, ideas, and judgements) align themselves on
behaviour (Freedman and Fraser, 1966). Commitment theory thus allows
interventions on behaviour and attitudes, rejecting the assumption which has been
amply invalidated in reality: in order to change behaviour, just change attitudes.
Commitment theory provides evidence that people can be influenced in their
convictions. Theorists claim that this is possible without applying force, authority, or
even persuasion. Central concept of the theory is the freely consented submission
(Beauvois and Joule, 2000). The idea behind this concept is to obtain, a priori
insignificant acts that make people think about an issue and to change their future
behaviour. Leading theorists from the field are Friedman, Fraser, Beauvois, and
Joule.
Vicente claimed that Human Factors would revolutionize the way people live with
technology (Vicente, 2003). His idea of a design process of any kind of equipment or
work space taking human needs and behaviour into consideration at every level, will
be the underlying concept of this research project. Vicente is a clear representative of
generation two Human Factors. In order to further provide a sound theoretical
understanding of the issue under investigation, the next subchapter provides a brief
overview over the relevant literature on airport management.
2.2.4. Airport and Airline Management
Contrary to the subchapter above which presented the underlying framework for this
specific research project, the following subchapter aims at giving a brief overview of
the relevant standard airport and airline management literature.
There is a group of seven to ten authors among others who have had major influence
on modern management in the aviation business. Contrary to authors of general
On-Time Performance Joerg Speri
29
business literature, these authors specifically developed and applied new methods
suitable for the special characteristics of the field of aviation management.
One of the most prominent representatives of this group is Rigas Doganis. His two
books “Flying Off Course – The Economics of International Airlines” (Doganis,
2002a) and “The Airport Business” (Doganis, 2002b) have become widely used
standard literature most students of aviation management around the world are well
familiar with. Doganis is a well known expert in the aviation business. He worked as
a consultant and was also chairman of the Greek airline Olympic. Today he holds a
professorship at Cranfield University in the UK.
The next author I would like to mention in this context is Stephen Shaw. His work
focused on airline management and marketing. His work on network structures and
airline profitability has been widely accepted. Shaw’s most important work is certainly
his book “Airline Management and Marketing” (Shaw, 2004).
Ashford, Stanton, and Moore are the next authors of the previously mentioned
group. Their work on airport operations has helped to conceptualize the operation of
an airport as no others have. All three are well recognized experts in the field.
Norman Ashford is professor at Loughborough University in England and holds
several chairs as a chartered engineer in various states in the U.S.. Martin Stanton
was a qualified pilot and air traffic controller who worked for several airport authorities
around the world – among them most interestingly for our case – for The Frankfurt
Airport Authority, predecessor of today’s FRAPORT.
Finally Clifton Moore who looks back at thirty four years of experience in the airport
business, and who was president of the International Civil Airports’ Association for
eight years.
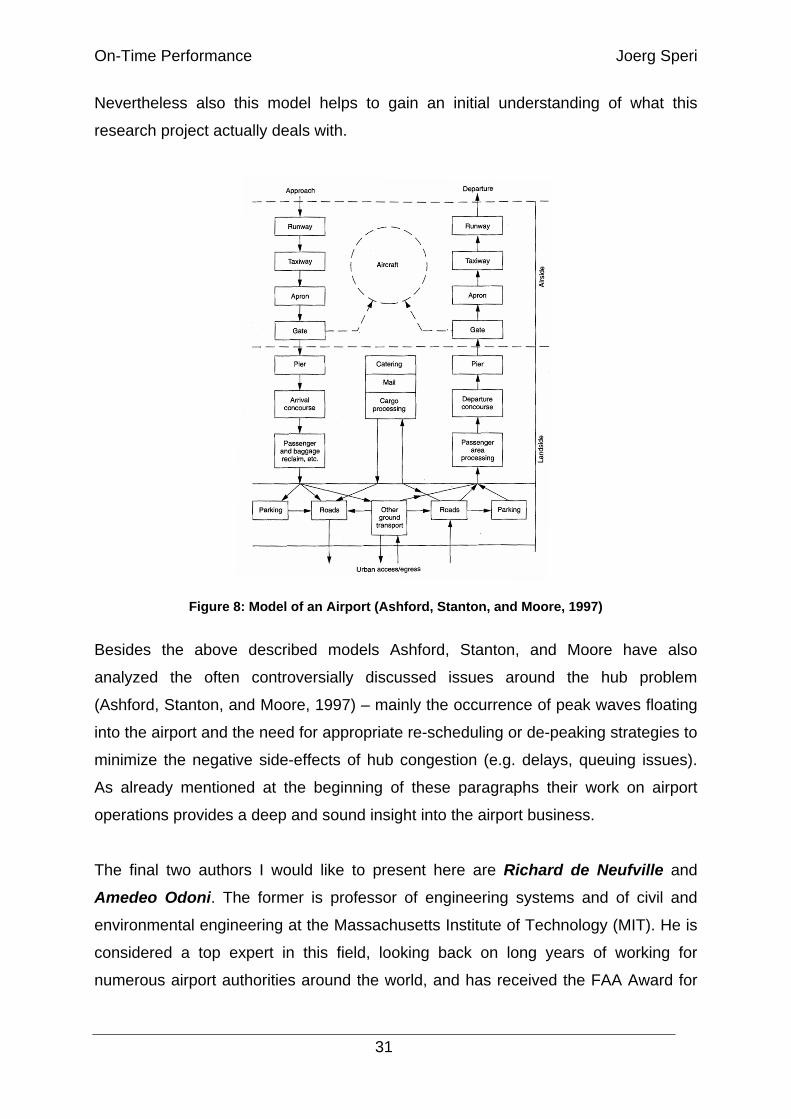
In their work “Airport Operations” Ashford, Stanton, and Moore (1997) have
thoroughly examined all aspects of an airport from managerial as well as
technological perspectives. However, most helpful for this specific research project
are their models about the structure of an airport – physically as well as
organizationally. Although these models represent very simplified views, they can

On-Time Performance Joerg Speri
30
help to structure the very complex organizational systems airports are. The reader
should bear them in mind as a helpful roadmap during the later discussion in this
paper.
Figure 7: Model of Airport Relationships (Ashford, Stanton, and Moore, 1997)
Ashford and a former co-author have developed the above hierarchical model of
airport relationships (Figure 7). It describes the fields of tension between the three
major components of the air transport system (Ashford, Stanton, and Moore, 1997).
The interactions between the user, the airport, and the airlines and the resulting
problems become clear in the model.
It gives a first impression of how complex the whole system is and shows the
necessity for sound planning when designing an airport. As Frankfurt Airport exists
already in its current state and the planning was carried out 40 years ago under
completely different circumstances several other restraints could be added as well
(e.g. security issues).
Their second model is represented in Figure 8. It clearly shows the process chain
and necessary facilities for an airport – again, of course in a very simplified way.
On-Time Performance Joerg Speri
31
Nevertheless also this model helps to gain an initial understanding of what this
research project actually deals with.
Figure 8: Model of an Airport (Ashford, Stanton, and Moore, 1997)
Besides the above described models Ashford, Stanton, and Moore have also
analyzed the often controversially discussed issues around the hub problem
(Ashford, Stanton, and Moore, 1997) – mainly the occurrence of peak waves floating
into the airport and the need for appropriate re-scheduling or de-peaking strategies to
minimize the negative side-effects of hub congestion (e.g. delays, queuing issues).
As already mentioned at the beginning of these paragraphs their work on airport
operations provides a deep and sound insight into the airport business.
The final two authors I would like to present here are Richard de Neufville and
Amedeo Odoni. The former is professor of engineering systems and of civil and
environmental engineering at the Massachusetts Institute of Technology (MIT). He is
considered a top expert in this field, looking back on long years of working for
numerous airport authorities around the world, and has received the FAA Award for
On-Time Performance Joerg Speri
32
Excellence in Aviation Education. The latter is the T. Wilson Professor of Aeronautics
and Astronautics, and professor of civil and environmental engineering; as well as,
co-director of the global airline industry center at the MIT. He is a specialist in
operations research and other quantitative methods. Both professors rank among the
top five in the field and have lasting influence in the business.
Their book “Airport Systems – planning, design, and management” (de Neufville and
Odoni, 2003) ranks among the most important resources when it comes to airport
planning, design, and management. The book itself deals with all sorts of aspects,
beginning with an outlook to the future of the business, through system planning from
airside to landside issues, closing with analysis methods. However, most important
for this work are their chapters about air and landside delays. The reader will find a
closer examination of these chapters in the following subchapter “Punctuality
management”.
The conclusion that de Neufville and Odoni draw in their book, is that taking all
current trends into consideration, the aviation business will undergo a substantial
change in the coming years influencing all aspects in the field. Narrow technological
perspectives will not be satisfactory anymore. Systemic approaches will be the future
combining all sorts of performance factors with commercial ones. De Neufville and
Odoni talk about a “democratization” of the airline and airport business. (de Neufville
and Odoni, 2003)
Of course there is further literature available about aviation management. However, it
is suggested that the above selection comprises the most important and influential
authors and books in the field. The following subchapter will provide an overview
over the relevant literature specifically concerned with punctuality issues at airports.

On-Time Performance Joerg Speri
33
2.2.5. Punctuality Management
This subject has not received much attention from researchers. Therefore, the
theoretical background is relatively thin. The topic punctuality performance has
mostly been examined by consultancies or by the relevant airlines or airport
authorities, but seldom from a scientific point of view.
As mentioned before, de Neufville and Odoni mark a notable exception in this case.
Based on their engineering and operations research backgrounds they have
scrutinized the issue thoroughly. They revealed numerous reasons for delays at
airports. The central outcomes of their research are these three postulates about
airport delays:
- they may be present even during periods when demand is lower than
capacity
- they depend in a non-linear way on changes in demand and / or capacity
becoming very sensitive the closer demand is to maximum capacity
- they exhibit a complex dynamic behaviour over any time span when the
runway system is utilized heavily.
Moreover, de Neufville and Odoni claim that delay length and variation rises non-
linear with increasing utilization of an airport system. In cases when the utilization
rates exceed 85% to 90% of maximum capacity, delay length and variation will reach
unacceptable levels. Interesting in this respect is the fact that Frankfurt Airport
currently runs at an overall utilization rate close to maximum capacity and even
exceeding that almost every day during certain main peak periods.
To come back to de Neufville and Odoni’s (2003) work - during their studies they also
found that the demand peak and the delay peaks do not necessarily occur at the
same time. There are time spans of up to three hours in between. According to de
Neufville and Odoni, this is mostly due to very complex flow and queuing processes.
With the help of quite extensive mathematical equations originating from the field of

On-Time Performance Joerg Speri
34
stochastic and queuing theory these effects can be modelled. The central outcome of
their research in this field can be summarized as follows:
- Airport operators should not operate their facilities close to or above
maximum capacity
- Doing so would risk having long delays, long waiting lines and a poor level
of service.
- Delays during operation close to maximum capacity do not only increase
drastically in their length and frequency but are also subject to
unpredictable variability
- Under the same set of a priori conditions delays on one day may be
modest while on another day will reach extreme levels
- Many initiatives at major airports aim at producing major changes while
keeping costs low, however mostly only small changes, much less than
expected by airport operators, can be observed. (de Neufville and Odoni,
2003)
Due to their background de Neufville and Odoni chose a rather mathematical
approach. However, as this study is starting from a Human Factors perspective it
might be closer to the second group of research work that is described next. There
are quite a few studies on on-time performance at major airports mostly carried out
by consultancies.
The most widely recognized punctuality study among them in Europe is the Booz
Allen and Hamilton paper “How airlines can improve on-time performance” (Niehues,
et. al., 2001). The Booz Allen and Hamilton team included all major European
network carriers. During the research process it became obvious that the major
problem regarding on-time performance analysis lies in the qualitative richness of
data available from the organization that needs to be grasped by quantitative
measurement tools.

On-Time Performance Joerg Speri
35
However, three major adjustable factors in order to successfully influence punctuality
were identified:
1. Network planning and control
2. Aircraft Availability
3. Ground Operations and Departure Process
In order to adjust them properly and therefore make the right trade-off decisions
between cost, utilization, and punctuality the root causes of the problem needed to
be scrutinized. The methodology of the abovementioned study followed a three
dimensional approach which contains process monitoring and sampling, simulation,
and rather more conventional methods such as delay code frequency analysis,
correlation analysis, and fishbone diagrams.
The central outcomes of this study were these six points:
Punctuality…
1. is not only a quality issue – it reduces costs.
2. differentiates airlines from their competitors.
3. is a powerful performance indicator – when operations are punctual
most other performance indicators are “green” as well.
4. is a tool for bridging inner-organizational boundaries
5. should be treated equally to costs and quality in contractual
agreements.
6. is a leadership challenge that requires high priority in order to
motivate the whole organization.
Impressive in this regard is the finding that four to sixteen million Euro could be
saved annually by reducing the number of delays by just one percent in the fifteen
minute threshold usually applied. This number applies to major carriers such as
Lufthansa.
On-Time Performance Joerg Speri
36
However, the study also found out that punctuality levels, close to or even above,
85% are hard to be reached and then mostly at unacceptable costs. Therefore,
precisely calculated trade-off decisions between punctuality vs. turnover and yield or
vs. cost and equipment utilization respectively must be made by management.
As this study is mainly concerned with the last of the three before mentioned levers,
namely Ground Operations and Departure Processes – the approaches described by
the study to improve the situation there is certainly of greatest importance.
The study of Booz, Allen and Hamilton consultants (Niehues, et. al., 2001) claims
three major points need to be implemented in order to successfully influence the
departure punctuality on the ground.
- Process engineering Thorough operational diagnostics
Implementation of improvements
- Empowerment, motivation, and discipline
Highly motivated people, empowerment of front
line staff supported by adequate incentive
schemes can do more for punctual operations
than millions of investment dollars
- Supplier relationship and performance Integration of critical milestones in the departure
process as performance indicators
“Extended Enterprise” approach to manage the
entire process beyond organizational boundaries
As to the second lever “Aircraft Availability” Booz, Allen and Hamilton consultants
(Niehues, et. al., 2001) also identified three points of potential improvements. These
are: fleet structure and reserve planning, unscheduled maintenance, as well as spare
part and workshop management.
Of central importance in this regard is the homogeneity of the fleet allowing a
minimum of vulnerability following version or equipment changes.

On-Time Performance Joerg Speri
37
The third lever elaborated on was “Network Planning and Control”. On this point,
sound planning was identified as the most important basis for the punctuality
performance of an airline. Furthermore, a well designed network structure and
appropriate block, ground, and, most interestingly, slack time deployment show a
tremendous significance. Moreover, the study recommended a “center of gravity” for
the operational procedures – basically a central control unit. As a last point, effective
strategies for recovering from major delays were mentioned. The consultants even
recommended to value punctuality above regularity – consequently airlines should
rather cancel individual flights in order to regain control over their schedules
(Niehues, et. al., 2001).
2.2.6. Quality Management
While the previous chapter was concerned with literature directly dealing with on-time
performance issues, this one will take a more indirect approach. The study of Booz,
Allen and Hamilton (Niehues, et. al., 2001) claimed outbound punctuality is an
indicator for the quality of the performance of an airline. Also, de Neufville and
Odoni’s work considered the level of service as a clear quality issue. Therefore, it
seems logical to consider quality literature for this study as well. There is ,of course,
a tremendous amount of literature available on this topic – not specifically dealing
with punctuality issues but with quality in general. However, as the chosen approach
for this study is not coming from this field, it seemed unnecessary to include a full
account of quality management literature. Instead, the author chose two
representative works for the field.
The first is probably the most influential book on service marketing in the German
language – namely Heribert Meffert and Manfred Bruhn’s book
“Dienstleistungsmarketing: Grundlagen, Konzepte, Methoden” (“Service Marketing:
Basics, Concepts, Methods”, the author) (Meffert and Bruhn, 2000). The book
presents very detailed insights and conceptualizes quality management issues as
part of service management. The topic is examined from various perspectives taking
customer perceptions and the companies’ view into account. Various factors are
shown and especially the relation between fault costs and preventive costs is

On-Time Performance Joerg Speri
38
scrutinized. Moreover, the authors stress the importance of a well designed
complaint management scheme. According to Meffert and Bruhn, quality
management is basically divided into four major individual processes which take
place at the same time or in sequence. These are quality planning (i.e. customer or
staff surveys, etc.), quality steering (i.e. incentive schemes, training, etc.), quality
auditing (i.e. customer satisfaction tracking, complaint analysis etc.) and finally
quality management presentation (i.e. publishing of quality statistics, etc.).
The second piece of research to be mentioned in this respect is a somewhat
historical document (Herbst, 1977). During the intensive literature study at the library
of Dresden University of Technology, a document dating back to 1977 – more
accurately a thesis from the former German Democratic Republic – captured the
author’s attention. Although written in a former communist country under a planned
economy, Herbst had at that time already emphasised the importance of outbound
punctuality as an indicator for overall service quality. Herbst claimed that an overall
high level of service quality includes departure and arrival punctuality as central
issues. As these issues are directly perceivable by the passenger he awarded them
special importance. Furthermore, he argued that a high level of on-time performance
could be used to differentiate a company from its competitors. Moreover, he claimed
that the punctuality performance should be taken as the major indicator of whether
an operation is soundly designed or not. As the study was written in a communist
country, Herbst also referred to certain moral issues and stressed engagement of
every staff member to help building a better world. Due to the very special economic
and political environment his work refers to, it is difficult to transfer all the findings to
our modern times, nevertheless it seemed interesting and worthy of mention.
2.2.7. Surveys in Organizations
The heading above is anticipating the result of the choice of the basic approach to
this research project. The survey method was chosen after thorough consideration of
all possible alternatives – however, due to its unique characteristics, the survey
method seemed most promising for this purpose. Other alternatives such as field and
laboratory experiments promised to either provide unsatisfying results or were

On-Time Performance Joerg Speri
39
basically unsuitable for given problems under the given circumstances. This chapter
does not aim at giving a broad overview about all possible approaches that could
have been used, but rather provides a deep review about the chances and risks of
the survey method. Moreover, the set of tools that a survey approach offers as well
as its advantages and disadvantages, will be subject to closer examination.
Surveys have a long tradition in the organizational sciences. Therefore, one can fall
back on a broad variety of literature available about the topic. In addition, a
comprehensive preoccupation with the topic has led to a sound understanding of the
method among researchers. This has also led to a common agreement about a set of
certain advantages and disadvantages, risks and limitations of the approach.
Exemplary, the author would like to mention the contribution of S.E. Seashore,
program director emeritus of the Institute of Social Research at the University of
Michigan to G. Salvendys “Handbook of Human Factors” (Salvendy, 1987). Coming
from a Human Factors background, his summary about the positive and negative
characteristics of the survey method seemed most promising. Nevertheless, the
reader should be aware that this choice represents just one possibility among many
others. However, as stated before, there is a common agreement in the literature
which allows us to consider Seashore’s summary as representative.
According to Seashore, surveys can be utilized in manifold ways in an organization
and for various purposes. These may be the intention to predict future developments;
or the search for an explanation for a certain problem; or the need for monitoring
change that an organization is currently undergoing; or the evaluation of certain
processes started; or producing a basis for a certain decision to be made; and finally
basic research in order to scrutinize not yet understood issues.
Following Seashore’s exposition, these are the main advantages of the method:
1. Surveys can be conducted with assured anonymity and / or confidentiality for
the respondents, thus allowing the treatment of sensitive topics, opinions, and
so forth usually not subject to open discourse.
2. With sufficiently large samples, statistical analysis can be applied and
statistical results can be derived.

On-Time Performance Joerg Speri
40
3. Standardized questions and formats allow an easy replication and / or
extension to other groups and organizations
4. Cost effectiveness – especially questionnaire surveys provide an easy way to
gather information about a broad variety of topics from a relatively large
number of people at a relatively low cost basis.
However, there are also disadvantages. Seashore put the following risks and
limitations of the method forward:
- Ambiguity of Purpose: management and other parts of the organization
may not agree on the purpose of the study which therefore may have very
limited practical utility for the planning
- Distrust: there must be an initial trust in the survey as a whole and the
assurances concerning confidentiality and anonymity from the employees
in order to take part
- Unacceptable topics: in each organization there are topics that are either
too controversial or are not to be discussed for one or another reason
- Organizational disturbance: the conducting of a survey is linked to a certain
time involvement for the respondents. Furthermore, the survey may raise
unrealistic expectations of further action
These are just a few risks and limitations, however. Seashore also claims that
bearing in mind these points during the planning process can at least limit their
negative influence. The planning of a survey should therefore be carried out very
carefully as it lays out the basis for the success or failure of the whole work. Manifold
issues have to be taken into consideration, among them design issues such as the
tools for the survey (i.e. interviews or questionnaires), the population and sample
size, pre-testing issues, and instrument development. In addition, organizational
issues such as confidentiality, participation, voluntarism, and external help play an
important role. Finally, Seashore claims that issues concerning the analysis and
interpretation of the results should be planned carefully in advance.

On-Time Performance Joerg Speri
41
As it was of specific interest to this study, a brief discussion about the tools, their pre-
testing, confidentiality issues, and interpretation of the results will follow. As to the
question whether interviews or questionnaires were to be applied, the decision was
certainly not easy. Both tools have specific characteristics, advantages and
disadvantages. The advantages of the questionnaire lie in its feasibility, its potential
confidentiality, and cost effectiveness which predestine them for larger populations
and sample sizes. However, the interview allows the researcher deeper insights and
the possibility to interact with the respondents. Nevertheless, it is more time
consuming and therefore hard to realize in a time – sensitive environment. As to
confidentiality – special requirements such as political, legal, or personal have to be
taken into consideration. Management as well as labor union positions have to be
carefully respected. Moreover, the respondents’ trust in the researcher and the
project need to be built up first. Finally, the interpretation of the results can easily be
biased and should therefore be carefully evaluated and validated by the respondents.
There are various levels of complexity conceivable approaching the interpretation,
the choice of which level to use also influences the overall outcomes.
As one can see, a survey is complex to plan and carry out. One has to be very
careful at every step. Nevertheless, it seemed to be the most appropriate choice for
the problem under investigation in this study.
2.3. Conclusions The previous chapters aimed at providing the reader with the necessary background
information. In addition, the present chapter intended to create a general theoretical
understanding of the problem under investigation.
The chapters showed that there is a tremendous amount of literature available on the
topic of airline management. However, the specific issue under investigation in this
study lacks attention by researchers. Nevertheless, the literature that does exist
showed that the topic has various facets. Furthermore, the review showed the
different perspectives the problem could be tackled from.
On-Time Performance Joerg Speri
42
The underlying theoretical framework was introduced – namely an advanced Human
Factors perspective following Vicentes theories. This extended view on Human
Factors includes organizational as well as political issues which were of central
interest to this study.
As a logical consequence to this initial choice, an appropriate methodological
framework was introduced – namely an organizational survey method. The
advantages of the study lie quite clearly in its relatively easy feasibility. However, the
method also holds certain disadvantages which were to be taken into consideration.

On-Time Performance Joerg Speri
43
3. Methodology and Procedure
3.1. Introduction
The method and procedures used during a research project need to be well chosen
and designed in order to achieve the aim intended. The following sections will
describe and explain how the data was gained and analysed. Moreover, issues such
as reliability and validity of the outcomes of the research will be discussed. The
chapter will finally present a graphical outline of the research process.
3.2. Research Approach: Quantitative and Qualitative
This section aims at discussing the general approach to the problem under
investigation. Therefore, it will be of theoretical; one could even say philosophical,
nature dealing with the underlying paradigm of the research. The approach chosen
could be called a “semi”- critical one. Although the author is aware that a “semi”-
critical approach does not really exist, the further discussion will clarify the underlying
ideas.
Critical theory originates in the Frankfurt School, i.e. members of the Institute for
Social Research of the University of Frankfurt in Germany. Contrary to “traditional”
theory that is based on scientific knowledge as the only source of authentic
knowledge, critical theory is oriented towards social change (Horkheimer, 1982). This
also comprises involvement of the researcher contrary to the purely observational
mode of “traditional” theory. Leading theorists in the field are Max Horkheimer,
Juergen Habermas, and Erich Fromm. The underlying concepts for the theory come
from Kant’s “critical philosophy” and Karl Marx. Critique in their sense is connected
with philosophical reflection on the limits of claims made for certain kinds of
knowledge the emphasis on moral autonomy (Horkheimer, 1993).

On-Time Performance Joerg Speri
44
Linking this back to the specific topic under investigation in this work raises the
question: which approach to choose? The crucial question behind all that is – at least
in the author’s opinion – how can the perception of staff about the quality of a
process design be measured best?
Since the author considers things like perception and quality assessment as being
very subjective matters, one would have to tend to an interpretive approach, giving
the researcher the opportunity to interpret the respondents’ answers. Interpretive
approaches – not being based on quantitative backgrounds – are commonly
attributed to have a critical tendency.
On the other hand, one needs to derive answers for the management to assist them
in their decision making – something one could call “hard facts”. Therefore,
quantitative means also have to be considered as they provide results that are more
able to be generalized than the outcomes of purely qualitative means. However, that
would interfere with the argumentation above, that is, it shows a tendency towards a
positivist approach, clearly attributed to “traditional” theory.
Bringing together the better of the two worlds, positivism on the one hand and
interpretivism on the other hand, seems to be the only way out. This leads the author
to choose an intermediate approach with a basically critical tendency as it enables
the researcher to combine the methodologies of both approaches while allowing him
to get involved with the topic and to include his or her interpretations. This does not
mean that the researcher is undecided. It just gives one the chance to critically
assess the quantitative outcomes as well as the qualitative results.
However, the chosen approach was called a “semi”- critical one. This is mainly due to
the fact that the author would like to leave out the moral level and orientation towards
too radical social change of the critical approach as stressed by Horkheimer (1993).
For Horkheimer:
“... a theory is critical to the extent that it seeks human emancipation, to liberate
human beings from the circumstances that enslave them” (Horkheimer 1982, 244).

On-Time Performance Joerg Speri
45
The author is aware that this undermines the fundamentals of the critical approach.
However, this clearly defines the intermediate position of the chosen approach.
It is that kind of moral involvement that brings science and scientific research nearer
to where it started from – beliefs and speculation. The philosophical discussion about
this issue would go too far here; therefore, the reader is asked to accept the above
as a position statement.
In conclusion, one can say that a basically critical approach to the given problem
would probably fit best as it enables us to use quantitative as well as qualitative
methodologies and to include interpretation of the results from the subjective
perspective of the author. This is considered as to be of particular importance as
issues like perception and quality assessment are to be approached from a
subjective point of view in this research project while there is also a certain need for
“hard” facts to assist the management in its decision making processes.
In contrast to this rather philosophical chapter the following sections are concerned
with concrete methodologies applied in the research process.
3.3. Data Collection Procedures
3.3.1. The Delay Codes In order to collect statistical data as reference to the answers of the respondents of
the survey, delay code statistics were used. As they were easily accessible through
Lufthansa computer networks and are basic to the official punctuality statistics of the
airline, they seemed appropriate for the purpose of this study.
These numeric codes represent underlying reasons for departure delays. They follow
IATA standard regulations (see Appendix II for a complete list). Moreover, Lufthansa
uses an additional letter code in order to specify the delay reasons closer (see
Appendix II for a complete list). Delay codes are assigned to every departure delay
event lasting longer than three minutes. However, according to IATA standards

On-Time Performance Joerg Speri
46
(IATA, 2005), delays up to fifteen minutes are ignored and the flight event is counted
as punctual. Only delays above this 15 minute threshold affect the punctuality
statistics.
The delay codes are allocated following a standard procedure: the flight managers at
the gate and the head loaders at the aircraft report the reasons (not the delay codes!)
for the delayed departure to an event controller in the Hub Control Center. From this
information and under inclusion of all other information, the controller allocates the
appropriate delay code. This code is then published in the various computer systems
from were they are available thereafter. This procedure seems to be quite simple and
clear. However, the reader should bear in mind that all players are under high
pressure and workload, and especially the controller is usually supervising numerous
flights at a time. The shortcomings of this process will be subject to the later
discussion.
In order to support the controller, Lufthansa runs a complex network of sensors and
switches at the airport that reports exact time stamps of important key milestones in
the handling process.
This comprises issues such as closing and opening of cargo and passenger doors,
completion of fueling, cleaning and catering, time of pushback, and many more. All
this data is transferred through various systems (i.e. ACARS) to central computer
software called “Allegro” which makes this data available to everybody with the
necessary authorization.
All data together is consolidated by two major computer programs from where the
data for this study was derived – namely “Obelisk” and “DASGO”. In a next step this
data was clustered according to further IATA standards (IATA, 2005) until it could be
presented in the form as available in chapter four. Hereby, certain groups of delay
codes are clustered and labeled (i.e. Technical, ATC, Airport, etc.).

On-Time Performance Joerg Speri
47
A detailed analysis of the delay codes can be found in chapter four. The before
mentioned shortcomings of the process of delay code allocation will be subject to the
discussion in chapter five.
3.3.2. The Survey
The survey among the Flight managers, Assistant Flight Managers, and section
leaders is the central part of this work. As mentioned before, their attitude, beliefs
and perception towards punctuality was the subject of interest. Linking this back to
the before mentioned Human Tech Ladder, the survey approaches the topic on the
team and organizational level thus trying to evaluate communication patterns and
identifying underlying “culture” aspects.
Looking at the following definition of a safety culture indicated parallels to the issue
under investigation. Generally, the word “safety” cannot just be exchanged by
“punctuality”. However, in several places it can:
Safety Culture:
- Those aspects of culture which affect safety
- The characteristic shared attitudes, values, beliefs and practices
concerning the importance of health and safety and the necessity for
effective controls
- The safety culture of an organization is the product of individual and group
values, attitudes, competencies, and patterns of behavior that determine
the commitment to, and the style and proficiency of, an organization’s
health and safety programs. Organizations with a positive safety culture
are characterized by communications founded on mutual trust, by shared
perceptions of the importance of safety, and by confidence in the efficacy
of preventive measures (Booth, 1996)
The underlying idea of the survey therefore was to assess whether something like a
“punctuality culture” exists at the Lufthansa station and how strong it is. Moreover,

On-Time Performance Joerg Speri
48
the idea was to illuminate possible improvements of the on-time performance by
improving the inner-organizational punctuality culture.
Starting from this point of departure, it seemed logical to adapt methodologies used
in previous research to identify the state of a cultural issue. As the above definition
was coming from a Human Factors field – namely safety management – it
furthermore seemed appropriate to adapt an already existing methodology from that
field.
The method finally chosen was the safety culture assessment tool developed by AEA
Technology during the early 1990s. This tool was an attempt to identify the
weaknesses and shortcoming of the safety culture of an organization operating in a
high tech environment. The factors shown in table 1 were identified as central issues.
(van Steen, 1996).
Table 1: Factors AEA Safety Assessment Tool (van Steen, 1996)
Management and Organizational Factors
Enabling Activities Individual Factors
- Positive organizational
attributes
- Reinforcement and
incentives
- Individual responsibilities
- Management
commitment to safety
- Communication - Individual perceptions
- Strategic flexibility - Training
- Participation and
empowerment
Following this guideline the researcher derived a questionnaire for the purpose of this
study that covers the above mentioned issues. The reader will most certainly be able
to find the parallels in the questionnaire used for this research (see Appendix I for
complete questionnaire). Table 2 shows which items in the questionnaire could be
assigned to which factor in the AEA safety assessment tool. Of course, not all
questions fit this scheme. As the objective of the research changed from safety to
punctuality, some adaptation was necessary. Moreover, the analysis of the
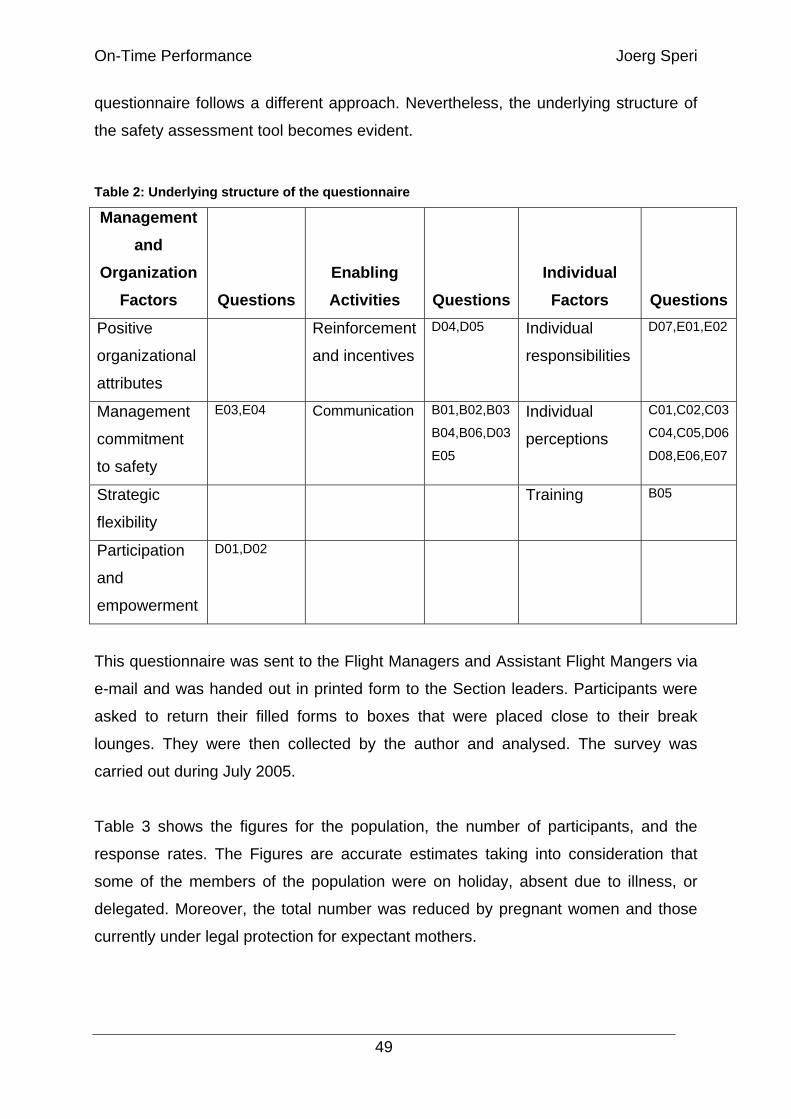
On-Time Performance Joerg Speri
49
questionnaire follows a different approach. Nevertheless, the underlying structure of
the safety assessment tool becomes evident.
Table 2: Underlying structure of the questionnaire
Management and
Organization Factors Questions
Enabling Activities Questions
Individual Factors Questions
Positive
organizational
attributes
Reinforcement
and incentives
D04,D05 Individual
responsibilities
D07,E01,E02
Management
commitment
to safety
E03,E04 Communication B01,B02,B03
B04,B06,D03
E05
Individual
perceptions
C01,C02,C03
C04,C05,D06
D08,E06,E07
Strategic
flexibility
Training B05
Participation
and
empowerment
D01,D02
This questionnaire was sent to the Flight Managers and Assistant Flight Mangers via
e-mail and was handed out in printed form to the Section leaders. Participants were
asked to return their filled forms to boxes that were placed close to their break
lounges. They were then collected by the author and analysed. The survey was
carried out during July 2005.
Table 3 shows the figures for the population, the number of participants, and the
response rates. The Figures are accurate estimates taking into consideration that
some of the members of the population were on holiday, absent due to illness, or
delegated. Moreover, the total number was reduced by pregnant women and those
currently under legal protection for expectant mothers.

On-Time Performance Joerg Speri
50
Table 3: Figures of Participants
Population
Total:
18 Section Leaders
150 Flight Managers & Assistant Flight Managers
168 Persons
Participants
Total:
18 Section Leaders
115 Flight Managers & Assistant Flight Managers
133 Persons
Respondents
Total:
6 Section Leaders
28 Flight Managers & 10 Assistant Flight Managers
44 Persons
Response Rate Overall:
33.3 % Section Leaders
33.0 % Flight Managers & Assistant Flight Managers
33.0 %
Gender 89 female persons of the participants
44 male persons of the participants
As the reader can see from the questionnaire the participants had either to answer
multiple choice questions or open questions. The scale reached from 1 to 5 where 1
represented “Yes” or “Full Agreement, and 5 represented “No” or “Total
Disagreement”. The participants were furthermore provided with an explanation of
how to use the scales and how to fill in the forms. A small test prior to the survey
showed that there were no major problems in connection with filling out the forms.
There were 36 items in the questionnaire which were divided into 6 clusters, each
dealing with a separate field. These clusters were:
1. General Questions
2. Information / Communication
3. Central Hub Control
4. Ideas and Motivation
5. Punctuality Management
6. Delay Reasons

On-Time Performance Joerg Speri
51
In addition there was a last item allowing the respondents to generally comment on
the issue of punctuality at Frankfurt Airport.
While the delay code statistics provided solely numerical data, the survey also
generated a tremendous amount of qualitative data. Moreover, the researcher gained
deep insights and detailed knowledge about the processes, their shortcomings and
the overall situation at the airport. All this information was subjected to a detailed
analysis. Chapter 3.4. includes an overview about how the analysis was carried out
and which methods were applied. The analysis itself is presented in chapter 4.
3.4. Data Analysis Procedures
As mentioned before, a broad variety of information was to be analysed during this
study. The major focus was on the results of the questionnaire survey.
In a first step, all questionnaires were screened in order to gain a first overview over
the data gathered.
In a second step, a codebook was developed. This tool helped to code the answers
of the respondents in order to prepare them for further analysis. For the complete
codebook please refer to the appendix section (Appendix III). Central issues in this
phase of the analysis process were how to deal with answers that were not stringent,
missing or not plausible.
In a next step all German data (i.e. the answers to the open questions) was
translated into English. In order to avoid translation biases the well-known back and
forth translation method was used. This method works as follows: the author
translated the responses to the questionnaires from German into English. This
translated version was then re-translated into German by a native speaker from the
U.S. who is literate in German. Both, the original German version and the re-
translated German version were compared. In case of discrepancies the differences
in the translations were eliminated in a discussion process between the author and
the native speaker.

On-Time Performance Joerg Speri
52
Following this step, the data was entered into lists and each case was given an
identification number. This work was carried out by the researcher and an auxiliary
scientist in order to avoid mistakes and biases while entering the data – breaks every
ten minutes were held. Moreover, the position of the data reader and the person at
the computer was changed in every break. At the end of this process the researcher
and the auxiliary scientist individually checked the data entered. No discrepancies
were found.
The data was then processed by means of a MANCOVA (Multivariate Analysis of
Covariance) in order to elaborate potential impacts that certain factors (e.g. gender,
position, etc.) might have had. The results of the analysis of the answers to the
questionnaires were then presented graphically in order to provide the basis for the
further discussion. The MANCOVA was computed with SPSS software taking gender
and position as factors and duration of service at Lufthansa as covariate into
account. Although duration of service at Lufthansa does not entirely meet the criteria
(e.g. interval scale) for being used as a covariate in a MANCOVA as the possible
answers to the item were clustered beforehand, it still provided useful insights as a
rough indicator whether the time of working for Lufthansa had any impact on the
overall results.
Parallel to this analysis a second one was carried out in order to examine the delay
codes. The data for this step was derived from the various Lufthansa computer
systems. The delay statistics were computed for the complete year 2004 (as
reference) and for 2005 until the 35th week. The large amount of data was then
clustered according to the internationally common standards set by the International
Air Transport Association (IATA). Later the statistical data was presented graphically
as well.
The results of both analyses were finally combined in the discussion. The various
outcomes were set into relationship with each other. From this discussion, final
conclusions and implications were drawn. Following this step, feedback is planned to
be given to the participants. Moreover, the study will be presented to the
management team of the Lufthansa station.

On-Time Performance Joerg Speri
53
3.5. Reliability and Validity
These two concepts bear substantial risks and opportunities for researchers. Due to
the fact that they provide information to which extend the results of a study are
trustworthy and reliable they are of considerable importance to any study carried out.
Since no paper will ever have absolute validity and reliability, research should at least
aim at reaching a sufficient level. In order to meet these requirements Yin’s 4-step
testing model (Yin, 1994) was applied.
The first step of this model tests the Construct Validity. It requires that data should
be collected and analyzed from various sources in order to gather a wide range of
information. According to Yin (1994) this minimizes the effects of information coming
from a faulty source on the overall result of the study. Information from various
sources can be cross-checked and is therefore considered to be more valid. The
underlying construct of this study can be considered as to fulfil Yin’s criteria. The
reason is that the information from the participants can be cross-checked with
experiences made by the researcher himself as he was at the airport during the
entire study. Furthermore, all Lufthansa delay statistics were compared to external
sources to avoid biases from that side.
The second step of Yin’s test is on Internal Validity. This step deals with the
correctness and trustworthiness of the collected data. It implies that Internal Validity
is reached when the applied research instruments measure what they are supposed
to measure. This was aimed for by applying well tested and widely-accepted
methods. However, as these methods were adapted in order to meet the
requirements of the problem under investigation, this point seems critical as well.
Therefore, the questionnaire was pre-tested on a random sample of respondents.
These respondents came from the Lufthansa station as well, however they were not
part of the later set of respondents used for the survey. The outcomes of these tests
were taken into consideration when setting up the final version of the questionnaire.
Moreover, the reader should be aware that the whole research process took place in
a German speaking country – the questionnaires were originally given out in
On-Time Performance Joerg Speri
54
German. Later they were translated into English. Although measures were taken to
eliminate translation biases, this risk cannot be ruled out completely.
The third step examines the External Validity. This step analyses to which extent
the findings of a study can be generalized. As the study does not intend to generate
generalized results, this point seemed of secondary importance. The work clearly
aimed at providing useful information to the management of the Lufthansa station at
Frankfurt Airport. As each airport is a unique and complex system it is certainly not
easy to transfer findings from one to the other. However, certain findings can be
transferred. This is the case when the findings do not implicitly touch operational
issues. In particular, this comprises the findings concerning staff motivation, intra-
organizational communication patterns, and management commitment to punctuality.
The very last step of Yin’s test deals with Reliability. He claims that this aim is
reached if a study leads to basically the same results when carried out again under
exactly the same conditions. On condition that a future researcher is provided with
the same sources and is following the applied method he will at least come to
comparable findings. As the answers to questionnaires are also partly influenced by
external factors not within the sphere of influence of the researcher, this part of the
study could eventually lead to slightly different results, although the major direction
should still be able to be reproduced. However, the statistical data from the
computer systems will certainly be equally accessible to any researcher. Therefore, I
consider this point as covered. (Yin, 1994)
Concluding, one can say that overall the study fulfils the major criteria of validity and
reliability. Where these are not fulfilled to the extent intended by Yin, mostly specific
characteristics of the given research problem are underlying.
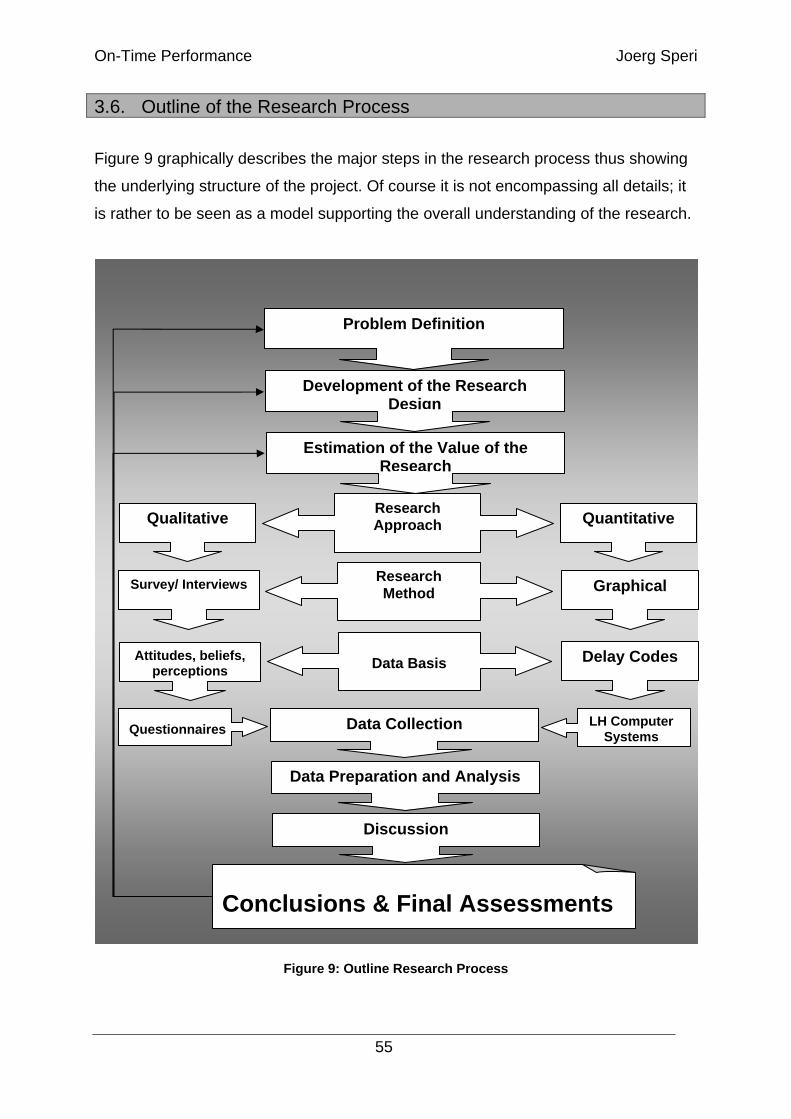
On-Time Performance Joerg Speri
55
3.6. Outline of the Research Process
Figure 9 graphically describes the major steps in the research process thus showing
the underlying structure of the project. Of course it is not encompassing all details; it
is rather to be seen as a model supporting the overall understanding of the research.
Figure 9: Outline Research Process
Problem Definition
Development of the Research Design
Estimation of the Value of the Research
Research Approach Qualitative
Research Method Survey/ Interviews
Data Basis Attitudes, beliefs,
perceptions
Data Collection
Data Preparation and Analysis
Conclusions & Final Assessments
Quantitative
Graphical
Delay Codes
Discussion
Questionnaires LH Computer Systems
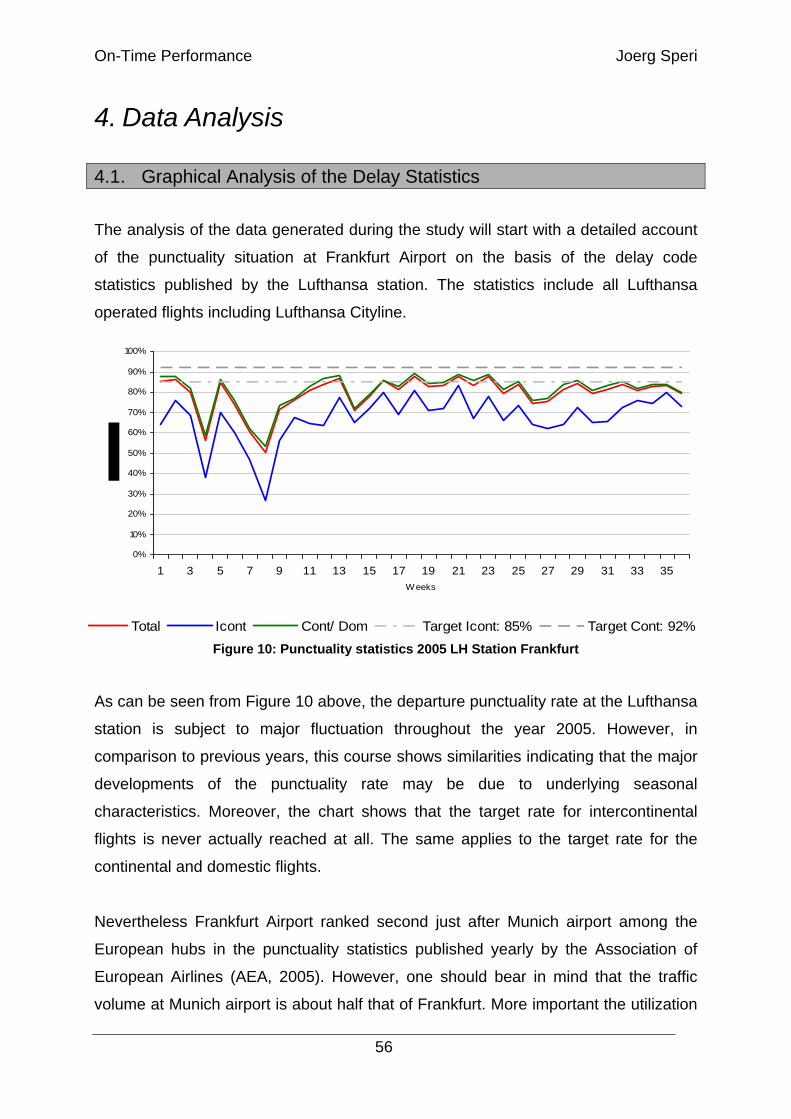
On-Time Performance Joerg Speri
56
4. Data Analysis
4.1. Graphical Analysis of the Delay Statistics
The analysis of the data generated during the study will start with a detailed account
of the punctuality situation at Frankfurt Airport on the basis of the delay code
statistics published by the Lufthansa station. The statistics include all Lufthansa
operated flights including Lufthansa Cityline.
Figure 10: Punctuality statistics 2005 LH Station Frankfurt
As can be seen from Figure 10 above, the departure punctuality rate at the Lufthansa
station is subject to major fluctuation throughout the year 2005. However, in
comparison to previous years, this course shows similarities indicating that the major
developments of the punctuality rate may be due to underlying seasonal
characteristics. Moreover, the chart shows that the target rate for intercontinental
flights is never actually reached at all. The same applies to the target rate for the
continental and domestic flights.
Nevertheless Frankfurt Airport ranked second just after Munich airport among the
European hubs in the punctuality statistics published yearly by the Association of
European Airlines (AEA, 2005). However, one should bear in mind that the traffic
volume at Munich airport is about half that of Frankfurt. More important the utilization
0%
10%
20%
30%
40%
50%
60%
70%
80%
90%
100%
1 3 5 7 9 11 13 15 17 19 21 23 25 27 29 31 33 35W eeks
Total Icont Cont/ Dom Target Icont: 85% Target Cont: 92%
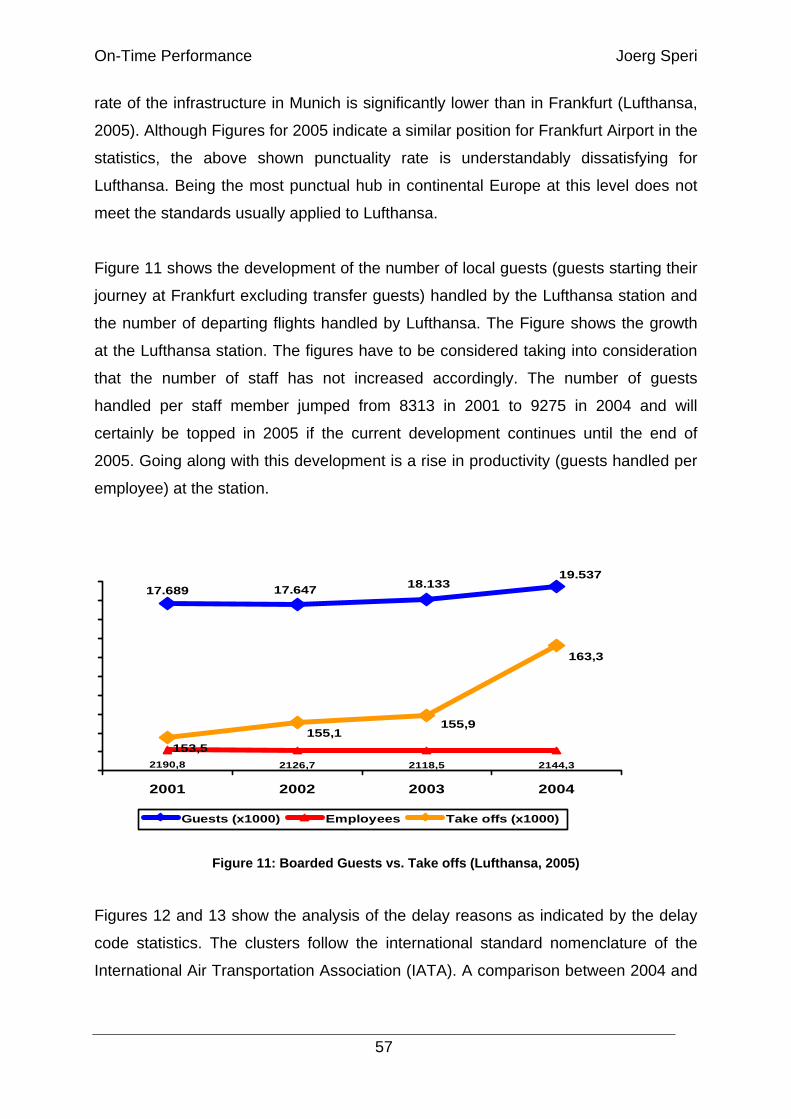
On-Time Performance Joerg Speri
57
rate of the infrastructure in Munich is significantly lower than in Frankfurt (Lufthansa,
2005). Although Figures for 2005 indicate a similar position for Frankfurt Airport in the
statistics, the above shown punctuality rate is understandably dissatisfying for
Lufthansa. Being the most punctual hub in continental Europe at this level does not
meet the standards usually applied to Lufthansa.
Figure 11 shows the development of the number of local guests (guests starting their
journey at Frankfurt excluding transfer guests) handled by the Lufthansa station and
the number of departing flights handled by Lufthansa. The Figure shows the growth
at the Lufthansa station. The figures have to be considered taking into consideration
that the number of staff has not increased accordingly. The number of guests
handled per staff member jumped from 8313 in 2001 to 9275 in 2004 and will
certainly be topped in 2005 if the current development continues until the end of
2005. Going along with this development is a rise in productivity (guests handled per
employee) at the station.
2190,8 2126,7 2118,5 2144,3
19.53718.13317.64717.689
153,5155,1
155,9
163,3
2001 2002 2003 2004
Guests (x1000) Employees Take offs (x1000)
Figure 11: Boarded Guests vs. Take offs (Lufthansa, 2005)
Figures 12 and 13 show the analysis of the delay reasons as indicated by the delay
code statistics. The clusters follow the international standard nomenclature of the
International Air Transportation Association (IATA). A comparison between 2004 and

On-Time Performance Joerg Speri
58
2005 (until week 36) indicates that the distribution has not changed significantly
except the point “Technical” where a noticeable increase of 2% points was recorded.
Interesting in this regard is the fact that although passenger volume and traffic is
increasing significantly, the portion of the handling delays was kept constant. In the
smaller pie charts to the right, the delays were assigned following the causation
principle. The only major change is the increase in delays coming from the handling
process which indicates a certain problem concerning the “number of staff per
passenger handled” ratio.
Others8,1%
Handling8,7%
Rotation26,5% FRA SO
4,0%
FRA SV3,5%
Cleaning0,3%
Cargo0,3%
Catering0,3%
FRA SE0,1%
Fueling0,2%
Connex4,5%
ATC12,7%
Airport20,8%
Weather4,7%
Technical13,9%
Figure 12: Delay Reasons 2005 (cumulative August 2005)
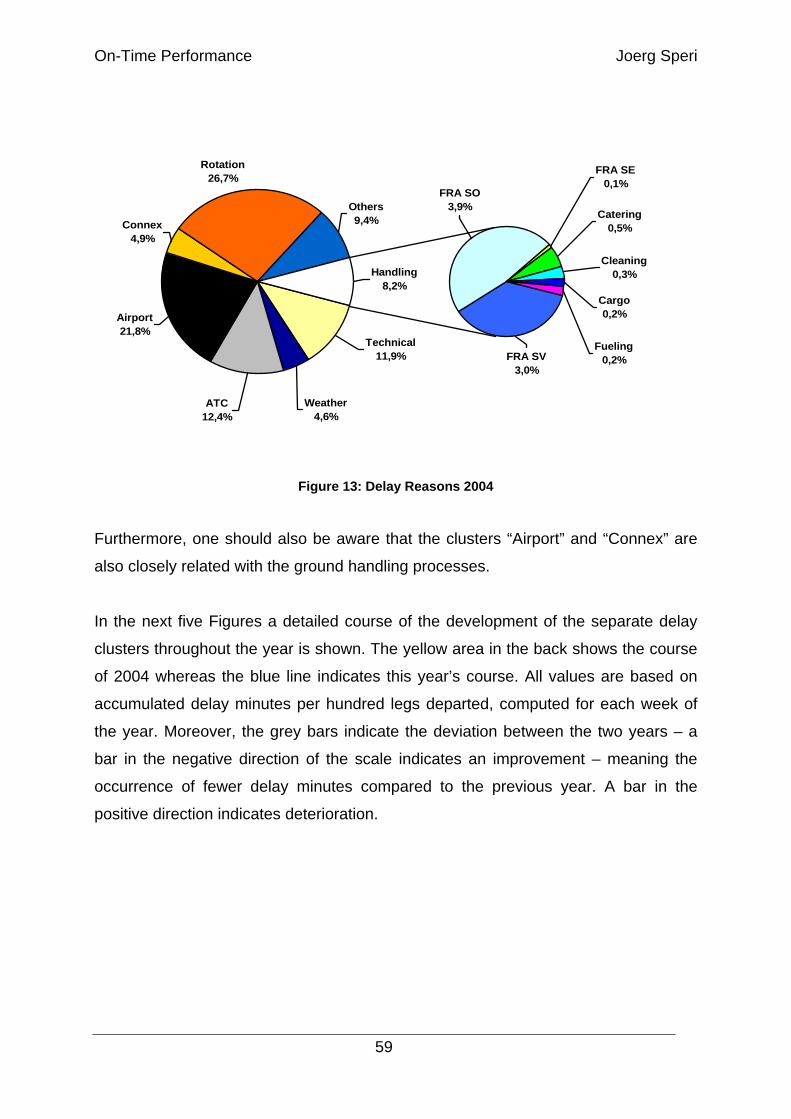
On-Time Performance Joerg Speri
59
Others9,4%
Handling8,2%
Rotation26,7%
FRA SO3,9%
FRA SV3,0%
Cleaning0,3%
Cargo0,2%
Catering0,5%
FRA SE0,1%
Fueling0,2%
Connex4,9%
ATC12,4%
Airport21,8%
Weather4,6%
Technical11,9%
Figure 13: Delay Reasons 2004
Furthermore, one should also be aware that the clusters “Airport” and “Connex” are
also closely related with the ground handling processes.
In the next five Figures a detailed course of the development of the separate delay
clusters throughout the year is shown. The yellow area in the back shows the course
of 2004 whereas the blue line indicates this year’s course. All values are based on
accumulated delay minutes per hundred legs departed, computed for each week of
the year. Moreover, the grey bars indicate the deviation between the two years – a
bar in the negative direction of the scale indicates an improvement – meaning the
occurrence of fewer delay minutes compared to the previous year. A bar in the
positive direction indicates deterioration.

On-Time Performance Joerg Speri
60
102,5
-60-35-1015406590
115140165190215240265290
1 3 5 7 9 11 13 15 17 19 21 23 25 27 29 31 33 35 37 39 41 43 45 47 49 51
Weeks
Min
/ 100
legs
2004 Deviation previous year 2005 Target: 85,7
Figure 14: Delays Handling (Codes 11-39)
As this study is mainly concerned with handling processes, the analysis starts with
the handling delays which can directly be assigned to the field of responsibilities of
the Lufthansa station. As can be seen from Figure 14 above, the level of handling
delays in 2005 is slightly above the level of 2004 and is exceeding the target value
relatively often. Certain peaks in the course may be explainable by isolated cases
such as the visit of the President of the United States to Germany, or emergency
landings – this development clearly shows that there is space for improvements.
However, in relation to the following clusters (compare also the two previous Figures)
the handling process is not solely responsible for the current delay situation.
Figure 15: Technical Delay (41-49)
119
- 60- 35- 1015406590115140165190215240265290
1 3 5 7 9 11 13 15 17 19 21 23 25 27 29 31 33 35 37 39 41 43 45 47 49 51
Weeks2004 Deviation previous year 2005
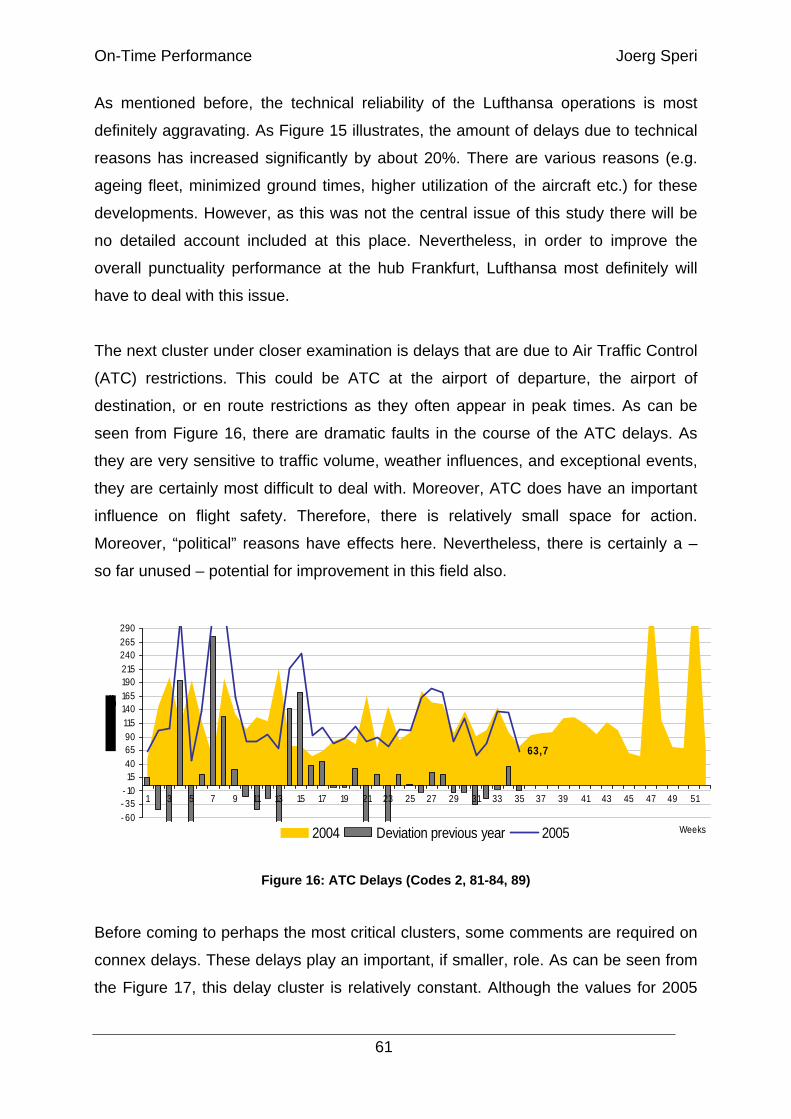
On-Time Performance Joerg Speri
61
As mentioned before, the technical reliability of the Lufthansa operations is most
definitely aggravating. As Figure 15 illustrates, the amount of delays due to technical
reasons has increased significantly by about 20%. There are various reasons (e.g.
ageing fleet, minimized ground times, higher utilization of the aircraft etc.) for these
developments. However, as this was not the central issue of this study there will be
no detailed account included at this place. Nevertheless, in order to improve the
overall punctuality performance at the hub Frankfurt, Lufthansa most definitely will
have to deal with this issue.
The next cluster under closer examination is delays that are due to Air Traffic Control
(ATC) restrictions. This could be ATC at the airport of departure, the airport of
destination, or en route restrictions as they often appear in peak times. As can be
seen from Figure 16, there are dramatic faults in the course of the ATC delays. As
they are very sensitive to traffic volume, weather influences, and exceptional events,
they are certainly most difficult to deal with. Moreover, ATC does have an important
influence on flight safety. Therefore, there is relatively small space for action.
Moreover, “political” reasons have effects here. Nevertheless, there is certainly a –
so far unused – potential for improvement in this field also.
Figure 16: ATC Delays (Codes 2, 81-84, 89)
Before coming to perhaps the most critical clusters, some comments are required on
connex delays. These delays play an important, if smaller, role. As can be seen from
the Figure 17, this delay cluster is relatively constant. Although the values for 2005
63,7
- 60- 35- 1015406590115140165190215240265290
1 3 5 7 9 11 13 15 17 19 21 23 25 27 29 31 33 35 37 39 41 43 45 47 49 51
Weeks2004 Deviation previous year 2005

On-Time Performance Joerg Speri
62
are mostly at or above the levels of 2004, the amount of minutes caused by this
factor is relatively small. Moreover, the allocation of Connex delays helps to improve
the overall connectivity at the hub and has therefore a direct influence on customer
satisfaction, respectively customer convenience.
14,5
-60-35-1015406590
115140165190215240265290
1 3 5 7 9 11 13 15 17 19 21 23 25 27 29 31 33 35 37 39 41 43 45 47 49 51
Weeks
Min
/ 100
legs
2004 Deviation previous year 2005
Figure 17: Connex Delays (Codes 91-93)
The cluster airport delay is the second largest delay problem besides the rotational
delays. While rotational delays are usually caused at the departure airport or enroute
to Frankfurt or are a consequence of departure delays on a previous leg ex Frankfurt
etc. – airport delays are a major problem caused directly at Frankfurt Airport. As can
be seen from the Lufthansa delay code list in the appendix (Appendix II) the codes
85 to 88 are mainly concerned with security, health, and infrastructural issues.
Among the codes, number 85 “Mandatory Security” and 87 “Airport Facilities” play
the most important role. Delay code 85 is the most applied code at the airport overall.
As can be seen from the list this code encloses a broad variety of issues from
congested security checkpoints (subcodes A and R) to unloading of luggage due to
missing passengers (subcode B).

On-Time Performance Joerg Speri
63
276,8
-60-35-1015406590
115140165190215240265290
1 3 5 7 9 11 13 15 17 19 21 23 25 27 29 31 33 35 37 39 41 43 45 47 49 51
Weeks
Min
/ 100
legs
2004 Deviation previous year 2005
Figure 18: Airport Delays (Codes 85 - 88)
Especially the latter reason causes a major amount of delays each day. However, as
Figure 18 illustrates, the course of the delay code has constantly been rising since
the beginning of the year; at almost all times it is also above the level of 2004. There
are various reasons for this development – one is certainly the increased amount of
passengers handled in 2005 which of course has an effect on the likelihood of the
occurrence of a situation where a passenger is missing at departure time.
In conclusion, one can say that punctuality at Frankfurt Airport as indicated by the
delay codes is not satisfactory. In comparison to 2004 no major improvements can
be seen. Taking the rising passenger volume into consideration besides other
negatively influencing factors (e.g. new security measures etc.), the statistics at least
seem to indicate a constant level of delays. An exemption is certainly marked by the
rise of the delays due to technical reasons by about 20%. This is one of the major
issues shown by the statistics. Nevertheless, the airport delays are the most critical
factor at the airport. They account for about one fifth of all delays. The reader may
wonder why rotational delays are left out here. As they mark a rather indirect issue
caused by other reasons, they are hard to address directly. Also, if all other delays
were minimized, the rotational delays would drop automatically as a logical
consequence due to the network character of the Lufthansa operation.

On-Time Performance Joerg Speri
64
4.2. Analysis of the Questionnaires
While the last chapter dealt with the analysis of the delay code statistics, this one is
concerned with the analysis of the outcomes of the survey that was conducted
among the Flight Managers, Assistant Flight Managers, and Section leaders at the
Lufthansa station at Frankfurt Airport.
In order to structure the analysis and make it easier for the reader to follow, the
chapter is set up according to the design of the questionnaire. Although the questions
are shown in the individual sections as well, it is therefore recommended to have the
questionnaire available during the reading of this section.
Furthermore, the questions are not represented textually in the figures; instead they
are indicated by their item code which can be found in the first column of the
questionnaire and on the y-axis or x-axis of the Figures in this chapter.
As to the response values, the Figures either represent percentages, time spans, or
answer clusters depending on the scale of values used for the particular question in
the questionnaire. Moreover, the percentages are always based on the total number
of responses given to a particular question.
If clusters were built up, the rule for the clustering is presented below the specific
item. As a scale reaching from one to five was used for the questions, where one
represented full agreement and five total disagreements, usually answers one and
two, and four and five where clustered together. Moreover, these clusters can be
distinguished by their colour.
In order to further scrutinize the data; a Multivariate Analysis of Covariance
(MANCOVA) was carried out. The findings of this analysis can be found in the
individual section they belong to.

On-Time Performance Joerg Speri
65
General Questions
1. Position
FM; 63,6 AFM; 22,7 SLSO; 13,6
0% 20% 40% 60% 80% 100%
A01
2. Duration of service at Lufthansa
00 11,4 38,6 50
0% 20% 40% 60% 80% 100%
A02
shorter than 3 3 to 8 9 to 14 15 to 14 25 and longer
3. Duration of service in the specific position
9,1 22,7 20,5 45,5 2,3
0% 20% 40% 60% 80% 100%
A03
shorter than 3 3 to 8 9 to 14 15 to 14 25 and longer
4. Gender
Female; 61,4 Male; 38,6
0% 20% 40% 60% 80% 100%
A04
Figure 19: General Questions
The structure of the original sample and the one of the actual respondents is
relatively equal (see Figure 19). The 115 Flight Managers and Assistant Flight
Managers represent about 86% of the total number of participants. They are also
represented by about 86% in the set of actual respondents. The same applies to the

On-Time Performance Joerg Speri
66
Section leaders. One can therefore assume that the various groups of the
participants are well presented in the set of respondents.
Moreover, one can see from Figure 19 that a majority of the employees in the
relevant positions has been working for more than 15 years for Lufthansa. Not
surprising is the fact, that the respondents have been working rather long in their
position. This is mainly due to the nature of their positions which mark higher or even
final positions in the respective career paths. On the one hand this seems to indicate
that mostly experienced staff were among the respondents and on the other hand
this shows that although they have been in their position for quite a while, they are
still motivated to think about the jobs they are performing. The ratio of about two third
female to one third male respondents is also reflecting the distribution in the original
sample quite well.
Information/ Communication
This set of questions (Table 4) dealt with issues around whether and how the
employees felt well informed and trained concerning punctuality issues. In addition
this set aimed at examining whether there is an open discussion in a horizontal as
well as a vertical way in the organization.
Table 4: Questions B
Item Code Question B01. Are you notified about the current status and the changes of the
outbound punctuality quality on a regular basis? B02. Do you discuss punctuality issues with your colleagues
regularly? B03. Do you discuss punctuality issues with your superiors regularly?
B04. Are you notified about newly introduced punctuality measures
regularly? B05. Are employees trained for outbound punctuality on a regular
basis? B06. Do you get feedback about punctuality relevant incidents?

On-Time Performance Joerg Speri
67
88,6
68,2
56,8
72,7
38,6
59,1
9,1
25
31,8
18,2
31,8
27,3
2,3
6,8
11,4
9,1
29,6
13,7
0% 20% 40% 60% 80% 100%
B01
B02
B03
B04
B05
B06
item
cod
epercentages of the answer clusters
1&2 3 4&5
Figure 20: Information/ Communication
1
2
3
4
5
B01 B02 B03 B04 B05 B06
item code
mea
n
FM AFM SL SO Total
Figure 21: Means Information/ Communication
As Figure 20 shows the respondents have answered all questions quite positively. An
exception marks questions B05 which asked whether the employees are trained
regularly for outbound punctuality. The analysis indicates potential for improvements
here. Another noticeable issue is the fact that the Section leaders seem to feel a lack

On-Time Performance Joerg Speri
68
of feedback concerning punctuality issues which is reflected by their comparatively
negative response in questions B01 and B06. However, the means in Figure 21
indicate that the Section leaders do have a different perception especially concerning
questions B03 to B05.
Table 5: Multivariate Tests B Section
Effect Value F Hypothesis df Error df Sig. Duration of Service LH (A02)
Pillai's Trace 0,177 1,148 6,000 32,000 0,358
Position (A01) Pillai's Trace 0,477 1,721 12,000 66,000 0,082Gender (A04) Pillai's Trace 0,189 1,246 6,000 32,000 0,309A01*A04 Pillai's Trace 0,329 1,082 12000 66000 0,389
As table 5 shows, no significant effects stemming from the position, gender or
duration of service could be observed. The results of the MANCOVA do not indicate
any relationship between these three characteristics and the answers to this section.
Central Hub Control
The Figures 22 and 23 show the results for the second cluster “Hub Control”. The
questions (Table 6) in this section of the questionnaire aimed at examining how the
cooperation of the relevant staff has changed after the introduction of a central hub
control – namely the Hub Control Center. In addition, the questions were aimed at
stimulating ideas for improvements in this field.
Table 6: Questions C
Item Code Question C01. Do you think that the current organization of the processes at the
hub FRA is likely to have a positive influence on the outbound punctuality performance?
C02. In your opinion did the introduction of a central hub control system have any influence on your personal work pressure?
C03. If not, why not in your opinion?
C04. Would you describe your cooperation with the central hub control as likely to have a positive influence on the overall outbound punctuality performance?
C05. Do you see an urgent call for action in this field?

On-Time Performance Joerg Speri
69
32,6
29,6
47,7
52,3
44,2
31,8
43,2
31,8
23,2
38,6
9,1
15,9
0% 20% 40% 60% 80% 100%
C01
C02
C04
C05
item
cod
epercentages of the answer clusters
1&2 3 3&4
Figure 22: Central Hub Control
1
2
3
4
5
C01 C02 C04 C05
item code
mea
n
FM AFM SL SO Total
Figure 23: Means Central Hub Control
In general one can say that the answers to this cluster are relatively negative in
comparison to other clusters (compare Figure 22). More than 50% of the
respondents see an urgent call for action in this field. Nevertheless, the answers
indicate that the respondents do not question the institution HCC in general but do
see a noticeable potential for improvements. Moreover, the results for question C02
show that the introduction of the HCC has not yet had all the effects once intended.
The means in Figure 23 indicate that all groups of respondents have a similar attitude
to the questions.

On-Time Performance Joerg Speri
70
Table 7: Answers to Question C03
Responses C02: In your opinion did the introduction of a central hub control system have any influence on your personal work pressure? C03: If not, why not in your opinion? N Percent
workload has not changed 4 19,0%
lack of communication HCC <-> Shop floor 9 42,9%
too focused on own work 1 4,8% HCC to far away and
anonymous 1 4,8%
too many people involved 3 14,3% Others 3 14,3%Total 21 100,0%
Table 7 shows the answers to question C03 – asking for the reasons why the HCC
did not have a perceivable influence on the personal workload of the respondents. As
the number of responses to this open question was low the quality of the results can
be questioned. However, as the later analysis will show the major point mentioned
here, namely the lack of communication between the HCC and the shop floor, seems
to be of central importance to the respondents of the study. This is a first indication
towards an underlying problem in the process chain at the airport.
Table 8: Multivariate Tests C Section
Effect Value F Hypothesis df Error df Sig. Duration of Service LH (A02)
Pillai's Trace 0,152 1,473 4,000 33,000 0,233
Position (A01)
Pillai's Trace 0,141 0,644 8,000 68,000 0,738
Gender (A04)
Pillai's Trace 0,044 0,383 4,000 33,000 0,819
A01*A04 Pillai’s Trace 0,071 0,313 8,000 68,000 0,959
The results of the MANCOVA (Table 8) for this section of the questionnaire do also
not indicate any significant influence of the position, gender or duration of service on
the responses to the questions.

On-Time Performance Joerg Speri
71
Ideas & Motivation
This cluster is probably the most controversial one. It was aimed at scrutinizing
whether ideas for improvements concerning the outbound punctuality are taken
seriously by management and whether and how management motivates their staff.
Moreover, the individual perceptions of staff’s own level of motivation were to be
examined. Table 9 shows the questions of this cluster.
Table 9: Questions D
Item Code Question D01. Do you contribute to the process of punctuality improvement with own
ideas regularly? D02. Were any of your ideas introduced?
D03. Were you notified about the decisions concerned with your idea?
D04. Is outbound punctuality rewarded by your superiors?
D05. Are measures taken when punctuality rules are violated?
D06. Would you describe your current state of motivation towards punctuality
as positive?? D07. In your opinion does your personal work have any influence on the
outbound punctuality performance at all? D08. Please estimate the potential improvement of punctuality within your
spheres of action. (in %)
36,4
7,5
15,4
7,3
37,2
79,1
79,5
34,1
37,5
25,6
2,4
37,2
11,6
15,9
29,5
55
58,9
90,3
25,6
9,3
4,6
0% 20% 40% 60% 80% 100%
D01
D02
D03
D04
D05
D06
D07
item
cod
es
percentages of the answer clusters
1&2 3 4&5
Figure 24: Ideas and Motivation
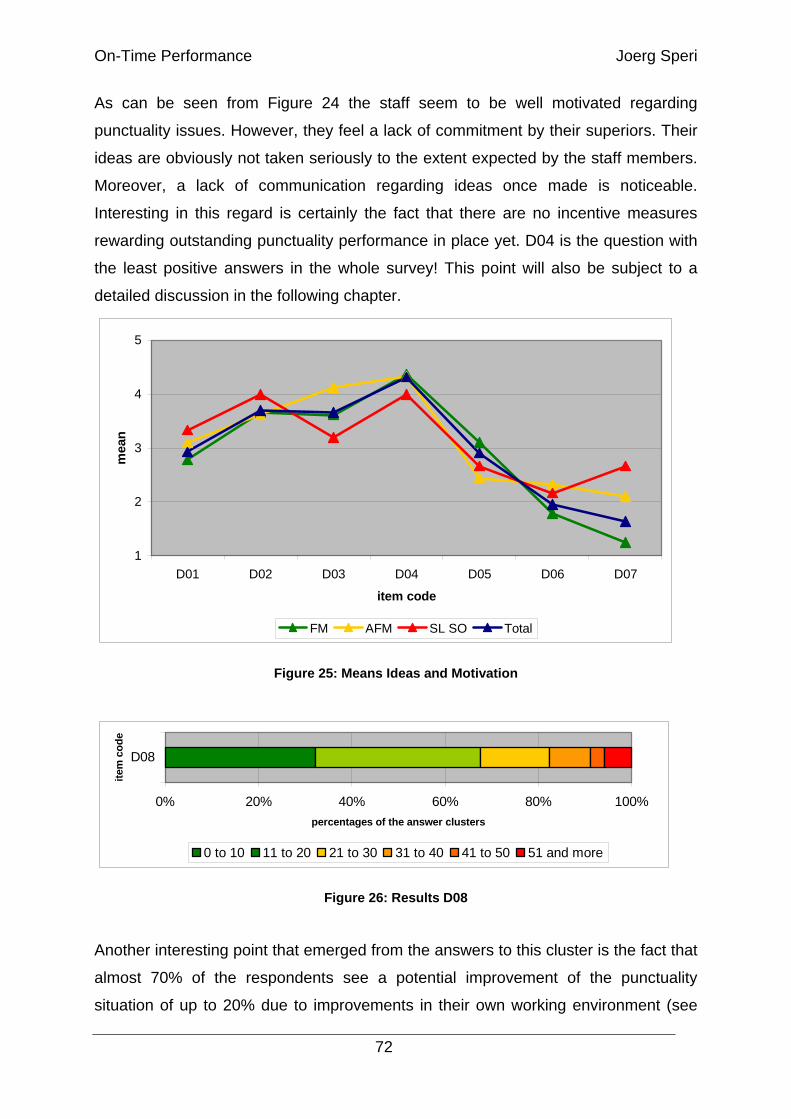
On-Time Performance Joerg Speri
72
As can be seen from Figure 24 the staff seem to be well motivated regarding
punctuality issues. However, they feel a lack of commitment by their superiors. Their
ideas are obviously not taken seriously to the extent expected by the staff members.
Moreover, a lack of communication regarding ideas once made is noticeable.
Interesting in this regard is certainly the fact that there are no incentive measures
rewarding outstanding punctuality performance in place yet. D04 is the question with
the least positive answers in the whole survey! This point will also be subject to a
detailed discussion in the following chapter.
1
2
3
4
5
D01 D02 D03 D04 D05 D06 D07
item code
mea
n
FM AFM SL SO Total
Figure 25: Means Ideas and Motivation
0% 20% 40% 60% 80% 100%
D08
item
cod
e
percentages of the answer clusters
0 to 10 11 to 20 21 to 30 31 to 40 41 to 50 51 and more
Figure 26: Results D08
Another interesting point that emerged from the answers to this cluster is the fact that
almost 70% of the respondents see a potential improvement of the punctuality
situation of up to 20% due to improvements in their own working environment (see

On-Time Performance Joerg Speri
73
Figure 26). Also for this section the means show that the respondents have very
similar attitudes towards the questions.
Table 10: Multivariate Tests D Section
Effect Value F Hypothesis df Error df Sig. Duration of Service LH (A02)
Pillai's Trace 0,255 1,221 7,000 25,000 0,328
Position (A01)
Pillai's Trace 0,588 1,546 14,000 52,000 0,128
Gender (A04)
Pillai's Trace 0,252 1,203 7,000 25,000 0,337
A01*A04 Pillai’s Trace 0,629 1,706 14,000 52,000 0,083
In order to elaborate whether the position, gender or duration of service of the
respondents have had any influence on the answers to the questions, a MANCOVA
was computed. As the reader can see from table 10 no significance for any of these
items was reported. It can therefore be assumed that they did not have any
significant influence on the responses.
Punctuality Management
The questions in this cluster (Table 11) aimed at examining how current punctuality
management is judged by the respondents. Of central interest was the interaction
between the punctuality manager and the staff members. This was aimed at
answering the question whether a dedicated manager for punctuality issues is
potentially useful and whether and how her/ his work could be improved.
Table 11: Questions E
Item Code Question E01. Who in your opinion is the major responsible for punctuality at the hub
FRA? E02. What is the name of the punctuality manager at the Lufthansa station
at Frankfurt Airport? E03. Do you know about the tasks of this person closer?
E04. Do you contact this person concerning punctuality relevant issues on
a regular basis? E05. Did you get the assistance/ feedback you expected
E06. Do you think the work of this person is important?
E07. In your opinion has the work of this person had any positive influence
on the punctuality performance yet?

On-Time Performance Joerg Speri
74
32,1 25 14,3 28,6
0% 20% 40% 60% 80% 100%
E01
Hub Manager Station Manager Punctuality Manager Somebody Else
93,2 6,8
0% 20% 40% 60% 80% 100%
E02
Right Wrong
Figure 27: Answers E01 and E02
As can be seen from figure 27 a vast majority of the respondents knows the current
punctuality manager at least by name. Nevertheless, 32% of the respondents ascribe
the overall responsibility regarding punctuality issues to the Lufthansa Hub Manager.
25% percent of the respondents see the Station Manager as the one in charge for
punctuality issues. This means, about 57% - a clear majority of the respondents
assigns the major responsibility for the punctuality performance to members of the
higher management.
56,8
77,3
73,8
90,9
64,3
31,8
9,1
14,3
6,8
23,8
11,4
13,7
11,9
2,3
11,9
0% 20% 40% 60% 80% 100%
E03
E04
E05
E06
E07
item
cod
e
percentages of the answer clusters
1&2 3 4&5
Figure 28: Punctuality Management

On-Time Performance Joerg Speri
75
1
2
3
4
5
E03 E04 E05 E06 E07
item code
mea
n
FM AFM SL SO Total
Figure 29: Means Punctuality Management
Noticeable, is the very positive overall judgment of the current punctuality
management (see Figure 28). Obviously, the work of the punctuality manager is
highly appreciated by the staff members. With a value of almost 91% agreement that
the work of the punctuality manager is important, item E06 marks the overall
maximum value in the whole survey among the questions measured on the scale
from one to five. And again the means show similar attitudes across the groups of
respondents.
Table 12: Multivariate Tests E Section
Effect Value F Hypothesis df Error df Sig. Duration of Service LH (A02)
Pillai's Trace 0,648 3,684 6,000 12,000 0,026
Postion (A01) Pillai's Trace 0,663 1,075 12,000 26,000 0,418Gender (A04) Pillai's Trace 0,654 3,777 6,000 12,000 0,024A01*A04 Pillai’s Trace 0,526 0,774 12,000 26,000 0,671
As for the previous sections of the questionnaire a MANCOVA was computed for this
one also. As the reader can see from table 12 the results showed significance for
duration of service and gender, indicating that these issues have had a considerable
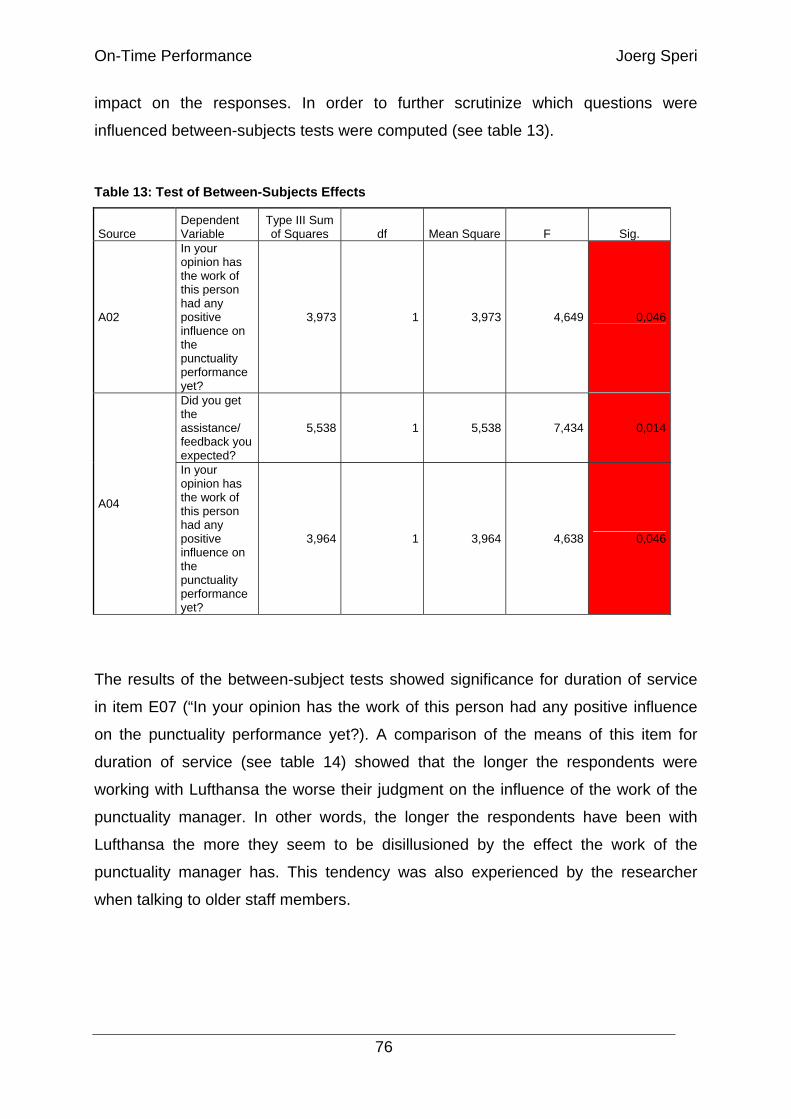
On-Time Performance Joerg Speri
76
impact on the responses. In order to further scrutinize which questions were
influenced between-subjects tests were computed (see table 13).
Table 13: Test of Between-Subjects Effects
Source Dependent Variable
Type III Sum of Squares df Mean Square F Sig.
A02
In your opinion has the work of this person had any positive influence on the punctuality performance yet?
3,973 1 3,973 4,649 0,046
Did you get the assistance/ feedback you expected?
5,538 1 5,538 7,434 0,014
A04
In your opinion has the work of this person had any positive influence on the punctuality performance yet?
3,964 1 3,964 4,638 0,046
The results of the between-subject tests showed significance for duration of service
in item E07 (“In your opinion has the work of this person had any positive influence
on the punctuality performance yet?). A comparison of the means of this item for
duration of service (see table 14) showed that the longer the respondents were
working with Lufthansa the worse their judgment on the influence of the work of the
punctuality manager. In other words, the longer the respondents have been with
Lufthansa the more they seem to be disillusioned by the effect the work of the
punctuality manager has. This tendency was also experienced by the researcher
when talking to older staff members.

On-Time Performance Joerg Speri
77
Table 14: Comparison of Means for E07 In your opinion has the work of this person had any positive influence on the punctuality performance yet? Duration of employment at LH Mean N Std. Deviation 9 to 14 years 1,75 4 0,957 15 to 24 years 2,06 16 0,929 longer than 25 years 2,36 22 1,049
The second significant effect was identified for gender. The results of the between
subjects tests elaborated even two items that were influenced by this issue. The two
items were directly linked to the perception of the work of the punctuality manager
The first item was asking for the respondents perception whether the work of the
punctuality manager has had any influence on the on-time performance in general
(E07). The second item was concerned with the feedback / assistance the
respondents receive from the punctuality manager (E05). Although both items got
relatively positive responses it became evident that male respondents in both cases
judged the punctuality manager better than female ones (see Figure 15). Potential
reason for this might be the gender of the punctuality manager. A female punctuality
manager might cause different judgments across the different genders. The author is
aware of the fact that this is a rather superficial explanation. However, a clear source
for this influence could not be identified.
Table 15: Comparison of Means for E07 & E05
Gender
In your opinion has the work of this person had any positive influence on the punctuality
performance yet? Did you get the assistance/
feedback you expected? Mean 1,94 1,88 N 17 17
male
Std. Deviation 0,966 0,857 Mean 2,36 2,44 N 25 25
female
Std. Deviation 0,995 0,961

On-Time Performance Joerg Speri
78
Delay Reasons
This last set of questions in the questionnaire aimed at analyzing whether the
respondents’ perceptions of the most critical delay reasons corresponds to the delay
statistics (Table 16). In addition the transparency of the delay code allocation process
was a point of interest.
Table 16: Questions F
Item Code Question F01. Which three delay codes in your opinion are the most frequent at
Frankfurt Airport? (ranking 1 to 3) F02. What is the most frequent reason for delays at Frankfurt Airport in
your opinion? F03. Do the delay statistics reflect the actual reasons for delays in an
appropriate way? F04. Do you think that the allocation of delay codes is transparent and
easily understandable? F05. If not, where do you see problems
85 87 93 Others
0% 20% 40% 60% 80% 100%
F01
item
cod
e
percentages for the delay code
30,2
52,3
44,2
34,1
25,6
13,6
0% 20% 40% 60% 80% 100%
F03
F04item
cod
e
percentages of the answer clusters
1&2 3 4&5
Figure 30: Delay Reasons
In their perception of the frequency of the delay codes the respondents were very
close to the delay statistics. As Figure 30 shows, more than 30% saw the major

On-Time Performance Joerg Speri
79
problem causally connected with Security and Airport delays (delay code 85 and 87).
Moreover, rotational delays (delay code 93) were seen as dominant. This finding
corresponds with the results from the delay code analysis.
However, as to the delay code allocation the values are relatively negative. Only 30%
of the respondents see a clear agreement between the delay reasons as indicated by
the delay statistics and the true underlying reasons in reality. This disagreement is
also independent of the position of the respondents. Obviously there is a need for a
closer examination of this process.
Question F02 aimed at examining which underlying “reasons” (not delay codes!)
according to the respondents’ opinion are most frequent at Frankfurt Airport (see
table 17). It showed that contrary to the answers to question F01, which delay codes
were most frequent, a more diverse set of “reasons” was named. This seems to give
evidence for that delay codes do not precisely represent the underlying reasons but
do, due to their nature, group them and make them more abstract. This seems to go
along with a major loss of information. It therefore seems advisable to discuss to
which extent management decisions should be based on either form of information.
Table 17: Answers to Question F02
Responses F02: What is the most frequent reason for delays at Frankfurt Airport in your opinion? N Percent Weather 1 1,8% A/C Rotation 4 7,3% Crew Rotation 4 7,3% Mandatory security baggage
offload 15 27,3%
ATC/ Slot 5 9,1% Airport Facilities/
Infrastructure 4 7,3%
Late PAX at Gate 3 5,5% A/C Handling (Ramp) 1 1,8% Security 6 10,9% GSS 1 1,8% Short ground time A/C 3 5,5% Short connex time PAX 2 3,6% lack of staff 3 5,5% Late inbounds 3 5,5%Total 55 100,0%

On-Time Performance Joerg Speri
80
The number of responses to question F05 was very low as well (See Table 18).
Therefore, like question C03 the quality of the data is arguable. Nevertheless, the
responses once again indicate certain distrust in the delay code allocation process as
well as in the communications between the HCC and the shop floor.
Table 18: Answers to Question F05
Responses F04: Do you think that the allocation of delay codes is transparent and easily understandable? F05: If not, where do you see problems? N Percent Communication HCC <->
Shop floor 2 15,4%
Everybody tries to put the blame onto somebody else 2 15,4%
Glossing over the facts of the delays 5 38,5%
Fraport loadmasters responsible for delay notification to HCC
3 23,1%
SE/O allocates delay codes often without proper analysis 1 7,7%
Total 13 100,0%
Table 19: Multivariate Tests F Section
Effect Value F Hypothesis df Error df Sig. Duration of Service LH (A02)
Pillai's Trace 0,001 0,021 2,000 35,000 0,979
Position (A01)
Pillai's Trace 0,145 1,405 4,000 72,000 0,241
Gender (A04) Pillai's Trace 0,021 0,371 2,000 35,000 0,693A01*A04 Pillai's Trace 0,064 0,591 4,000 72,000 0,670
The MANCOVA to this last section of the questionnaire (Table 19) showed also no
significant effect for either of the items gender, position, or duration of service at
Lufthansa. It can therefore be assumed that these items did not have a significant
impact on the answers of the respondents..

On-Time Performance Joerg Speri
81
Open Question
In this very last section of the questionnaire the participants had the opportunity to
express their opinions about the issue “punctuality” from a more global perspective
without any restraints. They were encouraged to present their thoughts and ideas for
potential improvements. Unfortunately, not all respondents took this opportunity.
Therefore, a quantitative analysis of the responses seemed inappropriate. Instead,
the researcher discussed the few responses from the questionnaires in the daily
debriefings attended by the participants. Figure 31 represents the outcome of this
informal discussion process. These were the points the Flight Mangers, Assistant
Flight Managers, and Section Leaders agreed upon as to be crucial. However, the
sequence of the points presented below does not indicate an order or level of
importance.

On-Time Performance Joerg Speri
82
G01: Place for your comments - Please feel free to write whatever you wanted to say
about the outbound punctuality at Frankfurt Airport
1. Raising of the Minimum Connecting Time would help tremendously to improve
the outbound punctuality especially before the backdrop of the new security
measures to be introduced in the near future
2. There is a need for improvement of the reliability of the Gate Soft- and
hardware (i.e. boarding control/ check-in system “Pictures”)
3. Hand luggage outer stations allow too much hand luggage slows down
the boarding process especially on smaller A/C
4. No further tasks for the Gate staff – workload already too high
5. Lack of staff situation is intolerable (often just 1 person per Gate)
6. Lack of communication between cockpit, cabin, Fraport, and LH station
7. Reference model too optimistic – based on unrealistic assumptions
8. Cost/ Profit vs. Punctuality – considerations often not understandable
9. Cockpit/ Cabin staff is not aware of the punctuality pressure on the ground
10. PAX guidance at the airport is poor/ distances are long/ hardware such as
escalators often broken down
11. Delay code allocation of FM/ AFM should not be altered without contacting
them beforehand
12. Since the FM is often not at the Gate “1. Fachkraft” should be involved/
informed about punctuality measures as well.
13. Lack of process fidelity at all stages (i.e. Matching, boarding begin)
14. No FM/ AFM does delay a departure of a flight on purpose
15. Numerous exceptions and unforeseeable events disturb the process
sequence
16. Flight planning too optimistic – perfect conditions underlying not realistic
17. High amount of transfer/ connecting PAX
Figure 31: Results G01
It became evident that the problems were not to be accounted for by a singular
reason but by a set of various reasons. Three major ones could be derived:
shortcomings in the communication processes, infrastructural deficits, and overall
process design. These issues will get further attention in the discussion chapter

On-Time Performance Joerg Speri
83
5. Discussion The above analysis suggests that the Flight Managers, Assistant Flight Managers,
and Section leaders largely agree in their assessment of the punctuality issues at the
Lufthansa station at Frankfurt Airport. This chapter aims at discussing the relevant
issues and will try to elaborate recommendations for potential improvements.
Communication
The statistical analysis but especially the responses to the open questions in the
survey indicate that there is a lack of communication among the players in the
ground handling process at Frankfurt Airport. This assessment is supported by the
experiences the researcher had while observing the daily routines at the airport.
Neither the staff responsible for passenger handling (i.e. FM, AFM) nor the staff
responsible for aircraft handling (i.e. SLSO, head loaders) are fully aware which
information should be shared and with whom. Although there are defined
communication chains in place, shortcuts are widely used, resulting in the cut off of
other links in the chain. The players are not completely aware of the consequences
this interruption of the information flow has.
The information processes are therefore lacking quality as well as quantity. However,
the staff members are victims of these shortcomings as well. The findings suggest
that they neither get the information they need nor do they give all of the information
others need. The problem also extends to flight- as well as cabin crews. This
communication problem probably represents the major outcome of this study and is
moreover one of the central shortcomings at the hub Frankfurt. Improvement of the
communication at the hub is likely to have a positive influence on the punctuality
situation at the airport.
On-Time Performance Joerg Speri
84
Further examination showed that there are underlying problems in the process
design. From a Human Factors point of view certain communicative patterns were
ignored. An example of this situation: in interviews with numerous Flight Managers,
they raised concern about the following issue. According to the before-mentioned
reference model, the gate staff is supposed to send the passengers through the jet
way bridges at a specific time without prior notice to the crew. The only exception is if
the crew has declared the aircraft “not ready for boarding” beforehand. However, the
gate staff experience was that crews often forgot this announcement and passengers
arrived at an aircraft with closed doors or not yet finished preparations onboard. In
consequence, this procedure is mostly ignored today and the gate staff is calling for
permission to begin the boarding process. This quite often delays the boarding
process for a couple of minutes with negative effects for the whole process chain.
The original design of the seamless process is clearly violated. The staff claim that
they feel uncomfortable sending somebody into a situation that might be unpleasant
for them. This is an example how uncertainty in data (Carayon, 2006) contributes to
work system complexity. At this point obviously the human factor was ignored. This is
just one of many examples where the communication processes hold shortcomings
resulting in negative effects for the whole process chain.
This assumption is also supported by the theoretical framework presented earlier. In
Vicente’s model (Vicente, 2003) of the human tech ladder, interaction and
communication within and between teams plays a central role on the team and
organizational level. Moreover psychological factors as the above mentioned feeling
of unease do have an impact on the overall performance. Of course there are also
interrelationships between the various levels. Altogether, they result in the behaviour
observed – namely the violation of certain aspects of the process design. A redesign
involving these considerations would therefore most certainly create a more
seamless process chain finally leading to a better overall process performance.
Besides these shortcomings in the inter-human communication, the results of the
observation show a second layer. Information flows within the computer networks at
the station are often disrupted or lack stability. This problem is not only limited to the
computer systems but to all forms of communication used at the airport. Just recently
On-Time Performance Joerg Speri
85
the former radio communication system was converted into a mobile network based
system. Still many of the employees complain about a lack of reliability of the system.
Moreover, the handling of the new system is still causing problems. Once again a
system was introduced not taking all human factors into account. The employees, for
example, are critical that they miss audiovisual feedback about the actual status of
their connection. For example, one cannot see which gate or flight one is currently
calling, or for what reason there is no connection.
Due to the time pressure this issue becomes critical. When urgent decisions cannot
be communicated to other players involved in the process on time, the whole
sequence breaks down. From a theoretical Human Factors perspective this issue
represents a lack of physical reliability on the lowest rung of the human tech ladder
(compare Vicente, 2003). As all rungs of the ladder are based on the fulfilment of the
latter, a shortcoming on the lowest level influences the stability of the whole process.
This problem is also supporting Carayons (2006) thesis that the current trend
towards cross-boundary working environment is creating unexpected negative
effects. Therefore, there is an urgent need for improvement of the technical reliability
of this essential system.
Central Hub Control
The findings of the analysis suggest that there is certain distrust among front line
staff concerning the central hub control. Obviously, the introduction of the Hub
Control Center did not have all the effects once intended, at least not to its full
potential. The center is rather seen as some kind of “big brother” than a helpful
partner. This problem is closely related to the before-mentioned communication
issue. The HCC was also intended to be an information hub to ease the work for the
front line staff. Instead of communicating with all relevant players in the process, the
idea was to bundle the communication via the HCC. However, it seems that this is
not working well. A quite large number of respondents see an urgent call for action in
this field. Previous internal research carried out by Bastian Kraemer, senior personal
assistant and speaker of the station manager, showed that this situation is also seen
among the staff at the HCC. Both organizational entities do rather exist in parallel

On-Time Performance Joerg Speri
86
rather than in a cooperative way. Although there are members of the front line staff
working in the HCC as contact person there seems to be insufficient exchange
between the different departments involved.
The improvement of this situation can clearly be assigned to the responsibility of the
management at the station. One can certainly question whether changes in the
overall organisation of the station would help here. However, the interaction between
the several organizational units should be in the focus. There are a large number of
potential measures that would improve the situation. A detailed account of potential
measures will be presented in the last chapter.
Motivation and Feedback
The analysis of the answers of the respondents showed that they are quite well
motivated, however, that they feel a lack of commitment regarding punctuality by
their superiors. Many ideas that they express are not taken seriously to the extend
they expect. They also claim a severe lack of feedback concerning the whereabouts
of these ideas. In addition, the respondents expressed a tremendous amount of
disappointment about the absence of any rewards for special punctuality
performance. The non-existence of any incentive scheme is probably the underlying
reason for this negative assessment. The responses support the impression that the
information held by the ones involved in the daily operations is not valued and used
to the extent they could expect. There is certainly potential for improvement in this
field.
The importance of this issue cannot be stressed enough. Authors from various fields
support the opinion that motivated staff is one key success factor for a sound
performance (e.g. Niehues, et. Al., 2001). Reward structures and incentive schemes
rank on the second highest level of Vicente’s human tech ladder. In cooperation with
a corporate culture that fosters motivation of the staff, Vicente assigns the issue
central importance. This opinion is also shared by Meffert and Bruhn (2000). They
claim that from a quality management perspective staff motivation is one of the most
important foundations to base a lasting quality scheme on. However, the strongest

On-Time Performance Joerg Speri
87
support comes from a Booz, Allen and Hamilton paper (Niehues, et. al., 2001). One
of the three points to be implemented in order to promote punctuality was
empowerment, motivation, and discipline. They explicitly argued that “highly
motivated people, empowerment of front line staff supported by adequate incentive
schemes can do more for punctual operation than millions of investment
dollars”(Niehues, et. al., 2001).
However, all the before mentioned authors claim that these issues are first of all a
leadership challenge. It is therefore important to address the upper and intermediate
management above the level of the participants with this task.
Punctuality Management
This issue is closely related to the before mentioned one. Of course the major task of
the punctuality manager is to analyse the current process design and to develop
measures in order to improve the on-time performance of the airport. Moreover, the
punctuality manager has the task to moderate between the different departments of
the Lufthansa station. However, one of the central tasks is also to have a positive
influence on the staff’s motivation.
According to the responses of the survey, punctuality management is highly valued
by the employees. In particular, the communication with the punctuality manager
seems to be important to the staff members. The punctuality manager therefore has
a liaison function between the management and the front line staff. The daily
debriefings with the Flight Managers, Assistant Flight Managers, Section
Leader, and the Punctuality Manager of the station give the staff a forum to express
their thoughts and experiences concerning operational issues during the day.
Moreover, there they can exchange opinions. In addition, the front line staff
expressed their appreciation of the daily presence of the punctuality manager at the
shop floor. Although these effects can only be quantified with difficulty they help to
motivate the staff resulting in positive effects concerning the overall performance.
On-Time Performance Joerg Speri
88
Delay Reasons
This is a controversial issue at the Lufthansa station. All the departments within the
station have a different perspective on the issue. Moreover, the perception of the
staff on the shop floor does significantly differ from the one in the HCC or in the
management. There are various reasons, some of which can be explained by the
issues already discussed around the communication patterns.
There are basically two sub-topics involved. One is the delay code allocation; the
other is the underlying delay reasons. As to the former, in the current situation the
delay code allocation rather follows the delay symptoms than the delay reasons.
There are two major reasons for this situation: the first is that any system trying to
use standardized codes for the reflection of real events, of course is lacking
sharpness. That means that you cannot have as many codes as there are possible
delay reasons. In consequence, the codes actually represent clusters themselves.
The second reason is closely related to the communication issues mentioned before.
Today, the event-controllers in the HCC allocate the codes following the information
they get. As this information is often lacking quantity as well as quality, they build up
an image that misrepresents the reality. Consequently, all analyses starting from the
delay code statistics run the risk of being biased.
The second topic is the actual underlying delay reasons at the airport. There are
certainly as many as there are flight events at the airport. However, the author would
like to discuss a few. The central issue at the airport currently is the tremendous
number of delays due to security reasons – mostly baggage offloads due to missing
passengers. However, as described above, this is not the actual reason for the delay
but the symptom. The underlying reason is the missing passenger who is not at the
gate at the time set by the reference model. This raises the question of why is the
guest not there. Once again, there are numerous different reasons conceivable. The
connecting time might just have been too short, or the passenger got lost in the
confusing terminal, or the passenger had problems at the security check points either
due to missing documents or long queuing time. As one can see, similar to a root, the
reasons can be split up more and more. This is just one example out of many.

On-Time Performance Joerg Speri
89
One could draw such causal chains for every delay event. However, there is no
parallel information flow supporting the delay code allocation process.
Concluding this discussion, the author would like to raise a last observation that
could be made at the Lufthansa station. The handling processes at the ramp have
obviously come to the point where there are almost no further improvements possible
under the given general conditions. In particular, the crucial luggage process is
running quite smoothly. Contrary to this situation the passenger handling process
shows deficits. Crucial to the whole system is the non-parallelism of the luggage and
the passenger handling process. This means that the luggage flow is handled and
transferred much faster than the passenger flow. In consequence this leads to a
discrepancy between the passenger arrival at the gate and the loading of the luggage
into the aircraft causing tremendous delays.
On-Time Performance Joerg Speri
90
6. Conclusions and Recommendations As the discussion has shown, there are manifold issues influencing the punctuality
situation. Nevertheless, one always has to bear in mind that the Lufthansa operations
at Frankfurt Airport rank among the best in the world and are among the top five in
punctuality at a major hub in Europe. As previous research showed, it is not easy to
improve the punctuality Figures above 85% (de Neufville and Odoni, 2003) on
acceptable costs. The grade of training and motivation among the staff is
comparatively high despite the critical circumstances under which they work.
However, there are potentials for improvements which would certainly help to
improve the overall situation. The following twenty recommendations can be seen as
the quintessence of the study:
Communicative issues:
Detailed analysis of the communication HCC shop floor from a Human
Factors perspective
What information does the staff need and how should it be communicated?
Improvement of the technical reliability and design of the communication
tools
Redesign of the communication processes where necessary
Workshops with front line staff from all departments involved under
supervision of external Human Factors experts in order to promote the mutual
understanding
Similar programs do exist already with pilots and cabin crew staff
(e.g. CRM)
Daily debriefings with staff from the shop floor together with HCC staff in order
to jointly come to terms with the delay events of the day.
Involvement of staff members below the operational executives in the
punctuality discussion as well
As many flights are handled without physical supervision of the operational
executives, the staff on lower levels needs to be informed and trained
concerning punctuality as well.

On-Time Performance Joerg Speri
91
Strengthening of the vertical communication at the Lufthansa station
Communication between superiors and front line staff should be intensified
in order to foster a fruitful dialog about punctuality issues.
Strengthening of the horizontal communication between the departments at
the station
Extension of the existing communication to lower levels of the hierarchy in
order to create a strong information network on all levels.
Strategic issues:
Elucidation of the management commitment towards punctuality
Lasting establishment of the punctuality management as an integrated part of
the central management: extension of the necessary authority and means for
intervention
Promotion of departure punctuality as added value for the guest
Regularity vs. Punctuality transparent trade off decisions in order to regain
network control after extensive delay events
Individual adjustment of the product definition of realistic minimum
connecting times
Transfer of competences where they belong – back to shop floor or into HCC
Introduction of an incentive scheme around punctuality issues
Operational issues:
Improvement of the PAX flow management terminal guidance (e.g. signs)
Remodeling of the reference charts under realistic assumptions (e.g. time for
flight closure)
Intensified training concerning punctuality issues for all relevant staff
Earlier scheduling of critical links in the process chain gate should not be
the place for problem solving activities

On-Time Performance Joerg Speri
92
The above – mentioned issues are certainly neither all-embracing nor do they
represent a universal plan for punctuality improvements. They should rather be seen
as potential topics to start from, which in connection with others could help to use the
potential existing in the organization. The whole is too complex to just adjust a few
levers in order to improve the punctuality performance. Nevertheless, following the
before – mentioned recommendations will certainly contribute to the improvement
process. Moreover, findings of this study raised several issues that require further
research, e.g. process design under Human Factors considerations.
Concluding the author would like to remind the reader where this study started. The
intention of this study was to examine the perceptions, attitudes, and knowledge of
the operational executives at the Lufthansa station in Frankfurt. It became evident
that they hold important information and useful ideas. Moreover, they seemed to be
quite well motivated. Nevertheless, shortcomings in the communication system were
identified resulting in various further issues. Furthermore, management commitment
towards punctuality is obviously not very clear to the staff members. Following the
recommendations above should help to improve the overall on-time performance
noticeably. This does not mean that the author recommends pampering the staff
members but to recognize the potential they hold.
The central lesson to be learnt is therefore the realization that staff holds very useful
and valuable information for the management of the whole organization. This source
of knowledge should not be ignored any longer but be exploited. Ignoring this
knowledge might have dramatic consequences. This may cost time and even money;
however, not using this information would certainly cost more. Or freely adapted from
Bok: if you think gathering knowledge is expensive try ignorance.
In this sense the author would like to wish the reader
- Always happy landings –

On-Time Performance Joerg Speri
The author
Joerg Speri was born the 1st of May 1979 in East Germany, formerly German
Democratic Republic. He graduated from High School in 1997. After serving in the
German Armed Forces for two years, he began his studies at Dresden University of
Technology, at the Institute for Transportation Sciences “Friedrich List”. His studies
focused on transportation management and technology. In 2002 Joerg Speri moved
to Mid Sweden University. There he graduated now holding a Bachelor as well as a
Masters degree in Business Administration. During his studies in Sweden he
specialized in international management, cross-cultural marketing and organization.
Since 2004 Joerg Speri has been studying for a Masters degree in Aviation at
Massey University, Auckland, New Zealand. He is employed with Lufthansa German
airlines since 2005, currently in the position of Manager Strategy and Product
Management at the Lufthansa Technical Division - Aircraft Overhaul and VIP Jet
Services in Hamburg, Germany.

On-Time Performance Joerg Speri
- i -
References
Ashford, N., Stanton, H. P. M., Moore, C. A. (1997). Airport Operations (Second
edition). Boston: McGraw-Hill.
Association of European Airports: www.aea.org. 2005.
Boff, K. R. (2006). Revolutions and shifting paradigms in Human Factors & ergonomics, Applied Ergonomics, 27(2006), pp. 391-399.
Booth, R. T. (1996). The promotion and measurement of a positive safety culture. In N. Shanton (Ed.), Human Factors in Nuclear Safety. Southampton: Taylor & Francis.
Beauvois J.L., Joule R.V., Capacité de mobilisation des ménages en matière d'économies d'énergie, Rapport Final, 2000.
Carayon, P., Smith, M. J. (2000). Work organization and ergonomics, Applied
Ergonomics, 31 (2000), pp.649-662. Carayon, P. (2006). Human Factors of complex sociotechnical systems, Applied
Ergonomics, 37 (2006), pp. 525-535.
De Neufville, R., Odoni, A. (2003). Airport Systems: Planning, Design, and
Management. London: McGraw-Hill.
Doganis, R. (a) (2002). Flying Off Course – The economics of International Airlines.
London: Harper Collins Academic.
Doganis, R. (b) (2002). The Airport Business. New York: Routledge.
Eichner, E. R. (1997). Erogenic aids: what athletes are using – and why, Physicians
Sports Medicine, 25(4).
Flach, J., Hancock, P., Caird, J., Vicente, K. (1995). Global Perspectives on the
Ecology of Human Machine Systems. Hillsdale: Erlbaum

On-Time Performance Joerg Speri
- ii -
Fraport: www.fraport.de. 2005.
Friedman, T. L. (2005). The World is Flat: A brief History of the Twenty-first Century. New York: Farrar, Strauss & Giroux.
Friedman J.L., Fraser S.C. (1966), Compliance without pressure: The foot-in-the-
door technique, Journal of Personality and Social Psychology, 4, 195-202.
Herbst, A. (1977). Pünktlichkeit als Kriterium der Qualität von Personenbeförderungs-
leistungen im Luftverkehr. Dresden: Diplomarbeit.
Human Factors Society: www.hfes.org/WEB/AboutHFES/history.html. 2006
Horkheimer, M. (1982). Critical Theory. New York: Seabury Press.
Horkheimer, M. (1993). Between Philosophy and Social Science.
Cambridge: MIT Press.
International Air Transport Association: www.iata.org. 2005.
Jastrzebowski, W. (1857). An Outline of Ergonomics or the Science of Work based
upon the Truths drawn from the Science of Nature. Warsaw: Central Institute
of Labor Protection Poland
Jensen, R.S. (1997). The boundaries of aviation psychology, Human Factors,
aeronautical decision making, situation awareness, and crew resource
management, The International Journal of Aviation Psychology,
7(4), pp. 259-267.
Kishon, E. (2001). Ein Profi am Steuer, Beste Autofahrergeschichten. Berlin: Bastei
Lübbe.
Klein, G. A. et. al. (1993). Decision Making in Action: Models and Methods. Norwood:
Ablex Publishing.
On-Time Performance Joerg Speri
- iii -
Koonce, J. M. (1984). A brief history of aviation psychology, Human Factors,
26, pp. 499-508.
Lufthansa: Intranet. 2005.
Maurino, D. E., et al. (1995). Beyond aviation Human Factors: safety in high
technology Systems. London: Avebury Aviation.
Meffert, H.; Bruhn, M. (2000). Dienstleistungsmarketing – Grundlagen, Konzepte,
Methoden. Wiesbaden: Gabler.
Meister, D. (1999) The History of Human Factors and Ergonomics. New Jersey:
Erlbaum.
Moray, N. (2000). Culture, politics, and ergonomics, Ergonomics, 43 (7), pp. 858-868.
Niehues, A., et. al. (2001). Punctuality: How Airlines can improve On-Time
Performance. Booz, Allen & Hamilton. London.
Rasmussen, J., Pejtersen, A. M., Goodstein, L. P. (1994). Cognitive Systems
Engineering. New York: Wiley.
Rasmussen, J. (2000). Human Factors in a dynamic information society: where are
we heading?, Ergonomics, 43 (7), pp. 869-879.
Reason, J. (1990). Human error. New York: Cambridge University Press
Roscoe, S. N. (1997). The Adolescence of Engineering Psychology
In S. Casey (Ed.), Human Factors History Monograph Series. The Human Factors Society. Santa Monica.
Salvendy, G. (Ed.) (1997). Handbook of Human Factors. New York: Wiley.

On-Time Performance Joerg Speri
- iv -
Seashore, S.E. (1997). Surveys in Organizations. In G. Salvendy (Ed.), Handbook of
Human Factors. New York: Wiley.
Shaw, S. (2004). Airline Management and Marketing (Fourth edition). Aldershot:
Ashgate Publishing Ltd.
Smith, K. (1987). Origins of Human Factors Science, Human Factors Society
Bulletin, 30(4), pp. 1-3.
Van Steen, Jaques (1996). Safety Performance Measurement. Warwickshire:
Institution of Chemical Engineers.
Vicente, K. (1999). Cognitive Work Analysis. Mahwah: Erlbaum.
Vicente, K. (2003). The Human Factor – revolutionizing the way people live with
technology. New York: Routledge.
Wilson, J. R. (2000). Fundamentals of ergonomics in theory and practice, Applied
Ergonomics, 31 (6), pp. 557-567.
Yin, R.K. (1994). Case Study Research - Design and Methods (second edition).
Thousand Oaks: Sage Publications.
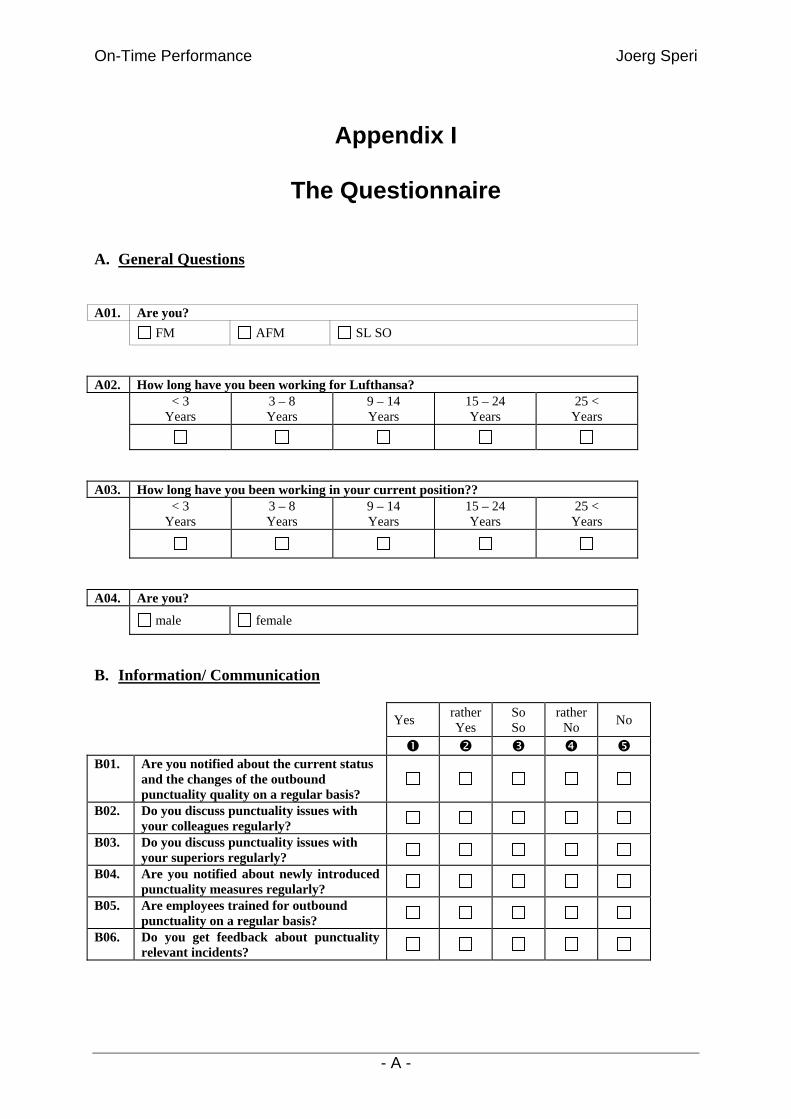
On-Time Performance Joerg Speri
- A -
Appendix I
The Questionnaire
A. General Questions A01. Are you? FM AFM SL SO A02. How long have you been working for Lufthansa?
< 3 Years
3 – 8 Years
9 – 14 Years
15 – 24 Years
25 < Years
A03. How long have you been working in your current position??
< 3 Years
3 – 8 Years
9 – 14 Years
15 – 24 Years
25 < Years
A04. Are you? male female
B. Information/ Communication
Yes rather Yes
So So
rather No No
B01. Are you notified about the current status
and the changes of the outbound punctuality quality on a regular basis?
B02. Do you discuss punctuality issues with your colleagues regularly?
B03. Do you discuss punctuality issues with your superiors regularly?
B04. Are you notified about newly introduced punctuality measures regularly?
B05. Are employees trained for outbound punctuality on a regular basis?
B06. Do you get feedback about punctuality relevant incidents?

On-Time Performance Joerg Speri
- B -
C. Central Hub Control
Yes rather Yes
So So
rather No No
C01. Do you think that the current organization of
the processes at the hub FRA is likely to have a positive influence on the outbound punctuality performance?
C02. In your opinion did the introduction of a central hub control system have any influence on your personal work pressure?
C03. If not, why not in your opinion?
C04. Would you describe your cooperation with the central hub control as likely to have a positive influence on the overall outbound punctuality performance?
C05. Do you see an urgent call for action in this field?
D. Ideas & Motivation
Yes rather Yes
So So
rather No No
D01. Do you contribute to the process of punctuality
improvement with own ideas regularly?
D02. Were any of your ideas introduced?
D03. Were you notified about the decisions concerned with your idea?
D04. Is outbound punctuality rewarded by your superiors?
D05. Are measures taken when punctuality rules are violated?
D06. Would you describe your current state of motivation towards punctuality as positive?
D07. In your opinion does your personal work have any influence on the outbound punctuality performance at all?
D08. Please estimate the potential improvement of punctuality within your spheres of action. (in %)

On-Time Performance Joerg Speri
- C -
E. Punctuality – management
Yes rather Yes
So So
rather No No
E01. Who in your opinion is the major responsible
for punctuality at the hub FRA?
E02. What is the name of the punctuality manager at the Lufthansa station at Frankfurt Airport?
E03. Do you know about the tasks of this person closer?
E04. Do you contact this person concerning punctuality relevant issues on a regular basis?
E05. Did you get the assistance/ feedback you expected
E06. Do you think the work of this person is important?
E07. In your opinion has the work of this person had any positive influence on the punctuality performance yet?
F. Delay reasons
Yes rather Yes
So So
rather No No
F01. Which three delay codes in your opinion are
the most frequent at Frankfurt Airport? (ranking 1 to 3)
F02. What is the most frequent reason for delays at Frankfurt Airport in your opinion?
F03. Do the delay statistics reflect the actual reasons for delays in an appropriate way?
F04. Do you think that the allocation of delay codes is transparent and easily understandable?
F05. If not, where do you see problems

On-Time Performance Joerg Speri
- D -
Place for your comments – Please feel free to write whatever you wanted to say about the outbound punctuality at Frankfurt: ___________________________________________________________________________
___________________________________________________________________________
___________________________________________________________________________
___________________________________________________________________________
___________________________________________________________________________
____________________________________________________
___________________________________________________________________________
___________________________________________________________________________
___________________________________________________________________________
___________________________________________________________________________
___________________________________________________________________________
____________________________________________________
Thank you very much for your support!!!
On-Time Performance Joerg Speri
- A -
Appendix II
LH Subdelay-Codes (21. April 2005)
Main-Delay-Code IATA Sub-Delay-Code LH internal Sub-Delay-Code
UsedLH Remarks
AIRLINE INTERNAL CODES
1 ONLY TO BE USED BY OPERATIONS CONTROL CENTER 2 Load connection while waiting for AFTM or MISSED SLOT
3 DELAY TIME DISCREPANCIES UP TO 3 MINUTES automatically initiated by A/C equipped with Datalink facility
4 LACK OF AIRCRAFT due to additional revenue flights out of operational reserve or maintenance reserve capacity/version not in line with booking Figures
5 INADEQUATE GROUND TIME ON NPI SERVICES, up to 5 minutes; applicable until further notice only on 25 minutes ground time
8 ACTUAL BLOCK TIME OF INCOMING AIRCRAFT ABOVE SCHEDULED BLOCK TIME
IATA STANDARD CODES
OTHERS
6 NO GATE/STAND AVAILABILITY DUE TO OWN AIRLINE ACTIVITY

On-Time Performance Joerg Speri
- B -
9 SCHEDULED GROUND TIME LESS THAN DECLARED MINIMUM GROUND TIME
A TECHNICAL x B COMMERCIAL x C PLANNED
PASSENGER AND BAGGAGE
11 LATE CHECK-IN, acceptance after deadline
A LATE GATE CHECK IN OF TRANSFER PAX x IN SPITE OF SUFFICIENT
TRANSFER TIME B WAITINGLIST PROCESSING x C LATE ACCEPTANCE OF OK BOOKED PAX x D LACK OF STAFF x E GROUP CHECK-IN x
F GROUND TRANSPORTATION/AIRPORT ACCESS CONGESTION/CLOSURE
MOVE TO 87
12 LATE CHECK-IN, congestion in check-in area A CONGESTION IN CHECK-IN AREA x Departure Hall only B LACK OF STAFF x CKI only C CONGESTION IN TRANSFER AREA x D GROUP CHECK-IN x
E GROUND TRANSPORTATION/AIRPORT ACCESS CONGESTION/CLOSURE
MOVE TO 87
F WAITINGLIST PROCESSING x R LACK OF STAFF: SPECIAL ASSISTANCE x S LACK OF STAFF: SUPERVISION x T LACK OF STAFF: TICKETING x
13 CHECK-IN ERROR, passenger and baggage (incorrectly processed)
A CHECK IN ERROR - STATION x
On-Time Performance Joerg Speri
- C -
B CHECK IN ERROR - THROUGH CHECK-IN LH USE 92 C CHECK IN ERROR - RETURN FLIGHT CHECK-IN LH USE 92 D CHECK-IN ERROR - CURBSIDE E CHECK-IN ERROR - KIOSK x F CHECK-IN ERROR - TELEPHONE x G CHECK-IN ERROR - INTERNET x H CHECK-IN ERROR - OFF AIRPORT TERMINAL x I CHECK-IN ERROR - HOTEL x
J CHECK-IN ERROR - INTERMODAL (E.G. SHIP/TRAIN ETC)
x
K DOUBLE SEATING/DOUBLE CHECK-IN x L DOCUMENTATION (TICKET/VISA/PASSPORT ETC) x
14 OVERSALES, booking errors A OVERSALES x B BOOKING ERROR x R CONFIGURATION CHANGE COMMERCIAL REASONS x
S INVOLUNTARY DOWNGRADING/Upgrading OF PASSENGERS x
T OFFLOADING OF OK PASSENGERS incl. Bag x U VDB PASSENGERS x V ETIX BOOKING ERROR x
W ACCOMODATING PAX FROM OTHER OVERSOLD FLIGHTS x
15 BOARDING, discrepancies and paging, missing checked-in passenger without baggage offload
A BOARDING ERROR / PAX FIGURES DISCREPANCIES x B LATE BOARDING x C SLOW BOARDING x
D MISSING / LATE CHECK-IN PAX (WITHOUT BAGGAGE)
x

On-Time Performance Joerg Speri
- D -
E LATE BUS ORDER/RELEASE BY GATE x F DOCUMENTATION (TICKET/VISA/PASSPORT ETC) x G LACK OF STAFF x H HEADCOUNT DISCREPANCY CREW DELAY I EXCESS HANDLUGGAGE HANDLING x R LATE DOC-CHECK STAFF x THIRD PARTY S LATE LOAD SHEET AT GATE x Caused by CKI staff T LATE SPECIAL ASSISTANCE (SANI) ORDER x
U RESEATING PAX AFTER VERSION OR EQUIPMENT CHANGE x
after NIF in order to avoid boarding discrepancies
V DELAYED BOARDING HON CIRCLE X
16 COMMERCIAL PUBLICITY/PASSENGER CONVENIENCE, VIP, press, ground meals and missing personal items
A VIP BOARDING x B DISRUPTIVE PAX HANDLING x C DISABLED PAX HANDLING x D MISSING PERSONAL ITEMS x E DEPO/INAD HANDLING x F GROUND MEALS (E.G. DELAYED FLIGHT) Gate Service G PASSENGER REQUESTED OFFLOAD x without baggage H ILLNESS/DEATH OF PASSENGER x R COMMERCIAL PUBLICITY/PRESS OR TV x
S PAX ACCEPTANCE FROM OTHER CARRIER NOT CONNECTING x
17 CATERING ORDER, late or incorrect order given to supplier
A LATE ORDER x B INCORRECT ORDER x

On-Time Performance Joerg Speri
- E -
C LATE ORDER OF NON STANDARD SUPPLIES (E.G. BLANKETS, HEADPHONES ETC.)
use code 68 T
R LATE ORDER OF ADD. RETURN CATERING BY DEST. x 18 BAGGAGE PROCESSING, sorting, etc. A LATE DELIVERY LOCAL BAGGAGE x
B LATE DELIVERY TRANSFER BAGGAGE x more actual time than MCT
C BAGGAGE RECONCILATION USE LH own codes below D LACK OF STAFF x R BREAKDOWN BRS x S BRS ERROR DUE TO MATCHING DISCREPANCIES x T LATE DELIVERY BULKY BAGGAGE x U LATE DELIVERY BAGGAGE FROM GATE x
V BREAKDOWN AUTOMATED BAGGAGE TRANSPORTATION SYSTEM x
W SCANNING X-RAY x
CARGO AND MAIL
21 DOCUMENTATION (late or incorrect) A LATE CARGO FIGURES x B INCORRECT CARGO FIGURES x C LATE CARGO DOCS x D INCORRECT CARGO DOCS x R LATE OR INCORRECT NOTOC x
22 LATE POSITIONING (discrepancies) A RELOADING A/C DUE TO MISSING CARGO x B LACK OF STAFF x C LACK OF EQUIPMENT x

On-Time Performance Joerg Speri
- F -
D POSITIONED TO WRONG STAND x R INCORRECT CONTOUR/BUILT UP OF ULD x Wrong Container for A/C
23 LATE ACCEPTANCE (after deadline) A LATE ACCEPTANCE CGO - COMMERCIAL REASONS x B ACCEPTANCE OF STANDBY CARGO x C LACK OF STAFF x D EXPRESS CARGO x E DIPLOMATIC MAIL x
24 INADEQUATE PACKING or inadequate provision of loading material
A LOAD SHIFTING ENROUTE TO AIRCRAFT x B DANGEROUS GOODS x C INCORRECT PALLET BUILT-UP (E.G. OVERLAPS) x
R LTE PROVISION OF LOADING OR LASHING MATERIAL x
material necessary for e.g. HEA, etc.
25 OVERSALES, booking errors A OVERSALES x B BOOKING ERROR x C ACCEPTANCE OF STANDBY CARGO
26 LATE PREPARATION IN WAREHOUSE A PALLETISING ERRORS x B CONTOURS x C CARGO SYSTEM FAILURES x D LACK OF STAFF x
E WAREHOUSE CONGESTION
x

On-Time Performance Joerg Speri
- G -
MAIL ONLY
27 DOCUMENTATION, PACKING, etc. A LATE MAIL FIGURES x B INCORRECT MAIL FIGURES x C LATE DOCS x D INCORRECT DOCS x
R DISCREPANCIES BTN ESTIMATED AND POSITIONED MAIL x
28 LATE POSITIONING A RELOADING AIRCRAFT DUE TO MISSING MAIL x B LACK OF STAFF x C LACK OF EQUIPMENT x D POSITIONED TO WRONG STAND x R DAMAGED OR INCORRECT BUILT UP OF ULD x
29 LATE ACCEPTANCE A LATE ACCEPTANCE MAIL - COMMERCIAL REASONS x B ACCEPTANCE OF STANDBY MAIL x C LACK OF STAFF x
AIRCRAFT AND RAMP HANDLING
31 AIRCRAFT DOCUMENTATION LATE/INACCURATE, weight and balance, general declaration, pax manifest, etc.
A LATE DOCUMENTATION x B INCORRECT DOCUMENTATION x C LATE LOADSHEET x

On-Time Performance Joerg Speri
- H -
D INCORRECT LOADSHEET x
E REPOSITIONING OF PASSENGERS/DEADLOAD FOR BALANCE REASONS
x
F INCORRECT DATA IN DCS SYSTEM (E.G. SEATPLAN) x G LACK OF STAFF x H LOADING-PLAN ERROR x I LATE FUEL FIGURES x
R AMENDING DOCUMENTS DUE TO LAST MINUTE CHANGES DUE TO PAX x
S LATE PRESENTATION OF FLIGHT DOCUMENTS TO COC BY HANDLING AGENT x
T LATE REMOTE LOADSHEET x
32 LOADING/UNLOADING, bulky, special load, cabin load, lack of loading staff
A CABIN LOAD; BULKY; SPECIAL LOAD; HEA x B LATE LOADERS x C LACK OF STAFF x
D INCORRECT LOADING (NOT ACCORDING TO LOADPLAN OR LOADING PRINCIPLES)
x
E ULD DAMAGE x F INPLANE LOADING SYSTEMS INOPERABLE use 41D
G LATE/LACK OF LOADING DEVICES (LASHING AND / OR SUPPORTING MATERIAL)
x e.g. for AVIH and other baggage
R VOLUMETRIC/SPACE PROBLEMS x incl. bulk load
S ADJUSTING LOADING DUE TO LAST MINUTE CHANGES x
33 LOADING EQUIPMENT, lack of or breakdown, e.g. container pallet loader, lack of staff
A LATE EQUIPMENT x B LACK OF EQUIPMENT x

On-Time Performance Joerg Speri
- I -
C LACK OF EQUIPMENT OPERATOR x D BREAKDOWN OF EQUIPMENT x E INCORRECT EQUIPMENT x
34 SERVICING EQUIPMENT, lack of or breakdown, lack of staff, e.g. steps
A LATE/LACK/BREAKDOWN OF JET-WAY x in case of breakdown use 87 E
B LATE/LACK OF PAX STAIRS x C LATE/LACK OF PASSENGER TRANSPORT x E LATE/LACK OF WATER SERVICE x F LATE/LACK OF TOILET SERVICE x G LACK OF STAFF x R LATE OR LACK OF AMBULANCE x S LATE DELIVERY LOWER CREW REST UNIT x T LATE PASSENGER TRANSPORT COMPARTMENT x
35 AIRCRAFT CLEANING A LATE COMPLETION x B INSUFFICIENT OR INCORRECT EQUIPMENT x C EQUIPMENT BREAKDOWN x D LACK OF STAFF x
E CALLED BACK TO AIRCRAFT SAME AS F-ADDITIONAL
CLEANING F ADDITIONAL OR SPECIAL CLEANING REQUIRED x G COCKPIT WINDOW CLEANING x
H LATE OR LACK OF CABIN SUPPLIES (E.G. BLANKETS, HEADREST COVERS, ETC.)
x
36 FUELLING/DEFUELLING, fuel supplier A LACK OF FUEL TRUCK x B LATE FUEL TRUCK x C BREAKDOWN OF FUEL TRUCK DURING OPERATION x

On-Time Performance Joerg Speri
- J -
D DEFUELLING x E LACK OF STAFF x F FUELLING ERROR x G SPECIAL PROCEDURE FOR TECHNICAL REASONS IF TECHNICAL USE 41 H FUEL HYDRANT SYSTEM use 87? I FUEL SHORTAGE/CONTAMINATION x J FUEL SPILL AT AIRCRAFT x
K INCORRECT PARKING OF AIRCRAFT - UNABLE TO FUEL
x
37 CATERING, late delivery or loading A LACK OF CATERING / SUPPLIER STAFF x B LACK OF CATERING EQUIPMENT x C BREAKDOWN OF CATERING EQUIPMENT x D LATE CATERING x
E WRONG OR INSUFFICIENT CATERING (INCL. CABIN ITEMS E.G. BLANKETS)
x
F LATE DELIVERY RETURN CATERING x
G RETURN CATERING NOT LOADED AT PREVIOUS STATION
x
R LATE CATERING DUE TO A/C CHANGE x
38 ULD, lack of or serviceability A LACK OF ULDs x B UNSERVICEABLE OR DAMAGED ULDs x C LATE PROVISION TO HANDLING UNIT x
39 TECHNICAL EQUIPMENT, lack of or breakdown, lack of staff, e.g. push-back, GPU, ASU
A BREAKDOWN / LACK OF / LATE GPU x also used in case of FEGP (Fixed Electrical Ground Power Unit)
B BREAKDOWN / LACK OF / LATE DE-ICING EQUIPMENT
use 75D/E
C BREAKDOWN / LACK OF / LATE TOW BAR x

On-Time Performance Joerg Speri
- K -
D BREAKDOWN / LACK OF / LATE AIRSTARTER x E LATE/LACK OF AIR-CONDITIONER x F LATE/LACK/BREAKDOWN OF PUSHBACK x G LACK OF STAFF x
H LATE/LACK/BREAKDOWN OF OTHER TECHNICAL EQUIPMENT
Code itself
TECHNICAL AND AIRCRAFT EQUIPMENT
41 AIRCRAFT DEFECTS during transit or after positioning on ramp
A TECHNICAL DEFECTS (NOT DAMAGES: 51 OR 52 OR ACARS SYSTEM: 58A)
x
B CABIN OUTFIT MALFUNCTIONS (E.G. SEATS, GALLEY)
x
C DEFECTS ON INFLIGHT ENTERTAINMENTS x D AIRCRAFT LOADING SYSTEM FAILURE x E AWAITING DEPARTURE DISPENSATION x
R MISSING TECHNICAL DOCUMENTS x S OXYGEN REFILL x T LACK OF STAFF x
42 SCHEDULED MAINTENANCE, late release A LATE DOCUMENTATION x B LATE POSITIONING x C LATE STAFF x D VERSION CHANGE use code 48 for LH E DELAYS DURING TOWING OPERATION x F LACK OF STAFF x
43 NON-SCHEDULED MAINTENANCE, special checks and/or additional works beyond normal maintenance schedule

On-Time Performance Joerg Speri
- L -
A LACK OF STAFF x B LATE DOCUMENTATION x
C SPECIAL INSPECTIONS (E.G.AD'S) x e.g. lightning strike, heavy landing
44 SPARES AND MAINTENANCE EQUIPMENT, lack of or breakdown
A LACK OF SPARES x
B LACK OF /BREAKDOWN OF MAINTENANCE EQUIPMENT x
C LATE DELIVERY OF SPARES x R LACK OF LTL STAFF
45 AOG SPARES, to be carried to another station A LATE DELIVERY TO AIRCRAFT x incorrect delivery as well B LATE DOCUMENTATION x C INCORRECT DOCUMENTATION x D RELOAD OF AIRCRAFT x E ADDITIONAL ENGINE POD x F AOG FOR THIRD PARTY x
R LACK OF LOCAL TECHNICAL STAFF non maintenance station and staff has to be sent from other location
46 AIRCRAFT CHANGE, for technical reasons A AIRCRAFT CHANGE AFTER DAMAGE BY OTHERS x e.g. KASKO
B AIRCRAFT CHANGE AFTER DAMAGE BY LIGHTNING ETC. (AS PER CODE 51)
use 51
C TECHNICAL CHECK COMPLIANCE x
D CONSEQUENTIAL - AFTER INITIAL A/C CHANGE ON ANOTHER SERVICE
use delay 96S
47 STANDBY AIRCRAFT, lack of planned standby aircraft for technical reasons
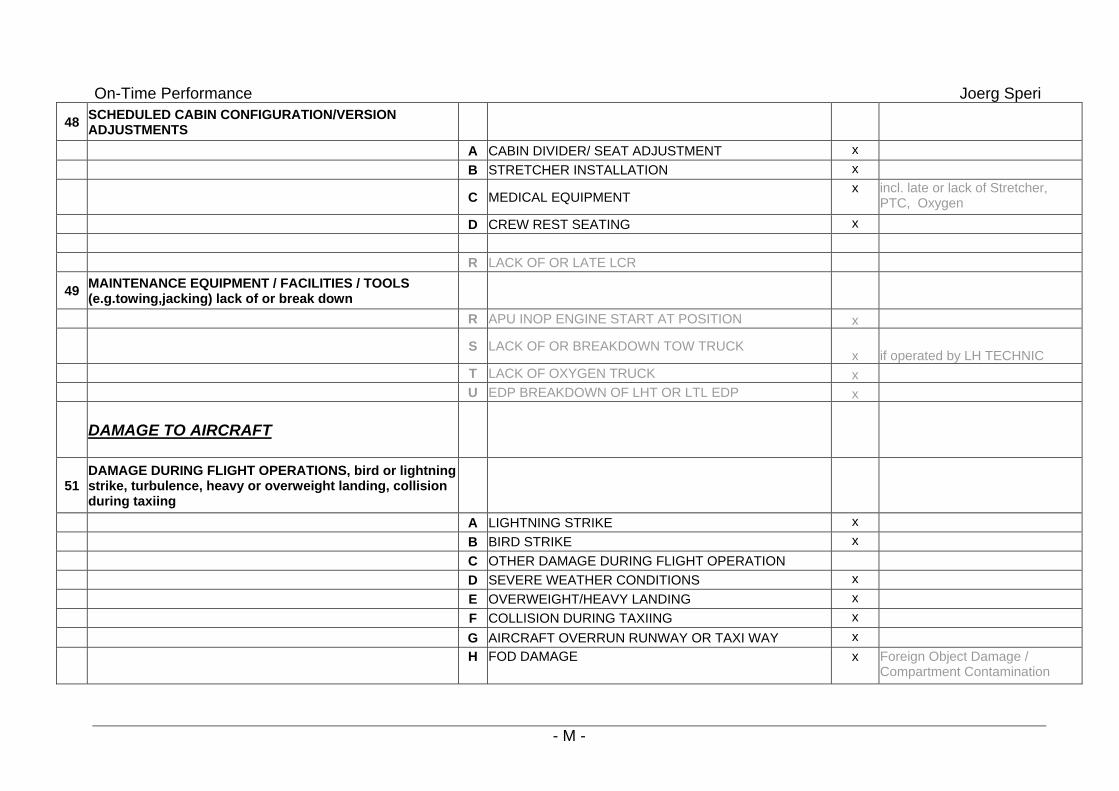
On-Time Performance Joerg Speri
- M -
48 SCHEDULED CABIN CONFIGURATION/VERSION ADJUSTMENTS
A CABIN DIVIDER/ SEAT ADJUSTMENT x B STRETCHER INSTALLATION x
C MEDICAL EQUIPMENT x incl. late or lack of Stretcher,
PTC, Oxygen D CREW REST SEATING x R LACK OF OR LATE LCR
49 MAINTENANCE EQUIPMENT / FACILITIES / TOOLS (e.g.towing,jacking) lack of or break down
R APU INOP ENGINE START AT POSITION x
S LACK OF OR BREAKDOWN TOW TRUCK x if operated by LH TECHNIC
T LACK OF OXYGEN TRUCK x U EDP BREAKDOWN OF LHT OR LTL EDP x
DAMAGE TO AIRCRAFT
51 DAMAGE DURING FLIGHT OPERATIONS, bird or lightning strike, turbulence, heavy or overweight landing, collision during taxiing
A LIGHTNING STRIKE x B BIRD STRIKE x C OTHER DAMAGE DURING FLIGHT OPERATION D SEVERE WEATHER CONDITIONS x E OVERWEIGHT/HEAVY LANDING x F COLLISION DURING TAXIING x G AIRCRAFT OVERRUN RUNWAY OR TAXI WAY x
H FOD DAMAGE x Foreign Object Damage / Compartment Contamination

On-Time Performance Joerg Speri
- N -
R AIRCRAFT CHANGE AFTER DAMAGE BY LIGHTNING ETC. (AS PER CODE 51)
x
52 DAMAGE DURING GROUND OPERATIONS, collisions (other than during taxiing), loading/off-loading damage, contamination, towing, extreme weather conditions
A COLLISION (OTHER THAN DURING TAXIING), TOWING
x
B CONTAMINATION, EXTREME WEATHER CONDITIONS x C DAMAGE BY LOADING EQUIPMENT x D DAMAGE BY AIR BRIDGE x E DAMAGE BY STEPS x F DAMAGE FUELING EQUIPMENT x G DAMAGE BY TECHNICAL SUPPORT EQUIPMENT x H DAMAGE BY CATERING EQUIPMENT x I DAMAGE BY CLEANING EQUIPMENT x J DAMAGE BY PUSHBACK EQUIPMENT x K ACCIDENTAL ESCAPE SLIDE DEPLOYMENT x not caused by crew (68)
R MAINTENANCE AFTER KASKO DURING GROUND OPERATION
x e.g. wheel change caused by nails etc. during taxiing
EDP/AUTOMATED EQUIPMENT FAILURE
55 DEPARTURE CONTROL, check-in or weight & balance, host down
A LOCAL DCS EQUIPMENT FAILURE use R-Y
B DCS HOST FAILURE x e.g. UNISYS HOST DOWN
C HOST NETWORK FAILURE x e.g. CUTE D LOCAL NETWORK FAILURE x e.g. SITA

On-Time Performance Joerg Speri
- O -
E SELF SERVICE DEVICE FAILURE x e.g. LCT R STATION CONTROL SYSTEMS x e.g. BEST S CHECK IN SYSTEM x
T OPS SYSTEM x
e.g. WAB and Centralized Load Sheet
U AIRPORT SYSTEMS x
e.g. , PSMP/Info 80-System Failure/BRS
V SECURITY SYSTEMS x e.g. GSS, BOARDING CONTROL
W BAGGAGE SYSTEM x e.g. WORLDTRACER, X TICKETING/RESERVATION SYSTEMS x e.g. AMADEUS Y COMMUNICATION BREAK DOWN x DAS, IGCC, ACARS Z PICTURES X
56 CARGO PREPARATION/DOCUMENTATION, host down
A LOCAL EQUIPMENT FAILURE x B HOST FAILURE x C HOST NETWORK FAILURE x D LOCAL NETWORK FAILURE x E AUTOMATED CUSTOMS CLEARANCE x
57 FLIGHT PLANS, host down A LOCAL EQUIPMENT FAILURE x e.g. LIDO B HOST FAILURE x C HOST NETWORK FAILURE x D LOCAL NETWORK FAILURE x E COMMUNICATION WITH ATC SYSTEM x
58 OTHER AUTOMATED SYSTEMS R PRINTER FAILURE x

On-Time Performance Joerg Speri
- P -
FLIGHT OPERATIONS AND CREWING
61 FLIGHT PLAN, late completion or change of, flight documentation
A CHANGE/AMEND OF FLIGHT PLAN x B LATE FLIGHT DISPATCH DOCS x C INCORRECT FLIGHT DISPATCH DOCS x D LATE FILING OF ATC FLIGHT PLAN x E INCORRECT FILING OF ATC FLIGHT PLAN x
F LATE FUEL OR PAYLOAD CHANGE DUE OPERATIONAL REQUIREMENT
x
G LACK OF STAFF x H FLIGHT BAG/ NAV KIT MISSING OR INCOMPLETE x
R LATE FLIGHT DOCUMENTATION DUE TO CHANGE OF SELF BRIEFING CREW STATUS
x
62 OPERATIONAL REQUIREMENTS, fuel, load, alteration A FUEL ALTERATIONS x
B AWAITING FINAL WEIGHTS - FUEL CRITICAL FLIGHTS
x
C LOAD ALTERATIONS x
63 LATE CREW BOARDING OR DEPARTURE PROCEDURES, other than connection and standby (flight deck or entire crew)
A ENTIRE CREW LATE BOARDING x B COCKPIT CREW LATE BOARDING x C ENTIRE CREW LATE BOARDING DUE TO CREW BUS x
D COCKPIT CREW LATE BOARDING DUE TO CREW BUS
x
E LATE CREW PICK UP (OTHER THAN CREW BUS) x

On-Time Performance Joerg Speri
- Q -
F GROUND TRANSPORTATION/AIRPORT ACCESS CONGESTION/CLOSURE
x
G SECURITY PROCEDURES x
64 FLIGHT DECK CREW SHORTAGE, sickness, awaiting standby, flight time limitations, crew meals, valid visa, health documents, etc.
A SICKNESS x B AWAITING STAND BY CREW x C FLIGHT TIME LIMITATIONS x D TRAVEL DOCUMENTS x E CREW SCHEDULING OR CREW CONTROL ERROR x F LATE DUTY REPORT x G INJURY OR DEATH x
H OPERATIONAL RATING INSUFFICIENT (E.G. CAT1 ETC.)
no more applicable for LH
R MANDATORY/MINIMUM CREW REST x
65 FLIGHT DECK CREW SPECIAL REQUEST, not within operational requirements
A HOLDING/DELAYING PAX BOARDING BY CREW x
B REQUEST FOR MAINTENANCE NOT MINIMUM EQUIPMENT LIST
x e.g. oxygen within limits
C LATE CATERING ORDER x CREW MEAL R REQUEST FOR OTHERS NOT MINIMUM x S CREW RELATIVES STANDBY PROBLEMS x
66 LATE CABIN CREW BOARDING OR DEPARTURE PROCEDURES, other than connection and standby
A CABIN CREW LATE BOARDING x B CABIN CREW LATE BOARDING DUE TO CREW BUS x C LATE CREW PICK UP (OTHER THAN CREW BUS) x

On-Time Performance Joerg Speri
- R -
D GROUND TRANSPORTATION/AIRPORT ACCESS CONGESTION/CLOSURE
x
E SECURITY PROCEDURES x
67 CABIN CREW SHORTAGE, sickness, awaiting standby, flight time limitations, crew meals, valid visa, health documents, etc.
A SICKNESS x B AWAITING STAND BY CREW x C FLIGHT TIME LIMITATIONS x D TRAVEL DOCUMENTS x E CREW SCHEDULING OR CREW CONTROL ERROR x F LATE DUTY REPORT x G INJURY OR DEATH x R MANDATORY/MINIMUM CREW REST x
68 CABIN CREW ERROR OR SPECIAL REQUEST, not within operational requirements
A INCORRECT HEAD COUNT x B RE-ORDER OR LATE REQUEST - CATERING not applicable C RE-ORDER OR LATE REQUEST - TOILET SERVICE x Water fill up D RE-ORDER OR LATE REQUEST - CLEANING x E EVACUATION SLIDE DEPLOYED x F HOLDING/DELAYING PAX BOARDING BY CREW x R GALLEY/MEAL CHECK x
S CABIN CREW REQ ADDITIONAL CATERING (FOR PAX) x not standard meals / equipment
T LATE ORDER OF NON STANDARD SUPPLIES (E.G. BLANKETS, HEADPHONES, SARS KIT ETC.)
x LH CABIN CREW PROCEDURE
U LATE ORDER CREW MEAL x

On-Time Performance Joerg Speri
- S -
69 CAPTAIN REQUEST FOR SECURITY CHECK, extraordinary
WEATHER
71 DEPARTURE STATION A OUTSIDE AIRCRAFT LIMITS x B OUTSIDE CREW LIMITS check if still applicable R WEATHER BELOW OPERATING LIMITS x
72 DESTINATION STATION A OUTSIDE AIRCRAFT LIMITS x B OUTSIDE CREW LIMITS check if still applicable R WEATHER BELOW OPERATING LIMITS x
73 EN ROUTE OR ALTERNATE A OUTSIDE AIRCRAFT LIMITS x B OUTSIDE CREW LIMITS check if still applicable
C ETOPS x alternate closed due to weather
R WEATHER BELOW OPERATING LIMITS x
75 DE-ICING OF AIRCRAFT, removal of ice and/or snow, frost prevention excluding unserviceability of equipment
A REMOTE DE-ICING x B DE-ICING ON POSITION x
C ADDITIONAL DE-ICING AFTER HOLDOVER TIME EXPIRED
x
D LACK OF EQUIPMENT x E BREAKDOWN OF EQUIPMENT x F LACK OF STAFF x

On-Time Performance Joerg Speri
- T -
G LACK OF FLUID x
76 REMOVAL OF SNOW, ICE, WATER AND SAND FROM AIRPORT
A AIRPORT CLOSURE DUE TO HEAVY WEATHER CONDITIONS
x as well as runway
B LACK OF POSITIONS DUE TO WEATHER CONDITIONS
x
C REMOVAL OF SNOW/ICE/WATER/SAND FROM AIRPORT
x incl. jetways and stairs
77 GROUND HANDLING IMPAIRED BY ADVERSE WEATHER CONDITIONS
A INTERRUPTION OF FUELLING OR SERVICING x B APRON CONDITIONS x C HIGH WINDS - DOOR OPERATION LIMITS x
AIR TRAFFIC FLOW MANAGEMENT RESTRICTIONS
81 ATFM DUE TO ATC EN-ROUTE DEMAND/CAPACITY, standard demand/capacity problems
R INDUSTRIAL ACTION x S EQUIPMENT FAILURE x T STAFF SHORTAGE x U HIGH DEMAND OR CAPACITY x
82 ATFM DUE TO ATC STAFF/EQUIPMENT EN-ROUTE, reduced capacity caused by industrial action or staff shortage or equipment failure, extraordinary demand due to capacity reduction in neighbouring area
R INDUSTRIAL ACTION x S EQUIPMENT FAILURE x T STAFF SHORTAGE x U HIGH DEMAND OR CAPACITY x

On-Time Performance Joerg Speri
- U -
83 ATFM DUE TO RESTRICTION AT DESTINATION AIRPORT, airport and/or runway closed due to obstruction, industrial action, staff shortage, political unrest, noise abatement, night curfew, special flights
R INDUSTRIAL ACTION x S EQUIPMENT FAILURE x T STAFF SHORTAGE x U RUNWAY CLOSED x V NOISE ABATEMENT/NIGHT CURFEW x W POLITICAL UNREST x X HIGH DEMAND OR CAPACITY x
84 ATFM DUE TO WEATHER AT DESTINATION
AIRPORT AND GOVERNMENTAL AUTHORITIES
85 MANDATORY SECURITY A CONGESTION AT SECURITY CHECK x
B BAGGAGE IDENTIFICATION / UNLOADING DUE TO MISSING PAX
x
C SPECIAL AIRPORT SECURITY/ABANDONED ARTICLES
x unattended baggage
D BOMB WARNING x
E DECLARED SECURITY BREACH x security risk: passenger left gate
area uncontrolled
F ADDITIONAL/SPECIAL SECURITY INSPECTIONS x searching of A/C by specialists
G MANDATORY PAX OFFLOAD x with baggage H LACK OF STAFF x I BREAKDOWN OF EQUIPMENT x

On-Time Performance Joerg Speri
- V -
R SPECIAL SECURITY CHECK INVOLVING PAX, BAG AND HANDBAGGAGE AT THE AIRPORT SIDE x e.g special US regulations
S ADDITIONAL AVI CHECK x T INTENDED OFFLOAD DUE TO MISSING PAX x "red bags"
86 IMMIGRATION CUSTOMS, HEALTH disinfection of aircraft A IMMIGRATION / CUSTOMS INFRASTRUCTURE x B LACK OF STAFF x C HEALTH x e.g. SARS checks
D INSUFFICIENT TRAVEL DOC OF PAX / INAD / DEPORTEE
x e.g. false passports
E INCOMING PASSENGER CHECKS x F AIRCRAFT DISINFECTION x G AIRCRAFT SEIZURE H QUARANTINE x
R ADDITIONAL BAGGAGE CHECK ON OFFICIAL REQUEST x
S CUSTOMS CHECK INBOUND BAGGAGE LH..... x transfer baggage T LATE DEPORTEE BOARDING x
87 AIRPORT FACILITIES, parking stands, ramp congestion, lighting, buildings, gate limitations, etc.
A LACK OF PARKING STANDS x or blocked non LH positions
B LIGHTING OR BUILDINGS x C BAGGAGE SORTING SYSTEM DOWN / SLOW LH use code 18
D NO PUSH BACK CLEARANCE DUE TO INFRASTRUCTURE
x taxi way limitations, P/B incl. Registration
E JET BRIDGE INOPERATIVE x F GATE LIMITATION / NO GATE AVAILABLE x or blocked G LACK OF CHECK IN COUNTERS x H RAMP CONGESTION x I ELECTRICAL SYSTEM FAILURE x AS WELL EDP

On-Time Performance Joerg Speri
- W -
J PASSENGER TRANSPORT SYSTEM FAILURE x e.g. sky train
K PUBLIC ADDRESS/FLIGHT INFORMATION DISPLAY SYSTEM FAILURE
LH use 55
L INSUFFICIENT FIRE COVER x M GROUND COMMUNICATION SYSTEM FAILURE x e.g. telecommunication
R NO PUSH BACK CLEARANCE DUE TO CONSTRUCTION x
S BREAKDOWN OF AIRPORT FUELING SYSTEM x T LATE OR LACK OF FOLLOW ME FOR PUSH-BACK x
88 RESTRICTIONS AT AIRPORT OF DESTINATION, airport and/or runway closed due to obstruction, industrial action, political unrest, noise abatement, night curfew, special flights (excluding weather)
A RESTRICTIONS DUE TO CURFEW x DELIBERATE HOLD DUE TO
SHORT FLIGHT TIME (CURFEW AT DESTINATION A/P)
B INDUSTRIAL ACTION x C POLITICAL UNREST x D AIRPORT CLOSURE x E RUNWAY CLOSURE x
R CONSTRUCTION WORK/MAINTENANCE x
e.g. Landing Restriction due to local requirements
89
RESTRICTIONS AT AIRPORT OF DEPARTURE WITH OR WITHOUT ATFM RESTRICTIONS, including Air Traffic Services, start-up and pushback, airport and/or runway closed due to obstruction or weather (restriction due to weather in case of AFTM regulation only, else refer to code 71 (WO)), industrial action, staff shortage, political unrest, noise abatement, night curfew, special flights

On-Time Performance Joerg Speri
- X -
A RESTRICTIONS DUE TO CURFEW x B INDUSTRIAL ACTION x C POLITICAL UNREST x D AFTM REGULATIONS x E AIRPORT CLOSURE x F RUNWAY CLOSURE x R BREAKDOWN AFTM/ATC COMPUTER x S LOST FLIGHT PLAN BY ATC x T CONSTRUCTION WORK/MAINTENANCE x
REACTIONARY
91 LOAD CONNECTION, awaiting load from another flight DISTINGUISH PAX, BAG,
CARGO/MAIL, LIFE AND DEATH
R PAX AND/OR BAGGAGE ( + FLT.-NR.) x S PAX AND/OR BAGGAGE ( + FLT.-NR.) OAL x T CARGO AND MAIL (+ FLT.- NR.) x U SHORT CONNEX / RDS x
92 THROUGH CHECK IN ERROR, passenger and baggage
A NO THROUGH CHECK IN / INCORRECT TRANSIT / TRANSFER FIGURES PAX AND BAGGAGE
x
B MISSING/INCORRECT SEPARATION OF TRANSIT / TRANSFER / LOCAL LOADS
x
R THROUGH CHECK IN ERROR, PASSENGER AND/OR BAGGAGE (+ STATION OF ORIGIN) x caused by previous station(s)
S THROUGH CHECK IN ERROR, PASSENGER AND/OR BAGGAGE (+ STATION OF ORIGIN) SPECIAL HANDLING x caused by previous station(s)

On-Time Performance Joerg Speri
- Y -
T THROUGH CHECK IN ERROR, PASSENGER AND BAGGAGE (+ STATION OF ORIGIN) DOCS INCL. OFFLOAD OF BAG x
caused by previous station(s) docs checks not correct
U THROUGH CHECK IN ERROR, PASSENGER AND BAGGAGE (+ STATION OF ORIGIN) CARRY-ON BAGGAGE (DOCUMENTATION OF STATION OF ORIGIN) x
oversize / numbers of pieces hand baggage
93 AIRCRAFT ROTATION, late arrival of aircraft from another flight or previous sector
A LATE ARRIVAL DUE DEPARTURE DELAY AT PREVIOUS STATION
x
B LATE ARRIVAL DUE ENROUTE DELAY x C LATE ARRIVAL DUE DELAY AFTER LANDING x e.g. long taxi time
94 CABIN CREW ROTATION, awaiting cabin crew from another flight (including deadheading cabin crew members)
A OPERATING CREW x B POSITIONING OR DEADHEAD CREW x
95 CREW ROTATION, awaiting flight deck or entire crew from another flight (including deadheading crew members)
A OPERATING CREW x B POSITIONING OR DEADHEAD CREW x
96 OPERATIONS CONTROL, rerouting, diversion, consolidation, aircraft change for reasons other than technical
A REROUTING x B CONSOLIDATION x delay of flight to accommodate
pax of a later flight
C AIRCRAFT CHANGE/EQUIPMENT CHANGE FOR REASONS OTHER THAN TECHNICAL
x
D DIVERSION x

On-Time Performance Joerg Speri
- Z -
E RESCHEDULED GROUND TIME LESS THAN DECLARED MIN GROUND TIME
x e.g. due to ACH insufficient GT
F LATE DISPATCH RELEASE x due to rerouting G CONTROLLER/PLANNER ERROR x
H OCC DISRUPTION x e.g. lack of staff, break down of
OPS control system
R DEFUELLING DUE TO OPS REASON e.g. ACH/ECH
S SECONDARY TECHNICAL REASON
First Change is code 46 and delay 96S has to be used for all changes on the same day (long haul incl. previous day) also in case of lack off spares + AC change caused by another station
MISCELLANEOUS
97 INDUSTRIAL ACTION WITH OWN AIRLINE A LOCAL STATION x B WHOLE COMPANY x C PASSENGER HANDLING x D RAMP HANDLING x E CARGO x F CATERING x G FLIGHT DECK CREW x H CABIN CREW x I TECHNICAL x J IT / SUPPORT x K FUEL x L OTHER OPERATIONAL x

On-Time Performance Joerg Speri
- AA -
98
INDUSTRIAL ACTION OUTSIDE OWN AIRLINE, excluding ATS
A NATIONAL STRIKE x B WHOLE HANDLING COMPANY x C PASSENGER HANDLING x D RAMP HANDLING x E CARGO x F CATERING x G TECHNICAL x H CLEANING x I IT / SUPPORT x J FUEL x K OTHER OPERATIONAL x L SECURITY x M FIRE BRIGADE x N AUTHORITIES x O AIRPORT x
99 This code shall be used only when it is clear that a reason cannot be matched to a code above (explain in SI section)

On-Time Performance Jörg Speri
- - A
Appendix III
Codebook to the questionnaire used during the survey
Variable Label Values Missing/ Non – plausible values*
A01 Position 1: FM
2: AFM 3: SL SO
99
A02
Duration of employment at LH
1: shorter than 3 years 2: 3 to 8 years 3: 9 to 14 years 4: 15 to 24 years 5: longer than 25 years
99
A03
In the specific position since 1: shorter than 3 years 2: 3 to 8 years 3: 9 to 14 years 4: 15 to 24 years 5: longer than 25 years
99
A04 Gender
1: Male 2: Female 99
B01
Are you notified about the current status and the changes of the outbound punctuality quality on a regular basis?
1: Yes 2: Rather Yes 3: So So 4: Rather No 5: No
99
B02
Do you discuss punctuality issues with your colleagues regularly?
1: Yes 2: Rather Yes 3: So So 4: Rather No 5: No
99
B03
Do you discuss punctuality issues with your superiors regularly?
1: Yes 2: Rather Yes 3: So So 4: Rather No 5: No
99
B04
Are you notified about newly introduced punctuality measures regularly?
1: Yes 2: Rather Yes 3: So So 4: Rather No 5: No
99
B05
Are employees trained for outbound punctuality on a regular basis?
1: Yes 2: Rather Yes 3: So So 4: Rather No 5: No
99
B06
Do you get feedback about punctuality relevant incidents?
1: Yes 2: Rather Yes 3: So So 4: Rather No 5: No
99

On-Time Performance Jörg Speri
- - B
C01
Do you think that the current organization of the processes at the hub FRA is likely to have a positive influence on the outbound punctuality performance?
1: Yes 2: Rather Yes 3: So So 4: Rather No 5: No
99
C02
In your opinion did the introduction of a central hub control system have any influence on your personal work pressure?
1: Yes 2: Rather Yes 3: So So 4: Rather No 5: No
99
C03 If not, why in your opinion?
Precoded (see following variables)
C03A Workload has not changed 1: mentioned
2: not mentioned
99
C03B Lack of communication HCC <-> Shop floor
1: mentioned 2: not mentioned 99
C03C Too focused on own work 1: mentioned
2: not mentioned 99
C03D HCC to far away and anonymous
1: mentioned 2: not mentioned 99
C03E Too many people involved 1: mentioned
2: not mentioned 99
C03F Others 1: mentioned
2: not mentioned 99
C04
Would you describe your cooperation with the central hub control as likely to have a positive influence on the overall outbound punctuality performance?
1: Yes 2: Rather Yes 3: So So 4: Rather No 5: No
99
C05
Do you see an urgent call for action in this field?
1: Yes 2: Rather Yes 3: So So 4: Rather No 5: No
99
D01
Do you contribute to the process of punctuality improvements with own ideas regularly?
1: Yes 2: Rather Yes 3: So So 4: Rather No 5: No
99
D02
Were any of your ideas introduced?
1: Yes 2: Rather Yes 3: So So 4: Rather No 5: No
99
D03
Were you notified about the decisions concerned with your idea?
1: Yes 2: Rather Yes 3: So So 4: Rather No 5: No
99

On-Time Performance Jörg Speri
- - C
D04
Is outbound punctuality rewarded by your superiors?
1: Yes 2: Rather Yes 3: So So 4: Rather No 5: No
99
D05
Are measures taken when punctuality rules are violated?
1: Yes 2: Rather Yes 3: So So 4: Rather No 5: No
99
D06
Would you describe your current state of motivation towards punctuality as positive?
1: Yes 2: Rather Yes 3: So So 4: Rather No 5: No
99
D07
In your opinion does your personal work have any influence on the outbound punctuality performance at all?
1: Yes 2: Rather Yes 3: So So 4: Rather No 5: No
99
D08
Please estimate the potential improvement of punctuality within your spheres of action. (in %)
Percentage 99
E01
Who in your opinion is the major responsible for punctuality issues at the hub FRA?
1: Hub Manager 2: Station Manager 3: Punctuality Manager 4: Somebody else
99
E02 What is the name of the punctuality manager?
1: right (Krestan) 2: wrong (not Krestan) 99
E03
Do you know about the tasks of this person closer?
1: Yes 2: Rather Yes 3: So So 4: Rather No 5: No
99
E04
Do you contact this person concerning punctuality relevant issues on a regular basis?
1: Yes 2: Rather Yes 3: So So 4: Rather No 5: No
99
E05
Did you get the assistance/ feedback you expected?
1: Yes 2: Rather Yes 3: So So 4: Rather No 5: No
99
E06
Do you think the work of this person is important?
1: Yes 2: Rather Yes 3: So So 4: Rather No 5: No
99
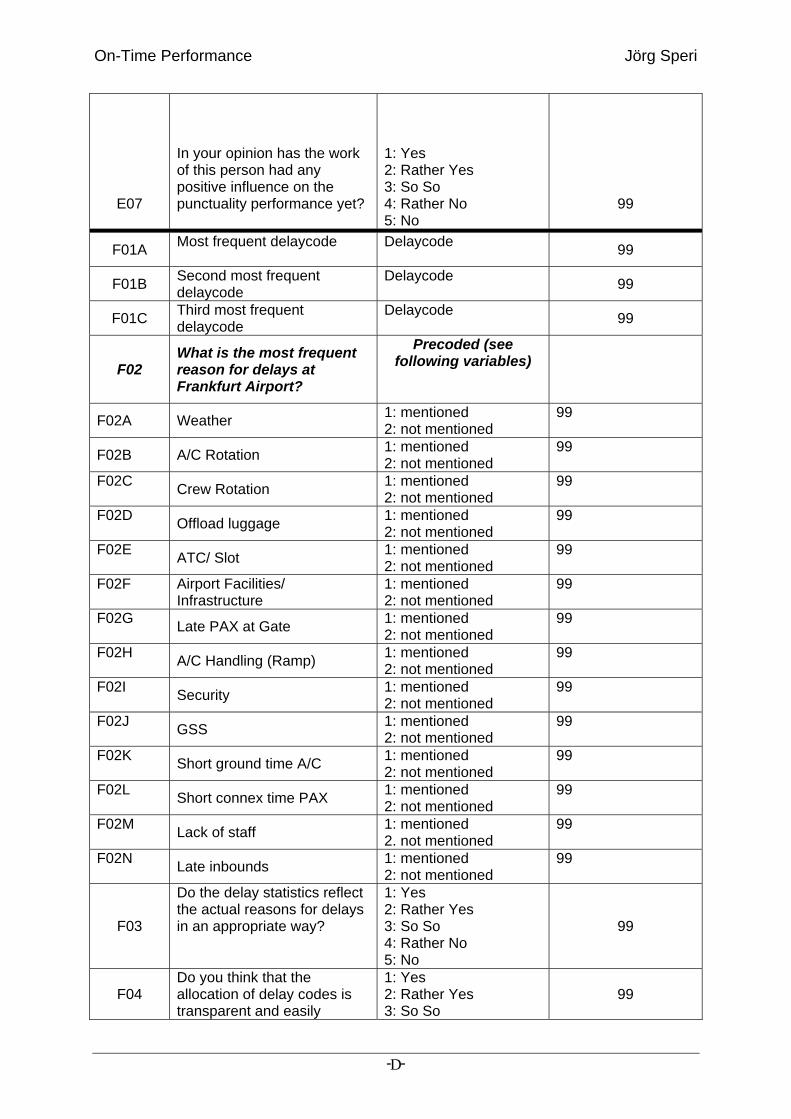
On-Time Performance Jörg Speri
- - D
E07
In your opinion has the work of this person had any positive influence on the punctuality performance yet?
1: Yes 2: Rather Yes 3: So So 4: Rather No 5: No
99
F01A Most frequent delaycode
Delaycode 99
F01B Second most frequent delaycode
Delaycode 99
F01C Third most frequent delaycode
Delaycode 99
F02 What is the most frequent reason for delays at Frankfurt Airport?
Precoded (see following variables)
F02A Weather 1: mentioned 2: not mentioned
99
F02B A/C Rotation 1: mentioned 2: not mentioned
99
F02C Crew Rotation 1: mentioned 2: not mentioned
99
F02D Offload luggage 1: mentioned 2: not mentioned
99
F02E ATC/ Slot 1: mentioned 2: not mentioned
99
F02F Airport Facilities/ Infrastructure
1: mentioned 2: not mentioned
99
F02G Late PAX at Gate 1: mentioned 2: not mentioned
99
F02H A/C Handling (Ramp) 1: mentioned 2: not mentioned
99
F02I Security 1: mentioned 2: not mentioned
99
F02J GSS 1: mentioned 2: not mentioned
99
F02K Short ground time A/C 1: mentioned 2: not mentioned
99
F02L Short connex time PAX 1: mentioned 2: not mentioned
99
F02M Lack of staff 1: mentioned 2. not mentioned
99
F02N Late inbounds 1: mentioned 2: not mentioned
99
F03
Do the delay statistics reflect the actual reasons for delays in an appropriate way?
1: Yes 2: Rather Yes 3: So So 4: Rather No 5: No
99
F04 Do you think that the allocation of delay codes is transparent and easily
1: Yes 2: Rather Yes 3: So So
99

On-Time Performance Jörg Speri
- - E
understandable? 4: Rather No 5: No
F05
If not, where do you see problems?
Precoded (see
following variables)
F05A Communication HCC <-> Shop floor
1: mentioned 2: not mentioned
99
F05B Everybody tries to put the blame onto someone else
1: mentioned 2: not mentioned
99
F05C Glossing over the facts of the delays – true reasons ought
to be covered up
1: mentioned 2: not mentioned
99
F05D
Fraport Loadmaster responsible for delay code
allocation – often not transparent for the shop floor
1: mentioned 2: not mentioned
99
F05E SE/O allocates delay codes often without contacting the
shop floor
1: mentioned 2: not mentioned
99
G01 Place for your comments - Please feel free to write whatever you wanted to say about the outbound punctuality at Frankfurt
Not SPSS based (see separate document)
*The following answers are put under Missing/ Non-plausible Values: • Missing answers • all multiple answers in single answer questions • all answers that point out that a possible misunderstanding of the question is obvious