potential transportation fuel supply and price … transportation fuel supply. and price impacts of...
TRANSCRIPT

Potential Transportation Fuel Supplyand Price Impacts of HF Ban
Proposed Rule 1410Working Group Meeting #6
Toyota Meeting Hall, Torrance, CASeptember 20, 2017
Gordon SchrempEnergy Assessments Division
California Energy [email protected]

Presentation Topics
• Refinery assets – portion of larger portfolio• Capital for refining projects• Investment decision guidance & approved projects• Likelihood of alkylation replacement• Implications for regional supply, fuel prices, competition, and
contingency planning
9/20/2017 2

9/20/2017 3
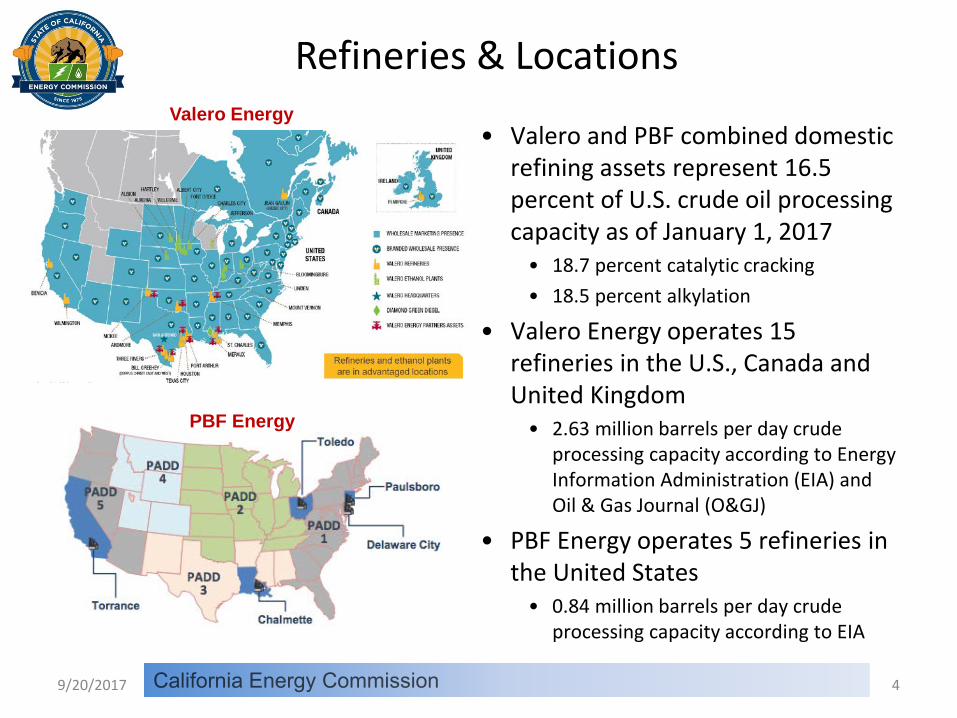
• Valero and PBF combined domestic refining assets represent 16.5 percent of U.S. crude oil processing capacity as of January 1, 2017
• 18.7 percent catalytic cracking• 18.5 percent alkylation
• Valero Energy operates 15 refineries in the U.S., Canada and United Kingdom
• 2.63 million barrels per day crude processing capacity according to Energy Information Administration (EIA) and Oil & Gas Journal (O&GJ)
• PBF Energy operates 5 refineries in the United States
• 0.84 million barrels per day crude processing capacity according to EIA
Refineries & Locations
9/20/2017 4
Valero Energy
PBF Energy

2,629,000
897,350
198,512
843,100
401,000
76,879
0
500,000
1,000,000
1,500,000
2,000,000
2,500,000
3,000,000
Distillation Capacity Catalytic Cracking Alkylation
Proc
essin
g Ca
paci
ty -
Barr
els P
er C
alen
dar D
ay
Valero EnergyPBF Energy
Refining Capacity – Selected Processes
9/20/2017 5
Catalytic cracking and alkylation processing units are primary sources of gasoline blending components.
Sources: EIA and O&GJ.

5.5%
8.4% 8.6%
17.9%
25.5%
35.4%
0%
5%
10%
15%
20%
25%
30%
35%
40%
Distillation Capacity Catalytic Cracking Alkylation
Proc
essin
g Ca
paci
ty -
Perc
enta
ge o
f Com
pany
Re
finin
g Por
tfolio
Valero - WilmingtonPBF - Torrance
Southern California Portion of Portfolio
9/20/2017 6
Southern California refineries represent a minority of the companies’ respective portfolio capacities.
Sources: EIA and O&GJ.
9/20/2017 7

• Majority of capital expenditures for U.S. projects go to upstream activities
• 79.3 percent in 2015, 61.5 percent in 2016 & 76.2 percent for 2017
• Only a small portion usually goes towards refining and marketing projects
• 7.3 percent in 2015, 9.1 percent in 2016 & 8.3 percent for 2017
Capital Expenditures – Petroleum Industry
9/20/2017 8
Source: Oil & Gas Journal.

9/20/2017 9

Capital Approval for Projects
• Refining companies have specific guidance for capital expenditures– Non-discretionary (Maintenance & dividends)– Discretionary (Projects, acquisitions & stock buy-backs)– Limits of total capital expenditures (CAPEX)
9/20/2017 10
Valero Energy
Source: Valero Investor Relations Presentation – September 2017.

Recent Valero Discretionary Projects & IRRs
• Meraux refinery hydrocracker conversion – $260 million, 25 percent unlevered IRR at 2014 prices– Operational December 2014
• McKee refinery diesel recovery improvement and crude unit expansion – $160 million, 45 percent unlevered IRR at 2014 prices– Completed in 2015
• Corpus Christi and Houston refinery light topping expansion projects to handle greater quantities of lighter crude oils – 160 KBD additional processing capacity– $750 million, 50 percent unlevered IRR at 2014 prices– Corpus Christi work completed in 2015
9/20/2017 11

9/20/2017 12

Alkylation Replacement Costs
• If an HF ban were compelled it is unlikely either or both companies would elect to make such changes to their facilities– Alkylation process unit projects are extremely expensive
• A recent project approved for the Valero Houston refinery is estimated to cost $300 million for an alkylation unit with a capacity of 13,000 barrel per calendar day
• Capacity of the alkylation units at Valero Wilmington and PBF Torrance are 22,000 and 24,200 barrels per day capacity, respectively
• These alkylation unit capacities are each nearly twice the capacity, meaning the potential costs for such projects at the two California refineries could, at a minimum, easily approach or exceed $500 million per facility – excludes spent acid regeneration
• Burns & McDonnell estimated $600 million for Torrance facility, additional $300 for spent acid regeneration capacity
– These estimated costs for such a replacement project could be near or exceeding the value of the refinery when one considers that ExxonMobil sold the entire Torrance refinery to PBF Energy for $537.5 million
7/6/2017 13

Capital & Business Logic
• You own a mid-size car with financing payments for another three years– Would a bank loan you money to replace your working transmission that
amounted to a sum greater than the value of your vehicle? – Probably not
• You own a 3 bedroom home with 20 years remaining on your mortgage– Would a mortgage company loan you money to replace your working HVAC
system that amounted to a sum greater than the assessed value of your home? – Probably not
• You own a complex refinery in Southern California– Would a board of directors agree to commit discretionary capital to replace
your working alkylation process unit that amounted to a sum greater than the resale value of your entire refinery and had a negative IRR? – Probably not
9/20/2017 14
Likelihood of Alkylation Replacement
• It goes against sound business principles that the Valero and PBF board of directors would agree to spend an amount of capital on two refinery assets that would be greater than the valuation of the facilities and would incur a negative IRR
• Conclusion – if the HF ban is approved, the two Southern California refineries would likely cease operations some time prior to the effective deadline
• Therefore the particulars regarding the amount of time necessary to obtain all permits, complete engineering, demolish the existing alkylation units, and construct the new process units would be less relevant
9/20/2017 15

9/20/2017 16

Western States More Isolated than Rest of U.S.
9/20/2017 17

California Fuels Market - Isolated
9/20/2017 18
• California’s market is nearly self-sufficient, so supplies of gasoline and diesel fuel from outside of California are not routinely needed to balance out supply with demand– Imports of gasoline and blending components account for only 3 to 6 percent
of supply
• The California market is geographically isolated from other locations in the United States that produce refined products
• Pipelines connect California refining centers to distribution terminals in Nevada and Arizona, but these pipelines only operate in one direction – sending gasoline and other transportation fuels to these neighboring states
• California market is isolated by time and distance from alternative sources of re-supply during unplanned refinery outages

Balance of Other Regions Varies
• U.S. Gulf Coast (PADD 3) large net exporting region• During 2014, region consumed an average of 2.5 million barrels per day
(b/d) of transportation fuels yet produced 7.5 million b/d
• U.S. East Coast (PADD 1) large net importing region• During 2014, region consumed an average of 4.9 million b/d of
transportation fuels but only produced 1.0 million b/d, representing 20 percent of the region’s supply
9/20/2017 19

Gasolines Flows – Southern California
• Net importer via marine• Usually close to balance• Foreign imports when
needed & economic• Domestic imports rare• Imports from N. Calif.
normal portion of their supply – volumes fluctuate based on refinery outages
• Pipeline exports to NV & AZ• 5 times N. Calif. volumes
• Foreign exports minimal• Domestic exports eliminated• Exports to N. Calif. rare –
volumes fluctuate based on refinery outages
9/20/2017 20
Source: California Energy Commission
-8
-7
-6
-5
-4
-3
-2
-1
0
1
2
3
4
5
6
7
8
Jan-07 Jan-08 Jan-09 Jan-10 Jan-11 Jan-12 Jan-13 Jan-14 Jan-15 Jan-16
Mill
ions
of B
arre
ls p
er M
onth
SC FOREIGN IMPORT SC INTERSTATE IMPORTNORTH TO SOUTH TRANSFER SC INTERSTATE EXPORTSC FOREIGN EXPORT SOUTH TO NORTH TRANSFERSC PIPELINE EXPORT
Exports out ofSouthern California
Imports intoSouthern California
Pipeline Exports out of Southern California averagedroughly 2.4 million barrels per month over the entiretime period.

Diesel Flows – Southern California
• Large net exporter• Foreign imports when
needed & economic• Domestic imports rare• Imports from N. Calif.
Related to refinery outages • Pipeline exports to NV & AZ
• 3 times N. Calif. volumes
• Foreign exports declined• Domestic exports eliminated• Exports to N. Calif. rare –
volumes fluctuate based on refinery outages
9/20/2017 21
Source: California Energy Commission
-8
-7
-6
-5
-4
-3
-2
-1
0
1
2
3
4
5
6
7
8
Jan-07 Jan-08 Jan-09 Jan-10 Jan-11 Jan-12 Jan-13 Jan-14 Jan-15 Jan-16
Mill
ions
of B
arre
ls
SC FOREIGN IMPORT SC INTERSTATE IMPORT NORTH TO SOUTH TRANSFER
SC INTERSTATE EXPORT SC FOREIGN EXPORT SOUTH TO NORTH TRANSFER
SC PIPELINE EXPORT
Exports out ofSouthern California
Imports intoSouthern California
Pipeline Exports out of Southern California averagedroughly 1.8 million barrels per month over the entiretime period. Diesel pipeline exports appear to bedecreasing from a rough average of 2 million barrelsin 2007 to 1.5 million in 2016.

Loss of Refining Capacity Impacts Markets –Historical Example
• The Torrance ESP explosion and subsequent inability of ExxonMobil to operate their primary gasoline-producing process equipment for 17 months necessitated a rebalancing of the transportation fuels market for West Coast– Decreased local supply had to be replaced by combination of increased
imports from outside the region and decreased shipments to Nevada and Arizona
9/20/2017 22
Source: Energy Information Administration.

-8
-7
-6
-5
-4
-3
-2
-1
0
1
2
3
4
5
6
7
8
Jan-14 Jul-14 Jan-15 Jul-15 Jan-16 Jul-16
Mill
ions
of B
arre
ls P
er M
onth
SC FOREIGN IMPORT SC INTERSTATE IMPORT NORTH TO SOUTH TRANSFERSC INTERSTATE EXPORT SC FOREIGN EXPORT SOUTH TO NORTH TRANSFERSC PIPELINE EXPORT
Exports out ofSouthern California
Imports intoSouthern California
Torrance Refinery Outage
Gasoline Market – ESP Explosion
9/20/2017 23
• 2015 vs. 2014 Changes March thru December
Marine imports jump Foreign imports increased by
14.1 million barrels or 46.1 KBD
Washington imports increased by 1.4 million barrels or 4.5 KBD
N. Cal. transfers increased by 2.5 million barrels or 8.3 KBD
Pipeline exports decline Arizona exports declined by
1.2 million barrels or 4.1 KBD Las Vegas exports droped by
1.4 million barrels or 4.4 KBD
Source: California Energy Commission

Regional Supply Impacts –Valero & PBF Refinery Closures
Stillwater Associates performed a detailed assessment
9/20/2017 24
Supply impacts of two refineries being closed down expected to be greater in magnitude, of longer duration, and higher in costs to motorists and truckers than those resulting from the temporary loss of gasoline production capability at Torrance refinery following the ESP explosion on 2/18/15

9/20/2017 25

262.8264.8
150.9
177.5
83.5
50
100
150
200
250
300
350
400
45012
/31/
2014
1/14
/201
5
1/28
/201
5
2/11
/201
5
2/25
/201
5
3/11
/201
5
3/25
/201
5
4/8/
2015
4/22
/201
5
5/6/
2015
5/20
/201
5
6/3/
2015
6/17
/201
5
7/1/
2015
7/15
/201
5
7/29
/201
5
8/12
/201
5
8/26
/201
5
9/9/
2015
9/23
/201
5
10/7
/201
5
10/2
1/20
15
11/4
/201
5
11/1
8/20
15
12/2
/201
5
Cent
s Pe
r Gal
lon
California Gasoline Price ChangesRetail, Rack and Refinery Wholesale
California Regular Grade Retail GasolineRefinery Wholesale - CA AverageRack Wholesale - Los AngelesCrude Oil
Source: CEC analysis of AAA and OPIS prices.
Refinery wholesale peaked July 10Rack wholesale peaked July 13Retail peaked July 16
9/20/2017 26

HF Ban – Fuel Price Implications• Permanent loss of process units primarily creating gasoline
blending components (catalytic cracking & alkylation) would be 60.4 percent greater than the temporary loss associated with the Torrance outage– 207.9 KBD versus 129.6 KBD
• Incremental impacts on gasoline costs for consumers and businesses could be as bad or worse than those of experienced for the duration that the Torrance ESP was out of operation– Gasoline prices averaged 26 cents per gallon greater than normal for 17
months– Equates to incremental costs of $5.6 billion for motorists & businesses
• Closure of two refineries would also increase prices for diesel and jet fuel
9/20/2017 27

9/20/2017 28

Crude Oil Processing Capacity - Statewide
• California crude oil processing capacity would be more concentrated by refinery ownership post closure of Valero Wilmington and PBF Torrance
9/20/2017 29
530,100
514,27126,000
259,200
150,900
156,400
230,000
AndeavorChevronKernP66PBFShellValero
530,100
514,271
26,000
259,200
156,400
145,000
Andeavor
Chevron
Kern
P66
Shell
Valero
Current Post Closures
Portion operated by Andeavor, Chevron & P66 would rise from 69.8 to 79.9 percent of total.
Source: EIA. Units in barrels per day.

Crude Oil Processing Capacity – S. Calif.
• Southern California crude oil processing capacity would be more concentrated by refinery ownership post closure of Valero Wilmington and PBF Torrance
9/20/2017 30
Current Post Closures
Portion operated by Andeavor & Chevron would rise from 62.8 to 82.0 percent of total.
Source: EIA. Units in barrels per day.

255,400
229,762
067,600
129,600
84,500
170,700
AndeavorChevronKernP66PBFShellValero
Gasoline-Related Process Capacity - Statewide
• California catalytic cracking & alkylation processing capacity would also be more concentrated by refinery ownership post closure of Valero Wilmington and PBF Torrance
9/20/2017 31
Current Post Closures
Portion operated by Andeavor, Chevron & P66 would rise from 59.0 to 75.8 percent of total.
Source: EIA. Units in barrels per day.
255,400
229,762
0
67,600
84,500
92,400
Andeavor
Chevron
Kern
P66
Shell
Valero

Gasoline-Related Process Capacity – S. Calif.
• Southern California catalytic cracking & alkylation processing capacity would also be more concentrated by refinery ownership post closure of Valero Wilmington and PBF Torrance
9/20/2017 32
Current Post Closures
Portion operated by Andeavor & Chevron would rise from 49.9 to 80.2 percent of total.
Source: EIA. Units in barrels per day.

9/20/2017 33

Refiners – Surge Production Capability
9/20/2017 34

Loss of Excess Refining Capacity• Closure of two Southern California
refineries will decrease statewide refining surge capacity
• Ability of remaining Southern California refineries to ramp up refinery output will be greatly diminished as region transitions to a significant net importer of gasoline and other refined petroleum products– Will decrease ability to send
supplies to Northern California in response to:
• Significant unplanned refinery outages
• Catastrophic earthquake in the greater San Francisco Bay Area
9/20/2017 35
-8-7-6-5-4-3-2-1012345678
Jan-07Jan-08Jan-09Jan-10Jan-11Jan-12Jan-13Jan-14Jan-15Jan-16
Mill
ions
of B
arre
ls p
er M
onth
NORTH TO SOUTH TRANSFER SC INTERSTATE IMPORTSC FOREIGN IMPORT SC PIPELINE EXPORTSOUTH TO NORTH TRANSFER SC FOREIGN EXPORTSC INTERSTATE EXPORT
S. Calif. – Gasoline Flows

Additional Q & A
9/20/2017 36
Del Amo oil field in southern Torrance, circa 1938 – Daily Breeze.
Circa 2014 - LA-Curbed & Google Earth.