power data access viewer · power data access viewer user guide 1. introduction 2. the basics 3....
TRANSCRIPT
POWER Data Access Viewer User Guide
User Guide
https://power.larc.nasa.gov/data-access-viewer
Web Mapping Application, Geospatial Data Outputs,
and Web Processing Service
POWER Data Access Viewer
POWER Data Access Viewer User Guide
1. Introduction 2. The Basics 3. Application Widgets 4. Web Processing Services 5. ArcGIS Image Services
TABLE OF CONTENTS
Introduction
POWER Data Access Viewer User Guide
1 Introduction
The POWER Data Access Viewer (DAV) Web Mapping Application contains
geospatially enabled solar, meteorology, and cloud related parameters
formulated for assessing and designing renewable energy systems.
The POWER DAV is a responsive widget based application which runs on all
devices (PC, laptop, tablet, smartphone) and all platforms (Apple, Android,
and Windows). This design provides users with access to POWER data in the
office or in the field.
POWER datasets and WPS services are extensible and integral beyond the
web mapping application. POWER provides various text, tabular, and
geospatial datasets and files which users can download and/or integrate
into custom software and applications for further processing, analysis, and
visualization.
This guide provides an introduction to the POWER Data Access Viewer Web
Mapping Application and Web Processing Service to make use of the latest
POWER data and enhancements.
POWER Data Access Viewer User Guide
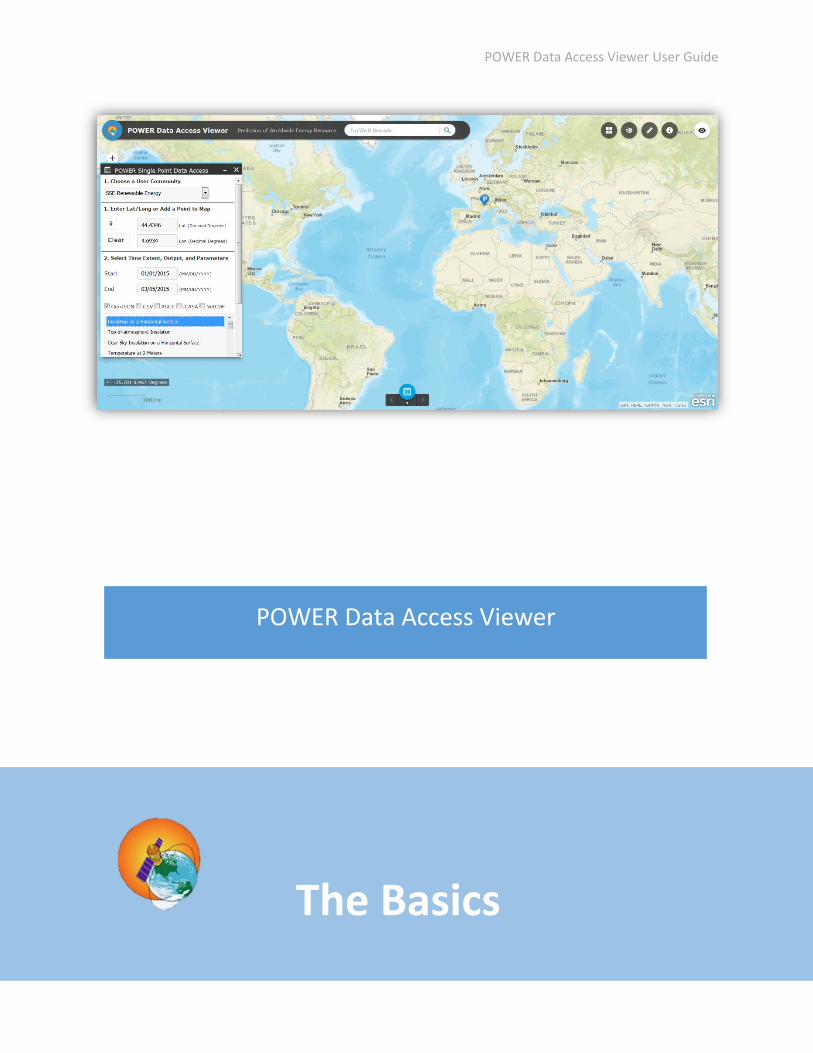
POWER Data Access Viewer
The Basics
POWER Data Access Viewer User Guide
2 The Basics
POWER Data Access Viewer is a web-based application that currently
supports Chrome, Safari, and Firefox. Internet Explorer is not supported.
Please ensure the most current version of the browser is installed on your
device for full compatibility.
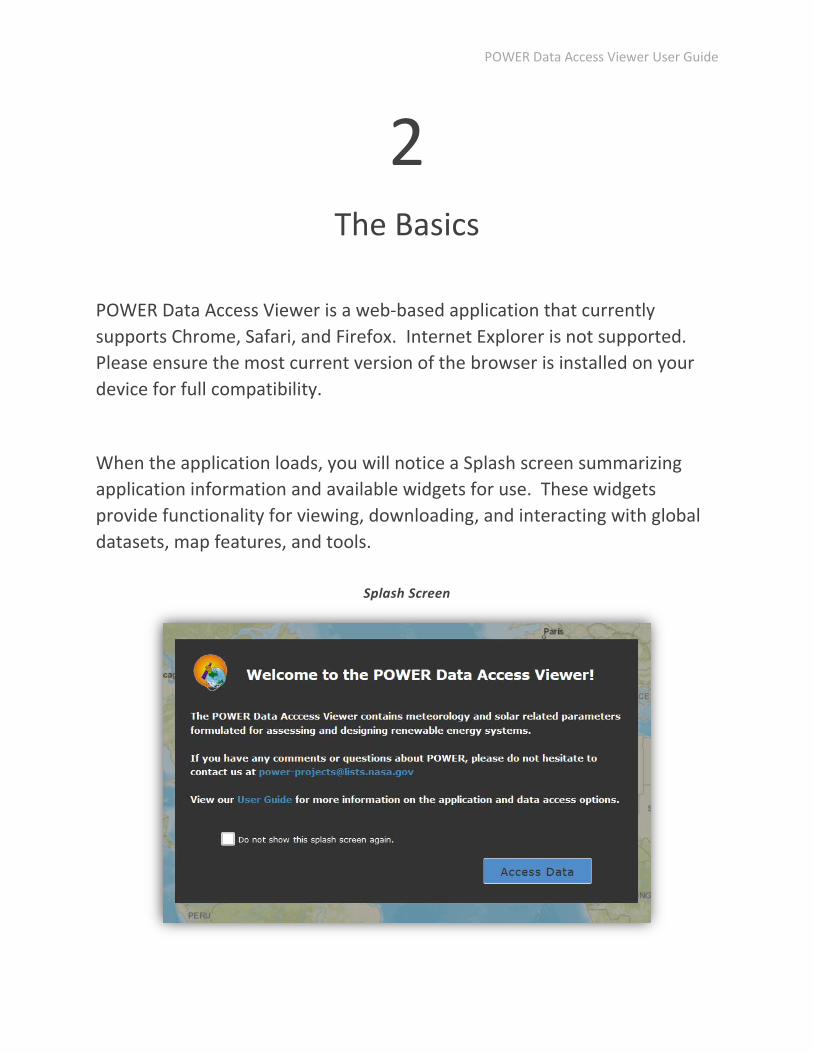
When the application loads, you will notice a Splash screen summarizing
application information and available widgets for use. These widgets
provide functionality for viewing, downloading, and interacting with global
datasets, map features, and tools.
Splash Screen
POWER Data Access Viewer User Guide
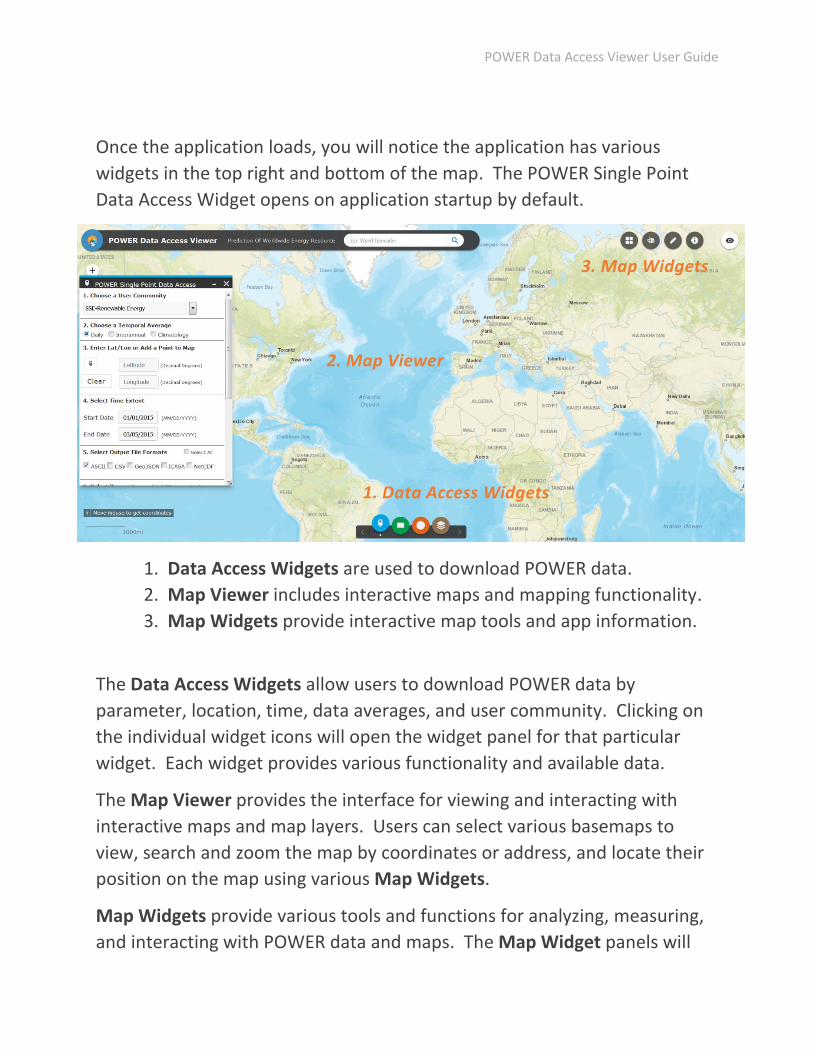
Once the application loads, you will notice the application has various
widgets in the top right and bottom of the map. The POWER Single Point
Data Access Widget opens on application startup by default.
1. Data Access Widgets are used to download POWER data.
2. Map Viewer includes interactive maps and mapping functionality.
3. Map Widgets provide interactive map tools and app information.
The Data Access Widgets allow users to download POWER data by
parameter, location, time, data averages, and user community. Clicking on
the individual widget icons will open the widget panel for that particular
widget. Each widget provides various functionality and available data.
The Map Viewer provides the interface for viewing and interacting with
interactive maps and map layers. Users can select various basemaps to
view, search and zoom the map by coordinates or address, and locate their
position on the map using various Map Widgets.
Map Widgets provide various tools and functions for analyzing, measuring,
and interacting with POWER data and maps. The Map Widget panels will
1. Data Access Widgets
3. Map Widgets
2. Map Viewer
POWER Data Access Viewer User Guide
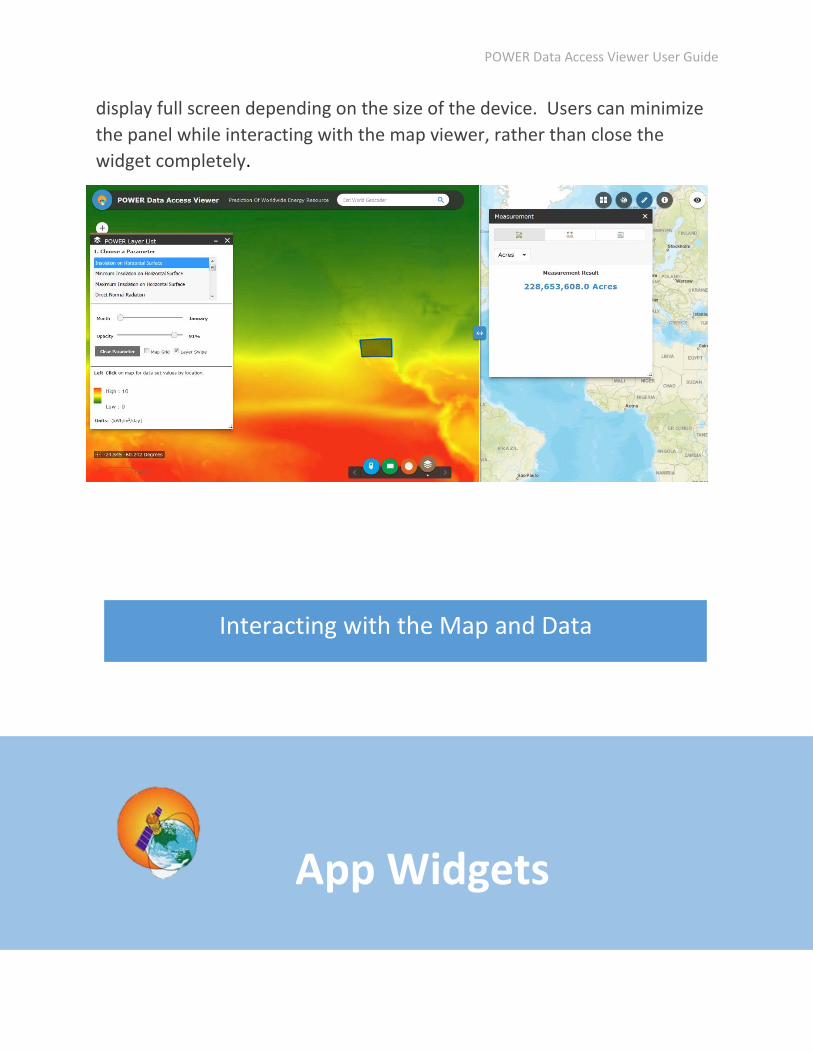
display full screen depending on the size of the device. Users can minimize
the panel while interacting with the map viewer, rather than close the
widget completely.
Interacting with the Map and Data
App Widgets
POWER Data Access Viewer User Guide
3 App Widgets
POWER leverages the ArcGIS API for JavaScript and is built upon the Web
AppBuilder for ArcGIS framework. This integral framework provides the
tools and interface for developing custom applications and widgets for
geospatial data interaction, subsetting, geoprocessing, and analysis.
The following application widgets provide functionality allowing users the
ability to locate, analyze, and interact with geographic data, map features,
and POWER datasets.
Map Widgets:
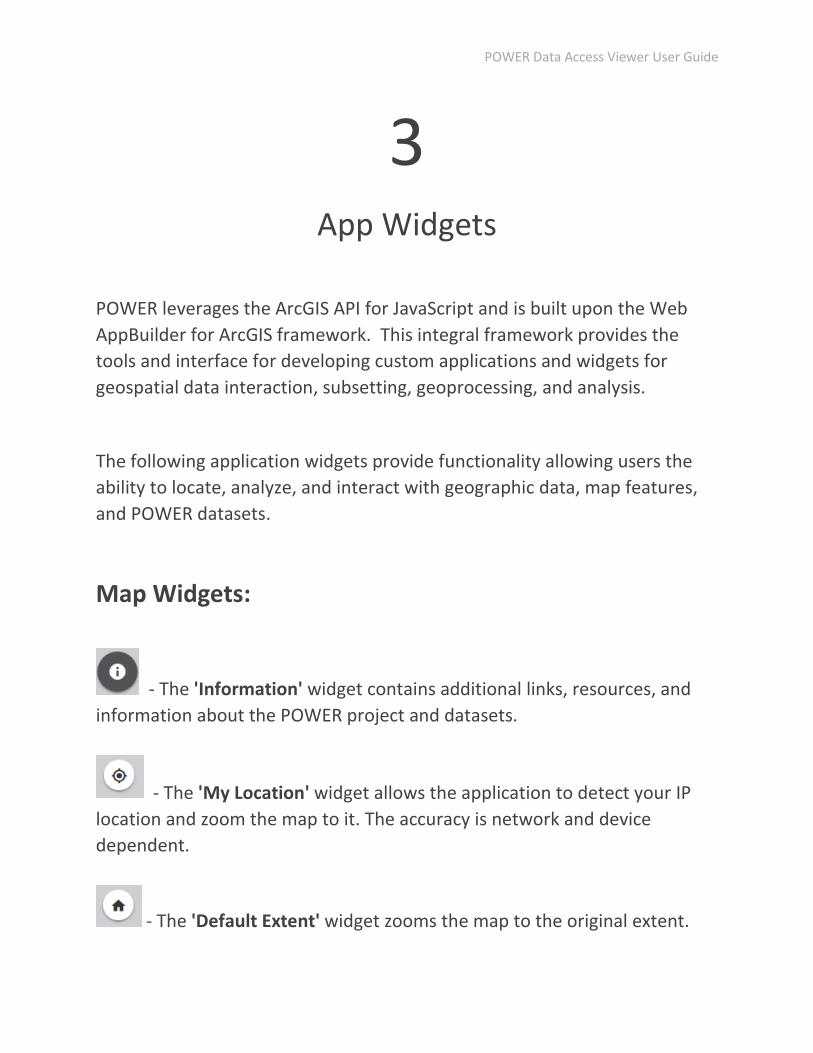
- The 'Information' widget contains additional links, resources, and
information about the POWER project and datasets.
- The 'My Location' widget allows the application to detect your IP
location and zoom the map to it. The accuracy is network and device
dependent.
- The 'Default Extent' widget zooms the map to the original extent.
POWER Data Access Viewer User Guide
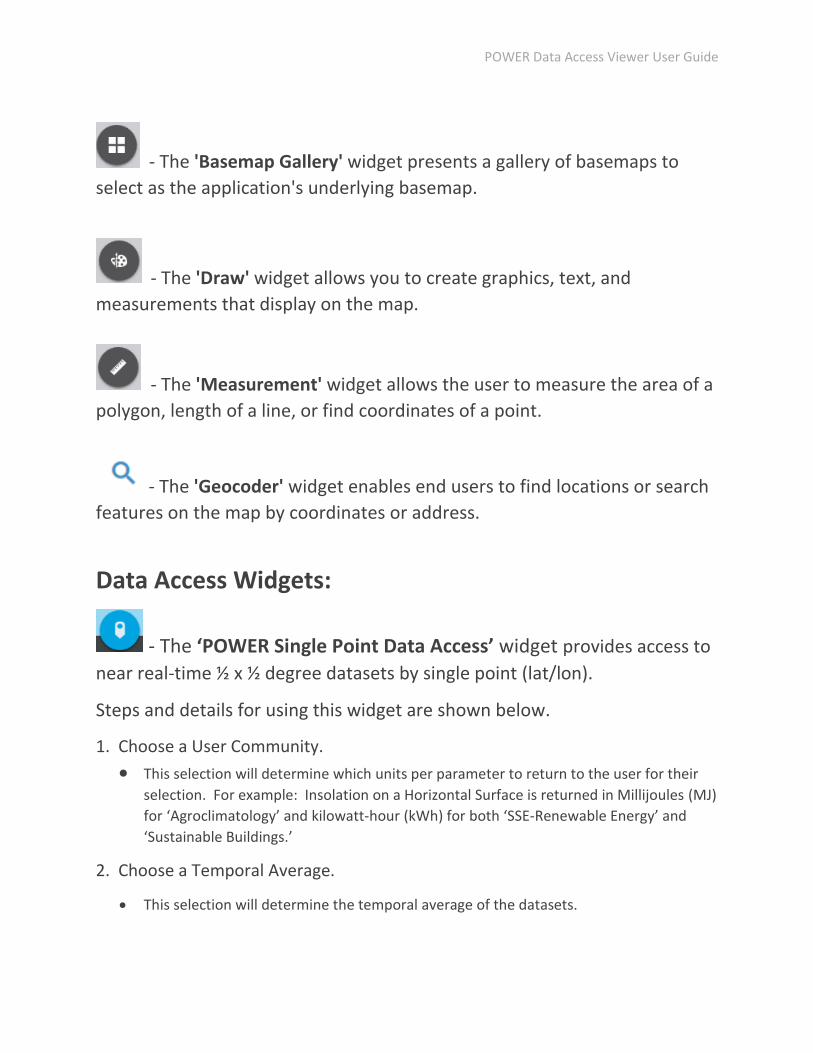
- The 'Basemap Gallery' widget presents a gallery of basemaps to
select as the application's underlying basemap.
- The 'Draw' widget allows you to create graphics, text, and
measurements that display on the map.
- The 'Measurement' widget allows the user to measure the area of a
polygon, length of a line, or find coordinates of a point.
- The 'Geocoder' widget enables end users to find locations or search
features on the map by coordinates or address.
Data Access Widgets:
- The ‘POWER Single Point Data Access’ widget provides access to
near real-time ½ x ½ degree datasets by single point (lat/lon).
Steps and details for using this widget are shown below.
1. Choose a User Community.
• This selection will determine which units per parameter to return to the user for their
selection. For example: Insolation on a Horizontal Surface is returned in Millijoules (MJ)
for ‘Agroclimatology’ and kilowatt-hour (kWh) for both ‘SSE-Renewable Energy’ and
‘Sustainable Buildings.’
2. Choose a Temporal Average.
• This selection will determine the temporal average of the datasets.
POWER Data Access Viewer User Guide
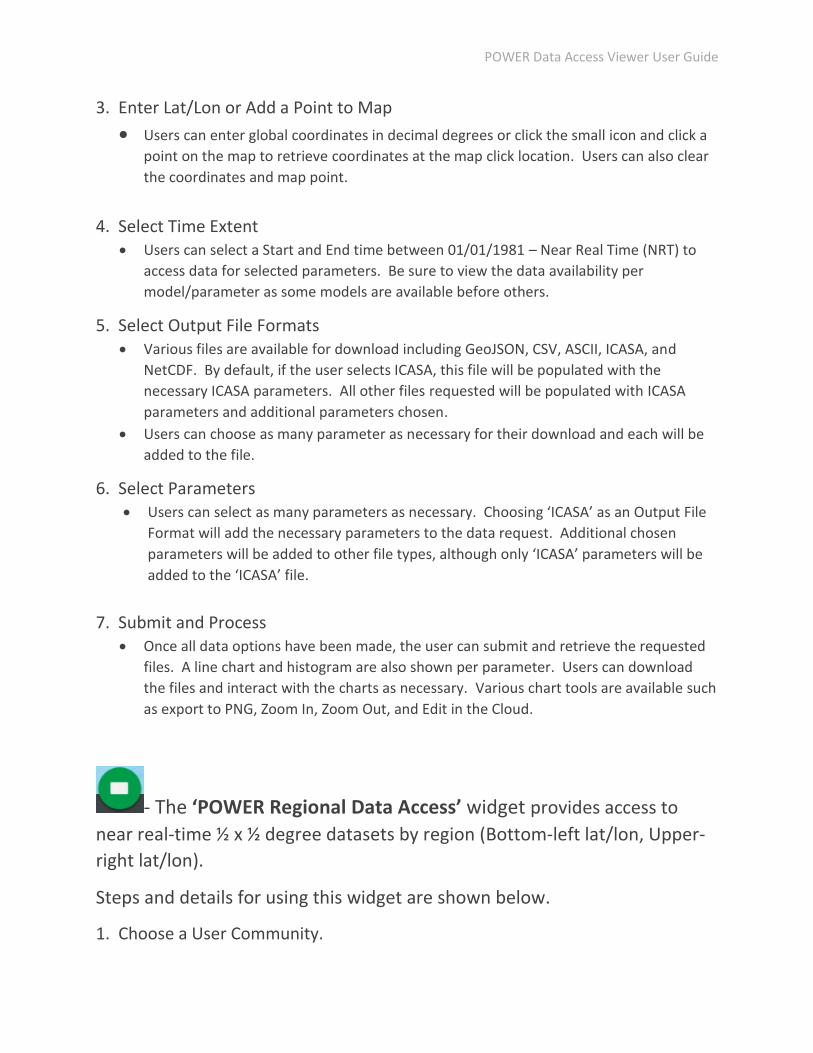
3. Enter Lat/Lon or Add a Point to Map
• Users can enter global coordinates in decimal degrees or click the small icon and click a
point on the map to retrieve coordinates at the map click location. Users can also clear
the coordinates and map point.
4. Select Time Extent • Users can select a Start and End time between 01/01/1981 – Near Real Time (NRT) to
access data for selected parameters. Be sure to view the data availability per
model/parameter as some models are available before others.
5. Select Output File Formats • Various files are available for download including GeoJSON, CSV, ASCII, ICASA, and
NetCDF. By default, if the user selects ICASA, this file will be populated with the
necessary ICASA parameters. All other files requested will be populated with ICASA
parameters and additional parameters chosen.
• Users can choose as many parameter as necessary for their download and each will be
added to the file.
6. Select Parameters • Users can select as many parameters as necessary. Choosing ‘ICASA’ as an Output File
Format will add the necessary parameters to the data request. Additional chosen
parameters will be added to other file types, although only ‘ICASA’ parameters will be
added to the ‘ICASA’ file.
7. Submit and Process • Once all data options have been made, the user can submit and retrieve the requested
files. A line chart and histogram are also shown per parameter. Users can download
the files and interact with the charts as necessary. Various chart tools are available such
as export to PNG, Zoom In, Zoom Out, and Edit in the Cloud.
- The ‘POWER Regional Data Access’ widget provides access to
near real-time ½ x ½ degree datasets by region (Bottom-left lat/lon, Upper-
right lat/lon).
Steps and details for using this widget are shown below.
1. Choose a User Community.

POWER Data Access Viewer User Guide
• This selection will determine which units per parameter to return to the user for their
selection. For example: Insolation on a Horizontal Surface is returned in Millijoules (MJ)
for ‘Agroclimatology’ and kilowatt-hour (kWh) for both ‘SSE-Renewable Energy’ and
‘Sustainable Buildings.’
2. Choose a Temporal Average.
• This selection will determine the temporal average of the datasets.
3. Enter Lat/Lon or Add a Polygon to Map
• Users can enter global coordinates in decimal degrees or click the small icon and Press
down on the map to start and let go to finish in order to retrieve coordinates for the
region. Users can also clear the coordinates and map point. The maximum area
processed is 4.5 x 4.5 degrees (100 points). North and East data will be truncated from
any order over 4.5 x 4.5 degrees.
4. Select Time Extent • Users can select a Start and End time between 01/01/1981 – Near Real Time (NRT) to
access data for selected parameters. Be sure to view the data availability per
model/parameter as some models are available before others.
5. Select Output File Format • Various files are available for download including ASCII, CSV, GeoJSON, ICASA, and
NetCDF. By default, if the user selects ICASA, this file will be populated with the
necessary ICASA parameters. All other files requested will be populated with ICASA
parameters and additional parameters chosen.
• Users can choose only one file format per data request for the regional widget.
6. Select Parameters • Users can select as many parameters as necessary. Choosing ‘ICASA’ as an Output File
Format will add the necessary parameters to the data request.
7. Submit and Process
• Once all data options have been made, the user can submit and retrieve the requested
file. Line charts and histograms are not available in the regional widget.
POWER Data Access Viewer User Guide
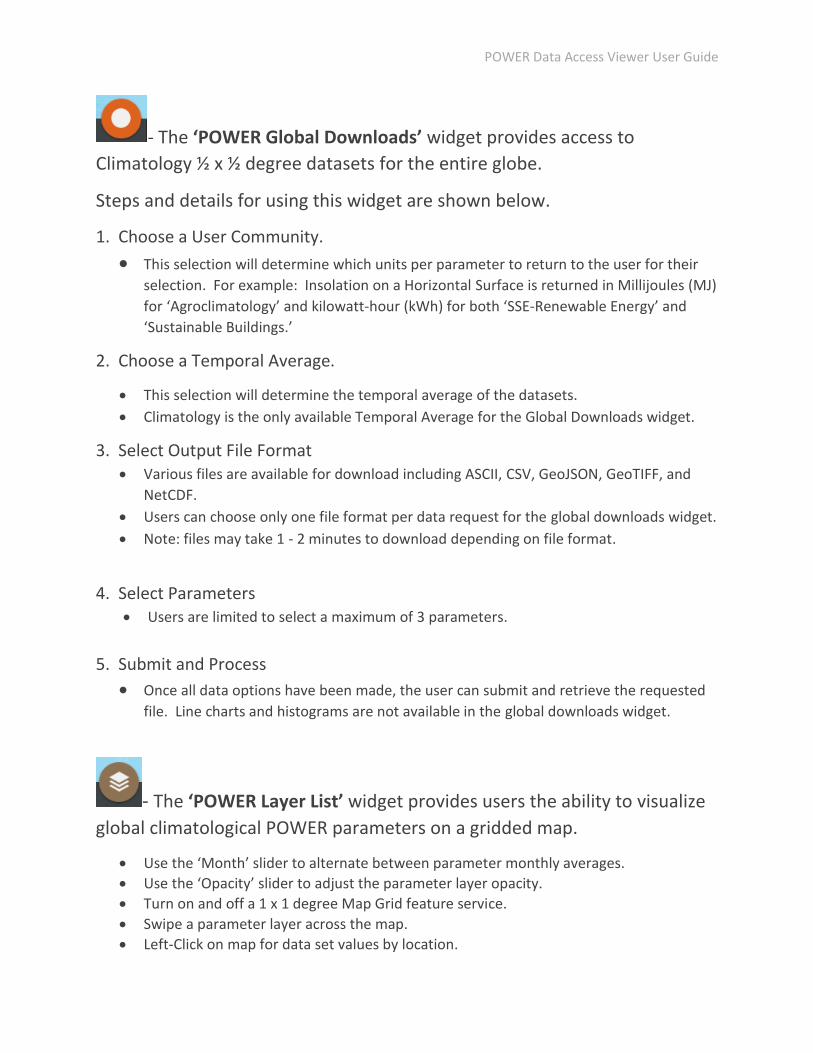
- The ‘POWER Global Downloads’ widget provides access to
Climatology ½ x ½ degree datasets for the entire globe.
Steps and details for using this widget are shown below.
1. Choose a User Community.
• This selection will determine which units per parameter to return to the user for their
selection. For example: Insolation on a Horizontal Surface is returned in Millijoules (MJ)
for ‘Agroclimatology’ and kilowatt-hour (kWh) for both ‘SSE-Renewable Energy’ and
‘Sustainable Buildings.’
2. Choose a Temporal Average.
• This selection will determine the temporal average of the datasets.
• Climatology is the only available Temporal Average for the Global Downloads widget.
3. Select Output File Format • Various files are available for download including ASCII, CSV, GeoJSON, GeoTIFF, and
NetCDF.
• Users can choose only one file format per data request for the global downloads widget.
• Note: files may take 1 - 2 minutes to download depending on file format.
4. Select Parameters • Users are limited to select a maximum of 3 parameters.
5. Submit and Process
• Once all data options have been made, the user can submit and retrieve the requested
file. Line charts and histograms are not available in the global downloads widget.
- The ‘POWER Layer List’ widget provides users the ability to visualize
global climatological POWER parameters on a gridded map.
• Use the ‘Month’ slider to alternate between parameter monthly averages.
• Use the ‘Opacity’ slider to adjust the parameter layer opacity.
• Turn on and off a 1 x 1 degree Map Grid feature service.
• Swipe a parameter layer across the map.
• Left-Click on map for data set values by location.
POWER Data Access Viewer User Guide
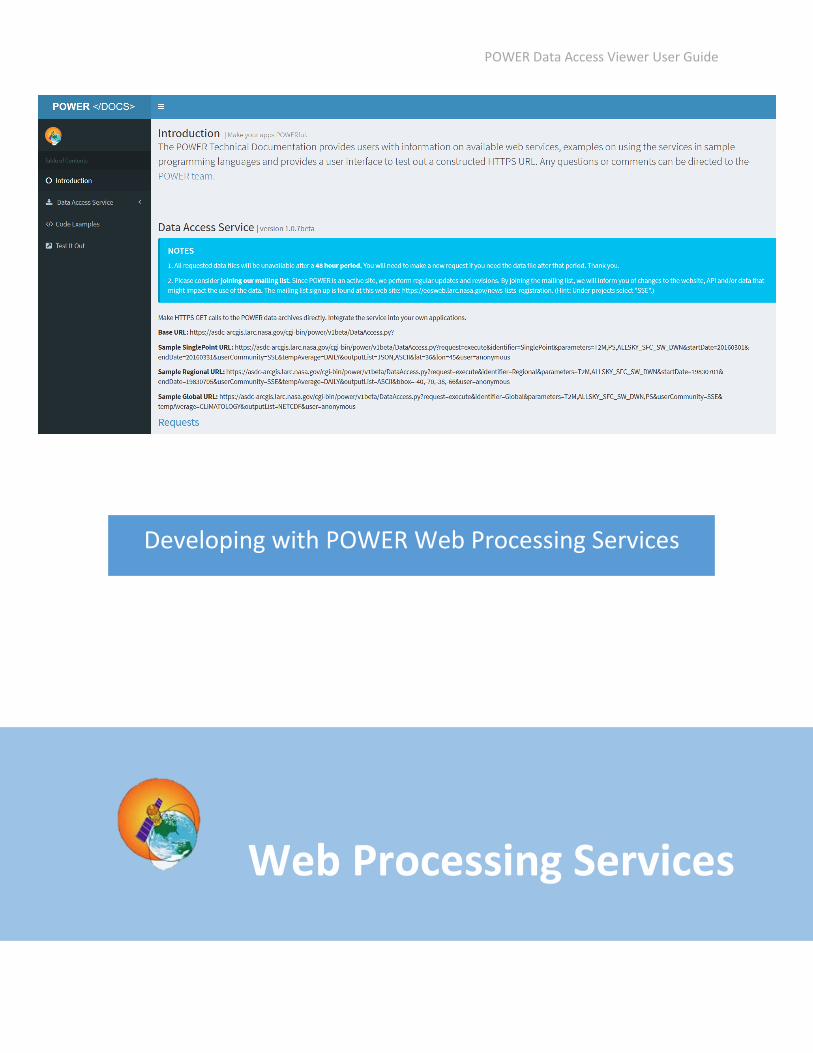
Developing with POWER Web Processing Services
Web Processing Services
POWER Data Access Viewer User Guide
4 Web Processing Services
Access the POWER data holdings through your own custom script or
application by using the POWER Web Processing Services. These RESTful
services provide a JSON return with links for downloading data in multiple
outputs based on required input parameters.
This new capability helps extend the functionality of parameters and
provides near real-time data streams for technical users, saving time from
data manipulation. Organizations can now spend more time focusing on
their research and less time on data management.
These web services can be added to any analytics software and application
programming interface that can accept and retrieve WPS data via a URL.
This gives users the ability to quickly use scripting tools to complete their
research and build useful software with access to POWER data.
To access the data using the Web Processing Service, simply build and
browse to the URL with required input parameters. Integrate these
interactive web services into custom applications via APIs and SDKs. More
technical API documentation for the POWER WPS can be found here.
(https://power.larc.nasa.gov/docs/v1/)
POWER Data Access Viewer User Guide
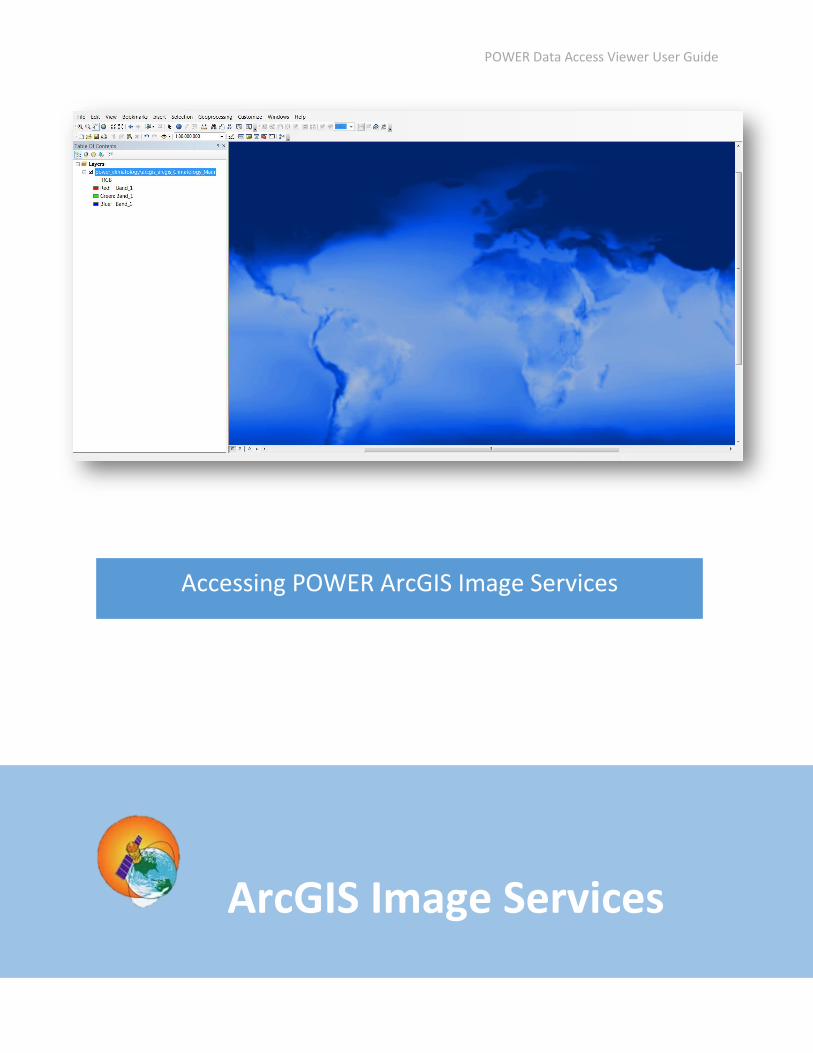
Accessing POWER ArcGIS Image Services
ArcGIS Image Services
POWER Data Access Viewer User Guide
5 ArcGIS Image Services
POWER utilizes ArcGIS for Server to host and provide access to GIS web
services via REST endpoints. These web services allow users to integrate
POWER datasets into custom applications and desktop software for further
data visualization, analysis, processing, and development via a single URL.
This new capability helps extend the functionality of POWER data and
provides GIS-ready capabilities for technical GIS users, saving time from data
consolidation and manipulation. End users can now spend more time
focusing on their research and less time on data management.
POWER web services can be added and viewed in ArcGIS Desktop/Pro,
ArcGIS Earth, ArcGIS Online, ArcGlobe, as well as other proprietary and open
source software for mapping and analysis. This gives users the ability to
quickly use geoprocessing, modeling, and script tools to access data and
complete their research.
Solar Parameter Image Service URL (22 Year Averages – 0.5 x 0.5 degree):
https://asdc-arcgis.larc.nasa.gov/server/rest/services/power/power_601_22years_lst/ImageServer
Meteorological Parameter Image Service URL (30 Year Averages – 1 x 1 degree):
https://asdc-arcgis.larc.nasa.gov/server/rest/services/power/power_801_climatology_1984_2013_lst/ImageServer
*Note the ArcGIS Service Directory is disabled.
POWER Data Access Viewer User Guide
Application Release Notes
• POWER datasets are large and may have slow loading speeds if
internet connection is slow.
• Internet Explorer may not provide full compatibility with the
application, please consider another newer supported browser
including Firefox, Safari, or Chrome.
If you have any comments or questions, please contact our
team at [email protected]