power for all · objectives of the program by taking the necessary steps as envisaged in the pfa...
TRANSCRIPT

Power for All Himachal Pradesh


Foreword
Piyush Goyal
Minister of State Power, Coal and Renewable Energy
Government of India
Electricity consumption is one of
the most important indices for
measuring the development level
of a nation. The Government of
India is committed to improving the
quality of life of its citizens by
ensuring adequacy of electricity
availability. The aim is to provide
each household, industrial and
agricultural consumer access to
electricity, round the clock. The
‘Power for All’ program is a major
step in this direction.
Himachal Pradesh being situated
in the northern Himalayas is
blessed with rich hydro resources
and natural beauty. The state is
one of the popular tourist
destinations in the country. As a
result of developmental policies of
the state government, the state
has witnessed rapid industrial
growth.
This joint initiative of Government of
India and Government of Himachal
Pradesh aims to further enhance the
satisfaction levels of the consumers
and improve the quality of life of
people through 24x7 power supply.
This would lead to rapid economic
development of the state in primary,
secondary & tertiary sectors resulting
in inclusive development of the State.
I compliment The State Government
and wish them all the best for
implementation of this program. The
Government of India will complement
the efforts of Government of
Himachal Pradesh in bringing
uninterrupted quality power to each
household, industry, commercial
business, small & medium enterprise
and establishment, any other public
needs and adequate power to
agriculture consumer as per the state
policy.

Foreword
Virbhadra Singh Chief Minister
Himachal Pradesh
The economic growth of Himachal
Pradesh is linked to the development of
power sector in the State. Continued
growth of power sector and availability
of reliable and affordable power in the
State of Himachal Pradesh has helped
to boost the industrial activity and
economic growth in the State.
The State has made significant
progress in reducing its loss level and
expanding access and availability of
electricity to the households over the
past years and has been able to
achieve near 100% electrification.
However, the State Government wants
to improve the quality and reliability of
supply to all categories of the consumer
in the State.
.
The Government of Himachal Pradesh
is committed to provide electricity
access to the remaining un-electrified
households in the State by FY17. The
State Government shall make
necessary investments in the power
generation, transmission and
distribution infrastructure in order to
provide affordable and quality power to
each consumer in the State
The proposals outlined in this “Power
for All” (PFA) document aim to achieve
this goal. The State Government will
provide all necessary support to the
power utilities in achieving the various
milestones and targets outlined in this
PFA Roadmap.
I would like to thank the Government of
India, Hon’ble Prime Minister and
Hon’ble Union Minister of State for
Power, for supporting Himachal
Pradesh towards implementation of
‘Power for All’ program.

Joint Statement
24X7 Power for All Program for Himachal Pradesh will be
implemented by the Government of Himachal Pradesh with
active support from the Government of India. The Program
aims at providing 24X7 supply to all electricity consumers
and providing electricity access to all unconnected
households in the State.
This PFA Roadmap document highlights all-encompassing
power sector interventions including generation,
transmission, distribution, renewable energy and energy
efficiency/DSM measures proposed to be implemented
during FY16 to FY19.
The Government of Himachal Pradesh shall continue to
support the power sector through targeted capital subsidy
schemes aimed at supporting the poor and marginal
consumers and elimination of regional disparities in the
State.
The State Government is committed to support the utilities
and other development agencies engaged in the power
sector in implementation of the various measures and
targets considered in the PFA Roadmap.
The State Government will put in place appropriate/
suggested State level governance mechanisms for periodic
review.
The Ministry of Power, GoI would supplement the efforts
of State on various issues to be dealt with at the Central
Government level including those listed in this
document. The MoP, GoI shall also endeavor to support
the State in availing concessional financing
arrangements for power utilities in the State.
The State Government shall endeavor to support utilities
in improving/ maintaining their financial sustainability
and credit worthiness.
The Central and State Governments would meet
regularly over the next four years to review and monitor
the progress on the rollout plan and strive to achieve the
objectives of the program by taking the necessary steps
as envisaged in the PFA document

Power for All – Himachal Pradesh
Page | i
Contents
Foreword ............................................................................... iii
Foreword ...............................................................................iv
Joint Statement ..................................................................... v
1. Executive Summary ...................................................... 3
2. Background ................................................................... 6
3. Power Supply Scenario .............................................. 10
4. Generation Plan .......................................................... 16
5. Transmission Plan ...................................................... 27
6. Distribution Plan .......................................................... 33
7. Renewable Energy Plan ............................................. 42
8. Energy Efficiency Plan ................................................ 48
9. Financial Position of Utility (HPSEBL) ........................ 51
10. Annexures ................................................................... 64

Power for All – Himachal Pradesh
Page | ii
List of Figures
Figure 1: District Wise Urban and Rural Divide: No. of HHs (2011 Census) ...................................... 7
Figure 2: Per Capital Himachal Pradesh vs National Average ........................................................... 7
Figure 3: Power Sector in Himachal Pradesh ..................................................................................... 8
Figure 4: Monthly Peak Demand and Supply ................................................................................... 10
Figure 5: Monthly Energy Demand and Supply ................................................................................ 10
Figure 6: Month-wise Energy Requirement and Energy Available to HPSEBL for FY15 ................. 11
Figure 8: Sales Mix of HPSEBL for FY15 ......................................................................................... 12
Figure 7: Consumer Mix of HPSEBL for FY15 .................................................................................. 12
Figure 9: Category-wise Sales (MU) Growth Trend - HPSEBL ........................................................ 12
Figure 10: PFA Projected Energy Sales (MU) .................................................................................. 14
Figure 11: Rural Vs Urban Sales (MU) ............................................................................................. 15
Figure 12: PFA Projected Energy Req. & Demand vs 18th EPS Projections ................................... 15
Figure 13: Energy Available from Central, State, Private and Other Sources .................................. 22
Figure 14: Anticipated Energy Availability (MU) for HPSEBL ........................................................... 23
Figure 15: Anticipated Peak Availability Position of HPSEBL (MW) ................................................. 23
Figure 16: Peak & Off-peak Power Requirement and Availability .................................................... 24
Figure 17: AT&C Loss and T&D loss of HPSEBL during FY11 to FY14 .......................................... 35
Figure 18: Circle-wise Collection Efficiency of HPSEBL for FY15 .................................................... 36
Figure 19: DELP Progress Snapshot of HP's Dashboard(Jan 2016) ............................................... 49
Figure 20: ABR vs ACS for HPSEBL ................................................................................................ 51
Figure 21: HPSEBL Actual and Approved T&D Loss ....................................................................... 52
Figure 22: Financial Performance of HPSEBL .................................................................................. 52
Figure 23: HPSEBL’s Revenue vs PAT in Rs. Cr. ............................................................................ 52
Power for All – Himachal Pradesh
Page | iii
List of Tables
Table 1: Key Highlights of State: Himachal Pradesh .......................................................................... 6
Table 2: Himachal Pradesh Power Sector at a Glance....................................................................... 8
Table 3: Peak Demand vs Supply (MW) and Energy Requirement vs Availability (MU)- HPSEBL . 10
Table 4: Estimated Un-electrified Households (as on 31st march 2015) .......................................... 13
Table 5: Per HH per day consumption (kWh) ................................................................................... 13
Table 6: Energy Requirement & Peak Demand Projections- HPSEBL ............................................ 15
Table 7: Details of HPSEBL's Plants ................................................................................................ 16
Table 8: HEPs allocated to HPSEBL for development ..................................................................... 17
Table 9: Power Availability from IPPs within the State ..................................................................... 17
Table 10: Power projects under construction stage being developed by HPPCL ............................ 17
Table 11: Installed Capacity* (MW) of Power Utilities in the State as on July 2015 (CEA Executive Summary) .......................................................................................................................................... 18
Table 12: Plant wise details of allocated capacity from Central sector (As per CEA power supply position report for November 2015 and HPSEBL) ............................................................................ 18
Table 13: Proposed Capital Expenditure on under construction projects of HPPCL ........................ 20
Table 14: Upcoming HPSEBL and IPP plants .................................................................................. 20
Table 15: Existing and Upcoming Plants of HPSEBL ....................................................................... 20
Table 16: Upcoming Central Generating Stations ............................................................................ 21
Table 17: Details of R&M Schemes .................................................................................................. 22
Table 18: Anticipated Power Availability Position for Himachal Pradesh ......................................... 23
Table 19: Ex-Bus Energy from various sources (MU) for FY16 to FY19 .......................................... 24
Table 20: Action points for Generation Plan ..................................................................................... 26
Table 21: Intra-state Transmission System of HPSEBL as on 31st March 2015 .............................. 27
Table 22: Intra-state Transmission System of HPPTCL as on 31st March 2015 .............................. 27
Table 23: Inter-State Transmission System ...................................................................................... 28
Table 24: Proposed schemes of HPSEBL ........................................................................................ 28
Table 25: Proposed schemes of HPPTCL ........................................................................................ 29
Table 26: Augmentation of Inter-state Transmission Substation ...................................................... 29
Table 27: Year-wise fund requirement for HPSEBL Planned Intra-state Transmission System (Rs. Crs.) ................................................................................................................................................... 30
Table 28: Funding for HPSEBL Proposed Transmission Capital Expenditure ................................. 30
Table 29: Year-wise Fund Requirement for HPPTCL Planned Transmission System (Rs. Cr.) ...... 30
Table 30: Funding of HPPTCL Planned Transmission System ........................................................ 30
Table 31: Total Transmission Capacity of HPSEBL (in MVAs) post implementation of schemes ... 30
Table 32: Total Transmission Capacity of HPPTCL (in MVAs) post implementation of schemes ... 31
Table 33: Action Points & Timelines ................................................................................................. 32
Table 34: Existing Distribution Network of HPSEBL (March 2015) .................................................. 34
Table 35: Circle-wise DTR Failure Rates for FY2014-15.................................................................. 34
Table 36: Circle-wise AT&C Loss for HPSEBL (FY15) ..................................................................... 35

Power for All – Himachal Pradesh
Page | iv
Table 37: DT and Feeder Level Metering of HPSEBL ...................................................................... 35
Table 38: Circle-wise Infrastructure addition program under DDUGJY ............................................ 37
Table 39: Circle-wise Infrastructure addition program under IPDS .................................................. 38
Table 40: Circle-wise Infrastructure addition program under R-APDRP........................................... 38
Table 41: Capital expenditure in Rs. Cr. under various schemes for HPSEBL ................................ 39
Table 42: Fund Requirement in Rs. Cr. under various schemes for HPSEBL ................................. 40
Table 43: Distribution Infrastructure rollout plan for HPSEBL ........................................................... 41
Table 44: Action Points & Timelines ................................................................................................. 41
Table 45: RPO Targets for Himachal Pradesh ................................................................................. 42
Table 46: Proposed Solar Projects to be developed by HPSEBL .................................................... 43
Table 47: Proposed Solar Capacity Addition (FY16-FY19) .............................................................. 44
Table 48: SHPs Capacity Addition (FY16-FY19) .............................................................................. 44
Table 49: Biomass-waste Capacity Addition (FY16-FY19) ............................................................... 44
Table 50: Funding Requirement for RE Projects (FY16-FY19) ........................................................ 44
Table 51: Action points for Renewable Energy Plan ......................................................................... 45
Table 52: Details of SHPs in Himachal Pradesh ............................................................................... 46
Table 53: Proposed Energy Efficiency Projects in State of HP ........................................................ 48
Table 54: Potential DSM Measures for the State of HP.................................................................... 50
Table 55: Key Common Assumptions underlying financial analysis ................................................. 53
Table 56: Impact of Asset addition (Rs Cr.) ...................................................................................... 54
Table 57: Parameters for base case ................................................................................................. 55
Table 58: Impact on tariff due to PFA ............................................................................................... 55
Table 59: Profit and Loss Account (Rs. Cr.) for Base Case.............................................................. 56
Table 60: Parameters for Scenario 1 ................................................................................................ 57
Table 61: Profit and Loss statement - Scenario 1 (Rs Cr.) ............................................................... 58
Table 62: Parameters for Scenario 2 (Non-Availability of grants) ..................................................... 58
Table 63: Impact on tariff due to PFA – Scenario 2 .......................................................................... 59
Table 64: Profit and Loss statement - Scenario 2 (Rs. Cr.) .............................................................. 59
Table 65: Parameters for Scenario 3 (Under-achievement of T&D losses)...................................... 60
Table 66: Scenario 3: Impact on tariff – Scenario 3 .......................................................................... 61
Table 67: Profit and Loss statement - Scenario 3 (Rs. Cr.) .............................................................. 61
Table 68: Parameters for Scenario 4 (UDAY) ................................................................................... 62
Table 69: Scenario 4 (UDAY): Impact on tariff .................................................................................. 62
Table 70: Scenario 4 (UDAY): Profit and Loss Statement (Rs.Cr.) .................................................. 63
Table 71: Key Action points .............................................................................................................. 63

Power for All – Himachal Pradesh
Page | v
List of Abbreviations
Abbreviation Full Form
ARR Aggregate Revenue Requirement
AT&C Aggregate Technical & Commercial
BPL Below Poverty Line
CAGR Compound Annual Growth Rate
CKM Circuit Kilometers
CoD Commercial Operation Date
DDG Decentralized Distributed Generation
DDUGJY Deendayal Upadhyaya Gram Jyoti Yojana
DPR Detailed Project Report
DSM Demand Side Management
DT/ DTR Distribution Transformer
EBIDTA Earnings Before Interest Depreciation Taxes and Amortization
ECBC Energy Conservation Building Code
EE Energy Efficiency
EPC Engineering, Procurement and Construction
EPS Electric Power Survey
ER Eastern Region
FY Financial Year
GoHP Government of Himachal Pradesh
GoI Government of India
GSS Grid Substation
GWp Giga Watt Peak
HH Household
HP Himachal Pradesh
HPERC Himachal Pradesh Electricity Regulatory Commission
HPPCL Himachal Pradesh Power Corporation Ltd.
HPPTCL Himachal Pradesh Power Transmission Corporation Ltd.
HPSEBL Himachal Pradesh State Electricity Board Ltd.
IPDS Integrated Power Development Scheme
IPP Independent Power Producer
ISTS Inter State Transmission System
LED Light-emitting Diode
LILO Loop In Loop Out

Power for All – Himachal Pradesh
Page | 2
Abbreviation Full Form
LT Low Tension
MNRE Ministry of New and Renewable Energy
MoC Ministry of Coal
MoEF Ministry of Environment & Forests, Government of India
MoP Ministry of Power, Government of India
MU Million Unit of Electricity (in kWh)
MVA Mega Volt Ampere
MW Mega Watt
NAD Need Assessment Document
NESCL NTPC Electric Supply Company Limited
NHPC National Hydroelectric Power Corporation
NTPC National Thermal Power Corporation
O&M Operation & Maintenance
PAT Profit After Taxes
PBT Profit Before Taxes
PFA Power For All
PFC Power Finance Corporation
PGCIL Power Grid Corporation Of India Limited
PLF Plant Load Factor
PMA Project Monitoring Agency
PPA Power Purchase Agreement
PPP Public–private Partnership
R&M Renovation & Modernization
RE Renewable Energy
REC Rural Electrification Corporation
RGGVY Rajiv Gandhi Grameen Vidyutikaran Yojana
ROW Right of Way
RPO Renewable Energy Purchase Obligation
SCADA Supervisory Control and Data Acquisition
SHR Station Heat Rate
SLDC State Load Dispatch Center
SPV Special Purpose Vehicle
T&D Transmission & Distribution
TBCB Tariff Based Competitive Bidding
ToR Terms of Reference
TPS Thermal Power Station
UMPP Ultra Mega Power Project
USTDA US Trade & Development Agency
VGF Viability Gap Funding
YoY Year on Year

Power for All – Himachal Pradesh
Page | 3
1. Executive Summary
1.1. Introduction
The Power for All (PFA) program is a joint initiative
of Government of India (GoI) and Government of
Himachal Pradesh (GoHP), aiming to achieve
availability of 24X7 reliable power to all households,
industries, commercial establishments and all other
electricity consuming entities by the end of FY19.
This document sets a roadmap to achieve the
underlying objective of the PFA Program in the
State of Himachal Pradesh.
The State undertook structural reforms in 2010
wherein the erstwhile Himachal Pradesh State
Electricity Board (HPSEB) was unbundled into
Himachal Pradesh Power Transmission
Corporation Ltd. (HPPTCL- Transmission
company) and Himachal Pradesh State Electricity
Board Limited (HPSEBL – Generation and
Distribution company). Additionally, State Load
Despatch Centre was established as an
independent entity in the form of ‘Himachal Pradesh
State Load Despatch Society’ in 2010. A separate
Generating Company ‘Himachal Pradesh Power
Corporation Limited’ (HPPCL) was established by
the State Government for planning, promotion and
development of hydro power projects within the
state.
1.2. Connecting the unconnected
The State of Himachal Pradesh, having achieved
near 100% electrification has a balance of 14,088
Households which are proposed to be electrified by
FY2016-17. These households are spread across
35 villages and HPSEBL plans to electrify all
remaining households by FY17 under the DDUGJY
scheme of Government of India.
The State utility is working towards providing 24X7
quality and reliable power to the consumers and the
addition of several hydro plants have helped in
reducing the peak deficit from 7% in FY11 to NIL in
FY15
In addition to having achieving near 100%
electrification, the State has also been able to
ensure 24X7 supply to all consumers on account of
various hydro power capacities in the State as well
as equity share of HP Government in SJVN and
Rampur projects. With the focus on improvement in
reliability and quality of supply, the energy sales in
the State is expected to increase from 7,867 MU in
FY15 to nearly 9,219 MU in FY19, translating into a
total peak power requirement of 1,622 MW in FY19
for the State.
1.3. Available generation capacity
The state is endowed with rich hydro resources
which has helped in meeting its power requirement
to a large extent. HPSEBL owns 22 operational
hydro power plants with a total installed capacity of
487 MW and one plant of 100 MW is under
construction. Apart from the state owned hydro
capacity, other sources of power include IPPs,
allocation from Central Generating Stations, equity
share of power from projects in the State of HP,
allocation from shared generating stations, etc.
which contribute towards meeting the total
requirement.
The addition of new hydro stations in the recent
years have helped the State in meeting the peak
and energy demand-supply deficit. During FY15,
the peak and energy deficit during was NIL and
0.9% respectively. Due to the large quantum of
hydro stations, HPSEBL enjoys abundant supply of
power during summer months. However, the
availability of power from these stations during the
winter months is substantially reduced resulting in
demand-supply deficit. The utility has been able to
manage the deficit by entering into banking
arrangements and utilization of unallocated quota
of power from central generating stations.
A number of hydro stations of HPSEBL are very old
and under shutdown indicating requirement for
adequate R&M activities. Currently, R&M of Rong-
Tong and Rukti stations are under implementation.
Rehabilitation work of Bhabha power plant and
Scheme of R&M and life extension for Giri power
plant is also in progress. Periodic R&M activities of
the hydro stations including regular de-silting
activities would enable smooth functioning and
adequate availability of power from these stations.

Power for All – Himachal Pradesh
Page | 4
Allocated power from upcoming central generating
stations for HPSEBL is projected to increase by 180
MW as the new plants get commissioned in the
subsequent years up to FY19. Also, HPPCL’s
generating stations with a total capacity of 856 MW
are under construction and expected to come up in
phases during the next 3-4 years. Energy from
these stations and currently not tied-up and the
State is required to take adequate steps to enter
into PPAs for off-take of power from these stations.
There are number of IPPs under various stages of
construction which shall further add 529 MW of
additional capacity available to HPSEBL during
FY16-19. On an annual basis HPSEBL is expected
to have sufficient supply of power from existing and
upcoming generating stations. The State may have
to review the current mix of generation sources to
have uninterrupted availability of power through-out
the year and avoid large demand-supply deficits.
1.4. Transmission plan
The planning and development of intra-state
transmission system in the state is undertaken by
HPSEBL and HPPTCL. While HPSEBL continues
to retain and expand its intra-state transmission
system, HPPTCL’s role is for development and
strengthening of transmission network for
evacuation of the power from existing and
upcoming small hydro power plants in the state.
Presently, HPSEBL operates and maintains a
transmission network of 3,448.85 ckt kms of Extra
High Voltage Transmission lines along with 45 sub-
stations (220/132/66 kV) having total
transformation capacity of 3,831 MVA. In addition
to the HPSEBL transmission system, HPPTCL
network comprise of 15 transmission lines with a
total line length of 239.34 ckt kms.
While the State has sufficient availability of power,
the existing transmission network in the state
requires strengthening and augmentation in order
to meet the increasing demand in the State and
providing reliable power the consumers. The
transmission plan proposed to be implemented by
HPSEBL aims at ensuring adequacy of
transmission infrastructure by addition of 16 new
substations with a capacity of 1,055 MVA and
augmentation of 15 substations by 550 MVA.
Also, HPPTCL has proposed various transmission
works for evacuation of power from the upcoming
hydro stations within the State. This various
schemes shall add 780 ckt kms of line length and
24 substations with a capacity of 3508 MVA by
FY19.
The inter-state transmission system comprise of
about 3,349 ckt kms of transmission line and 4 sub-
stations with a total transformation capacity of 1890
MVA. PGCIL is strengthening the inter-regional and
inter-state transmission systems by focusing on
capacity augmentation of existing substations and
transmission lines in view of the upcoming hydro
generation capacity additions in the northern
region. This augmentation of the inter-state
transmission capacity is being undertaken by
PGCIL as well as under the Tariff Based
Competitive Bidding ‘TBCB’. The ongoing schemes
shall enable augmentation of the inter-state
transmission capacity by 1,680 MVA.
1.5. Distribution plan
State Government owned HPSEBL is the sole
distribution licensee in the State responsible for
development and management of the distribution
network and supply of power in the state. HPSEBL
is already suppling 24X7 power to all the
consumers in the State. However, the existing
distribution infrastructure of HPSEBL is old with
limited additions in the past years. The investment
plan of the HPSEBL is focused towards
augmentation and improvement of distribution
infrastructure in order to cater to the growing
demand as well as provide reliable and quality
power to the consumers in the State.
HPSEBL, has proposed a total investment of Rs.
2047 Cr. from FY16 to FY19. The proposed capital
expenditure shall be funded through a mix of
borrowings from PFC/ REC, equity and grants. The
capital investment includes Central government
sponsored schemes (DDUGJY, R-APDRP and
IPDS) with a total investment of Rs. 664 Cr.
HPSEBL’s AT&C loss for 14.91% for FY2014-15 is
better that many other states in spite of a difficult
hilly terrain where the households are spread far
across. One of the major reasons for achievement
of the loss levels is the favorable HT and LT sales
mix in the state where HT consumption forms
approx. 60% of the total HPSEBL’s sales.
With the proposed investments in distribution
infrastructure and various other initiatives being
undertaken by the licensees, it is expected that
reliable power supply to all the consumers will be
achieved and HPSEBL shall be able to further
reduce its AT&C losses.
1.6. Renewable energy and energy efficiency

Power for All – Himachal Pradesh
Page | 5
State has ensured the development of small hydro
power plants by providing the required impetus in
terms of enabling policy and regulatory framework.
GoHP made allotment of project sites to private
companies for development of hydro projects.
Currently, small hydro projects with a total installed
capacity of 371 MW are operational and an
additional 1078 MW of hydro projects are under
development. An addition of 530 MW is envisaged
to be added during the period FY16-FY19.
Apart from the hydro potential, the National Institute
of Solar Energy has calculated the solar potential of
34,000 MW in the state of HP. HPERC has already
initiated mapping of the solar potential sites and
services of Aryabhat Centre of the Science &
Technology Department and NIT Hamirpur are
being availed for this purpose. Himurja expects to
add 215 MW of solar capacity during the period
FY16 to FY19. HPSEBL has proposed to undertake
10 solar projects with a capacity of 5.7MW. The
projects are currently under investigation stage and
implementation shall be subject to approval of the
Board of HPSEBL.
The State is also implementing a number of energy
efficiency schemes through Directorate of Energy
(DoE) and HPSEBL. DoE is currently implementing
several projects including Demonstration Project –
Street Lighting, LED Village Campaign, Installation
of Solar Water Heaters at Govt. Buildings,
Municipal Demand Side Management, etc.
Also, HPSEBL has signed an agreement with M/s
EESL for the implementation of DELP scheme
which has been launched by the Hon’ble Chief
Minister on 7th August, 2015. Under the scheme,
HPSEBL has planned to distribute approx. 1.25 Cr.
LED bulbs by end of March 2016 of which 40.27 lac
bulbs have already been distributed until Jan 12,
2016.
Another energy efficiency scheme, ‘Rajiv Gandhi
Illuminating Scheme For Hill Town Advancement
(RISHTA) project’ was launched by GoHP for
replacement of 63,484 street light fixtures in all the
ULB’s to achieve 45-55% energy savings. First
phase of the scheme shall cover Shimla,
Dharamshala, Sundernagar, Paonta Sahib,
Ghumarwin and Manali.
Also in addition to DELP and Street Lighting
projects, HPSEBL is undertaking preparation of a
DSM master plan for 5 years. HPSEBL has signed
a MoU with the Bureau of Energy Efficiency (BEE),
for the capacity building and preparation of DSM
Action Plan. A few potential measures have been
identified for implementation as part of the study.
However, the detailed DSM Action Plan is yet to be
framed and finalized.
1.7. Financial turnaround
HPSEBL has been rated B+ (Moderately
Operational and Financial Performance Capability)
as per the Third Annual Integrated Ratings of State
Power Distribution Utilities report 2015 released by
MoP. The rating is based on low AT&C loss levels,
collection efficiency, progress on reform activities,
adoption of MYT framework, 100% consumer
metering, etc. However, concern with respect to low
cost coverage ratio, non-receipt of subsidy, high
employee cost have resulted in lower rating than
previous year.
HPSEBL’s accumulated losses has been
increasing from Rs.886 Crores in FY11 to Rs. 2,000
Crores in FY15. However, the annual financial
losses have reduced over the past five years from
Rs. 380 Cr. in FY11 to Rs. 125 Cr. in FY15. Going
forward, expansion in consumer base, increased
energy requirement and proposed infrastructure
investments under the PFA program are expected
to translate into a tariff implication of Rs.0.21/kWh
in FY16, Rs.0.74/ kWh in FY17, Rs.1.03/ kWh in
FY18 and Rs. 1.28/kWh in FY19. This considers
achievement of AT&C loss trajectory and full
availability of grants as per HPSEBL’s plan.
Despite the proposed reduction in AT&C losses
from 14.51%% in FY15 to 10.00% in FY19, the
annual financial losses of HPSEBL are projected to
increase to Rs.1,066 Cr. in FY19 in the absence of
tariff increase and power purchase rationalization
initiatives. It is estimated that over and above the
pass-through of actual increase in power purchase
costs, an additional tariff increase of nearly 6.5%
YoY is required for turnaround of HPSEBL by FY19.
On the basis of above considerations, a plan to
achieve ‘24x7 Power for All’ along with a proposed
rollout plan has been formulated and detailed in this
document.

Power for All – Himachal Pradesh
Page | 6
2. Background
2.1. The State of Himachal Pradesh
Himachal Pradesh is a state in Northern India
bordered by Jammu and Kashmir on the north,
Punjab on the west, Haryana on the south-west,
Uttarakhand on the south-east and by Tibet
Autonomous Region on the east. Since its
formation in 1971, the state has been successful in
making enormous strides towards attaining holistic
development- social and economic. It has
outperformed other states in reducing the poverty
level in the state and becoming the second highest
per-capita income state in the country. The key
highlights of the State are presented in Table 1.
The Economic Survey of Himachal Pradesh, 2014-
15 estimates the Gross State Domestic Product
(GSDP) at current prices in 2013-14 to be
Rs.85,841 Cr. as against the 2012-13 GSDP of
Rs.76,259 Cr. The per capita income at current
prices stands at Rs. 95,852 in the year 2013-14.
Rural poverty has dropped from 36.8% in 1993-
1994 to 8.5 in 2011. The state has the record of
highest educational attainment as well as the
highest number of women workforce in the nation.
Himachal has emerged as a leading economy in the
sub-continent and also a model for other hill-states.
The State has been able to achieve substantial
progress in sectors like power, industries,
horticulture, agriculture etc. The economy has
witnessed a shift where agriculture is losing its
share of contribution to the economy to the growing
industrial sector. But, it can be observed that the
performance of the agricultural sector has
widespread impact on the State’s economy. It is a
major contributor to the State’s GDP owing to its
overall impact on other sectors via input linkages,
employment and trade etc. Besides industries and
agriculture, tourism forms the major contributor to
the economy of the state.
Blessed naturally with the Himalayan Mountains,
the state has immense potential for tourism and
power generation. The state has been able to tap
these resources efficiently and effectively for the
development of its economy and people.
The primary sector which comprises of Agriculture,
Forestry, Mining & Quarrying contributed to 19.28
percent of the GSDP of 2013-14. Concurrently, the
other sectorial contributions were as follows-
Secondary sector (37.87%), Community and
Personal services (19.21%), Transport,
Communications and Trade (15.29%) and Finance
and Real Estate (8.35%)
Over the last decade the State has witnessed a
burgeoning economy, with the growth rate pegged
at 5.7%, which is at par with the national level. The
per-capita NSDP of the state has also been
substantially higher than the national average as
can be observed from Figure 2.
Table 1: Key Highlights of State: Himachal Pradesh
Parameter Information
Year of Creation Established on 25th January, 1971
Population &
Demographics
Total Population at 68,64,602 as per 2011 census
79.96% Rural, 20.13% Urban
12.95% Decadal population growth
Area 55,673 square kilometers (1.69% of country)
Forest cover – 11059.97 sq kms (0.33% of country)
Total cropped area – 9405.97 sq kms (0.28%of country)
Rivers Sutlej , Beas , Ravi , Chenab and Yamuna
Administrative Set-up 12 Districts
52 sub-divisions

Power for All – Himachal Pradesh
Page | 7
Parameter Information
20,118 Villages (100 % Electrified)
Natural Resources Vast Forest Resources with diverse range of Flora & Fauna
Other Resources: limestone, gypsum, iron, copper, uranium, rock salt,
manganese, lead, silver etc.
Neighboring States North: Jammu & Kashmir
West: Punjab
South: Haryana & Uttarakhand
HHs Rural 13.4 lacs (~99% Electrified)
Urban 5.2 lacs (100% Electrified)
As per the 2011 census, majority of the population
i.e. 89% stays in the rural areas. The district-wise
share of rural and urban population in Himachal
Pradesh is highlighted in Figure 1 .
2.2. Himachal Pradesh power sector at a glance
Power sector in Himachal Pradesh is characterized
by recent restructuring of the state electricity board,
which unbundled its transmission function and
retained the generation and distribution functions
under the same roof. The Government of Himachal
Pradesh signed a Memorandum of Understanding
with the Ministry of Power to undertake reforms in
the power sector.
The reform process in Himachal Pradesh
commenced in 2008 with the decision to unbundle
the erstwhile Himachal Pradesh State Electricity
Board and institute a separate transmission
0
10,000
20,000
30,000
40,000
50,000
60,000
70,000
80,000
90,000
100,000
FY05 FY06 FY07 FY08 FY09 FY10 FY11 FY12 FY13 FY14
Himachal Pradesh India
Figure 2: Per Capital Himachal Pradesh vs National Average
050000
100000150000200000250000300000350000400000
Urban Rural
Figure 1: District Wise Urban and Rural Divide: No. of HHs (2011 Census)

Power for All – Himachal Pradesh
Page | 8
company. The reforms resulted in the following
entities
Himachal Pradesh State Electricity Board
Limited: Integrated utility with generation,
distribution and trading function in the
State.
Himachal Pradesh Power Transmission
Corporation Limited: to manage and
operate the transmission system within
the state
In addition to the new companies formed as a result
of unbundling of HPSEB, the Government had also
established a company in the name Himachal
Pradesh Power Corporation Limited (HPPCL) in
2006 for planning, promoting and organizing the
development of all hydroelectric power projects on
behalf of Government of Himachal Pradesh (GoHP)
and Himachal Pradesh State Electricity Board
(HPSEB) in the state.
The Himachal Pradesh Electricity Regulatory
Commission (HPERC) was constituted in
December 2000 under the Electricity Regulatory
Commission Act, 1998 and started functioning with
effect from 6th January, 2001. The Commission
comprise of a single member i.e. Chairman. The
key highlights of the power sector in the State are
presented in Table 2.
Table 2: Himachal Pradesh Power Sector at a Glance
Aspect Key Highlights
Per Capita
Consumption
Per capita consumption (At generation bus bar including all losses) in kWh for last five years is
provided in the table below:
Particulars FY11 FY12 FY13 FY14 FY15
Per capita Consumption (kWh) 1251 1289 1380 1348 1336
Demand Supply
Position
The state has a stable power supply-demand scenario with deficits almost negligible. The FY15
demand supply situation is highlighted in the table below: (CEA Figures):
Item Peak (in MW) Energy (in MUs)
Demand/Requirement 1,422 8,807
Availability 1,422 8,728
Surplus/(Deficit) 0% (0.9)%
Generation Himachal Pradesh State Electricity Board Ltd. is a vertically integrated utility owning and
operating 22 hydro generating stations with a combined capacity of 487.45 MW
HPSEB
HPSEB
HPPTCL
Generation(existing and new stations)
Distribution(EHV, HV and LV)
HPPCL
Transmission(for evacuation of power from
hydro projects located in HP)
Generation(planning and development of
new stations)
Figure 3: Power Sector in Himachal Pradesh

Power for All – Himachal Pradesh
Page | 9
Aspect Key Highlights
Further, Himachal Pradesh Power Corporation Ltd. is developing 6 hydro projects in the State
which are in various stages of construction.
Mode Thermal Nuclear Hydro RE Total (MW)
State 0 0 394 257 650
Private 0 0 1,748 498 2,246
Central 214 34 1,280 0 1,528
Total 214 34 3,422 755 4,424
Transmission
Himachal Pradesh Power Transmission Co Ltd. is the state transmission utility, responsible for
planning and development of transmission network in the state. Himachal Pradesh State
Electricity Board Ltd. also owns and operates EHV and HV lines and substations in the state.
Mode Voltage level Line Length
(ckt kms)
Transformation
Capacity
(MVAs)
Intra-state
(HPSEBL)
200 KV 536 1,723
132 KV 2,321 1,417
66 KV 592 690
Intra-state
(HPPTCL) 220 kV 131.24
-
132 kV 41.75 -
66 kV 66.35 -
Inter-state 400 kV 2,221 1,890
220/132 kV 1,128 -
Distribution
Himachal Pradesh State Electricity Board Ltd. is the only distribution utility in the state. It caters
to the power demand of approximately 2.2 million customers
Parameters Unit HPSEBL
33kV Feeders ckm 3,107
22kV & 15kV Feeders ckm 7,209
11kV Feeders (including 2.2kV) ckm 21,625
LT Feeders Ckm 60,700
33/11 kV substations No. 159
33/11 kV substations Capacity MVA 1,102
11/0.4kV LT Distribution Transformer No. 27,013
11/0.4kV LT Distribution Transformer MVA 2,323
Financial Position
The financial position of the utility has been improving over the last three years. Even though
the utility is booking losses each year during FY12, FY13 and FY14, the magnitude of losses
has been decreasing over the period.
The utility on account of its lower power purchase cost and approved tariff revisions has been
able to reduce the gap between ABR and ACS and generate adequate revenues to meet its
expenses for operations.

Power for All – Himachal Pradesh
Page | 10
3. Power Supply Scenario
3.1. Power Supply Position
Over the last five years, the demand supply position
in the state has improved considerably. The State
has benefitted by the significant capacity additions
of hydro power plants and increase in allocations
from central generating stations, the state has been
able to meet its peak demand in FY15 and the
deficit was 0% as compared with the national
average of 4.7%. As can be seen in the Table 3, the
power supply in state has increased at a CAGR of
4% leading to steep decline in the peak deficit. In
terms of energy requirement and available, the
State has witnessed improvement over the last 5
years and the annual energy shortfall has
decreased from 3% in FY11 to 1% in FY15, as
presented in Table 3
While the annual peak and energy deficit in the
State is negligible owing to the large capacity of
hydro generating stations, there are large variations
in monthly peak and energy shortage as can be
observed in the Figure 6. This is primarily due to the
State’s dependence on hydro power which is
abundant during the summer season while the
supply is severally affected during winter season.
The State has to therefore rely on banking
arrangements and unallocated quota of power from
central generating stations for meeting its demand
during winter months. The seasonal trend of peak
and energy shortages for the period of April, 14 to
March, 15 can be seen in Figure 4 and Figure 5
below.
Figure 4: Monthly Peak Demand and Supply
Figure 5: Monthly Energy Demand and Supply
Particulars FY11 FY12 FY13 FY14 FY15
Peak demand and supply (MW)
Peak Demand (MW) 1,278 1,397 2,116 1,561 1,422
Peak Available (MW) 1,187 1,298 1,672 1,392 1,422
Peak Shortage (%) 7% 7% 21% 11% 0%
Energy requirement and availability (MU)
Energy Requirements (MUs) 7,626 8,161 8,992 9,089 8,807
Energy available (MUs) 7,364 8,107 8,744 8,883 8,728
Energy Shortage (%) 3% 1% 3% 2% 1%
0%
0%
0%
1%
1%
1%
1%
1%
2%
2%
1100
1150
1200
1250
1300
1350
1400
1450
1-J
an
1-F
eb
1-M
ar
1-A
pr
1-M
ay
1-J
un
1-J
ul
1-A
ug
1-S
ep
1-O
ct
1-N
ov
1-D
ec
Peak Demand (MW)
Peak Avaiability (MW)
0%
1%
1%
2%
2%
3%
3%
620
640
660
680
700
720
740
760
780
800
1-J
an
1-F
eb
1-M
ar
1-A
pr
1-M
ay
1-J
un
1-J
ul
1-A
ug
1-S
ep
1-O
ct
1-N
ov
1-D
ec
Energy Requirement (MU)
Energy Availability(MU)
Table 3: Peak Demand vs Supply (MW) and Energy Requirement vs Availability (MU)- HPSEBL

Power for All – Himachal Pradesh
Page | 11
As already discussed, the prime factor for large
seasonal variation is on account of high
dependence of hydro power in the generation mix,
which not only includes the HPSEBL generation
capacity of 487 MW but also allocation of hydro
power from various central generating stations and
IPPs. Hydro power comprise approx. 80% of the
total power supply in the State. Figure 6 below
reflects the demand-supply surplus during the
summer months and demand-supply deficit during
the winter months excluding the banking and short-
term power purchase undertaken by HPSEBL
during FY14-15. The surpluses during the months
of July - August are to the tune of 550 MUs
indicating supply of more than 75% of the total
requirement during these months while the deficit
during Dec-Feb is to the tune of 45% of the
requirement.
It is important to note that despite the seasonal
demand supply mismatch, HPSEBL was able to
provide 24 hours supply to all categories of
consumers, both urban and rural areas, during
FY15 in the state. This is primarily on account of the
power purchase planning and banking
arrangements being undertaken by HPSEBL due to
which the energy as well as peak deficit have
broadly remained within 1%.
As per the information of HPSEBL, it is observed
that the state has connected almost all the
households excluding 14,088 HHs spread across
35 villages. HPSEBL has plans to electrify these
households by FY2016-17 under the DDUGJY
scheme of Government of India. Therefore, one of
the major milestone under the PFA program of
providing connection to all households in the State
shall be achieved once these 14,088 HHs are
electrified. Further, as per the CEA data there are
no peak shortages while the energy shortage is a
negligible 0.9%. This is reflective of the State
utility’s performance of providing adequate energy
to the households and achievement of one of the
key objective of PFA program, i.e. to provide 24X7
electricity to all consumers.
Therefore, the objective of state is to provide
uninterrupted reliable power to the consumers at
affordable cost for which it intends to overhaul its
transmission, sub-transmission and distribution
infrastructure.
3.2. Consumer and sales mix
The State’s sole distribution licensee i.e. HPSEBL
had a consumer base of over 2.2 million at the end
of FY15. The sales and consumer mix of HPSEBL
for FY15 is provided in Figure 8 & Figure 7 below.
The domestic consumers constitute around 85% of
the total consumer base while their share in the
overall sales stand at approx. 24% for FY15. While
Industrial consumers, being 2% of total consumer
base, contributed the largest share i.e. 60% of the
total sales of HPSEBL. In 2003, excise and income-
tax holiday provided under the industrial policy led
to development of several industrial belts in the
State. These industrial consumers contribute
significantly to the overall power off-take and
economic development in the State.
Apr May Jun Jul Aug Sep Oct Nov Dec Jan Feb Mar
Energy Reqd. for Sales 671 736 742 734 765 785 757 726 731 745 749 781
Net Energy Available 707 1028 1207 1294 1342 1143 644 441 410 384 411 621
Surplus/ (Deficit) 35 292 465 559 577 358 (113) (285) (321) (361) (338) (160)
(600)
(400)
(200)
-
200
400
600
800
1,000
1,200
1,400
1,600Figure 6: Month-wise Energy Requirement and Energy Available to HPSEBL for FY15

Power for All – Himachal Pradesh
Page | 12
Figure 8: Sales Mix of HPSEBL for FY15
The consumption of domestic as well as
commercial consumers have grown at CAGR of
11.2% and 9.1%, respectively in the last five years.
With respect to industrial consumption, the increase
during the period FY08 to FY11 was significant.
However, in the recent years the growth in sales to
industrial consumers has remained in the range of
2-3% due to completion of tax holiday period in
2013 and shift of large industrial consumer for
procurement under open access. The growth in
sales to various categories of consumers is
illustrated in the Figure 9 below.
The share of industrial consumption in the overall
sales mix is one of the important aspects for
HPSEBL to be able to maintain its T&D losses in
the range of 15% in spite of having a hilly terrain in
the State.
Figure 9: Category-wise Sales (MU) Growth Trend -
HPSEBL
3.3. Methodology for Demand Projections
In line with the objective of PFA program, to provide
24X7 power to all HHs, the demand projection has
been done separately for electrified and un-
electrified rural and urban HHs. For rest of the
consumer categories a growth rate based on
HPSEBL’s estimation of the expected growth along
with a review/ validation with the past trend has
been considered. The following steps detail out the
approach adopted for estimation of energy
requirement for the State.
Estimation of rural and urban electrified and un-
electrified HHs
Based on the available census data for 2011,
extrapolated with past 10 years CAGR Estimation
of number of rural and urban HHs are done.
In addition to the level of electrification in rural areas
as per 2011 census data, the actual rural HHs
electrified since 2011 has been considered to arrive
at the present level of electrification. In case of
urban areas, the same level of access as in 2011
census (in percentage terms) has been assumed
on the estimated HH numbers to arrive at the
number of existing un-electrified HHs. Also actual
data of electrification is considered into the
calculation. It is noteworthy that the state has
already achieved near 100% electrification of both
urban and rural households with the balance of
14088 households which are proposed to be
electrified by FY2017 under the DDUGJY scheme
of Government of India. Therefore, the requirement
for additional energy demand from the
electrification of un-electrified HHs shall be only
corresponding to the electrification of 14,088 HHs,
newly constructed HHs and increase in per HH
consumption.
Domestic 24%
Commercial6%
Agricultural6%
Industrial60%
Others4%
Domestic Commercial Agricultural
Industrial Others
Domestic 85%
Commercial11%
Agricultural1%
Industrial2%
Others1%
0
2000
4000
6000
8000
10000
FY08
FY09
FY10
FY11
FY12
FY13
FY14
FY15
Domestic Commercial Agricultural
Industrial Others
Figure 7: Consumer Mix of HPSEBL for FY15

Power for All – Himachal Pradesh
Page | 13
The estimated urban and rural HHs along with the
status of electrification as at the end of FY15 is
provided in Table 4.
Table 4: Estimated Un-electrified Households (as on
31st march 2015)
Particulars Urban Rural Total
Total HHs 520,916 1,339,500 1,860,416
Electrified 520,916 1,325,412 1,846,328
Balance (covered under DDUGJY)
- 14,088 14,088
Estimation of Energy Requirement from HHs
The energy requirement from domestic category
consumers (HHs) has been estimated using the
end use method under the following four broad
categories:
a) Latent demand from existing HHs on
account of increase in specific consumption
(kwh/HH/day) for each of the electrified HH
due to life style advancements and natural
growth;
b) Additional energy requirement due to
electrification of un-electrified HHs;
c) Additional energy requirement due to
construction of new urban and rural HHs;
Latent demand growth from already electrified HHs
has been estimated based on expected increase in
consumption levels in accordance with the
objectives of the PFA program. Such growth would
not only include the increased energy requirement
due to elimination of power shortages and network
constraints but also the natural growth in
consumption levels due to lifestyle changes. It is
expected that the daily HH consumption in urban
areas will increase from 6.09 kWh in FY15 to 6.85
kWh by FY19. Similarly, daily rural HH consumption
will increase from 1.54 kWh in FY15 to 1.87 kWh by
FY19. The urban and rural per day HH consumption
has been computed considering the savings on
account of DELP scheme implemented by the
State.
Table 5: Per HH per day consumption (kWh)
Particulars FY15 FY16 FY17 FY18 FY19
Urban 6.09 6.27 6.46 6.65 6.85
Particulars FY15 FY16 FY17 FY18 FY19
Rural 1.54 1.61 1.69 1.78 1.87
Since 100% household electrification has been
achieved in the State (except the 14,088 HHs which
are required to be electrified under the DDUGJY
scheme), additional energy requirement of
HPSEBL is limited to electrification of newly
constructed household or increase in average
monthly consumption levels of the existing
households.
In order to estimate the energy requirement for
newly constructed HHs, the expected number of
newly constructed HHs has been estimated to be
increase at 2.5% as per the last five year trend. The
corresponding energy requirement from new HHs is
estimated based on the estimated per HH per day
consumption detailed above in Table 5.
Estimation of Energy Requirement from Other
Consumer Categories
The energy requirement projections from other
consumer categories have been done factoring the
expected natural growth considering the past trend.
As per the energy and peak deficit data it is
observed that HPSEBL has been able to meet the
energy and peak requirement in FY15 and therefore
no additional growth in demand is envisaged on
account of increased availability of electricity in
accordance with the objectives of the PFA
Roadmap.
For projection of sales to various consumer
categories, CAGR of past five years have been
considered. The projected demand for different
consumer categories is discussed in the following
sub-section.
3.4. Demand Projections – HPSEBL
Based on above steps, the energy sales for
HPSEBL is expected to increase by about 17%,
from 7867 MUs in FY15 to 9,219 MUs in FY19, as
presented Figure 10. Based on the projections and
considering the fact that there are only 14,088 un-
electrified households in the State, the growth in the
sales and electricity requirement is expected to
remain broadly in line with past year growth. The
percentage share of energy sales to domestic
households is expected to increase marginally from
24% in FY15 to 28% in FY19 on account of
increased consumption per household per month
as well as addition of new households. The share
of electricity sales to other than domestic category
is expected to decline owing to the reduced growth
in sales to industrial consumers in recent past.

Power for All – Himachal Pradesh
Page | 14
PFA Projected Energy Req./Sales (MU) is
summarized in Figure 10. The energy requirement
from both urban and rural HHs is projected to
increase in the future led by higher consumption
levels. The mix of rural sales is expected to
increase in the total domestic sales in view of
improvement in per HH consumption per day as can
be seen in Figure 11: Rural Vs Urban Sales (MU)
In order to estimate the energy input requirement at
the state periphery, T&D losses and intra-state
transmission losses have been considered. The
energy consumption estimated above translates
into higher energy requirement, as can be seen in
Table 6.
The energy requirement at the State periphery is
likely to increase from 8,527 MU in FY15 to 10,091
MU in FY19. Peak demand is derived from the
average load factor of previous two years (FY 14
and FY15). Peak demand is expected to grow from
1,422 MW in FY15 to 1,622 MW in FY19.
In view of reduced growth in sales to the other than
domestic consumer categories during the past few
years, the projected energy requirement in MU
terms is expected to fall short of the 18th EPS
estimates for all the years. Also, the projected peak
demand in MW is expected to fall short of the 18th
EPS estimates for FY15 to FY19. The variation in
the peak demand projections is partially also on
account of the difference in the load factor used in
the 18th EPS (at 64.5% in FY15) vis-à-vis the actual
load factor witnessed (70% in FY15).
A comparison of the projected energy requirement
and peak demand figures under the PFA Roadmap
vis-à-vis the 18th EPS is shown in the bar chart in
Figure 12.
Figure 10: PFA Projected Energy Sales (MU)
.
FY15 FY16 FY17 FY18 FY19
Other than Domestic 5,973 6,165 6,362 6,565 6,775
Electrification of Unelectrified HHS2 - 4 9 9 10
Electrification of Newly constructedHHs
- 51 107 168 235
Additional Requirement from existingHHS
- 72 146 224 305
Existing Household Requirements 1,894 1,894 1,894 1,894 1,894
Total 7,867 8,185 8,517 8,860 9,219
7,867 8,185
8,517 8,860
9,219
-
1,000
2,000
3,000
4,000
5,000
6,000
7,000
8,000
9,000
10,000

Power for All – Himachal Pradesh
Page | 15
Figure 11: Rural Vs Urban Sales (MU)
Table 6: Energy Requirement & Peak Demand Projections- HPSEBL
Particulars Units FY16 FY17 FY18 FY19
Energy requirement/ Sales MU 8,185 8,517 8,860 9,219
AT&C losses % 12.5% 11.5% 10.5% 10.0%
Collection Efficiency % 97.01% 97.51% 98.01% 98.51%
T&D losses % 9.81% 9.24% 8.69% 8.64%
Energy Input Requirement MU 9,074 9,384 9,703 10,091
Load Factor (PFA) % 70.25% 70.50% 70.75% 71.00%
Load Factor (EPS) % 67.0% 65.5% 65.2% 64.9%
Peak Demand (PFA) MW 1,475 1,520 1,566 1,622
Figure 12: PFA Projected Energy Req. & Demand vs 18th EPS Projections
0
500
1000
1500
2000
2500
3000
FY 15 FY 16 FY 17 FY 18 FY 19
Rural Urban
FY 15 FY 16 FY 17 FY 18 FY 19
Peak demand (PFA) 1422 1475 1520 1566 1622
Peak Demand (EPS) 1647 1769 1900 2022 2151
Energy Req. (PFA) 8807 9074 9384 9703 10091
Energy Req. (EPS) 9885 10381 10901 11546 12228
0
2000
4000
6000
8000
10000
12000
14000
0
500
1000
1500
2000
2500
Peak demand (PFA) Peak Demand (EPS)Energy Req. (PFA) Energy Req. (EPS)

Power for All – Himachal Pradesh
Page | 16
4. Generation Plan
4.1. Generation Sector in Himachal Pradesh
The State of Himachal Pradesh is well endowed
with hydro resources which also helps the state in
meeting its power requirement through hydro
generating stations located within the state. Post
unbundling of the Himachal Pradesh State
Electricity Board, the power generation function
was retained with the distribution licensee i.e.
Himachal Pradesh State Electricity Board Limited
(HPSEBL). Currently, HPSEBL operates 22
generating stations aggregating to a generation
capacity of 487.45 MW which is useful in meeting
the energy requirement in the State. In addition, the
state also relies upon the allocation of power from
Central Generating Stations (NTPC, NHPC, SJVN,
THDC, BBMB), Independent Power Producers, and
Govt. of HP share of free power in the plants
located within the State.
During the period FY16 to FY19 the peak demand
and energy requirement is expected to increase
from 1,475 MW and 9,074 MU to 1,622 MW and
10,091 MU in FY19. As HPSEBL has access to
several power sources including the Government of
HP free share in generating stations being
developed in the State, it is important that the
planning is done carefully keeping in view the
issues faced by the licensee as well as the cost of
procurement from these alternative sources.
This chapter evaluates adequate power availability
for meeting the projected power demand in the
period FY16 to FY19. Further, the details of
upcoming capacity addition and the issues faced by
the State due to its generation mix have been
identified herein.
4.2. Existing generation capacity- HPSEBL
Himachal Pradesh State Electricity Board Ltd.
(HPSEBL), which is the distribution licensee in
State, has also been entrusted with the generation
of electricity. Currently, HPSEBL has 23 power
plants aggregating to a capacity of 587.45 MW of
which 22 are operation and one plant i.e. 100 MW
UHL-III is under construction and is expected to
commission by FY2016-17. The details of
HSPEBL’s power stations are listed in Table 7.
Table 7: Details of HPSEBL's Plants
Name of Plant Capacity
(MW) Allocation
(%)
Allocated Capacity
(MW)
Plants >25MW
Larji 126.00 88.00% 110.88
Bhaba 120.00 100.00% 120.00
Bassi 66.00 100.00% 66.00
Giri 60.00 100.00% 60.00
Uhl III (Upcoming) 100.00 88.00% 88.00
Total 472.00 444.88
Plants <25MW
Ghanvi-I 22.50 88.00% 19.80
Andhra 16.95 100.00% 16.95
Khauli 12.00 88.00% 10.56
Baner 12.00 88.00% 10.56
Gaj 10.50 88.00% 9.24
Binwa 6.00 100.00% 6.00
Gumma 3.00 100.00% 3.00
Nogli 2.50 100.00% 2.50
Chaba 1.75 100.00% 1.75
Thirot 4.50 100.00% 4.50
Rukti 1.50 100.00% 1.50
Rong Tong 2.00 100.00% 2.00
Chamba 0.45 100.00% 0.45
Sal-II 2.00 100.00% 2.00
Holi 3.00 100.00% 3.00
Killar 0.30 100.00% 0.30
Bhaba Aug. 4.50 100.00% 4.50
Ganvi-II 10.00 88.00% 8.80
Total 115.45 107.41
HPSEBL Total 587.45 552.29
In addition to the above existing and under
construction projects, HPSEBL also have been
allocated 5 small HEPs (<25 MW capacity) which
are currently in planning and clearance approval
stage. These HEPs are projected for
commissioning post FY2018-19. Details of the new
allocated small HEPs to HPSEBL are provided in
Table 8 below:

Power for All – Himachal Pradesh
Page | 17
Table 8: HEPs allocated to HPSEBL for
development
Name Capacity (in MW)
Cost (Rs. Cr.)
Devi Kothi 16.00 134.97
Sai Kothi-I 15.00 133.63
Sai Kothi-II 16.50 152.26
Hail 18.00 171.41
Raison 18.00 146.50
More than 20% of the Himachal Pradesh’s energy
requirement is met by the HPSEBL’s owned hydro
power plants. Including the share of IPPs and
GoHP share of free power being sourced by
HPSEBL, the State is able to meet its electricity
requirement by more than 50% from power being
generated within the State. Going forward HPSEBL
shall have availability of power from the various
hydro stations being developed by HPPCL, IPPs
and Central generating companies details of which
are discussed in subsequent sub sections.
4.3. Generation capacity- HPPCL/ IPPs
In order to harness the rich hydro potential in the
state, the Government of Himachal Pradesh in the
past had signed a number of MOUs with the
Independent Power Producers (IPPs). As a result,
the commissioned IPP projects contribute to about
27% of the available capacity for HPSEBL.
GOHP had allocated 655 Small Hydro Electric
Projects (SHEP) with a capacity upto 5MW
aggregating to 1,596.805 MW capacity until 31st
October, 2015. Out of these 67 projects with an
aggregate capacity of 262.55 MW have been
commissioned. Of the total projects allocated to
IPPs, 13 projects aggregating to a capacity of 16.87
MW have been allotted to Himachal Pradesh
Energy Development Agency (HIMURJA) for
development in State Sector.
Table 9: Power Availability from IPPs within the
State
Project Name Installed Capacity
(MW)
Allocation
Available
Capacity (MW)
Baspa-II HEP 300 88% 264
Existing (>5 MW) 119 86% 103
Existing Plants (<5 MW)
247.55 100% 247.55
Total 667 614
The Government of Himachal Pradesh with an aim
to develop and promote hydro power also
incorporated a company by the name of Himachal
Pradesh Power Corporation Limited (HPPCL) in
2006. HPPCL is owned by GoHP (60%) and
HPSEBL (40%). Currently, HPPCL is developing
five hydro projects aggregating to a total capacity of
856 MW. The details of HPPCL projects under
construction are provided in Table 10.
Table 10: Power projects under construction stage
being developed by HPPCL
Project Name Capacity (MW)
Expected
Commissioning
Project Cost (Rs. Cr.)
Sawra Kuddu 111 2017 559
Kashang I 65 2016 478
Kashang II & III 130 2018 488
Sainj 100 2016 725
Shongtong Karcham
450 2020 2,808
Total Capacity 856 5,058
The funds for the above stations are tied-up with
ADB which is providing $800 million towards the
Kashang (I, II & III), Sainj, Swarn Kuddu and
Shongtong Karchan hydro projects. Additional
funds amounting to Euro150 million have been tied-
up with KfW for electro-mechanical works of
Shongtong Karchana HEP.
Further to the projects under construction, HPPCL
also has 16 additional projects with an aggregate
capacity of 2,255 MW which are currently under
investigation and pre-feasibility stage. Therefore,
power from these projects is not expected to be
available during the period FY16-FY19.
HPPCL is also setting up a 5MW solar power
project at Berra Dol, Bilaspur district for which the
DPR has been prepared and forest clearance has
been obtained. Funding tie-up for the project is
under finalization. In addition to Berra Dol Solar
Project HPPCL is also exploring possibilities of
setting up another Solar Project approximately 5
MW at Dabat, Distt. Bilaspur (HP).
Himachal Pradesh also has the first IPP project
BASPA –II in the country with a capacity of 300 MW
which was developed and operated by Jaiprakash
Power Ventures Ltd. The entire capacity from
BASPA-II is procured by HPSEBL under a PPA
excluding the GOHP 12% share of free power from
the station.

Power for All – Himachal Pradesh
Page | 18
Apart from the above hydro-stations located within
the state, there are several Central Generating
Stations (CGS) being operated by NHPC and SJVN
in Himachal Pradesh. While the GOHP has free
share of power from these generating stations,
there is firm as well as unallocated quantum of
power which is assigned by MoP to HPSEBL. The
total generation capacity in the State of HP is
10,264 MW including 7,457 MW of Central/ Joint
Sector Projects. As per CEA, the total installed
capacity of Utilities in the State including allocated
share in IPPs, Joint and Central Sector plants is
4,424 MW of which 3,422 MW is from Hydro Power
Stations. Private projects form the largest
contributor to the allocated capacity in the state (i.e.
50.8%). The details of energy allocated from
various sources is provided at Table 11.
While the State has access to substantial power
availability from its hydro resources during summer
season, limited water flow in the rivers during winter
season impacts its power availability leading to
demand-supply deficits. The allocation of 228MW
from central thermal generating stations is highly
insufficient considering the peak demand of 1300-
1400 MW during the winter season. HPSEBL is
able to cover this shortfall by entering into banking
arrangements with neighboring states and the
balance shortfall is met through a combination of
unallocated share of power from CGS and short-
term arrangements. It is observed that the demand-
supply shortfall during winter season is a recurrent
situation and HPSEBL should undertake long-term
measures for addressing this issue.
4.4. Generation plan
The generation plan for the state envisages the
proposed capacity additions by the state along with
the allocated share of upcoming central and IPP
generating stations. The generation capacity
addition and power procurement plans have been
aligned with the energy requirement and power
demand assessed in the earlier sections of this
report.
Inter-state/ central sector projects
The central sector allocation for Himachal Pradesh
are from the NTPC thermal stations including coal
and gas based stations and contribute only 10% of
the allocated capacity. Further, HPSEBL has
allocations from the hydro projects of central
generating plants i.e. NHPC, THDC and SJVN as
well as shared hydro projects of BBMB, UJVNL,
PSEB, etc. nt and Central Sector Utilities
Table 12 provides the central sector allocations of
the state.
Table 11: Installed Capacity* (MW) of Power Utilities in the State as on July 2015 (CEA Executive Summary)
Share Sector Thermal Nuclear Hydro RE Total
State 0 0 394 257 650
Private 0 0 1,748 498 2,246
Central 214 34 1,280 0 1,528
Total 214 34 3,422 755 4,424
*including allocated share in IPPs, Joint and Central Sector Utilities
Table 12: Plant wise details of allocated capacity from Central sector (As per CEA power supply position report
for November 2015 and HPSEBL)
Sources Installed Capacity
(MW) %
Available Capacity (MW)
NHPC Stations
Chamera-I 540 2.90% 16
Chamera-II 300 3.67% 11
Chamera-III 231 3.36% 8
Tanakpur 120 3.84% 5
Salal 690 0.99% 7
State15%
Private51%
Central34%

Power for All – Himachal Pradesh
Page | 19
Sources Installed Capacity
(MW) %
Available Capacity (MW)
Uri 480 2.71% 13
Dhauliganga 280 3.67% 10
Parbati-III 520 3.36% 17
Total 3,661 86.63
NTPC Stations
Rihand-I 1,000 3.50% 35
Rihand-II 1,000 3.30% 33
Rihand-III 1,000 3.37% 34
Unchahar-I 420 1.67% 7
Unchahar-II 420 2.86% 12
Unchahar-III 210 3.80% 8
Kahalgaon -II 1,500 1.53% 23
Anta Gas 419.33 3.58% 15
Auraiya Gas 663.36 3.32% 22
Dadri Gas 829.78 3.01% 25
Singrauli Bundled 15 100% 15
Total 11,457.47 228.67
NPCIL Stations
Narora (NAPP) 440 3.18% 14
RAPS (5&6) 440 3.41% 15
Total 880 29.00
Shared Stations
Bhakra old HP share 1.2LU/day 10
Bhakra complex 1,478.73 7.19% 106
Dehar 990 7.19% 71
Pong 396 7.19% 28
UJVNL 546.69 25% 131.57
PSEB 110 Fixed 9.57
Total 3,521.42 357.12
Other CGS
Nathpa Jhakri SOR(SJVNL) 1,500 2.47% 37.05
Nathpa Jhakri Equity 1,500 22.00% 330.00
Tehri HEP (THDC) 1,000 2.80% 28.00
Koteshwar (THDC) 400 2.01% 8.04
Rampur Equity 412 26.10% 107.53
Rampur HEP 412 2.81% 11.58
Total 5,224 522.2
Grand Total 24,743.89 1,223.61
In addition to the above, the state draws power from
the unallocated shares of central stations during
winters to meet the shortfall in the state. As on Nov
2015, 160 MW of unallocated share of NTPC
stations was assigned to Himachal Pradesh.
There are several upcoming central generating
stations from which power is allocated to HPSEBL.
The expected commissioning details along with
power allocated from these upcoming central
generating stations are provided at Table 16.

Power for All – Himachal Pradesh
Page | 20
Intra-state/ state sector projects
During the period FY16 to FY19 only one project of
HPSEBL with a capacity of 100 MW (i.e. UHL-III) is
under construction and the plant is expected to be
in operation by September 2016.
Generation plan of HPPCL
Currently five projects of HPPCL aggregating to a
total capacity of 856 MW are under various stages
of construction. Few plants i.e. Kashang I, Sawra
Kuddu are in advanced stages of completion and
are expected to commission by end of FY17.
Further to the projects under construction, HPPCL
also has 16 additional projects with an aggregate
capacity of 2,255 MW are currently under
investigation and pre-feasibility stage. However, the
PPA/ tie-up for sale of power from these stations
have not been executed.
The proposed expenditure with respect to these
stations is as provided in Table 13 below:
Generation plan of IPPs
Since there are a large number of small and mini
hydro IPP plants with a combined capacity of
approx. 530 MW which are in various stages of
construction. Details of the capacity addition of
State Sector / IPPs is provided in the Table 14.
Power from these stations shall be procured by HPSEBL and therefore, availability of power from these stations have been considered as provided in Table 48 of the RE Chapter.
Table 13: Proposed Capital Expenditure on under construction projects of HPPCL
Project Name Expected Commissi
oning
Estimated Cost
Funding Agency (Debt: Equity 70:30)
FY 16 (Estimate
d) FY 17 FY18 FY19
Sawra Kuddu 2017 1,359 ADB 57 136
Kashang I 2016 717 ADB 79 155 75 70
Kashang II & III 2018 438
Sainj 2019 1,143 ADB 108 100
Shongtong Karcham 2020 2,808 ADB/KfW 174 255 330 330
Total Expenditure 418 646 405 400
Table 14: Upcoming HPSEBL and IPP plants
Capacity (MW) FY16 FY17 FY18 FY19 Total
Uhl III – BVPCL - 100 - - 100
Upcoming IPPs (<5 MW) 111 131 111 176 529
Total Allocations 111 231 111 176 629
Table 15: Existing and Upcoming Plants of HPSEBL
Plant Owner Installed Capacity
Allocation to HPSEBL
Current Status
HPSEB owned Plants (>25 MW)
Larji HPSEBL 126.00 111 Operational
Bhaba HPSEBL 120.00 120 Under Shut-down
Bassi HPSEBL 66.00 66 Operational
Giri HPSEBL 60.00 60 Operational
Uhl III - BVPCL HPSEBL 100.00 88 Under Construction
HPSEB owned Plants (<25 MW)

Power for All – Himachal Pradesh
Page | 21
Plant Owner Installed Capacity
Allocation to HPSEBL
Current Status
Ghanvi-I HPSEBL 22.50 19.8 Operational
Andhra HPSEBL 16.95 16.95 Operational
Khauli HPSEBL 12.00 10.56 Operational
Baner HPSEBL 12.00 10.56 Operational
Gaj HPSEBL 10.50 9.24 Operational
Binwa HPSEBL 6.00 6 Operational
Gumma HPSEBL 3.00 3 Under Shut-down
Nogli HPSEBL 2.50 2.5 Operational
Chaba HPSEBL 1.75 1.75 Operational
Thirot HPSEBL 4.50 4.5 Operational
Rukti HPSEBL 1.50 1.5 Under R & M
Rong Tong HPSEBL 2.00 2 Under R & M
BSPH Chamba HPSEBL 0.45 0.45 Operational
PSKCM Sal-II HPSEBL 2.00 2 Under Shut-down
Holi HPSEBL 3.00 3 Under Shut-down
Killar HPSEBL 0.30 0.3 Operational
Bhaba Aug. HPSEBL 4.50 4.5 Operational
Ganvi-II HPSEBL 10.00 8.8 Operational
Total HPSEBL owned 587.45 552.29
Table 16: Upcoming Central Generating Stations
Source Fuel Owner Capacity
(MW)
Allocated Capacity in
MW
Expected CoD
Status
RAPP (VII & VIII) Nuclear NPCIL 1,400 26.60 Dec/16 Under
Construction
Parbati II Hydro NHPC 800 35.04 Sep/18 Under
Construction
Tapovan Vishnugarh Hydro NHPC 520 18.72 Sep/18 Under
Construction
Kishanganga Hydro NHPC 330 12.01 Sep/16 Under
Construction
Meja STPP Thermal NTPC 1,320 19.01 Jan/18 Under
Construction
Vishnugarh Pipulkoti Hydro NHPC 444 11.99 Sep/18 Under
Construction
Unchahar IV Thermal NTPC 500 24.50 Feb/18 Under
Construction
Tanda TPP Thermal NTPC 660 32.34 Nov/18 Under
Construction
Total Allocations 180.21
4.5. R&M Program
HPSEBL is currently undertaking R&M of two of its
plants i.e. Rong-Tong (2MW) and Rukti (1.5MW)
which is likely to be completed by FY2015-16. The
R&M cost for the two projects are being met through
13th Finance Commission Grants.
Additionally, HPSEBL has plans to undertake R&M
of its 60 MW Giri and 120 MW Bhabha hydro
generating stations. The rehabilitation works of
Bhaba Power House is also in progress and the
power station is expected to be re-commissioned
during June, 2016. The Scheme for R&M and Life
Extension of Giri Power house is also approved for
implementation within three years. Complete
shutdown of Giri plant shall be avoided as much as
possible and works will be planned in a manner
that, one machine (of the two) is available during
implementation period.

Power for All – Himachal Pradesh
Page | 22
In case of other hydro power plants which are
currently under shutdown i.e. Gumma and Holi,
HPSEBL is undertaking R&M works for re-
commissioning of the plant. For Sal-II HEP which is
under shut down since 10.3.2015, a scheme is
under preparation and appropriate board approvals
shall be taken.
The details of R&M cost and funding tie-up is
summarized in table below:
Table 17: Details of R&M Schemes
Name of Power Station
Estimated Cost
(Rs. Cr.) Funding
Rukti 4.75 Grant from 13th Finance
Commission Rong-Tong 5.00
120 MW Bhabha 76.03 PFC approved scheme 80:20
debt-equity
60 MW Giri HEP 139.80 Approved by PFC.
Re-posted for additional funds
Gumma Power House 3.40
PFC approved scheme 80:20
debt-equity
Holi 0.19 Internal funding
Sal II 15.00 Scheme to be
approved by Board
Total 244.17
In view of the financial health of HPSEBL and
limited availability of funds from the State
Government, Central Government assistance/
schemes shall help in timely implementation of the
R&M measures envisaged for the older plants of
HPSEBL. A scheme for providing assistance to old
hydro power plants for renovation and
modernization shall encourage the state owned
generating utilities to undertake such schemes in a
timely manner.
4.6. Anticipated Power Availability Position- HPSEBL
During FY16 to FY19, HPSEBL is expecting
capacity additions of 100 MW through its own hydro
generating station UHL-III. Additionally, power from
530 MW of small and micro HEPs which are
expected to commission during the period FY16 to
FY19 shall be procured by HPSEBL. Allocation of
approximately 180 MW from various thermal,
nuclear and hydro central generating stations shall
also boost the availability of power to HPSEBL.
However, the majority of energy is expected from
hydro stations (100 MW from UHL-III, 530 MW from
SHPs and 78 MW from CGS allocation) which may
have limited benefit for HPSEBL considering that
the deficit period is during winter season when the
contribution of hydro stations is minimal.
While the projections for peak demand requirement
and availability show shortfall during the initial
years, HPSEBL is expected to meet the projected
peak demand by FY19 from the various sources of
power available. Similarly in energy terms HPSEBL
is projected to be able to meet the energy
requirement in the years FY16-FY19 owing to the
new stations coming on stream and allocation of
power from central generating stations. The
sufficiency of energy is on an annual basis and
therefore HPSEBL will have to undertake banking
and other bilateral arrangement for meeting the
seasonal deficits. Also, the unallocated share of
HPSEBL in the central generating stations and
access to GoHP share of free power from various
generating stations located within the State would
enable the utility to meet the winter deficits. The
seasonal variation on account of peak and off-peak
hydro power availability can be observed from the
Figure 16.
The following figure shows the available capacity
from various sources for HPSEBL which is detailed
in Table 19.
Figure 13: Energy Available from Central, State,
Private and Other Sources
(2,000.00)
2,000.00
6,000.00
10,000.00
14,000.00
FY 16 FY 17 FY 18 FY 19
Central State Private Others

Power for All – Himachal Pradesh
Page | 23
Figure 14: Anticipated Energy Availability (MU) for HPSEBL
Figure 15: Anticipated Peak Availability Position of HPSEBL (MW)
Table 18: Anticipated Power Availability Position for Himachal Pradesh
Parameter Unit FY16 FY17 FY18 FY19
Himachal Pradesh - State
Energy requirement MUs 9,074 9,384 9,703 10,091
Ex-Bus Energy available Mus 9,288 10,228 11,159 12,077
Energy availability at State Periphery (after inter-state losses)
MUs 9,108 10,046 10,973 11,876
Surplus/ (Deficit) MUs 34 662 1,271 1,785
Peak demand MW 1,475 1,520 1,566 1,622
Peak Availability MW 2,112 2,332 2,472 2,680
Surplus/ (Deficit) MW 638 813 907 1,058
FY16 FY17 FY18 FY19
Total Energy Required (MU) 9,074 9,384 9,703 10,091
Total Energy Availability (MU) 9,108 10,046 10,973 11,876
Surplus/Deficit (MU) 34 662 1,271 1,785
-
2,000
4,000
6,000
8,000
10,000
12,000
14,000
FY16 FY17 FY18 FY19
Total Demand (MW) 1,475 1,520 1,566 1,622
Total Availability (MW) 2,112 2,332 2,472 2,680
Surplus/Deficit (MW) 638 813 907 1,058
-
500
1,000
1,500
2,000
2,500
3,000

Power for All – Himachal Pradesh
Page | 24
Figure 16: Peak & Off-peak Power Requirement and Availability
Table 19: Ex-Bus Energy from various sources (MU) for FY16 to FY19
Source State Central Others Private/ IPPs Total
FY16
Hydro 1,145 331 3,528 1,144 6,149
Thermal 1,320 1,320
Hydro (RE) 402 1,393 1,796
Solar 23 23
Total 1,548 1,674 3,528 2,538 9,288
FY17
Hydro 1,569 352 3,519 1,142 6,582
Thermal 1,345 1,345
Hydro (RE) 473 1,804 2,278
Solar 23 23
Total 2,042 1,721 3,519 2,946 10,228
FY18
Hydro 1,948 375 3,519 1,142 6,984
Thermal 1,457 1,457
Hydro (RE) 475 2,219 2,693
Solar 25 25
Total 2,423 1,858 3,519 3,360 11,159
FY19
Hydro 1,948 563 3,519 1,142 7,171
Thermal 1,696 1,696
Hydro (RE) 475 2,710 3,185
Solar 25 25
Total 2,423 2,284 3,519 3,852 12,077
4.7. Key Issues
Most of the existing generating stations of HPSEBL
are over 25 years old and require extensive R&M
activities on regular intervals. However, the R&M
activity is delayed (mostly due to funding
constraints) leading to lower generation and
procurement of power from alternative sources
which may be expensive.
Also, one of the most important issue is with regard
to arrangement of power during the winter months
H1 FY16 H2 FY16 H1 FY17 H2 FY17 H1 FY18 H2 FY18 H1 FY19 H2 FY19
Requirement 4,537 4,537 4,692 4,692 4,851 4,851 5,045 5,045
Availability 6,201 3,028 6,853 3,314 7,480 3,614 8,066 3,931
4,5
37
4,5
37
4,6
92
4,6
92
4,8
51
4,8
51
5,0
45
5,0
45 6,2
01
3,0
28
6,8
53
3,3
14
7,4
80
3,6
14
8,0
66
3,9
31
-
1,000
2,000
3,000
4,000
5,000
6,000
7,000
8,000
9,000

Power for All – Himachal Pradesh
Page | 25
as the availability from hydro generating stations
reduces significantly. While the HPSEBL has been
planning its power procurement in a way to meet
the demand-supply gap created during these
months by way of banking arrangements, sourcing
power from unallocated quota of central generating
stations, procurement of short-term power, etc.
However, the demand-supply gap shall occur each
year due to the dependence on hydro power,
HPSEBL may consider options which may resolve
the issue for a longer term.
With respect to the generation capacity being
developed by HPPCL, there are no PPAs in place
for off-take of the power. Few of the plants are
expected to commission in FY16 (65MW Kashang
HEP Stage-I and FY17 (111MW Sawra Kuddu
HEP) for which no long-term or mid-term
arrangements are in place. Since these are hydro
plants, the available capacity may not be required
by HPSEBL and therefore it is important that
HPPCL undertakes adequate measures for sale of
power from these stations to avoid any revenue
loss.
HPPCL has also indicated other issues including
local agitation, delays in forest clearances, lack of
road connectivity to the land lock/ remote areas as
the major concerns for undertaking the hydro
projects.
4.8. Fund Requirement
Ongoing R&M activities on Rong Tong and Rukti
are financed through grants from 13th Finance
Commission. Funding for R&M of Bhabha and Giri
plants are financed from PFC. Therefore, the fund
requirement for planned R&M of the various
stations are tied-up. However, in view of the
deteriorating financial health of the board and
limited availability of state government funds, there
is considerable delay in undertaking the R&M
activities. Number of HPSEBL plants are under
shut-down or are witnessing frequent break-downs
resulting in loss of electricity generation. Therefore,
financial assistance from the Central Government
for undertaking adequate R&M activity of the old
stations shall help the utility in overcoming the
frequent shutdowns of its old generating stations.
In case of hydro generating stations which are
under construction the funds are tied-up with the
ADB and therefore no support is required. For other
projects which are under pre-feasibility and
investigation, HPPCL has proposed to take up
funding with multilateral agencies i.e. ADB, World
Bank, JICA, BRICS, etc.
Further, with respect to the Renukaji Dam project
which is one of the project of national importance
funded by the Government of India, there is an
urgent requirement for funds to be released by the
Central Government for land acquisition, R&R,
forest clearances, etc. In view of the resentment of
the locals, any delay in land acquisition may result
in starting the process of land acquisition afresh and
may result in large delays.
4.9. Key Issues
Few of the generation related issues highlighted are
as below:
Himachal Pradesh is a hydro rich state
with numerous small generation
capacities. Power from these stations are
being sold outside the state as well. While
the provisions of the IEGC, 2010 allows for
a requisition for revision of schedule of a
generator with capacity of 100 MW and
above in case of forced outage of a unit for
a short term bilateral transaction, there is
no provision for any such instances in
case the generator is below 100 MW.
Since there are large number of small
capacities in the state and owing to the
uncertainty with respect to hydro power
availability, the State has to bear the
burden of penalties for overdrawl of power
as well as imposing of unscheduled power
cuts within the State. An amendment in the
IEGC 2010 to allow all generators
including those with capacity below 100
MW to revise their schedule shall resolve
the additional financial burden on the
State.
Also owing to the dependency on the
hydro power, the State has to rely on
various mechanism including banking,
bilateral procurement, etc. which leads to
additional transmission and scheduling
costs for the utility and the State. A
suitable policy for swapping of such hydro
power with thermal power during few
months in year would ensure
uninterrupted power at the most
reasonable cost to the consumers in the
State.
4.10. Action Plan & Support Required
The action points and support requirements for
generation are covered in Table 20 below:

Power for All – Himachal Pradesh
Page | 26
Table 20: Action points for Generation Plan
Agency Action Plan
State
Government
• Undertake measures for tie-up of power from the HPPCL stations which are expected to
commission during FY16 and FY17
HPPCL
• To ensure timely execution of ongoing projects as per the schedule.
• Ensure tie-up of the capacity for the plants which are expected to be commissioned in near
future in order to prevent any delay in commissioning
• Relook procurement and contractual processes for award of EPC works to ensure
comprehensive agreement and clarity on various terms and conditions with the objective of
minimizing disputes/ delays and ensuring smooth execution of works in future.
HPSEBL
• Periodical maintenance and repairs of its generating stations
• Long-term arrangements for meeting the demand –supply gap during winter months
MoP/ CEA
• Develop a scheme for renovation and modernization of old hydroelectric plants with capacity of
more than 25 MW to encourage utilities to undertake proper maintenance activity in hydro
plants
PFC • To evaluate the renovation and modernization schemes proposed by HPSEBL for old hydro
stations and provide required funding
Government of
India
• Assistance in form of financial support for undertaking R&M and upgradation of old hydro
plants of HPSEBL.
• Timely release of funds to maintain the pace of work at the hydro projects of national
importance Develop a policy to allow swapping of equivalent share of hydro energy/ capacity
with thermal energy/ capacity by way of reallocation for part of the year in order to maintain an
ideal thermal-hydro mix in the country. This shall also enable states with high dependence on
hydro power to meet the deficits during the winter months.
• Amendment in the IEGC 2010 to allow all generators including those with capacity below 100
MW to be able to requisition of revision of schedule

Power for All – Himachal Pradesh
Page | 27
5. Transmission Plan
5.1. Transmission capacity requirement
The planning and development of intra-state
transmission system in the state is undertaken by
Himachal Pradesh State Electricity Board Limited
(HPSEBL) and Himachal Pradesh Power
Transmission Corporation Limited (HPPTCL). A
well planned and strong transmission system will
ensure not only optimal utilization of transmission
capacities but also of generation facilities and would
further facilitate achieving ultimate objective of cost
effective delivery of reliable power to end
consumers.
The requirement of electricity in energy and peak
demand terms for the State are expected to
increase from the present level of 8,807 MU and
1,422 MW in FY15 to 10,091 MU and 1,622 MW in
FY19.
The state’s generation plan as detailed in Section 4
of this report outlines the upcoming projects in the
state in addition to the allocation from central
stations and other licensees. It is evident that a total
of 850 MW is expected to be added to the existing
system by FY19. The transmission plan proposed
in this chapter aims at ensuring adequacy of
transmission infrastructure for evacuation of such
power from the inter-state boundary/ proposed
generating plants within the State, to the end
consumers located across various geographies of
the State.
5.2. Existing transmission system
Intra-state transmission system
Post the unbundling of Himachal Pradesh State
Electricity Board by the Government on 10th June
2010, a separate transmission company Himachal
Pradesh Power Transmission Corporation Ltd.
(HPPTCL) was formed for undertaking the
operation and maintenance of the transmission
network in the state of HP. However, majority of the
transmission infrastructure has been retained by
the HPSEBL with only 15 transmission lines being
transferred to the HPPTCL. Therefore, HPSEBL
continues to retain and expand its intra-state
transmission system while HPPTCL’s role is for
development and strengthening of transmission
network for evacuation of the power from existing
and upcoming small hydro power plants in the state.
As on 31st March 2015, HPSEBL operates and
maintains a transmission network of 3,448.85 ckt.
kms of Extra High Voltage Transmission lines along
with 45 sub-stations (220/132/66 kV) having total
transformation capacity of 3,831 MVA, spread over
the entire stretch of the State of Himachal Pradesh.
The existing transformation capacity and line length
(220kV,132 kV and 66 kV) of HPSEBL network is
summarized in Table 21.
Table 21: Intra-state Transmission System of
HPSEBL as on 31st March 2015
Voltage Line
Length (ckt kms)
No. of Substations
Transformation Capacity (MVA)
220 kV 535.95 7 1,723
132 kV 2,320.56 26 1,417
66 kV 592.34 12 690
Total 3,448.85 45 3,831
In addition to the HPSEBL transmission system, the
HPPTCL network comprise of 15 transmission lines
(220/132/66 kV) details of which are provided in
table below:
Table 22: Intra-state Transmission System of
HPPTCL as on 31st March 2015
Voltage Line Length (ckt kms)
220 kV 131.24
132 kV 41.75
66 kV 66.35
Total 239.34
The existing capacity of intra-state transmission
system requires further strengthening and
augmentation for meeting the demand in the State
and also for the purpose of evacuation of power
from the various upcoming hydro generating
stations within the state of HP. The availability of

Power for All – Himachal Pradesh
Page | 28
HPSEBL’s transmission system is at par with other
leading state transmission utilities in the country.
Inter-state transmission system
The energy requirement of Himachal Pradesh is
predominantly met from generating station situated
within the State. However, there is transmission
infrastructure requirement for evacuation of power
from the hydro generating stations located within
the state as well as for banking of power to the
neighboring states. Currently, four number of inter-
state pooling sub-stations located at Nalagarh,
Hamirpur, Chamera & Parbati with an aggregate
transformation capacity of 1890 MVA acts as the
interconnection point for the State.
At present, the inter-state transmission system has
about 3,349 ckt kms of transmission line with a total
transformation capacity of 1,890 MVA, with the
following voltage wise break-up shown in Table 23.
Table 23: Inter-State Transmission System
Voltage Transformation Capacity (MVA)
Line Length (cKM)
400 kV 4 Nos.
1,890 MVA 2,221
220 / 132 kV - 1,128
Total 1,890 3,349
5.3. Intra-state Transmission Plan
Proposed schemes
HPSEBL is working on a number of transmission
projects to improve the network infrastructure and
to ensure reliability and quality of supply to end
consumers.
HPSEBL has identified such projects in order to
meet the following requirements:
a) Meet demand for power arising from
existing and future end-consumers in
various load centers/ pockets in the
state;
b) Providing connectivity for evacuation
of power from various upcoming intra
and inter-state power plants and for
onward delivery of such power to load
centers/ drawl points;
c) Improving the availability and reliability
of the intra-state transmission systems
in the State; and
d) Improving efficiency by way of
reducing technical losses in the intra-
state transmission systems.
For meeting the power requirement during winter
months, HPSEBL have to depend upon power flows
from outside the State. Therefore, in order to
transmit the available power from periphery to load
centers for further distribution to consumers and
industrial areas like Baddi, Barotiwala, Kala Amb,
Paonta etc., HPSEBL has meticulously planned its
EHV Distribution Network for intra sub-station
transfer of power. It has proposed a 220kV ring
interconnecting all the seven 220kV sub stations in
the HP system in a phased manner along with
construction of 400kV transmission line from
Nalagarh (PGCIL’s sub-station to link Nalagarh) to
Kunihar with 400/220kV sub-station at Nalagarh.
This 220kV ring along with 400kV system will
strengthen the existing power delivery system in a
big way to the extent of 500 MW from one corner to
another corner in the State within minimum lines.
The summarized list of planned schemes and
proposed capacity additions at various voltage
levels is summarized in Table 24.
Table 24: Proposed schemes of HPSEBL
Parameter FY16 FY17 FY18 FY19 Total
No. of Lines
3 2 7 4 16
Ckt kms 59 51 109 34 254
No. of new S/s
5 3 6 2 16
Capacity (MVA)
285 73 369 328 1,055
No. of augmentation S/s
8 4 1 2 15
Capacity Addition (MVA)
295.5 162.9 68.5 23.5 550.4
The proposed transmission investment shall add 16
new substations with a total capacity of 1055 MVA
and augmentation of 15 existing substations by
approx. 550 MVA.
In addition to the above intra-state transmission
schemes being undertaken by HPSEBL for
strengthening and augmentation of the
transmission network within the state, there are
various transmission schemes/ works being
undertaken by HPPTCL for evacuation of power
from remotely located hydro power plants within the
state. The details of proposed transmission
augmentation by HPPTCL is summarized in table
below:

Power for All – Himachal Pradesh
Page | 29
Table 25: Proposed schemes of HPPTCL
Parameter FY16 FY17 FY18 FY19 Total
No. of Lines
- 12 5 7 24
Ckt kms - 274 206 300 780
No. of sub-stations
- 8 7 9 24
Capacity (MVA)
- 635.5 1,213 1,660 3,508
The commissioning of transmission lines and
substations planned by HPPTCL may defer up to
FY20 considering the geographical difficulties,
lower working season, lengthy and unpredictable
forest clearance procedures.
5.4. Inter-state Transmission System Plan
Ongoing schemes.
In view of the upcoming hydro generation capacity
additions in the northern region, PGCIL has started
strengthening the inter-regional and inter-state
transmission systems and is also focusing on
capacity augmentation of existing substations and
transmission lines. Augmentation of the inter-state
transmission capacity is being undertaken by
PGCIL as well as under the Tariff Based
Competitive Bidding “TBCB”. The details of
augmentation projects which are currently under
development are provided in Table 26.
Table 26: Augmentation of Inter-state Transmission
Substation
Details Expected
Completion Works
Augmentation of Transformation capacity in Northern Region for 2016-17
Mar’16
ICT Aug. at Hamirpur 400kV S/s
- 3x10⁵ MVA 2 nos. of 220kV line
bays
NRSS-XXXII June’16
400/220 kV ICT at Parbati pooling station - 7x10⁵ MVA(Phase-1:
630MVA) and two nos. of 220 kV line
bays.
Transmission System associated with Northern region System strengthening Scheme-XXXI-Part-A
July’17
7Xl05MVA(Ph-1 : 630MVA), 400/220
kV GIS substation at Kala Amb
LILO of both circuits of Karcham Wangtoo –
Abdullapur 400 kV D/c (Quad Moose) line at Kala Amb -
5km
SVC at Nalagarh 2017-18 +200 MVAR STATCOM
Details Expected
Completion Works
alongwith 2x125 MVAR Capacitor and 2x125 MVAR
Reactor at Nalagarh Substation
The above schemes shall enable augmentation of
the inter-state transmission capacity by 1680 MVA
which shall enable evacuation of power from small
and large hydro stations in the region.
Proposed New Schemes
A number of new hydro generation projects are
planned in the upper region of Himachal Pradesh
which mainly cover upper part of Satluj Basin
including Spiti Valley and Chandrabhaga basin. For
implementation of transmission system, there are
severe right-of-way constraints and the terrain is
very tough and the area is snow bound. The
transmission system for upper part of Satluj Basin,
Spiti Valley (Satluj Basin), Chandrabhaga Basin
and Beas Basin in Himachal Pradesh was decided
through a Task Force having representatives from
Govt. of HP, HPPCL, HPPTCL, CEA and
POWERGRID to identify the availability of
corridors, location of proposed pooling stations,
feasibility of construction of lines, progress of
generation projects etc.
The master plan for these various hydro projects in
Himachal Pradesh was identified and discussed in
the Standing Committee Meeting of Northern region
Constituents. However, implementation of the
transmission system shall be taken up after receipt
of long -term applications from the generators.
The detailed list of planned transmission system is
given at Annexure 2.
5.5. Adequacy of Transmission Planning:
The intra-state transmission plan prepared by
HPSEBL and HPPTCL is adequate to meet the
projected demand within the State up to FY19 as
well as the requirement for evaluation of power from
generating stations being developed in the State.
The total capacity (including existing Substations
and Lines) after implementation of all schemes is
shown in Table 31 and Table 32.
With the expected peak demand of 1,622 MW in
FY19, the ongoing/ proposed projects for capacity
additions and augmentations will be adequate to
cater to the increasing load and also improve

Power for All – Himachal Pradesh
Page | 30
reliability of the system by building in redundancies
in the system. With the proposed capacity additions
it is envisaged that there shall not be any
bottlenecks in transmission of power from outside
the State to the distribution network of HPSEBL at
the time of demand-supply deficit.
5.6. Fund Requirement (Intra-state only)
The requirement of funds for development of
ongoing and planned transmission systems of
HPSEBL is as provided in Table 27. It is observed
that a total fund requirement of Rs. 1,187 Cr is
envisaged for transmission development within the
state of which fund requirement to the tune of
approx. Rs. 400 Cr. is currently un-tied.
Table 27: Year-wise fund requirement for HPSEBL
Planned Intra-state Transmission System (Rs. Crs.)
Item FY16 FY17 FY18 FY19
Estimated Fund Requirement
371 296 292 227
The details of various funding options available and
balance un-tied funding is provided in table below:
Table 28: Funding for HPSEBL Proposed
Transmission Capital Expenditure
Item FY16 FY17 FY18 FY19
Estimated Fund Requirement
371 296 292 227
Sources of Funding
Multilateral funding (KFW)
- 39.03 39.03 19.52
FI (REC) 272.96 204.72 204.72 -
FI (PFC) 135.59 135.59 67.79 -
Item FY16 FY17 FY18 FY19
Total Tied Up
272.96 243.75 243.75 19.52
Balance fund to be arranged
98.42 52.69 48.15 207.91
Similarly for the various transmission works being
undertaken by HPPTCL, the envisaged capital
expenditure is provided in Table below:
Table 29: Year-wise Fund Requirement for
HPPTCL Planned Transmission System (Rs. Cr.)
Source FY17 FY18 FY19
ADB Tranche-1 (Total 113 Million USD)
67.08 204.49
ADB Tranche- 2 (Total 110 Million USD)
37.05 183.76
ADB Tranche-3 (Total 127 Million USD)
- 47.84
KfW 250.00 450.00 210.00
For the various intra-state lines being implemented
by HPPTCL, the funding of the various works to be
carried out are being funded by REC, ADB and
KfW. The funding of the various schemes are as per
the debt to equity provided in Table 30 below:
Table 30: Funding of HPPTCL Planned
Transmission System
Item Debt Equity Others
ADB Tranche I 80% 20%
ADB Tranche II 75% 25%
ADB Tranche III To be finalized
KfW (GEC Scheme)
40% 20% 40% (NCEF
Grant)
REC 90% 10%
Table 31: Total Transmission Capacity of HPSEBL (in MVAs) post implementation of schemes
Particulars Existing Additions after implementation of Schemes Cumulative Capacity
FY16 FY17 FY18 FY19
S/S capacity
400kV - - - - 315 315
220kV 1,724 400 74 393 - 2,590
132kV 1,417 110 82 - 24 1,632
66kV 690 70 80 45 13 899
Total 3,831 5,436
Line Length
400kV - - - - 34 34

Power for All – Himachal Pradesh
Page | 31
Particulars Existing Additions after implementation of Schemes Cumulative Capacity
FY16 FY17 FY18 FY19
220kV 536 8 - 62 - 606
132kV 2,321 34 27 33 - 2,414
66kV 592 17 24 15 - 649
3,449 3,702
Table 32: Total Transmission Capacity of HPPTCL (in MVAs) post implementation of schemes
Particulars Existing Additions after implementation of Schemes Cumulative Capacity
FY16 FY17 FY18 FY19
Grid Substations (Nos)
NIL - 8 7 9 24
Transformation Capacity (MVA
NIL
400 KV - 315 630 945 1,890
220 KV - 226 500 463 1,189
132 KV - 94.5 63 252 409.5
66 kV - - 20 - 20
Sub Total NIL - 635.5 1,213 1,660 3,508.5
5.7. Transmission Planning Related Issues
In the past there has been limited addition in the
intra-state transmission network of the State.
However, with the growing demand and
requirement for evacuation of power from the hydro
stations located within the state, the need to
augmentation and strengthening of the
transmission network has been realized and both
HPSEBL and HPPTCL are focused on developing
the EHV network in the state. However, the utilities
have identified number of issues with respect to
planning and implementation of the transmission
projects in the State. Some of the issues are as
below:
Inordinate delay in the obtaining forest
clearances leading to delay in
implementation of projects
Disruptions by the local public during
construction activities inspite of payment
of adequate compensation leading to
unwarranted delays in implementation
Current procedures for land acquisition
and right of way are cumbersome
Further, issues with respect to evacuation of power
from the renewable and hydro power plants in the
Kaza region (located in the Lahaul and Spiti district)
have been highlighted by HPSEBL for which
necessary support may be required from the
PGCIL.
Incidence of higher Transmission Charges
One of the major concerns that the State of HP is
facing with respect to bearing of double
transmission charges and losses with respect to the
sale of surplus energy being sold by the GoHP.
Upto Feb 2006, the State was able to sell its surplus
power to neighbouring states by way of reallocation
of capacity. Accordingly, the PowerGrid charges
which were otherwise borne by GoHP were also re-
allocated to the utilities whom the capacities were
re-allocated for the period of re-allocation.
However, from 2007 onwards this re-allocation of
capacity was stopped after objection from few
states. Therefore, GoHP had to sell the surplus
power through short-term open access which
resulted in levy of double transmission losses viz.
from Generator terminal to HPSEB under long-term
open access regulations & thereafter from HPSEB
periphery to buyer utilities under short-term open
access procedure. This mechanism has resulted in
additional transmission charges for the GoHP.
Besides, short-term open access does not permit
simultaneous revision of schedule to buying utility
in the event of revision in generation schedule
and/or shutting down of the plant by hydro
generator. This has resulted in high implication to

Power for All – Himachal Pradesh
Page | 32
the state under Unscheduled Interchange (UI)
Mechanism.
Therefore, the procedure being resorted to for sale
of power to utilities other than local discom has
defeated the very purpose of compensating the
state for distress caused to them by setting-up of
the hydroelectric plant. A suitable procedure/
mechanism needs to be framed which may enable
the state to sell its surplus power without any
additional financial burden by way of double
transmission charges or penalty under UI due to
uncertainty over hydro generation.
5.8. Action Plan & Support Required
In view of the proposed transmission plan, the
action points shown in Table 33 have been
identified for respective stakeholders to be able to
make suitable arrangements for development of
adequate transmission system in the State.
Table 33: Action Points & Timelines
Stakeholder Action Points
State Government
• Continued administration support for acquisition of land for the substations
HPSEBL / HPPTCL
• Ensure timely implementation of the various transmission schemes proposed to be implemented by FY19
Government of India
• Framing of suitable procedure/ mechanism for sale of surplus power by the State without attracting any additional financial burden by way of double transmission charges or any penalty under the UI mechanism on account of uncertainty over hydro generation
• Assist HPSEBL in arranging funds from World Bank/ External Agencies for the transmission schemes which are currently un-tied
CEA/ PGCIL • Conduct a study in the next 3 months to deliberate options for transmission of power from the
solar and hydro power plants being planned in the Kaza region

Power for All – Himachal Pradesh
Page | 33
6. Distribution Plan
6.1. Introduction
State Government owned Himachal Pradesh State
Electricity Board Ltd. (HPSEBL) is the sole
distribution licensee responsible for development
and management of the distribution network and
supply of uninterrupted and quality power to the
various consumer categories in the State of
Himachal Pradesh. HPSEBL is supplying power to
the various categories of consumers through a
network of transmission, sub-transmission and
distribution lines.
6.2. Objectives of the distribution plan
The energy requirement and peak demand for
Himachal Pradesh is expected to increase from
8,807 MU and 1,422 MW in FY15 to 10,091 MU and
1,622 MW in FY19 respectively. Since the State is
close to 100% household electrification, the
increase in sales is primarily on account of natural
increase in demand from the present consumer
base and improvement in lifestyle. However,
considering the limited investment in the distribution
infrastructure in the past years, HPSEBL is required
to undertake commensurate investments in the
sub-transmission and distribution infrastructure in
order to provide continuous and reliable power to
the consumers in the State.
Accordingly, the objectives of the distribution plan,
in accordance with the 24X7 PFA objectives,
includes the following:
a) Making provision for 24X7 supply to all
connected consumers through capacity
augmentations and building redundancies in
the upstream network for improving reliability
of supply;
b) Ensuring provision of electricity access to
the remaining 14,088 rural unconnected
households in the State;
c) Provision of 24X7 supply to cater to increase
in demand from existing consumers and
increase in demand owing to new
consumer growth in the State;
d) Making system improvements for reducing
AT&C losses in accordance with the targets
agreed with MoP; and
e) Adopting appropriate technologies and
systems to support RE integration and EE/
DSM measures in the State.
6.3. Existing distribution system- HPSEBL
The existing distribution network of HPSEBL
comprises of transmission, sub-transmission and
distribution system required for meeting the load
requirement within the state. The area of HPSEBL’s
distribution network is divided in three zones i.e.
North, South and Central which are further sub-
divided into 12 operational circles which cover the
12 districts of the state. As part of unbundling of the
State Electricity Board in 2010, a large part the EHV
and HV lines were retained by HPSEBL and
therefore management of the transmission network
is also primarily undertaken by HPSEBL.
This section discusses the sub-transmission and
distribution network and systems spread across the
various districts of Himachal Pradesh. The existing
distribution infrastructure of HPSEBL is very old
with limited additions in the past years. As a result,
the distribution network is showing signs of ageing
and may lead to deterioration of performance of
HPSEBL if adequate and timely steps are not taken
for replacement and further augmentation of the
system.
An overview of department’s network infrastructure
in terms of installed transformation capacity and
line lengths of feeders at various voltage levels is
provided in Table 34 below
.

Power for All – Himachal Pradesh
Page | 34
Table 34: Existing Distribution Network of HPSEBL (March 2015)
Particulars Unit Capacity
Transformer
33/11 kV substations Nos 159
33/11 kV substations Capacity MVA 1,102
11/0.4kV LT Distribution Transformer Nos 27,013
11/0.4kV LT Distribution Transformer MVA 2,323
Lines
33kV Feeders Ckt. Kms 3,107
22kV & 15kV Feeders Ckt. Kms 7,209
11kV Feeders (including 2.2kV) Ckt. Kms 21,625
LT Feeders Ckt. Kms 60,700
In spite of a difficult hilly terrain, HPSEBL has been
able to achieve near 100% HH electrification.
Therefore, the focus of the utility is now towards
providing reliable and cost effective power. In view
of the old distribution network and growing loading
of transformers and distribution lines in urban and
industrial areas, requirement for network
augmentation and improvement is most critical.
Also, addition of close to 40-50k consumers each
year is putting additional pressure on the
distribution infrastructure.
DTR Failure Rate
DT Failure Rate in the HPSEBL supply area has
been 4.84% in FY15 which has deteriorated from
4.50% in FY12. Solan, Nahan and Rohru had DTR
failure rates at over 6% while Hamirpur and Una
recordered the lowest DTR failures of 2.1% and
2.3%. Solan and Nahan which are primarily
industrial areas accounting for significant energy
sales, recorded very high DTR failure rates during
FY15. HPSEBL is investing in its network though
the R-APDRP and IPDS projects to bring down the
DTR failure rates.
AT&C Loss
The overall AT&C loss for 14.91% for FY2014-15 is
better that many other states in India in spite of a
difficult hilly terrain where the households are
spread far across. The lower AT&C loss can
partially be attributed to the favorable HT and LT
Table 35: Circle-wise DTR Failure Rates for FY2014-15
.
49 57 108 151 83 191 80 115 77 159 125 97
2.1% 2.3%
4.3% 4.5%4.9% 5.1% 5.4% 5.4% 5.5%
6.1%6.7%
8.0%
0.0%
1.0%
2.0%
3.0%
4.0%
5.0%
6.0%
7.0%
8.0%
9.0%
0
50
100
150
200
250
Ham
irpur
Una
Ma
ndi
Ka
ngra
Sh
imla
Dalh
ousie
Ku
llu
Bila
sp
ur
Ram
pur
So
lan
Nahan
Rohru
DT
R F
ailu
re R
ate
(%
)
DT
R F
aile
d (
Nos.)
Total Failed (Nos.) DTRs Failure Rate (%)

Power for All – Himachal Pradesh
Page | 35
Table 36: Circle-wise AT&C Loss for HPSEBL (FY15)
mix in the state where HT consumption forms
approx. 60% of the total HPSEBL’s sales.
However, based on the information of district-wise
AT&C losses for FY14-15, it is observed that there
are few districts i.e. Rohru, Hamirpur, Kangra,
Dalhousie, Kullu where the AT&C loss is still at
significantly higher levels as compared with the
average for the state. There is significant scope for
improvement in these circles which would help the
utility in meeting the AT&C target of 10% by FY19.
On the other hand industrial belt of Solan and
Nahan which contributes 43% and 13% of the
overall energy sales has an AT&C loss of 5.58%
and 10.96% for FY2014-15 which is lower than the
overall AT&C loss of 14.91% for FY2014-15
Figure 17: AT&C Loss and T&D loss of HPSEBL
during FY11 to FY14
As can be observed from the above graph, the
AT&C loss of HPSEBL have become range bound
and has been increasing in the past four years
primarily on account of deterioration in collection
efficiency. The collection efficiency which was
99.49% during FY12 has reduced to 96.51% in
FY15. However, the T&D loss of the utility has
continued to improve in the last three years from
13.62% in FY13 to 11.84% in FY15. One of the
reasons for improvement in loss levels is the high
level of DT and Feeder level metering which is
indicated in Table 37 below.
Table 37: DT and Feeder Level Metering of HPSEBL
Particulars Total DTs/
Feeders
Meters Installed
Metering Percentage
33 kV Feeders 223 220 98.65%
22 kV Feeders 156 156 100.00%
15 kV Feeders 3 3 100.00%
11 kV Feeders 987 987 100.00%
2.2 kV Feeders 4 4 100.00%
DTRs 2,7774 2,7376 98.57%
The circle –wise collection efficiency for FY15
indicates higher collection efficiency in industrial
circles of Solan (99.20%) and Nahan (97.84%)
which contribute to over 57% in total sales. On the
other hand, the collection efficiency of a number of
circles including Shimla, Hamirpur, Kullu, Kangra
and Dalhousie remain below the average collection
efficiency of HPSEBL as shown in the Figure 18
below:
21%24%
50%
6%
11%
29%
14%
24%27%
15%
27%29%
15%
0%
10%
20%
30%
40%
50%
60%S
him
la
Ram
pur
Rohru
So
lan
Nahan
Ham
irpur
Bila
sp
ur
Ma
ndi
Ku
llu
Una
Ka
ngra
Dalh
ousie
G.T
ota
l
HPSEBL
23.52%
13.87%14.60% 14.72% 14.91%
12.73% 13.43% 13.62%12.36% 11.84%
0.00%
5.00%
10.00%
15.00%
20.00%
25.00%
FY11 FY12 FY13 FY14 FY15
AT&C Loss Actual T&D Loss

Power for All – Himachal Pradesh
Page | 36
Figure 18: Circle-wise Collection Efficiency of
HPSEBL for FY15
While HPSEBL has proposed several schemes for
improvement in both technical and commercial
performance, it is important that the schemes are
timely and efficiently implemented in order to get
the benefits in the desired timeframe.
Some of the measures envisaged for reducing the
AT&C loss and achieving the targets set by MoP
are:
i. Energy Audit: Energy audit for 2013-14 has
been completed in case of eight operation
circles and reports have been sent back to the
respective circles. Feeders having high
losses are being identified for detailed
engineering and adoption of remedial
measures. Targets for Circle-wise voltage-
wise losses and division- wise / voltage-wise
losses have been fixed for next five years
beyond FY2013-14 as per directions of
HPERC.
ii. Strengthening of Sub-Transmission System:
The sub-Transmission system has been
strengthened by erection and commissioning
of 33kV sub-stations, reconductoring of
HT/LT feeders and providing new HT lines
and Distribution substations under R-APDRP
scheme.
iii. System improvement schemes: No. of system
improvement schemes (for 33kV and below
system) in respect of different operation
circles have been sanctioned for procurement
of materials like poles, conductor, distribution
transformers and electronic meters.
iv. Replacement of Dead Stop/ Defective energy
meters: Replacement of defected meters is
being undertaken regularly. New energy
meters (Static meter only) are being procured.
Report on feeders where energy loss is high
with respect to normative level and
replacement of defective meters, is being
sought from all circles regularly.
v. Automatic Meter Reading: Providing AMR or
remote metering in the industrial areas and
improving the metering efficiency across
HPSEBL.
vi. Improvement of Billing Efficiency:
Appointment of billing franchise under the
scheme RGGVY has been done.
vii. Checking of thefts & Pilferage of energy:
Flying squads have been formed which
conducts raids/ checks at various consumer
premises to detect theft of energy and other
irregularities.
With a view to supplement the various measures
undertaken by HPSEBL for reduction of AT&C loss,
the investment plans of HPSEBL should be
targeted in such a manner which not only helps in
reducing the high AT&C losses of the select areas
but also maintain/ lower the losses in high
consumption areas as well.
6.4. Central and State Government Schemes
The collective objective of all the Central/ State
Government schemes has been to enhance the
reach, reliability and quality of electricity to end
consumers and to improve the financial position of
utility by way of reducing the AT&C losses. The
following schemes are presently underway and are
at various stages of implementation in Himachal
Pradesh, which shall not only help HPSEBL in
augmentation of the distribution network but also
aim towards enhancing the technical capacity.
Deen Dayal Upadhyaya Gram Jyoti Yojana
Under the RGGVY, HPSEBL has proposed various
network extension, strengthening and
augmentation works in order to develop a robust
sub-transmission and distribution infrastructure in
rural areas.
Himachal Pradesh being a special category state,
the condition of coverage for villages and
habitations has been relaxed. The project covers 12
districts of Himachal Pradesh having a total layout
of Rs. 341.86 Cr. HPSEBL has incurred an
96.51%
75%
80%
85%
90%
95%
100%
105%
Sh
imla
Ram
pur
Rohru
So
lan
Nahan
Ham
irpur
Bila
sp
ur
Ma
ndi
Ku
llu
Una
Ka
ngra
Dalh
ousie

Power for All – Himachal Pradesh
Page | 37
expenditure of Rs. 296 Cr. against the sanctioned
amount by the Government of India.
Majority of the work under RGGVY is complete and
only 5% works are remaining which are based in
remote and tribal areas of the State.
To complete the electrification process HPSEBL
has got approval for Rs. 159.12 Cr under the
DDUGJY scheme for implementation of projects to
extend grid connectivity to 14,088 rural HHs
The main objectives of the investments under the
DDUGJY scheme is to strengthen the existing
network in rural areas and improve reliability of
system while improving the quality of supply.
The proposed network addition in this scheme is
shown in Table 38 below.
Integrated Power Development Scheme (IPDS) and R-APDRP
Under the R-APDRP scheme, Himachal Pradesh
has planned extensive improvements for its sub-
transmission and distribution infrastructure in its 14
towns including Nahan, Paonta Sahib, Shimla,
Baddi, Bilaspur, Chamba, Dharamshala, Hamirpur,
Kullu, Mandi, Sundernagar, Una & Yol with a total
investment of Rs. 322 Cr. An expenditure of Rs.
54.17 Crores has been incurred by HPSEBL in the
14 towns of HP as on 31.10.2013. Major works
under this scheme include construction of new sub-
stations, augmentation of transformers having
loading more than 70%, reduction of lengthy HT/LT
lines by installation of new DTRs, spotting of faults
through Fault Passage Indicators (FPIs), etc. The
outlay under this scheme was further revised to Rs.
589.47 Cr. of which Rs. 339 Cr. is proposed to be
implemented during FY16-FY18 by HSPEBL.
Further, under the IPDS scheme, HPSEBL has
proposed for strengthening its network in its 12
circles which shall include development of 2 sub-
stations, 220 ckt kms of 11/22 kV lines, 217 ckt kms
LT lines and 390 distribution transformers. In this
regard, projects amounting to Rs. 110.60 Cr. has
been approved. Circle wise proposed infrastructure
addition under the IPDS scheme is provided in
Table 39 below.
Table 38: Circle-wise Infrastructure addition program under DDUGJY
Sl. No.
Circle
Project Cost
(Rs. In Cr.)
New Substation
(Nos.)
Augmentation Of Power T/F
(Nos.)
Additional Power T/F
(Nos.)
New HT Line
(Km)
New LT Line
(km)
New Distribution Transformer
(Nos.) 33 KV
11/22 KV
1 Una 8.99 1 0 - 3 13.15 92.89 6
2 Kullu 10.51 1 0 - 3 37.62 50.36 21
3 Mandi 33.6 5 6 - 22.5 66.42 293.31 76
4 Chamba 11.93 2 4 - 10 30.7 78.6 1
5 Kangra 31.71 6 9 - 32.2 128.99 97.4 2
6 Solan 8.78 0 4 - 0 30 98.99 29
7 Shimla 32.42 1 0 - 4 78.6 240.7 61
8 Kinnaur 6.52 0 0 - 0 73.19 59 11
9 Lahaul spiti
0.12 0 0 - 0 0.5 2.3 0
10 Sirmour 9.72 0 4 - 0 7 167.74 0
11 Bilaspur 2.23 0 2 - 0 4 31.1 0
12 Hamipur 1.9 0 0 - 0 0 39.4 0
Total 158 16 29 - 74.70 470.17 1,251.79 207

Power for All – Himachal Pradesh
Page | 38
Table 39: Circle-wise Infrastructure addition program under IPDS
Sl. No.
Circle
Project Cost
(Rs. In Cr.)
New Substation
(Nos.)
Augmentation Of Power T/F
(Nos.)
Additional Power T/F
(Nos.)
New HT Line
(Km) New LT
Line
(km)
New Distribution Transformer
(Nos.)
33 KV
Line
11 KV / 22 KV
Line
1 Bilaspur 8.83 18.38 25.50 20
2 Dalhousie 3.63 5.60 8.12 11
3 Hamirpur 3.96 9.05 15.41 20
4 Kangra 14.27 1 3.500 26.12 34.10 43
5 Kullu 14.09 1 0.500 25.00 15.20 79
6 Mandi 4.89 7.40 9.84 14
7 Nahan 3.00 9.00 5.50 8
8 Rampur 10.81 45.40 7.89 34
9 Rohru 13.21 10.00 41.40 21
10 Shimla 7.56 10.70 9.48 19
11 Solan 14.22 28.99 13.70 60
12 Una 12.13 24.27 30.96 61
Total 111 2 0 0 4 220 217 390
Table 40: Circle-wise Infrastructure addition program under R-APDRP
Sl. No.
Circle
Project Cost
(Rs. In Cr.)
New Substation
(Nos.)
Augmentation Of Power T/F
(Nos.)
Additional Power T/F
(Nos.)
New HT Line
(Km)
New LT
Line
(km)
New Distribution Transformer
(Nos.)
33 KV
Line
11 KV / 22 KV Line
1 Bilaspur 8.63 11.880 11.875 230
2 Dalhousie 2.93 9.43 18
3 Hamirpur 6.46 13.240 4.780 22
4 Kangra 17.28 6.000 25.530 47.765 67
5 Kullu 7.4 10.900 4.622 58
6 Mandi 19.24 1 1 38.080 3.880 58
7 Nahan 42.70 1 1 5 104.520 42.896 243
8 Shimla 120.34 7 1 1 29.63 124.356 5.633 124
9 Solan 106.68 1 2 3 88.75 111.400 35.900 230
10 Una 7.31 16.300 16.91 69
Total 339 10 5 4 129 456 184 1,119
Table 38, Table 39 and Table 40 above provides a
summary of the infrastructure works proposed
under various Central Government sponsored
schemes i.e. DDUGJY, IPDS and R-APDRP to be
taken up by HPSEBL in the state.
Government of Himachal Pradesh Schemes
The Government of HP each year provides funds
for distribution infrastructure planning in tribal and
schedules cast areas. An outlay of Rs. 3.25 Cr and
Rs. 4 Cr. was planned by under Tribal Area Sub-
Plan and Schedule Case Sub-Plan, respectively for
FY2013-14 by HPSEBL.
Rural electrification and RE & System Improvement Plans
HPSEBL has proposed to cover remaining areas
including all villages, households and hemlets and
strengthening of existing unwieldy lengthy HV/LV

Power for All – Himachal Pradesh
Page | 39
network. Also, HPSEBL has proposed RE &
System Improvement plans where emphasis shall
be given on strengthening the Sub-Transmission
and Distribution System for mitigating the low
voltage problem through the following works:
a) 33kV new Substations and its associated lines
b) Augmentation of 33kV Sub Stations
c) Renovation & Modernization of 33/22/11kV
Substations equipment
d) HVDS, replacement of meters, poles, GI Wire
etc.
Consumer Service and Electrification (Circle-wise)
For improving the consumer service and reliability
of power in the 12 operational cirlces, HPSEBL has
proposed the following works to be undertaken upto
FY19:
a) 11/22kV new lines augmentation & re-
organization.
b) New DTRs 11/.4kV 22/.4kV & 33kV
augmentation& new capacitor banks etc.
c) New LT, augmentation, re-
organization/conversion of LT to HT
d) New Service connection.
e) Replacement, augmentation, re-organization
or services
f) Metering of LT & HT
g) Any major T&P
ALDC, System Operation, Communication systems, etc.
Establishment of ALDC and upgradation of system
operations and communication systems is planned
to be implemented with a total expenditure of Rs
41.97 Cr.
New Building
HPSEBL has been facing difficultly in the absence
of its own buildings both residential as well as non-
residential. Therefore, HPSEBL has planned an
outlay of Rs. 5.00 Cr. for providing adequate office
and residential accommodation to the staff of the
Board at all places considering the increased
activities of the Board.
IT Projects
HPSEBL also has plans for undertaking major IT
initiatives for bringing about transparency in their
operations. These initiatives shall include a mix of
new and innovative technologies to provide quality
power and services to the consumers and assist
HPSEBL to maximize its revenue and improve its
collection efficiency. Some of the IT initiatives
planned as part of the capital expenditure are:
Existing Initiatives
- Computerized Billing - GIS/GPS - R-APDRP - ERP
New IT Initiatives
- Smart Grid - Expansion of AMR - Expansion of Computerized Billing - GIS/GPS updation in Non RAPDRP area - SCADA/DMS - R-APDRP Next Phase
A summary of the capital expenditure planned by
HPSEBL under the distribution function is
summarized in Table 41.
Table 41: Capital expenditure in Rs. Cr. under various schemes for HPSEBL
Scheme FY16 FY17 FY18 FY19 Total
Distribution Schemes - OP North 36.30 41.40 45.00 37.20 159.90
Distribution Schemes - OP Central 40.20 24.90 21.60 10.40 97.10
Distribution Schemes - OP South 51.20 50.30 42.10 36.20 179.80
Consumer Services & Electrification Schemes
93.90 118.00 124.00 125.30 461.20
Centrally Sponsored Schemes 162.55 408.51 92.50 - 663.57
IT Works 79.70 86.10 80.42 66.83 313.02

Power for All – Himachal Pradesh
Page | 40
Scheme FY16 FY17 FY18 FY19 Total
GoHP Schemes 6.37 5.64 4.84 3.54 20.39
New Buildings 14.00 13.00 9.60 8.90 45.50
Minor works 13.40 16.10 17.00 18.80 65.30
ALDC Works 18.00 23.50 - - 41.50
TOTAL 515.41 787.38 436.96 307.01 2,046.77
6.5. Funding Plan- HPSEBL
The following table shows the funding
requirement for the distribution plans described
above.
Table 42: Fund Requirement in Rs. Cr. under
various schemes for HPSEBL
Particulars
FY16 FY17 FY18 FY19 Total
Total Capex
515 787 437 307 2,047
(KFW) - 36 36 18 90
(IPDS/DDUVGY)
15 230 25 - 270
R-APDRP Part-B
136 136 68 - 339
R-APDRP Part-A
12 43 55
Financial Institutions (REC)
144 87 58 - 289
Total Available
307 531 186 18 1042
Balance 209 256 251 289 1005
The total fund requirement for the distribution
system works in the state is about Rs. 2,047 Cr, a
significant proportion of close to 50% is currently
un-tied. Rs. 663.57 Cr. is to be funded through the
Central Government Schemes (R-APDRP,
DDUGJY and IPDS). Also, since the State has
already achieved 100% electrification, funds from
various Central Government sponsored schemes
like R-APDRP, DDUGJY and IPDS are limited.
It may be noted that the proposed investment plan
is drawn from the business plan prepared by
HPSEBL as part of submissions to HPERC at the
beginning of the 3rd Control Period i.e. FY2014-15
to FY2018-19. The funds availability and gap
information will under-go a change once the
proposed projects are implemented by HPSEBL
and funding is sought from various financial
institutions.
6.6. Other initiatives
Other initiatives and AT&C Loss reduction
Measures for HPSEBL are as follows:
Computerized Billing and Energy Accounting:
Computerized Billing and Energy Accounting
Package (IT Package) was implemented under the
‘Accelerated Power Development and Reform
Program (APDRP)’ launched by Ministry of Power.
The package included computerization of various
activities of the sub-divisions. The project has been
implemented in 132 subdivisions of 27 divisions
and 12 circles covering more than 12 lakh
consumers. Centralized data center and call center
has also been established at Vidyut Bhawan,
Shimla.
GIS/GPS Based Asset Mapping: HPSEBL has
decided to carry out GIS/GPS based asset mapping
including consumer indexing and valuation of
assets for the whole HPSEB, which will be used as
the base for computerization of billing, energy
accounting, electrical network management and to
create fixed assets registers with its present value
for its three wings namely Generation,
Transmission and Distribution after proper
reconciliation with latest balance sheet of the
Board. Pilot project has since been completed for
operation circle Shimla. For remaining 11 circles,
field related activities of the project have been
completed and approval of data by HPSEBL is in
progress. Updation of GIS/GPS data in 14 R-
APDRP towns has been awarded for next five years
as per the requirement of R-APDRP project.
Implementation of ERP: HPSEBL has awarded
the work of implementation of ERP(SAP) to M/s
TCS which shall cover the following modules:
Financial Management and Accounting, Human
Resource Management including payroll, Project
Management, Materials Management,
Maintenance Management, and Availability Based
Tariff. The first phase of the implementation is
already complete which covers the head-office and
operational circle of Shimla.

Power for All – Himachal Pradesh
Page | 41
SCADA/ DMS: HPSEBL has prepared a pilot
project for the control and monitoring of all un-
manned 33kV and above substations being
commissioned in the State. The control center is
envisaged to be setup at the DR Center Paonta.
Employee Information System: Web based
system for displaying the Personal, Posting,
Promotion Information of Gazetted Employees.
Data Center at Shimla: A data center has been
developed at Shimla which is functional and
modems have been installed at 14 towns for
sourcing of real-time information.
Smart Grid Pilot project: HPSEBL has proposed
to implement Smart Grid Pilot in Kala Amb to
improve the system performance by reduction in
peak power by 6 MVA, reduce outages, improve
consumer engagement and satisfaction. The DPR
of this pilot project has been approved by the Govt.
of India of which Ministry of Power shall bear Rs.
8.92 Crores and the balance funding has to be
arranged by HPSEBL through financial institutions
like REC.
Data Center at Shimla: A data center has been
developed at Shimla which is functional and
modems have been installed at 14 towns for
sourcing of real-time information.
6.7. Rollout Plan
Table 43 shows the distribution infrastructure roll-
out plan for HPSEBL. Addition of 3,338 kms of HT
lines and 3,339 kms of LT lines is proposed which
shall marginally improve the HT:LT line ratio from
1:1.9 to 1:1.8.
6.8. Action Plan & Support Required
In view of the proposed distribution plan, the action
points shown in Table 44 have been identified for
respective stakeholders to be able to make suitable
arrangements for development of adequate
distribution system in the State.
Table 43: Distribution Infrastructure rollout plan for HPSEBL
Item Unit Capacity at the
end of FY15
Addition FY 19 Capacity FY 16 FY 17 FY 18 FY 19
Substation / Transformer
33/11 kV Substations Nos 159 19 16 14 6 214
33/11 kV Capacity MVA 1,102.0 139.9 113.8 102.3 66.1 1,524.1
11/0.4kV LT Distribution Transformer
Nos 27,013 833 930 958 982 30,716
11/0.4kV LT Capacity MVA 2,323.0 75.0 83.7 86.2 88.4 2,656.3
Lines
33kV Feeders Ckt. Kms 3,107 115 99 86 38 3,446
22/15/11 kV Feeders Ckt. Kms 28,834 713 735 753 799 31,835
LT Lines Ckt. Kms 60,700 785 809 829 916 64,040
Table 44: Action Points & Timelines
Stakeholder Action Points
HPSEBL
• Skill upgradation and training to be imparted to employees for using modern technologies like SCADA/ AMR/ Smart Meters etc.
• Identify training needs of employees in various functions of the distribution business and prepare a training calendar.
• Preparation of plan to reduce AT&C losses in high loss circles (greater than 20% AT&C losses) by September 2016
• Program monitoring/ Project Management cell of capex schemes provided in the PFA documents
• Updation of all 11kV feeder data on the PFC portal including non R-APDRP towns
• Roll out of IT systems (metering, billing, collection, energy audit, etc.) created under R-APDRP to other non-RAPDRP areas
Government of India/PFC/REC
• Funds for the unapproved/unfunded capex schemes of HPSEBL

Power for All – Himachal Pradesh
Page | 42
7. Renewable Energy Plan
7.1. Introduction
The state of Himachal Pradesh is endowed with
vast resources of hydro potential and it has ensured
that small hydro power development is provided the
required impetus in terms of enabling policy and
regulatory framework. This has resulted in a
sizeable amount of capacity development in the
Small Hydro Power (SHP) segment i.e. hydro plants
with capacity less than 25 MW in the state.
Currently the state boasts of having an installed
capacity of 371.45 MW of SHPs through more than
80 projects. (Details of the installed SHPs is
provided in Table 52.) HPSEBL also has 18 SHPs
with a total installed capacity of 115.45 MW that
qualify for renewable power.
The state equally has a strong potential of solar
power development and is geared up for significant
capacity additions in the solar segment. The
National Institute of Solar Energy has calculated the
solar potential of 34,000 MW in H.P. With rapid
technological development in solar generation, it
shall be the most competitive in future and therefore
capacity creation within the State should be
catalyzed.
Generation capacity additions in both the segments
of SHP and Solar Power has enabled the state in
meeting its growing RPO requirements. The
renewable capacity addition proposed over the next
five (5) years i.e. 2014-19 is listed in Table 48.
7.2. RPO Obligations
The Hon’ble Himachal Pradesh Electricity
Regulatory Commission notified the HPERC
(Renewable Power Purchase Obligations and its
compliance) Regulations in 2010. The regulations
paved the way for determining the solar and non-
solar RPO requirements through minimum
quantum of purchase (in %) from renewable
sources (in terms of kWh) of total consumption of
energy in the state. The RPO obligations were
specified for three (3) years starting 2010-11.
Considering the state’s potential to develop in a
major renewable energy producer and with the
growing renewable capacity addition in the state,
the Hon’ble Commission amended the RPO
regulations in 2011 and provided a comprehensive
trajectory of solar and non- solar RPOs to be met
by the state over the next ten (10) years. The RPO
obligations are listed in Table 45.
Table 45: RPO Targets for Himachal Pradesh
Year Total RPPO
%age*
Minimum Solar RPPO %age of
the total purchase*
2011-12 10.01 0.01
2012-13 10.25 0.25
2013-14 10.25 0.25
2014-15 10.25 0.25
2015-16 11.25 0.25
2016-17 12.25 0.25
2017-18 13.50 0.50
2018-19 14.75 0.75
2019-20 16.00 1.00
2020-21 17.50 2.00
2021-22 19.00 3.00
*Minimum Quantum of Purchase (in %*) from renewable
sources (in terms of energy in kWh) of total consumption
7.3. Solar Energy Development
Himachal Pradesh, being a hilly State, has
generally clear sky and average solar radiation
levels which favors commercial as well as domestic
generation of solar power. The Commission has
directed HPSEBL to procure solar PV power
considering factors like access to grid, closeness to
load centres, least cost of land, least infrastructure
cost like road, water, transportation etc. and ease
of operation and maintenance, to meet its RPO
requirement, under feed in tariff FIT), for project
capacities upto 5 MW.
HPERC has also initiated mapping of the solar
potential sites and services of Aryabhat Centre of

Power for All – Himachal Pradesh
Page | 43
the Science & Technology Department and NIT
Hamirpur are being availed for this purpose.
HPSEBL is required to procure solar PV power of
about 250 MW by FY2021-22 to meet out its solar
RPOs. However this capacity may go upto 800 MW
due to ambitious target of 1 Lac MW by the year
2021-22 set by Govt. of India.
The Solar purchase obligations as notified by the
Hon’ble Commission are listed in Table 45.
Subsequently, HPERC has now notified the
HPERC (Rooftop Solar PV Grid Interactive based
on Net Metering) Regulations 2015 enabling the
state consumers to opt for Net Metering solar
rooftop systems and avail commercial benefits.
7.4. Other renewable sources
To promote generation of renewable power within
the State, the Commission in its Himachal Pradesh
Electricity Regulatory Commission (Promotion of
Generation from the Renewable Energy Sources
and Terms and Conditions for Tariff Determination)
Regulation, 2012 technical and commercial
principles for determination of tariff from various
non-renewable power plants. As per the
regulations, tariff for plants with capacity of less
than 5 MW shall be determined based on the capital
cost determined by CERC in the RE Regulations,
2012 while for capacities above 5 MW, competitive
bidding route is to be followed.
Being a hydro dominant state, HP has a number of
small hydro plants qualifying under the renewable
energy. HPSEBL itself has 18 SHPs with an
installed capacity of 115.45 MW while 371 MW is
with private developers.
7.5. HIMURJA
Himurja, the State Nodal Agency for
implementation of Non – Conventional Energy
Programs in the state of Himachal Pradesh has
been spearheading the SHP project development.
The agency has outlined an investor friendly SHP
development programme over the last ten (10)
years and till 31st Oct. 2015 small SHPs (upto 5
MW capacity) with an aggregate capacity of
1596.805 MW have been allotted. Three (3)
projects of total 2.70 MW have also been
commissioned in private sector through UNDP-
GEF Programme. Thirteen projects with aggregate
capacity of 16.87 MW have been allotted to
HIMURJA for development in state sector. Out of
these 10 Nos. mini micro hydel projects of total
capacity 2.37 MW have been commissioned in the
interior part of Himachal Pradesh. (Source:
HIMURJA website)
7.6. Renewable Energy Plan
In order to meet the MNRE target for solar energy,
the State has made amendments to its Solar Policy
with an objective to make it more lucrative for solar
plant developers and roof-top solar power plant
developers. The State is also promoting the central
government scheme “Solar Power Scheme for
Unemployed Youths and Farmers” and HPSEBL
shall procure power at Commission approved tariff
from such power producers who wish to install
distributed grid connected Solar Projects in the
State of Himachal Pradesh with capacities starting
50 kW up to 5 MW.
Himurja shall be the state nodal agency for the
scheme. It is expected that a capacity of 84 MW
shall be installed under this scheme. Additionally,
there are applications pending for 60-70 MW solar
power plants to be installed in the State apart from
the 10 MW solar capacity planned by HPPCL and
solar projects planned by the HPSEBL.
HPSEBL has formed a JV company with Solar
Energy Corporation of India in the equity ratio of
74:26 i.e. Himachal Pradesh Solar Power
Corporation Private Limited for execution of a 2.5
MW hybrid (2.0MW Solar+0.5 MW Wind ) at Kaza.
The cost of the project is estimated to be Rs. 30.72
Cr. and application for land acquisition is under
process with forest department.
Further HPSEBL has proposed to undertake 10
solar projects with a total capacity of 5.7 MW at its
various power houses and substations during the
next financial year. The projects are currently under
investigation stage and implementation shall be
subject to approval of the Board of HPSEBL. The
details and estimated cost of the planned solar
projects are provided in Table 46
Table 46: Proposed Solar Projects to be developed
by HPSEBL
Sl. Location Capacity Estimated
Project Cost (Rs. Cr.)
1 Bassi Power House 1 MW 9.00
2 Giri Power House 500 kW 4.50
3 132/33/11 KV sub-Station Gondpur Paonta
500 kW 4.50
4 220/66 kV GSS at Uperla Nangal, Nalagarh Solan
2 MW 18.00
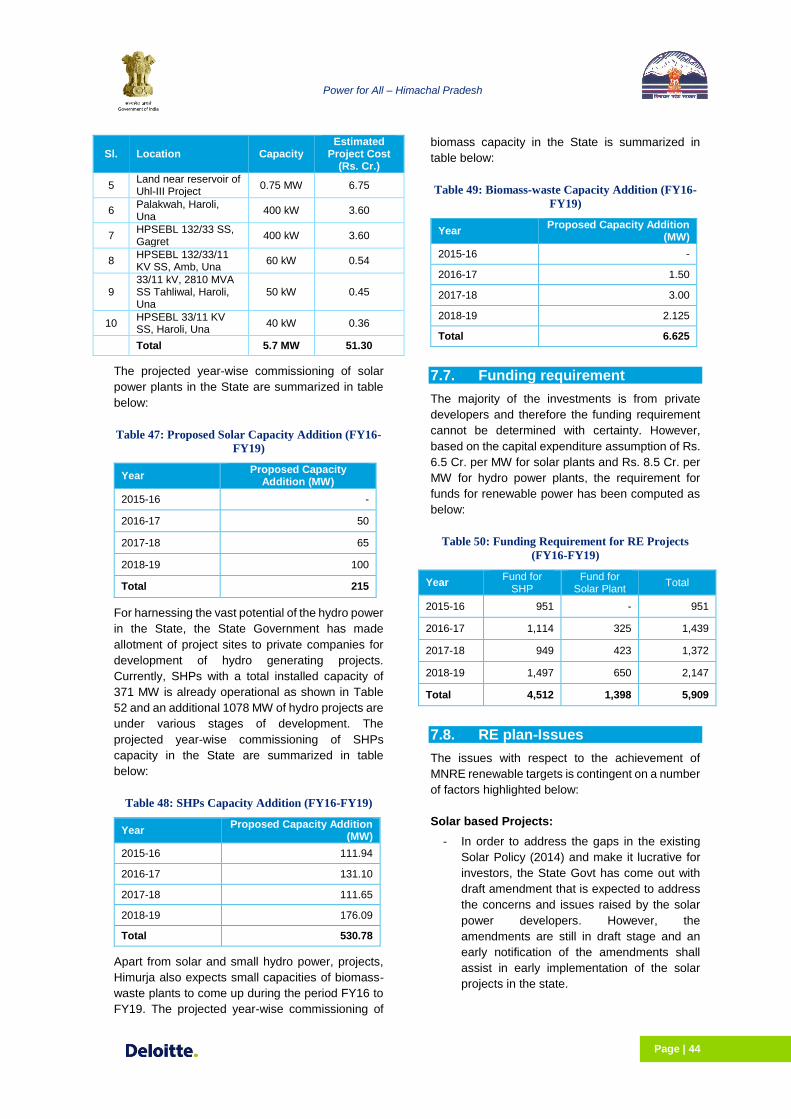
Power for All – Himachal Pradesh
Page | 44
Sl. Location Capacity Estimated
Project Cost (Rs. Cr.)
5 Land near reservoir of Uhl-III Project
0.75 MW 6.75
6 Palakwah, Haroli, Una
400 kW 3.60
7 HPSEBL 132/33 SS, Gagret
400 kW 3.60
8 HPSEBL 132/33/11 KV SS, Amb, Una
60 kW 0.54
9 33/11 kV, 2810 MVA SS Tahliwal, Haroli, Una
50 kW 0.45
10 HPSEBL 33/11 KV SS, Haroli, Una
40 kW 0.36
Total 5.7 MW 51.30
The projected year-wise commissioning of solar
power plants in the State are summarized in table
below:
Table 47: Proposed Solar Capacity Addition (FY16-
FY19)
Year Proposed Capacity
Addition (MW)
2015-16 -
2016-17 50
2017-18 65
2018-19 100
Total 215
For harnessing the vast potential of the hydro power
in the State, the State Government has made
allotment of project sites to private companies for
development of hydro generating projects.
Currently, SHPs with a total installed capacity of
371 MW is already operational as shown in Table
52 and an additional 1078 MW of hydro projects are
under various stages of development. The
projected year-wise commissioning of SHPs
capacity in the State are summarized in table
below:
Table 48: SHPs Capacity Addition (FY16-FY19)
Year Proposed Capacity Addition
(MW)
2015-16 111.94
2016-17 131.10
2017-18 111.65
2018-19 176.09
Total 530.78
Apart from solar and small hydro power, projects,
Himurja also expects small capacities of biomass-
waste plants to come up during the period FY16 to
FY19. The projected year-wise commissioning of
biomass capacity in the State is summarized in
table below:
Table 49: Biomass-waste Capacity Addition (FY16-
FY19)
Year Proposed Capacity Addition
(MW)
2015-16 -
2016-17 1.50
2017-18 3.00
2018-19 2.125
Total 6.625
7.7. Funding requirement
The majority of the investments is from private
developers and therefore the funding requirement
cannot be determined with certainty. However,
based on the capital expenditure assumption of Rs.
6.5 Cr. per MW for solar plants and Rs. 8.5 Cr. per
MW for hydro power plants, the requirement for
funds for renewable power has been computed as
below:
Table 50: Funding Requirement for RE Projects
(FY16-FY19)
Year Fund for
SHP Fund for
Solar Plant Total
2015-16 951 - 951
2016-17 1,114 325 1,439
2017-18 949 423 1,372
2018-19 1,497 650 2,147
Total 4,512 1,398 5,909
7.8. RE plan-Issues
The issues with respect to the achievement of
MNRE renewable targets is contingent on a number
of factors highlighted below:
Solar based Projects:
- In order to address the gaps in the existing
Solar Policy (2014) and make it lucrative for
investors, the State Govt has come out with
draft amendment that is expected to address
the concerns and issues raised by the solar
power developers. However, the
amendments are still in draft stage and an
early notification of the amendments shall
assist in early implementation of the solar
projects in the state.

Power for All – Himachal Pradesh
Page | 45
- Further, as per the present Central
Government policy, the solar energy park
status is provided for solar capacity
installation of 500MW and above. However,
considering the topography of the state, it is
impractical to have such vast continuous
areas of land for solar installations. Therefore
the state had made representation to the
Government of India for relaxation in the
capacity requirement. A prompt approval on
the matter by the Central Government shall
enable installation of solar parks in the state
of HP.
- Some of the large areas of land identified for
the installation of large solar projects are in
the regions far away from the intra-state grid
and therefore shall require building long-
distance transmission lines for evacuation of
power from such solar stations. Central
Government may consider channelizing
resources through CTU or any other scheme
for development of such network.
- For development of solar projects, diversion
of forest land may be required that requires
clearance from the central agencies and
takes up considerable time.
Small Hydro Projects:
- Amendments in 2012 to the Forests Rights
Act 2006, has led to several difficulties in
obtaining forest clearance for various sites.
Post the amendments, the clearance is
required to be granted at various levels
starting from village level committee, district
level committee, state level committee
resulting in further delays.
- Also, as part of amendments, the
transmission line width has been increased
from the earlier 3.5 mt to 15 mt leading to
financial unviability for providing connectivity.
Considering the special category of the state
and its topography, the Central Government
should relax the requirement of 15 mt for the
state.
- With respect to small hydro plants requiring
limited land (i.e. 1-2 hectare), clearance
permissions may be vested to the State
Government. This would facilitate timely
approvals and implementation of the small
SHPs.
Introduction of HPPOs to promote Hydro Power Plants
To encourage more investments in remote hydro
regions and to tap the total available hydropower
(1.45 lac MW) potential of the country, the concept
of Hydro Power Purchase Obligations (HPPOs)
need to be ensured immediately by Government of
India. This needs to be structured for both existing
and future hydro Power Projects. It is imperative
that the Discoms necessarily procures a
percentage of its total consumption from run-of-the-
river hydro power plants on the lines of the
Renewable Power Purchase Obligation (RPPO)
mechanism. This would also provide a safety net for
hydro power developers by guaranteeing the
purchase of electricity. The concept would also
enable the hydro developers to be able to secure
financial closure for development of their hydro
plants easily.
7.9. Action plan items
The action points and support requirements for renewable energy are covered in Table 51 below:
Table 51: Action points for Renewable Energy Plan
Agency Action Plan
State
Government
• Timely finalization of Solar Policy 2014 amendments
• Single window for grant of approvals and clearances to the renewable project developer
Himurja • Continue to provide assistance and support to the private developers
HPSEBL
• Periodical maintenance and repairs of its generating stations
• Long-term arrangements for meeting the demand –supply gap during winter months
Government of
India
• Approval for relaxing the minimum capacity requirement for grant of solar energy park status

Power for All – Himachal Pradesh
Page | 46
Agency Action Plan
• Relaxation to hilly regions for obtaining forest clearance
• Vesting of forest clearance permissions with the State government for small projects having
limited land requirement
• Introduction of policy for Hydro Power Purchase Obligations (HPPOs) in line with the
Renewable Power Purchase Obligation for promotion of run of the river hydro plants and
harnessing the hydro potential in the country
Table 52: Details of SHPs in Himachal Pradesh
Sl. SHP Capacity
in MW Sl. SHP
Capacity in MW
1 Raskat 0.80 43 Jirah (4.00 MW)* 4
2 Titang 0.90 44 IQU-I (4.5 MW) 4.5
3 Dehar 5.00 45 Rakchad (5.00 MW) 5
4 Baragran 4.90 46 Chirchand 5
5 Maujhi 4.50 47 Timbi 3
6 Ching 1.00 48 Binua Parai 5
7 Manal/Chandni 6.00 49 Dehar-II 1.5
8 Aleo 3.00 50 Tarella-III 5
9 Manjhal 1.00 51 Sach 0.9
10 Salag 0.15 52 Rukti-II 5
11 Jiwa Kothari 1.00 53 Sechi 4.5
12 Marhi 5.00 54 Chakshi 2
13 Kothi 0.20 55 Belij 5
14 Juthed 0.10 56 Balsio 5
15 Taraila 5.00 57 Suman Sarwari 2.5
16 Gharola 0.10 57 Suman Sarwari 2.5
17 Bramganga 5.00 58 Masli 5
18 Sahu 5.00 59 Dunali 5
19 Sarbari -1 4.50 60 Panwi 4
20 Upper Awa 5.00 61 Dikleri 2
21 Purthi 0.10 62 Binwa-IV 4
22 Sural 0.10 63 Hamal 2
23 Lingti 0.40 64 Kotlu 1.8
24 IKU-II 5.00 65 Tulang 3
25 Shyang 3.00 66 Belij Ka Nallah 3.5
26 Tarella-II 5.00 67 Billing* 0.4
27 Luni-III 5.00 68 Jogini-II 5
28 Andhra Stage-II 5.00 69 Aleo-II 4.8
29 Lower Baijnath Kuhl 1.00 70 Kalm 2
30 Upper Tarella 5.00 71 Ubharah 2.4
31 Luni-II 5.00 72 Kurtha 5
32 Baner-III 5.00 73 Neogal II 4.5
33 Manglad 4.50 74 Patikari 16

Power for All – Himachal Pradesh
Page | 47
Sl. SHP Capacity
in MW Sl. SHP
Capacity in MW
34 Drinidhar 5.00 75 Toss 10
35 Sainj (5 MW) 5.00 76 sarwari -II 5.4
36 Gurahan (1.5 MW) 1.50 77 Uppper Joiner 12
37 Maujhi-II (5.00 MW) 5.00 78 Sumez 14
38 Palor-I (3.00 MW) 3.00 79 Beas Kund 9
39 Tangling(5.00 MW)* 5.00 80 Neogal 15
40 Gaj-II (1.5 MW) 1.50 81 Kurmi 8
41 Brahal (4.00 MW) 4 82 Jogni 16
42 Upper Khauli (5 MW) 5 83 Nanti 14
Total 371.45

Power for All – Himachal Pradesh
Page | 48
8. Energy Efficiency Plan
8.1. Energy Efficiency Plan
The Directorate of Energy (DoE) in Himachal
Pradesh was created in 2009 with an objective to
look after various activities related to power sector
assigned by the Govt. of HP. Amongst the number of
functions entrusted to the Directorate of Energy, one
of the important function is for Implementation of
Energy Efficiency in the State of HP. Further, the
Directorate of Energy has also been entrusted to act
as the State Designated Agency and proactively
fulfill all the mandates of Electricity Act in co-
ordination with BEE, State Government and other
stakeholders.
In addition to the activities undertaken by DoE, the
State Discom is required to undertake various DSM
activities for balancing the load requirement. In order
to give thrust to the energy efficiency mechanism in
the State, the Himachal Pradesh Electricity
Regulatory Commission (HPERC) had notified DSM
Regulations on 30-09-2011 under which HPSEBL
was required to prepare a DSM Master Plan for 5
years and undertake implementation of the same on
year to year basis after approval of the Commission.
In view of above, HPSEBL had signed a
Memorandum of Understanding (MoU) with the
Bureau of Energy Efficiency (BEE), Govt. of India,
New Delhi on 9th May, 2014 for the capacity building
of Discom Programme under DSM Scheme of BEE.
Against this scheme, BEE shall provide training to
the DISCOM officials, provide financial support for
organizing capacity building workshops and
engagement of Consultants for aforesaid activities
as well for preparation of DSM Action Plan, etc.
Accordingly, BEE has assigned the responsibility of
technical assistance and consultancy support to the
M/s Energy Efficiency Services Ltd. (EESL), an entity
of Ministry of Power Govt. of India and deputed two
consultants to HPSEBL for the purpose. As per the
above MoU, load survey, load research, load
strategies & development of DSM action plan is to be
done by M/s EESL which is currently under process.
8.2. Proposed Schemes
As per the information provided by the Directorate of
Energy, GoHP, the energy efficiency projects are
being implemented in the state of Himachal Pradesh
as per the Annual plan of BEE or the project finalized
in the State Level Steering Committee (SLSC). Since
the projects under both the agencies/ committees
are being finalized only for one year, the planning for
energy efficiency projects is restricted to only one
year. The details of the projects which are presently
under execution are detailed below:
Table 53: Proposed Energy Efficiency Projects in State of HP
Activity Fund Requirement
(Rs. Lacs)
Source of Funding Details of the Project Likely Completion
Demonstration Project – Street Lighting
50 100% Central Govt. Financial Assistance
Street lighting at Municipal Council, Dharamshala, under which 244 no. of inefficient street lights will be retrofitted.
2015-16
LED Village Campaign
20 100% Central Govt. Assistance
Two Rural Panchayats (GP- Drogra in Basantpur block and GP- Bathmana-Jabri in Mashobra Block) in district Shimla has been selected for the LED Village Campaign which shall include distribution of 7 LED Lamps/ bulbs to every household
2015-16
Installation of Solar Water Heaters at Govt. Buildings
30 67% Central & 33% State Govt. Assistance
The SDA Himachal has finalized a project of Rs. 30 Lakh wth Himurja, Shimla for installation of solar water heating systems at six no. of
2015-16

Power for All – Himachal Pradesh
Page | 49
Activity Fund Requirement
(Rs. Lacs)
Source of Funding Details of the Project Likely Completion
Government Buildings including colleges, hospitals, jails etc. The total water heating capacity of this project is 9200 LPD. An advance of Rs 15 Lacs has been released to Himurja on 16/03/2015.w
Municipal Demand Side Management (MuDSM)
138 90% Central & 10% Municipal Council/State Govt.
Finalized for implementation in Municipal Council, Sundernagar. Concent for sharing the 10% project cost has also been submitted by the respective Municipal Council.
2016-17
Agriculture Demand Side Management (AgDSM)
106 64% Central & 36% Irrigation & Public Health/State Govt.
Upgradation (as per new energy efficient technology) of four no. of drinking water pumping Scheme
2016-17
Incentive Scheme for SMEs
50 67% Central & 33% State Govt. Financial Assistance
Promotion of energy audit and energy conservation and efficiency for all SMEs located in HP
2016-17
Domestic Efficient Lighting Programme (DELP)
HPSEBL has signed an Agreement with M/s EESL
on 4th July, 2015 for the implementation of DELP in
the state of Himachal Pradesh. Approval for the
programme has also been granted by the Hon’ble
HPERC vide order HPERC/ MYT3 APR1/ HPSEBL/
2015-16/-330 dated 29.04.2015. The scheme was
launched by the Hon’ble Chief Minister on 7th August,
2015. Under the scheme, each domestic consumer
can avail up to ten LED bulbs of 7 Watt each (3 LED
bulbs on EMI and 7 LED bulbs on upfront mode).
Also, each non-domestic consumer can avail up to
fifteen LED bulbs of 7 watt each (3 LED bulbs on EMI
and 12 LED bulbs on upfront mode) at a price of Rs.
105/- per LED bulb under EMI and Rs. 100/- per LED
bulb on upfront payment mode.
Under the scheme, HPSEBL has planned to
distribute approx. 1.25 Cr. LED bulbs by end of
March 2016. Of the targeted 1.25 Cr. LED bulbs,
40.27 lac bulbs have already been distributed until
12 Jan, 2016.
Urban Smart Street Lighting Project “RISHTA” in
Himachal Pradesh
GoHP on 20 August 2015 launched the Rajiv Gandhi
Illuminating Scheme For Hill Town Advancement
(RISHTA) project, an efficient smart led based street
lighting project. The project is being implemented by
collaboration of State Urban Development
Department and M/s EESL. As part of the project
63,484 street light fixtures in all the ULB’s would be
replaced by LEDs to achieve 45-55% energy savings
besides savings of Rs 3.20 crore per annum in
monetary terms.
First phase of the scheme shall cover Shimla,
Dharamshala, Sundernagar, Paonta Sahib,
Ghumarwin and Manali. While the upfront capital
investment shall be undertaken by EESL for
implementation of project, the municipalities shall
pay back this investment to EESL over a period of 7
years from the energy and cost savings that shall
accrue as a result of installation of energy efficient
led lights.
Other Energy Efficiency Schemes
In addition to the DELP scheme, as part of the DSM
Action Plan which is currently under preparation, a
few potential measures have been identified for
implementation. Since the DSM Action Plan is yet to
be framed and finalized, therefore the
Figure 19: DELP Progress Snapshot of HP's
Dashboard(Jan 2016)

Power for All – Himachal Pradesh
Page | 50
implementation period and funding requirement for
the various activities shall be available post
completion of the DSM Action Plan.
The category-wise potential measures identified as
part of the DSM Action Plan is summarized in Table
54.
8.3. Energy Efficiency Action plan
The preparation of 5 year DSM Action Plan is under
process. Therefore, the action plan for
implementation and funding requirement for the
various activities proposed under the plan shall be
available post finalization.
8.4. Fund Requirement
The fund requirement for the activities planned by
DOE are summarized in Table 53 above while the
fund requirement for HPSEBL DSM/ EE activities
shall be available post finalization of the DSM Action
Plan.
Table 54: Potential DSM Measures for the State of HP
Consumer Category
DSM Measures Present System Proposed System
Domestic Replacement of T12, T8 with 16W LED
Based on sample data, it was observed that 70% of the domestic consumers are utilizing T12 and T8 Fluorescent Tube Light.
Replacement of FTL with 16W LED will give considerable load reduction of about 50%.
Promotion of Energy efficient 5 star rated Fan in place of existing Fans
Based on sample data it was observed that 58% of the domestic consumers are utilising ceiling fan
Replacement of Ceiling fan with BEE 5 star rated fans/Super-efficient fans will give considerable load reduction, 5 star rated fans consume 67% of conventional 75W ceiling fans.
Promotion of Energy efficient 7W LED lighting in place of existing Incandescent bulb
Based on sample data it was observed that 65% of the domestic consumers are utilising Incandescent Bulb
Replacement of Incandescent Bulb with LED lights will give considerable load reduction, as LED lights consume only 12% of conventional 60W Incandescent Bulb
Commercial Replacement of T12, T8 with 16W LED
Based on sample data it was observed that 65% of the commercial consumers are utilising T12 and T8 Fluorescent Tube Light
Replacement of FTL with 16W LED will give considerable load reduction of about 50%
Promotion of Energy efficient 5 star rated Fan/Super efficient fans in place of existing Fans
From the sample data collected it was observed that 61% of the commercial consumers are utilising ceiling fan
Replacement of Ceiling fan with BEE 5 star rated fans will give considerable load reduction, 5 star rated fans consume 67% of conventional 75W ceiling fans.
Promotion of Energy efficient 7W LED lights in place of existing 60W Incandescent Bulb
From the sample data collected it was observed that 41% of the commercial consumers are utilising Incandescent Bulbs (IB).
Replacement of IB with LED lights will give considerable load reduction, as LED lights consume one third of conventional 60W IB used generally
Industry Promoting Installation of Capacitor Banks to improve Reactive Power Management
Around 25% of industries have installed the capacitor and rest of the industries has insufficient capacitors / no capacitors.
Installation of capacitors is important for reactive power management and increasing the plant capacities.
Installation of Capacitor Banks on 11 kV feeders and Substation Bus will reduce the utility demand Per substation and 11 kV feeders from the transformers. The installation of capacitor will improve the system power factor and reduce the system kVA demand.
Agriculture & WPS
Replacement of old in-efficient Agriculture Pumps with new BEE 5 star rated Pumps
Based on the observation and feedbacks during field survey it is observed that the agriculture and WPS category are mostly using old pumps.
Replacement of the old pumps with energy efficient pumps shall reduce the demand in this category
Street Lighting
Installation of Timer controller in Street lights
Based on sample study, no timer controller was installed for switching the Street lights
Installation of timer controller in street lights
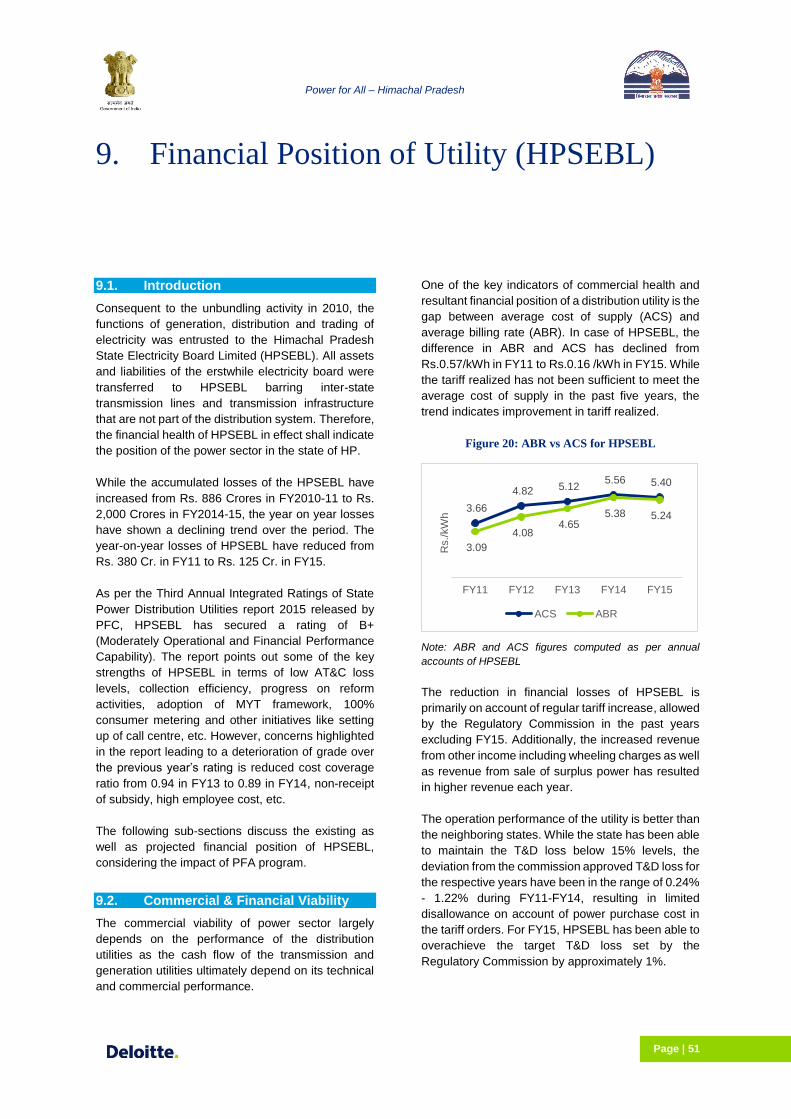
Power for All – Himachal Pradesh
Page | 51
9. Financial Position of Utility (HPSEBL)
9.1. Introduction
Consequent to the unbundling activity in 2010, the
functions of generation, distribution and trading of
electricity was entrusted to the Himachal Pradesh
State Electricity Board Limited (HPSEBL). All assets
and liabilities of the erstwhile electricity board were
transferred to HPSEBL barring inter-state
transmission lines and transmission infrastructure
that are not part of the distribution system. Therefore,
the financial health of HPSEBL in effect shall indicate
the position of the power sector in the state of HP.
While the accumulated losses of the HPSEBL have
increased from Rs. 886 Crores in FY2010-11 to Rs.
2,000 Crores in FY2014-15, the year on year losses
have shown a declining trend over the period. The
year-on-year losses of HPSEBL have reduced from
Rs. 380 Cr. in FY11 to Rs. 125 Cr. in FY15.
As per the Third Annual Integrated Ratings of State
Power Distribution Utilities report 2015 released by
PFC, HPSEBL has secured a rating of B+
(Moderately Operational and Financial Performance
Capability). The report points out some of the key
strengths of HPSEBL in terms of low AT&C loss
levels, collection efficiency, progress on reform
activities, adoption of MYT framework, 100%
consumer metering and other initiatives like setting
up of call centre, etc. However, concerns highlighted
in the report leading to a deterioration of grade over
the previous year’s rating is reduced cost coverage
ratio from 0.94 in FY13 to 0.89 in FY14, non-receipt
of subsidy, high employee cost, etc.
The following sub-sections discuss the existing as
well as projected financial position of HPSEBL,
considering the impact of PFA program.
9.2. Commercial & Financial Viability
The commercial viability of power sector largely
depends on the performance of the distribution
utilities as the cash flow of the transmission and
generation utilities ultimately depend on its technical
and commercial performance.
One of the key indicators of commercial health and
resultant financial position of a distribution utility is the
gap between average cost of supply (ACS) and
average billing rate (ABR). In case of HPSEBL, the
difference in ABR and ACS has declined from
Rs.0.57/kWh in FY11 to Rs.0.16 /kWh in FY15. While
the tariff realized has not been sufficient to meet the
average cost of supply in the past five years, the
trend indicates improvement in tariff realized.
Figure 20: ABR vs ACS for HPSEBL
Note: ABR and ACS figures computed as per annual
accounts of HPSEBL
The reduction in financial losses of HPSEBL is
primarily on account of regular tariff increase, allowed
by the Regulatory Commission in the past years
excluding FY15. Additionally, the increased revenue
from other income including wheeling charges as well
as revenue from sale of surplus power has resulted
in higher revenue each year.
The operation performance of the utility is better than
the neighboring states. While the state has been able
to maintain the T&D loss below 15% levels, the
deviation from the commission approved T&D loss for
the respective years have been in the range of 0.24%
- 1.22% during FY11-FY14, resulting in limited
disallowance on account of power purchase cost in
the tariff orders. For FY15, HPSEBL has been able to
overachieve the target T&D loss set by the
Regulatory Commission by approximately 1%.
3.66
4.82 5.12 5.56 5.40
3.09
4.08 4.65
5.38 5.24
FY11 FY12 FY13 FY14 FY15
Rs./
kW
h
ACS ABR

Power for All – Himachal Pradesh
Page | 52
The approved and actual T&D loss of HPSEBL for the
past five years is provided in Figure 21 below:
Figure 21: HPSEBL Actual and Approved T&D Loss
9.3. Present Financial Performance
Over the last five years, HPSEBL has been posting
financial losses. However, the quantum of loss has
reduced from Rs. 380 Cr. in FY11 to Rs. 125 Cr. in
FY15 primarily on account of increase in revenue
realization due to tariff increases as illustrated in
Figure 23.
While the energy sales of the utility have increased at
a steady rate of 4-4.5% in the last five years, the
revenues from sale of power to consumers within the
state have increased on an average growth of 20%
y-o-y. The regular tariff increase provided by the
Regulatory Commission has largely helped the utility
in achieving lower level of financial losses.
Figure 23: HPSEBL’s Revenue vs PAT in Rs. Cr.
The details of tariff increase effected each year by the
HPERC is summarized below:
FY11 Average Tariff increase of 12.3%
FY12 Average Tariff increase of 8.7%
FY13 Average Tariff increase of 13.5%
FY14 Average Tariff increase of 15.0%
FY15 No Tariff Increase. Rationalization of
Industrial Tariff
HPSEBL’s accumulated losses have been increasing
since FY11. While the increase of the accumulated
losses has been restricted in FY14 & FY15 in view of
the tariff increases, HPSEBL had added losses of
over Rs. 1,200 Cr. during FY11-FY13. These losses
are also due to payments of arrears to central
generating stations which were paid by HPSEBL
during this period. Also, delays in preparation of
12.49% 12.55% 12.40%12.00%
12.80%
12.73%
13.43%13.62%
12.36%
11.84%
FY11 FY12 FY13 FY14 FY15
Approved T&D Loss Actual T&D Loss
2,049
2,821
3,358
4,056 4,124
(380) (513) (340) (137) (125) (1,000)
-
1,000
2,000
3,000
4,000
5,000
FY11 FY12 FY13 FY14 FY15
Revenue from sale of Power to Consumers PAT
FY11 FY12 FY13 FY14 FY15
Profit/ (Losses) in Crores (380) (513) (340) (137) (125)
Accumulated Losses (886) (1,398) (1,739) (1,876) (2,000)
(2,500)
(2,000)
(1,500)
(1,000)
(500)
-
(600)
(500)
(400)
(300)
(200)
(100)
-
Accum
ula
ted P
rofit/
Loss
Annual P
rofit/
Loss
Figure 22: Financial Performance of HPSEBL

Power for All – Himachal Pradesh
Page | 53
audited accounts have resulted in late approval by
the Commission on account of truing-up for the
respective years. The year on year financial losses
and accumulated losses of HPSEBL are provided in
Figure 22.
9.4. Financial Projections
In order to estimate the impact of PFA program on
the financials of a utility, it is pertinent to assess the
incidental cost of the program vis-à-vis the potential
of generating additional revenue due increase in
energy sales. As the utility progresses on achieving
reduction in AT&C losses, the gap between average
cost of supply and average realization is expected to
shrink. In line with above, an analysis has been
carried out to assess the cost impact of PFA program
on tariff as well as financials of the utility. Table 55
presents the assumptions which form the basis for
such projections.
Table 55: Key Common Assumptions underlying financial analysis
Particulars Assumptions
Power purchase
• The firm allocation from the Central Generating Stations shall remain stable at current levels (Nov 2015) over the period of projection (FY16 to FY19).
• Generation from HPSEBL plants based on projections for each year as proposed by HPSEBL in view of the R&M measures proposed for generating plants.
• Commissioning of new plants in State sector assumed as per State’s projections.
• Commissioning of new plants of central sector as per CEA’s monitoring reports.
• Transmission and scheduling charges for FY16 is considered to be Rs. 0.24/kWh, based on charges as per the actual for six months during FY16. An increase of 5% y-o-y has been applied for projection in future years.
Power Purchase Rate
• The present stations have been projected at actual Power Purchase Rate incurred during FY15.
• New power stations are projected at Rs. 4.50/kWh.
• Allocation from un-allocated capacity of CGS has not been considered
Surplus power purchase and sale
• Power available beyond the requirement has been considered to be sold outside State at the rate of Power Purchase for the respective year.
Revenue and Sales growth
• Revenue calculations based on average billing rate as per Tariff Order for FY16.
• Sales growth of domestic consumers is as per projections in Power Supply Scenario (Chapter 3).
• Energy sales growth of other than domestic consumers is 3.2% (YoY) in line with the recent 4-5 trend.
Losses (%)
• Losses projections as per following trajectory:
Particulars FY16 FY17 FY18 FY19
AT&C Loss (%) 12.50% 11.50% 10.50% 10.00%
T&D loss 9.81% 9.24% 8.69% 8.64%
Capex & capitalization
• Capex as per budgeted plans and requirement to fulfill PFA targets of HPSEBL.
• Capitalization has been considered as 60% in the first year and 40% in the subsequent year.
Employee cost, R&M, A&G costs
• Employee cost: Based on employee cost for FY15 with escalation of 10% YoY over the period of projection (FY 16 to FY19) considering the CPI, except for FY17, where an additional 15% escalation has been considered to account for impact of 7th Pay Commission.
• A&G cost: Based on A&G cost for FY15 with escalation of 6% p.a over the period of projection (FY 16 to FY19)
• R&M cost:
• For existing assets: Based on the actual R&M cost as percentage of GFA (Past 2 years Average has been considered)
For New Assets – 1% of GFA in line with the Regulations.
Depreciation • For existing assets: Based on the existing rate of depreciation.
• For new assets: Depreciation rate of 5.28% with maximum allowed depreciation of 90%
Funding of capital expenditure and financing terms
• Capital expenditure to be funded through grant, debt & equity based on schemes under which it has been proposed.

Power for All – Himachal Pradesh
Page | 54
Particulars Assumptions
• Under DDUGJY and IPDS, the ratio of grant, debt and equity is 85%, 10% and 5%, and additional 5% grant if the utility meets its distribution loss trajectory, utilized towards retiring debt
• Unapproved capital expenditure under proposed schemes to be funded through debt equity in the ratio of 90:10 as per the details provided by HPSEBL.
• For other ongoing schemes, funding is based on the tied up debt, equity and envisaged grant portion. For any untied expenditure, debt and equity in the ratio of 70:30 has been considered.
• Repayment schedule of 10 years.
• Interest on existing debt is considered to be based on weighted average existing interest rate, estimate to be 12.40% based on provisional accounts provided for FY15.
• Interest on new debt considered to be 12.5%.
• Debt to Equity ratio assumed at 70:30 under no grants scenario, for schemes under which funds have been tied up under the Central Govt. schemes like R-APDRP, DDUGJY and IPDS.
Working capital and cash deficit loan
• Working capital as per regulatory provisions
• Working capital loan assumed at 13.5%
• Cash deficit during the year is assumed to be funded from short term loan @ 13.5%p.a.
Other income • Based on values for FY15 with YoY escalation of 5% over the period of projection (FY 16 to
FY19)
Regulatory parameters
• No disallowance in power purchase or any other cost element
• No regulatory assets of past have been considered
Considering the above assumptions, the impact of
PFA program on the overall financial health of the
sector can be gauged from the impact on tariff due to
incidental power purchase and additional capital
expenditure to be incurred by HPSEBL. The details
of additional capital expenditure, sources of funding
and incidental costs of such expenditure are provided
in Table 56.
Since HPSEBL has already achieved the key
objectives of the PFA program i.e. connection of un-
electrified households and supplying 24X7 power to
both rural and urban consumers, the capital
expenditure plans of the utility are more focused
towards providing reliable and quality power as well
as upgradation of the sub-transmission and
distribution infrastructure to meet the future
requirement within the State of HP. The utility has
proposed to fund the capital expenditure plan under
various Central and State Government schemes and
support of FIs and multilateral banks. The base case
assumes that the funding from State and Central
Government schemes in the form of grants will be
available but for any non-grant part of the scheme or
un-approved part of those schemes, will be arranged
by utility from the financial institutions like REC and
PFC. The debt to equity ratio is considered to be
90:10, in line with the recent borrowings and details
provided by HPSEBL with respect to funding of
capital investment. In addition to above capital
expenditure related cost, other revenue and
expenditure related parameters considered for base
case are summarized in Table 57
Table 56: Impact of Asset addition (Rs Cr.)
Particulars FY16 FY17 FY18 FY19
Capital expenditure 917 1,189 781 590
Grants 39 246 26 15
Debt 724 767 627 463
Equity 155 176 128 112
Incidental cost of capital expenditure due to PFA
Depreciation on additional assets 23 77 130 168
Interest on debt – corresponding to PFA capex 41 120 185 223
Return on equity - corresponding to PFA capex 19 45 68 87
Total capex related Cost 82 241 383 478

Power for All – Himachal Pradesh
Page | 55
Table 57: Parameters for base case
Particulars Units FY16 FY17 FY18 FY19
Energy related parameters
Sales MUs 8185 8517 8860 9219
T&D losses %age 9.8% 9.2% 8.7% 8.6%
Collection efficiency %age 97.0% 97.5% 98.0% 98.5%
AT&C Losses %age 12.5% 11.5% 10.5% 10.0%
Energy required MUs 9,074 9,384 9,703 10,091
Energy available (ex-bus) MUs 9,288 10,228 11,159 12,077
Energy available at state periphery MUs 9,108 10,046 10,973 11,876
Energy Surplus /(deficit) MUs 34 662 1271 1785
Power Purchase Cost Rs./kWh 2.30 2.25 2.29 2.38
Revenue & expenditure parameters
Tariff Increase %age 0.0% 0.0% 0.0% 0.0%
Average billing rate - Domestic Rs./kWh 4.14 4.14 4.14 4.14
Average billing rate - Other than domestic (weighted avg.)
Rs./kWh 5.47 5.47 5.47 5.47
Employee cost escalation %age 10% 25% 10% 10%
A&G cost escalation %age 6% 6% 6% 6%
Based on the above parameters, the per kWh gap of
incidental cost of providing additional power and
revenue generated due to increase in energy sales is
estimated to assess the impact of PFA program on
the tariff in the State, as summarized in Table 58.
The impact on tariff due to PFA capital expenditure is
expected to remain in the range of Rs. 0.21/kWh in
FY16 to Rs.1.28/kWh in FY19 as can be seen in
Table 58. The higher impact on the ACS is primarily
on account of high capital expenditure planned for
augmentation of the distribution network.
The key reason behind the increase in tariff impact is
the marginal increase in sales. As the state of HP has
already achieved near 100% electrification, the
capital expenditure is primarily aimed at providing
reliable and uninterrupted power resulting in a higher
impact in per unit terms. Also, the higher impact is on
account of limited increase in sales as against the
other constituents of ACS (other than power
purchase cost) which continue to increase in the
subsequent years,
Therefore, in the base case, the financial statements
of HPSEBL have been prepared considering that the
rate of power purchase and tariff shall remain at the
present levels, while the impact of other incidental
cost is accounted.
As can be seen in the P&L statement in Table 59, the
incremental cost due to PFA program may adversely
impact the financial position of the utility. The
financial losses are likely to increase from Rs. 36 Cr.
in FY16 to Rs. 1,066 Cr. in FY19, as the recovery is
not expected to be adequate enough to cover the
various cost elements and incidental PFA program
cost.
Table 58: Impact on tariff due to PFA
Particulars Units FY16 FY17 FY18 FY19
Additional recovery due to incremental energy sales (Rs. Cr.)
A 152 313 480 656
Incremental power purchase cost (inc. transmission charges and incremental transmission cost due to PFA program (Rs. Cr.)
B 111 196 300 442

Power for All – Himachal Pradesh
Page | 56
Particulars Units FY16 FY17 FY18 FY19
Add: Cost related to capital expenditure (interest, depreciation and equity return, Rs. Cr.)
B1 213 751 1088 1394
Gap of additional cost and additional recovery C=(B+B1-
A) 171 634 909 1180
Energy sales (MU) D 8185 8517 8860 9219
Cumulative Impact on tariff (Rs./kWh) 0.21 0.74 1.03 1.28
Table 59: Profit and Loss Account (Rs. Cr.) for Base Case
Particulars FY16 FY17 FY18 FY19
Revenue
Revenue from Sale of Power within State 4,205 4,369 4,538 4,714
Non-Tariff Income 444 447 450 452
Revenue from Sale of Surplus Power 8 149 292 425
Others 145 152 160 168
Total Revenue 4,803 5,117 5,439 5,760
Expenditure
Power Purchase cost 2,339 2,515 2,787 3,125
O&M Cost 1,561 1,940 2,136 2,346
Employee cost 1,446 1,808 1,989 2,188
A&G Expenses 47 50 53 56
R&M Expenses 68 82 95 103
EBIDTA 903 663 516 289
Depreciation 329 383 436 474
Interest and finance charges 610 681 760 881
PBT (36) (401) (680) (1,066)
Provision for tax - - - -
PAT (36) (401) (680) (1,066)

Power for All – Himachal Pradesh
Page | 57
9.5. Scenario Analysis
Any change in tariff or under achievement of AT&C
losses considered for the base case or non-
availability of funding in form of grants will translate
into additional impact on the financial position of the
utility. The impact of existing accumulated losses of
HPSEBL or the impact of purchase and sale of
surplus power available to HPSEBL also need to be
evaluated. Therefore, analysis under following
scenarios have been carried out:
Increase in tariff to ensure that utility
becomes viable by FY19
Non-Availability of grants under the
schemes to fund the capital expenditure
Under achievement of AT&C loss targets:
considering 1% slippage in the T&D loss
level each year, till FY19.
Impact of the Ujwal Discom Assurance
Yojna (UDAY) scheme (transfer of
outstanding liabilities to State
Government)
Scenario 1: Increase in tariff required
for the utility to become viable
While the existing gap between average cost of
supply and average realization is less i.e.
Rs.0.16/kWh, an increase in tariff may be required
to maintain the financial position of the utility and
prevent it from further deterioration due to additional
capital expenditure. In order to achieve financial
viability by FY19, the utility requires an annual tariff
increase of 6.5%, in addition to a complete pass
through of increase in power purchase cost. The
key parameters considered for Scenario are
presented in Table 60
The assessed tariff impact is expected to cover the
change in power purchase cost due to change in
purchase portfolio and the utility will be able to
become financially viable having positive PAT
(YoY) by FY19. The resultant P&L statement under
this scenario is presented in Table 61
Table 60: Parameters for Scenario 1
Particulars Units FY16 FY17 FY18 FY19
Energy related parameters
Sales MUs 8,185 8,517 8,860 9,219
T&D losses %age 9.8% 9.2% 8.7% 8.6%
Collection efficiency %age 97.0% 97.5% 98.0% 98.5%
AT&C Losses %age 12.5% 11.5% 10.5% 10.0%
Energy required MUs 9,074 9,384 9,703 10,091
Energy available (ex-bus) MUs 9,288 10,228 11,159 12,077
Energy available at state periphery MUs 9,108 10,046 10,973 11,876
Energy Surplus /(deficit) MUs 34 662 1271 1785
Power Purchase Cost Rs./kWh 2.30 2.25 2.29 2.38
Revenue & expenditure parameters
Tariff Increase %age 0.0% 6.5% 6.5% 6.5%
Average billing rate - Domestic Rs./kWh 4.14 4.41 4.69 5.00
Average billing rate - Other than domestic (weighted avg.)
Rs./kWh 5.47 5.82 6.20 6.60
Employee cost escalation %age 10.0% 25.0% 10.0% 10.0%
A&G cost escalation %age 6.0% 6.0% 6.0% 6.0%

Power for All – Himachal Pradesh
Page | 58
Table 61: Profit and Loss statement - Scenario 1 (Rs Cr.)
Particulars FY16 FY17 FY18 FY19
Revenue
Revenue from Sale of Power within State 4,205 4,653 5,147 5,695
Non-Tariff Income 444 447 450 452
Revenue from Sale of Surplus Power 8 149 292 425
Others 145 152 160 168
Total revenue 4,803 5,401 6,048 6,740
Expenditure
Power Purchase cost 2,339 2,515 2,787 3,125
O&M Cost 1,561 1,940 2,136 2,346
Employee cost 1,446 1,808 1,989 2,188
A&G Expenses 47 50 53 56
R&M Expenses 68 82 95 103
EBIDTA 903 947 1125 1269
Depreciation 329 383 436 474
Interest and finance charges 610 687 748 784
PBT (36) (123) (59) 11
Provision for tax - - - 4
PAT (36) (123) (59) 7
The projected cash flow statement till FY19 and
projected balance sheet is provide in Annexure 2. It
can be observed from the financial statements that
with 6.5% tariff increase, the HPSEBL will be able
to have a sustained positive PAT from FY19
onwards.
Scenario 2: Non-Availability of grants to fund the capital expenditure (funding through debt and equity)
The dependence of utility on funding of the
proposed investments through various State and
Central Government schemes can be assessed by
the impact on utility’s finances under a scenario
where grant funding is not available. Under this
scenario, the grant availability for the upcoming
Central Government schemes including IPDS and
DDUGJY has been considered to be nil. Table 62
on the following page summarizes the key
parameters underlying the analysis and the impact
on tariff has been detailed in Table 63
Table 62: Parameters for Scenario 2 (Non-Availability of grants)
Particulars Units FY16 FY17 FY18 FY19
Energy related parameters
Sales MUs 8,185 8,517 8,860 9,219
T&D loss %age 9.8% 9.2% 8.7% 8.6%
Collection efficiency %age 97.0% 97.5% 98.0% 98.5%
AT&C losses %age 12.5% 11.5% 10.5% 10.0%
Energy required MUs 9,074 9,384 9,703 10,091
Energy available (ex-bus) MUs 9,288 10,228 11,159 12,077
Energy available at state periphery MUs 9,108 10,046 10,973 11,876
Energy Surplus /(deficit) MUs 34 662 1271 1785

Power for All – Himachal Pradesh
Page | 59
Particulars Units FY16 FY17 FY18 FY19
Power Purchase Cost Rs./kWh 2.30 2.25 2.29 2.38
Revenue & expenditure parameters
Tariff Increase %age 0.0% 0.0% 0.0% 0.0%
Average billing rate - Domestic Rs./kWh 4.14 4.14 4.14 4.14
Average billing rate - Other than domestic (weighted avg.)
Rs./kWh 5.47 5.47 5.47 5.47
Employee cost escalation %age 10.0% 25.0% 10.0% 10.0%
A&G cost escalation %age 6.0% 6.0% 6.0% 6.0%
Capital expenditure funding
Capital expenditure Rs. Cr. 917 1,189 781 590
Grants Rs. Cr. 26 51 5 4
Debt Rs. Cr. 741 935 642 475
Equity Rs. Cr. 163 246 134 112
Table 63: Impact on tariff due to PFA – Scenario 2
Particulars Derivation FY16 FY17 FY18 FY19
Additional recovery due to incremental energy sales (Rs. Cr.)
A 152 313 480 656
Incremental power purchase cost (inc. transmission charges and incremental transmission cost due to PFA program (Rs. Cr.)
B 111 196 300 442
Add: Cost related to capital expenditure (interest, depreciation and equity return, Rs. Cr.)
B1 215 773 1133 1441
Gap of additional cost and additional recovery C=(B+B1-A) 173 657 953 1,228
Energy sales (MU) D 8,185 8,517 8,860 9,219
Cumulative Impact on tariff (Rs./kWh) 0.21 0.77 1.08 1.33
As can be seen in Table 63, the impact on tariff is
expected to increase marginally due to non-
availability of grants to fund the capital expenditure.
The tariff impact for in such scenario is estimated to
range between 0.21 Rs./kWh to 1.33 Rs./kWh as
against the range of 0.21 Rs./kWh to 1.28 Rs./kWh
in base case scenario. Table 64 presents the
projected profit and loss statement of HPSEBL
under this scenario
.
Table 64: Profit and Loss statement - Scenario 2 (Rs. Cr.)
Particulars FY16 FY17 FY18 FY19
Revenue
Revenue from Sale of Power within State 4,205 4,369 4,538 4,714
Non-Tariff Income 444 447 450 452
Revenue from Sale of Surplus Power 8 149 292 425
Others 145 152 160 168
Total revenue 4,803 5,117 5,439 5,760
Expenditure
Power Purchase cost 2,339 2,515 2,787 3,125
O&M Cost 1,561 1,940 2,136 2,346

Power for All – Himachal Pradesh
Page | 60
Particulars FY16 FY17 FY18 FY19
Employee cost 1,446 1,808 1,989 2,188
A&G Expenses 47 50 53 56
R&M Expenses 68 82 95 103
EBIDTA 903 663 516 289
Depreciation 329 388 448 489
Interest and finance charges 611 697 812 961
PBT (38) (422) (743) (1,162)
Provision for tax - - - -
PAT (38) (422) (743) (1,162)
As can be seen above, the annual financial losses
of HPSEBL are expected to increase to nearly Rs.
1,162 Cr. in FY19 as against Rs.1,066 Cr. under
the base case.
Further, as the utility’s cost of funding increases due
to non-availability of grants in this scenario, the
required tariff increase to achieve the financial
turnaround is likely to increase to 6.7% p.a. as
against 6.5% tariff increase required in base case.
The projected cash flow statement till FY19 is
provided in Annexure 3.
Scenario 3: Under achievement of AT&C loss reduction trajectory
Base case analysis, scenario 1 and scenario 2
assumes the achievement of AT&C loss trajectory
by the utility. However, in case the utility misses
T&D loss reduction targets and it remains at 1%
higher than the MoP targets till FY19, the impact on
financial position shall increase due to incremental
power purchase required to meet the demand.
Table 65 summarizes the key parameters
underlying the analysis in scenario 3. There is an
impact on tariff and is expected to be in the range
of 0.24 Rs./kWh to 1.31 Rs./kWh, as against 0.21
Rs./kWh to 1.28 Rs./kWh under the base case. Due
to additional cost and under-achievement of T&D
loss trajectory there is an adverse impact on the
financials of the utility, as presented in Table 66. As
can be seen in Table 67 the annual financial losses
of utility are expected to increase to nearly Rs.
1,110 Cr. in FY19 vis-à-vis Rs. 1,066 Cr. in FY19
under base case, thus emphasizing the need to
remain focused on reduction in AT&C losses.
The required tariff increase to achieve the financial
viability is likely to increase to 6.7% p.a. as against
6.5% in base case.
Table 65: Parameters for Scenario 3 (Under-achievement of T&D losses)
Particulars Units FY16 FY17 FY18 FY19
Energy related parameters
Sales MUs 8,185 8,517 8,860 9,219
T&D loss %age 10.8% 10.2% 9.7% 9.6%
Collection efficiency %age 97.0% 97.5% 98.0% 98.5%
AT&C losses %age 13.5% 12.5% 11.5% 11.0%
Energy required MUs 9,176 9,489 9,810 10,203
Energy available (ex-bus) MUs 9,288 10,228 11,159 12,077
Energy available at state periphery
MUs 9,108 10,046 10,973 11,876
Energy Surplus/(deficit) MUs (68) 558 1,163 1,673
Power Purchase Cost Rs./kWh 2.30 2.25 2.29 2.38
Revenue & expenditure parameters

Power for All – Himachal Pradesh
Page | 61
Particulars Units FY16 FY17 FY18 FY19
Tariff Increase %age 0.0% 0.0% 0.0% 0.0%
Average billing rate-Domestic Rs./kWh 4.14 4.14 4.14 4.14
Average billing rate-Other than domestic (weighted avg.)
Rs./kWh 5.47 5.47 5.47 5.47
Employee cost escalation %age 10.0% 25.0% 10.0% 10.0%
A&G cost escalation %age 6.0% 6.0% 6.0% 6.0%
Table 66: Scenario 3: Impact on tariff – Scenario 3
Particulars Derivation FY 16 FY 17 FY 18 FY 19
Additional recovery due to incremental energy sales (Rs. Cr.)
A 152 313 480 656
Incremental power purchase cost (inc. transmission charges and incremental transmission cost due to PFA program (Rs. Cr.)
B 135 221 327 471
Add: Cost related to capital expenditure (interest, depreciation and equity return, Rs. Cr.)
B1 213 751 1088 1,395
Gap of additional cost and additional recovery C=(B+B1-A) 196 659 935 1,210
Energy sales (MU) D 8,185 8,517 8,860 9,219
Cumulative Impact on tariff (Rs./kWh) 0.24 0.77 1.06 1.31
Table 67: Profit and Loss statement - Scenario 3 (Rs. Cr.)
Particulars FY16 FY17 FY18 FY19
Revenue
Revenue from Sale of Power within State 4,205 4,369 4,538 4,714
Non-Tariff Income 444 447 450 452
Revenue from Sale of Surplus Power 0 126 267 399
Others 145 152 160 168
Total revenue 4,795 5,094 5,414 5,733
Expenditure
Power Purchase cost 2,366 2,515 2,787 3,125
O&M Cost 1,561 1,940 2,136 2,346
Employee cost 1,446 1,808 1,989 2,188
A&G Expenses 47 50 53 56
R&M Expenses 68 82 95 103
EBIDTA 868 639 491 262
Depreciation 329 383 436 475
Interest and finance charges 610 681 766 897
PBT (71) (425) (711) (1,110)
Provision for tax - - - -
PAT (71) (425) (711) (1,110)

Power for All – Himachal Pradesh
Page | 62
Scenario 4: Impact of UDAY Scheme
Under the Ujjwal Discom Assurance Yojna (UDAY)
scheme of the Govt. of India it is envisaged that the
respective State Government will take over the debt
of the State owned Discoms. This will reduce the
interest cost of the utility. Further, with the impact of
schemes aimed towards improving operational
efficiency of the utilities, it is expected that the state
utilities will be reduce their cost elements. Fiscal
discipline along with the remedial actions for
reducing Power Purchase cost and aligning the
AT&C losses are a part of this scheme. This
scenario evaluates the impact of this scheme on the
financials of the utility.
In this scenario it is assumed that the state will take
over 75% of the outstanding debt in two years (50%
in FY16 and 25% in FY17). This will result in
reduction of Interest cost for the Discom.
The opening outstanding liabilities which shall
qualify for this scheme is Rs. 4,048.04 Cr. The
impact on the financial statements are shown in the
following tables.
It can be seen that the losses in FY19 reduce to Rs.
614 Cr. as compared to Rs 1,066 Cr losses in the
base case. The tariff hike required for positive PAT
in FY19 is 4.2% as compared to 6.5% in base case.
Table 68: Parameters for Scenario 4 (UDAY)
Particulars Units FY 16 FY 17 FY 18 FY 19
Energy related parameters
Sales MUs 8,185 8,517 8,860 9,219
T&D losses %age 9.8% 9.2% 8.7% 8.6%
Collection Efficiency %age 97.0% 97.5% 98.0% 98.5%
AT&C Losses %age 12.5% 11.5% 10.5% 10.0%
Energy required MUs 9,074 9,384 9,703 10,091
Energy available (ex-bus) MUs 9,288 10,228 11,159 12,077
Energy available at state periphery Mus 9,108 10,046 10,973 11,876
Energy Surplus /(deficit) MUs 34 662 1271 1785
Power Purchase Cost Rs./kWh 2.30 2.25 2.29 2.38
Revenue & expenditure parameters
Tariff Increase %age 0.0% 0.0% 0.0% 0.0%
Average billing rate - Domestic Rs./kWh 4.14 4.14 4.14 4.14
Average billing rate - Other than domestic (weighted avg.)
Rs./kWh 5.47 5.47 5.47 5.47
Employee cost escalation %age 10.0% 25.0% 10.0% 10.0%
A&G cost escalation %age 6.0% 6.0% 6.0% 6.0%
Table 69: Scenario 4 (UDAY): Impact on tariff
Particulars Derivation FY 16 FY 17 FY 18 FY 19
Additional recovery due to incremental energy sales (Rs. Cr.) A 152 313 480 656
Incremental power purchase cost (inc. transmission charges and incremental transmission cost due to PFA program (Rs. Cr.)
B 111 196 300 442
Add: Cost related to capital expenditure (interest, depreciation and equity return, Rs. Cr.)
B1 213 751 1,088 1,394
Gap of additional cost and additional recovery C=(B+B1-A) 171 634 909 1,180
Energy sales (MU) D 8,185 8,517 8,860 9,219
Cumulative Impact on tariff (Rs./kWh) 0.21 0.74 1.03 1.28

Power for All – Himachal Pradesh
Page | 63
Table 70: Scenario 4 (UDAY): Profit and Loss Statement (Rs.Cr.)
Particulars FY16 FY17 FY18 FY19
Revenue
Revenue from Sale of Power within State 4,205 4,369 4,538 4,714
Non-Tariff Income 444 447 450 452
Revenue from Sale of Surplus Power 8 149 292 425
Others 145 152 160 168
Total revenue 4,803 5,117 5,439 5,760
Expenditure
Power Purchase cost 2,339 2,515 2,787 3,125
O&M Cost 1,561 1,940 2,136 2,346
Employee cost 1,446 1,808 1,989 2,188
A&G Expenses 47 50 53 56
R&M Expenses 68 82 95 103
EBIDTA 903 663 516 289
Depreciation 329 383 436 474
Interest and finance charges 397 335 381 428
PBT 177 (55) (301) (614)
Provision for tax 60 0 0 0
PAT 117 (55) (301) (614)
9.6. Action plan items
As discussed in this Chapter, while the financials of
HPSEBL has been improving over the past few
years, the accumulated losses of the past and the
excess quantum of short-term loans undertaken by
the utility continue to put additional interest cost
burden. Therefore, the action plan as highlighted in
Table 71 below may assist in improving the short-
term and medium-term financial health of HPSEBL:
Table 71: Key Action points
Agency Action Plan
State
Government
• Consider participation in the UDAY Scheme which shall assist in strengthening the financial
position of HPSEBL
HPSEBL
• Pursue tariff increase of 5-6% year on year with the Regulatory Commission to cover the
capital schemes proposed to be implemented
• Consider segment-wise accounting in order to have proper cost allocation between generation
and distribution business

Power for All – Himachal Pradesh
Page | 64
10. Annexures
Annexure 1 :Proposed Transmission Network by HPPTCL
The details of proposed schemes by HPPTCL are details below:
ADB Tranche I
Sl. NAME OF WORK Project Cost
Awarded Company
Disbursements till Dec 2015 (in Crores)
COD Ckt
Kms MVA
Power evacuation
(MW) Mn
USD INR
Crores
1
22/66/220 kV, 31.5 MVA sub station at Bhoktoo with LILO of one circuit of 220 kV Kashang- Bhaba D/C Line
4.330 26.000 L&T 18.85 Dec-15 2 31.5 13
2
220 kV D/C (Twin MOOSE) line from Hatkoti to 220/400 kV Pragati Nagar sub station
10.380 62.280 KEC 26.27 Dec-16 56
554
3
220/400 kV, 1x315 MVA sub station at Pragati Nagar with LILO of both circuits of 400 kV Jhakri- Abdullapur D/C Line
23.930 143.580 ALSTOM 72.33 Dec-16 3 315
4
66/220/400 kV (66/220 kV, 2x80/100 MVA+220/400 kV, 2x315 MVA) GIS sub station at Wangtoo with LILO of both circuits of 220 kV Kashang- Bhaba and 400 kV Wangtoo-Abdullapur D/C Lines at Wangtoo.
51.650 309.900 L&T 30.988 Aug-17 4 630 420
5
33/132 kV, 2x25/31.5 MVA sub station at Chambi (Shahpur)
8.300 49.800 Shyam Indus Power
0 Nov-16 63 44
6
33/132 kV sub station at Pandoh +LILO of one circuit of 132 kV Bajaura- Kangoo D/C Line
6.300 37.800 Shyam Indus Power
0 Aug-16 1 31.5 44
ADB Tranche II
Sl. NAME OF WORK Project Cost
Awarded Company
Disbursements till Dec 2015 (in Crores)
COD Ckt
Kms MVA
Power evacuation
(MW) M
USD INR
Crores
1 66 kV Switching station at Urni
4.683 28.10 Alstom 8.64 May-16 0 45

Power for All – Himachal Pradesh
Page | 65
Sl. NAME OF WORK Project Cost
Awarded Company
Disbursements till Dec 2015 (in Crores)
COD Ckt
Kms MVA
Power evacuation
(MW) M
USD INR
Crores
2
66 kV D/C Line from 66 kV Switching station at Urni to Wangtoo Sub station
2.308 13.85 Karni Mata 0.75 May-16 30
3
33/220/400 kV, (33/220 kV, 50/63 MVA +220/400 kV, 2x315 MVA) P.S at Lahal
38.748 232.49 L&T 23.92 Jun-18 630 793
4
220 kV Line from 33/220 kV Lahal sub station up to 220 kV yard of Budhil HEP
0.802 4.81 MJ
Engineering 0.22 Nov-16 6
5
220 kV D/C (Twin MOOSE) Transmission Line from Sunda to Hatkoti
9.330 55.98 Shyama Power 0 Apr-17 56 443
6 132/220 kV, 2x100 MVA Pooling Station at Sunda
18.000 108.00 0 Jun-17 200 289
7
132 kV D/C LILO line from looping point of 132 KV Dehra Kangra line to 132/33 KV Pooling Substation at Chambi (Shahpur
4.650 27.90 0 Nov-16 24 44
8
220 kV D/C line (Twin MOOSE) from Charor to 400/220 kV Banala sub station of PGCIL
9.400 56.40 RS infra 2.85 Aug-16 30 290
9 132/220 KV Sub-station at Charor
11.830 70.98 0 Apr-17 100 190
ADB Tranche III
Sl. NAME OF WORK
Tentative Project Cost Awarded
Company COD
Ckt Kms
MVA Power
evacuation (MW)
Million USD
INR Crores
1
400 kV D/C line (Twin MOOSE) from 400/220 kV, 2x315 MVA Lahal GISS to 400/220 kV Chamera Pooling station of PGCIL
27.33 164.00 Mar-18
70 793
2 132/220 kV, 2x80/100 MVA GISS Mazra
19.33 116.00 Oct-17
200
400
3 220 kV D/C Line from 132/220 kV GISS Mazra , Chamba to 33/220 kV Karian GISS
10.17 61.00 Mar-17
36
4 66/22 kV, 2x10 MVA GISS at Nirmand (Bagipul)l
6.33 38.00 Jun-17
20
54
5 66 kV D/C Line from 66/22 kV GISS Nirmand to 66/220 kV Kotla sub station
6.33 38.00 Jun-17
42
6 220 kV D/C line (Twin MOOSE) from Bajoli Holi HEP to 400/220 kV Lahal GISS
9.00 54.00 Jun-18
28 400
7 220 kV Switching Station at Hatkoti 10.67 64.00 Apr-17
554

Power for All – Himachal Pradesh
Page | 66
Sl. NAME OF WORK
Tentative Project Cost Awarded
Company COD
Ckt Kms
MVA Power
evacuation (MW)
Million USD
INR Crores
8 33/132 kV Sub Station at Barsaini 8.67 52.00 Apr-17
63
58
9 132 KV D/C line from Barsaini to 132/220 KV Sub-Station at Charor
10.83 65.00 Apr-17
68
REC Funded
Sl. NAME OF WORK Cost
Awarded Company
COD Ckt
Kms MVA
Power evacuation
(MW) INR
Crores
1 i) 33/220 kV 31.5 MVA sub station in the yard of Allain Dhuangan HEP
2.68 M/S Kapil Mohan & Associates,
Jun-16 31.5
30 ii) 33/220 kV, 31.5 MVA transformer 2.22 M/S Vijay Electrical
2 33 kV D/C line between Palchan and 33/220 kV sub station in the yard of Allain Dhuangan HEP
3.41 M/S Kapil Mohan
Aug-16 20
3 i) 33/220 kV, 100 MVA GIS sub station at Phojal
39.2 M/S L & T , Chennai
Completed 100
80 ii) 33/220 kV, 100 MVA transformer 12.56
M/S Transformers & Electricals Kerala
4 220 kV D/C line from LILO point to Phojal
6.84
M/S Hythro Power Corporation Ltd,
Dec-15 20
5 33/220 kV, 50/63 MVA GIS sub station at Karian
29.3 M/S Siemens Ltd, Gurgaon
completed 63
60 6
220 kV S/C line on D/C towers between Karian and 22/400 kV Chamera pooling station of PGCIL
5.55
M/S Case Cold Roll Forming, Gurgaon
Dec-15 6
7 220 kV D/C Kashang- Bhaba line 87.79 M/S Jyoti Structures
Dec-15 76 295
KfW Funded
Sl. Name of Project Cost Ckt
Kms MVA
Power evacuation
(MW) Rs(Crores) Euro(Million)
1 Construction of 22/132 kV substation in the yard of Tangnu Romai HEP
50.00 7.14 63 52
2
Construction of 132 kV D/C line from 22/132 kV substation at Tangnu Romai HEP to 132/220 kV substation at Sunda (>12 km)
26.00 3.71 36 96
3
Construction of 132/220 kV, 2x100 MVA GIS substation at Dehan in Distt. Kangra along with 220 kV D/C Transmission Line (55 Kms) from Dehan substation to 400/220 kV substation f PGCIL at Hamirpur
227.00 32.43 110 200 440
4 Construction of 33/132 kV, 31.5 MVA substation in the yard of Rupin HEP:
28.50 4.07 31.5 55
5
Construction of 132 kV D/C line between 33/132 kV substation at Rupin HEP and 132/220 kV substation at Sunda
38.00 5.43 44 100
6
Construction of 33/220 kV, 50/63 MVA substation at Village Heling in Distt, Chamba by LILO of 220 kV D/C (Twin MOOSE) line between Bajoli Holi HEP and 400/220 kV
60.00 8.57 2 63 45

Power for All – Himachal Pradesh
Page | 67
Sl. Name of Project Cost Ckt
Kms MVA
Power evacuation
(MW) Rs(Crores) Euro(Million)
substation of HPPTCL planned at Lahal
7 Construction of 33 kV GIS switching Station at Palchan in District Kullu
8.40 1.20 - - 57
8
66/220 kV, 80/100 MVA substation in the yard of 132/220 kV Sunda substation along with 66 kV D/C line from Sunda to Andhra
77.00 11.00 10 100 64
9
Construction of 33/132 kV, 2x31.5 MVA GIS substation Sarsadi by LILO of one circuit of 132 kV Barsaini-Charor D/C line in Distt. Kullu
50.00 7.14 - 63 61
10
Construction of 33/132 kV, 2x31.5 MVA GIS sub station near Malana-II (100 MW) power house in Distt. Kullu.
48.00 6.86 - 63 45
11 Providing additional 132/220 kV, 100 MVA Transformer at 132/220 kV, 100 MVA GIS substation at Charor
39.00 5.57 - 100 190
12
Providing additional 33/132 kV, 31.5 MVA Transformer at 33/132 kV, 31.5 MVA GIS substation at Pandoh in Distt. Mandi
24.00 3.43 - 31.5 54
13
Providing additional 400/220 kV, 1x315 MVA transformer in the 400/220 kV substation at Gumma [Pragatinagar] –base substation is funded by ADB- in Distt. Shimla.
70.00 10.00 - 315 170
Total 745.90 106.56 202 1,030 -

Power for All – Himachal Pradesh
Page | 68
Annexure 2 : Planned Transmission System alongwith phased development for upper part of Satluj Basin, Chandrabhaga Basin
The details of planned inter-state transmission system for development is provided below:
Satluj Basin
− SHPs:
− Establishment of 66/220/400 kV GIS Pooling Station at Wangtoo by Mid 2014 to match commissioning of SHPs in Bhaba Khad (57 MW) and Sangla Valley (40 MW) + LILO of 220 kV Kashang- Bhaba D/c Line and LILO of both circuits of 400 kV Karcham Wangtoo-Abdullapur D/c line at Wangtoo.
− Shongtong Karcham :
− Shongtong Karcham – Wangtoo 400 kV D/c Line (Quad HTLS Conductor – Equivalent to about 3000MW) – 18 km
− Switchyard Capacity etc. must be able to handle about 2800-3000MW power planned in the upstream of the generation project. It is proposed that the GIS switchyard may be designed with 4000 Amps switchgear. However, the cable capacity from Pot head yard to GIS switchyard may be augmented with generation addition in the upstream projects.
− Tidong-I (100 MW) & Tidong-II (90 MW) HEP :
− 2x315 MVA (7x10⁵ MVA units) 220/400 kV GIS Pooling Station at Jangi (with 4000 Amps. switchgear) (with space provision for 3rd ICT)
− LILO of one ckt. of Shongtong –Wangtoo 400 kV Line at Jangi
− Tidong – Jangi Pooling Station 220 kV D/c line
− Kashang-I (65 MW), Kashang-II (65 MW), Kashang-III (65 MW) & Kashang-IV (48 MW) HEP:
Kashang –I (65 MW) HEP is under construction and is likely to be commissioned during 2013. For evacuation of power from Kashang-I, HP is constructing a 220 kV D/c line from Bogtu to Kashang. Accordingly, power can be evacuated through Bogtu-Wangtoo-Bhabha 220 kV D/c line. With the commissioning of other stages of Kashang, the power shall be injected at Jangi pooling station. The Transmission scheme for Kashang shall be as given as below:
− Kashang-Jangi Pooling Station 220 kV D/c line
− Chango Yangthang (140 MW):
− Chango Yangthang – Proposed site of Ka Dogri Pooling Station 220 kV D/c line – 18 km
− Proposed Site of Ka Dogri – Jangi Pooling Station 400 kV D/c line (Twin Moose) to be initially charged at 220 kV – 50 km
− Provision of 3rd 400/220 kV ICT (3 nos. of 105 MVA Single Phase units) at Jangi Pooling Station
− Yangthang Khab (261 MW):
− 220 kV Yangthang Khab- Ka Dogri D/c Line with HTLS conductor – adequate for 300 MW capacity – 4 km
− 2x315 MVA (7x10⁵ MVA units) 220/400 kV GIS Pooling Station at Ka Dogri
− Charging of Ka Dogri – Jangi line at 400 kV level
− Direct termination of Chango Yangthang at Ka Dogri Pooling Station
− Khab (636 MW):
− Khab – Jangi Pooling Station 400 kV D/c line – 20 km
− Jangi Thopan (480 MW) & Thopan Powari (480 MW) :
− LILO of one circuit of Jangi Pooling Station – Wangtoo 400 kV D/c (Quad HTLS) line at generation project
− Switchgear Capacity at Generation switchyard must be equivalent to 4000 Amps.
− Ropa (60 MW)

Power for All – Himachal Pradesh
Page | 69
− Direct injection to Jangi Pooling station by a 220 kV D/c line
− The generation of SHPs in the area may be injected at Ropa Generation Switchyard
− Other Projects of Spiti Valley (Satluj Basin)
− The generation of these projects can be injected at Ka Dogri Pooling Station.
− From Killing Lara (40 MW), Lara (60 MW) & Mane Nadang (70 MW), a combined 220 kV D/c line can be constructed upto Lara Sumte HEP. From Lara Sumte HEP(104MW), a high capacity 220 kV line (with twin Moose conductor) can be constructed upto Ka Dogri Pooling Station.
− Augmentation of transformation capacity would be required at Ka Dogri.
Space for 2 additional ICTs of 315 MVA (105 MVA single phase units) would be required. These transformers can be provided progressively matching with the generation addition.
CHANDRABHAGA CORRIDOR-I
− Seli HEP (400 MW):
− 400 kV D/c Line (Twin HTLS-Adequate for about 2000 MW) from Seli to the site of 400 kV Pooling Station near Sissu /Gramphu (Pooling Station shall not be constructed during this time frame)
− From site proposed near Sissu/Gramphu Pooling Station – Hamirpur 400 kV D/c (Triple HTLS – adequate for 2500 MW cap
− Miyar HEP(120 MW) :
− Step up of Miyar generation at 400 kV level
− LILO of one circuit of Seli – Hamirpur (via Rohtang) 400 kV D/c line (Twin HTLS) at Miyar
− Chhatru HEP (120 MW):
− Establishment of 2x315 MVA (7x10⁵ Single Phase units) 400/220 kV GIS Pooling station near Sissu / Gramphu
− Chhatru – Sissu / Gramphu GIS Pooling Station 220 kV D/c line (HTLS adequate for 300 MW per circuit)
− LILO of both circuits of Seli - Hamirpur line at Sissu/ Gramphu GIS Pooling Station.
− Teling & Shangling HEP (94 & 44 MW)
− LILO of one circuit of Chhatru – Sissu / Gramphu Pooling Station 220 kV D/c (HTLS) at Teling
− LILO of one circuit of Chhatru – Sissu / Gramphu Pooling Station 220 kV D/c (HTLS) at Shangling
− Jispa (300 MW):
− Jispa – Sissu / Gramphu Pooling Station 400 kV D/c line
− Bardang HEP (126 MW):
− Step up at 400 kV
− LILO of one circuit of Seli – Sissu / Gramphu Pooling Station 400 kV D/c (Twin HTLS)
− Rasil HEP (130 MW)
− Step up at 400 kV
− LILO of one circuit of Seli – Sissu / Gramphu Pooling Station 400 kV D/c (Twin HTLS)
− Tandi HEP (104 MW)
− Step up at 400 kV
− LILO of one circuit of Seli – Sissu / Gramphu Pooling Station 400 kV D/c (Twin HTLS)
− Pattam HEP (60 MW) :
− Step up at 220 kV
− Pattam – Miyar 220 kV D/c

Power for All – Himachal Pradesh
Page | 70
− Provision of 1x250 MVA(4 nos. of 83.3MVA Single Phase units), 220/400 kV GIS Pooling Station at Miyar. In case of space constraints at Miyar switchyard, a separate pooling station would be required.
− Tignet HEP (81 MW)
− Step up at 220 kV
− LILO of one circuit of Pattam – Miyar 220 kV D/c
CHANDRABHAGA CORRIDOR-II
− Reoli Dugli HEP (420 MW) & Sach Khas (149 MW):
− Generation step up at 400 kV level (for both projects)
− Reoli Dugli– Kishtwar 400 kV D/c (Twin HTLS-Adequate for 1500 MW)
− Establishment of 400 kV switching station at Kishtwar
− LILO of Dulhasti / Ratle – Kishenpur 400 D/c (Quad) line at Kishtwar
− LILO of one circuit of Reoli – Kishtwar at Sach Khas
− Generating Switchyard capacity to be kept for 1500 MW at each Power House.
− Purthi HEP (300 MW):
− Generation step up at 400 kV level
− LILO of one circuit of Reoli – Kishtwar 400 kV D/c at Generating station
− Generating Switchyard capacity to be kept for 1500 MW at Power House.
− Duggar HEP (236 MW):
− Generation step up at 400 kV level
− LILO of one circuit of Reoli – Kishtwar 400 kV D/c at Generating station
− Generating Switchyard capacity to be kept for 1500 MW at Power House.

Power for All – Himachal Pradesh
Page | 71
Annexure 3: Balance Sheet and Cash Flow Statement of Base Case and Scenarios
Base case scenario
Balance Sheet FY 16 FY 17 FY 18 FY 19
Current Assets
Cash @ Bank 339 231 - -
Stocks - Stores 69 81 97 106
Receivables 826 962 1,081 1,180
Total 1,712 1,752 1,655 1,764
Non-current Assets
Gross Fixed Assets 8,127 9,714 10,637 11,305
Less: Accumulated Depreciation (2,129) (2,512) (2,948) (3,422)
Intangible Assets 16 16 16 16
Non Current Investments 431 431 431 431
Other current assets 1,127 1,127 1,127 1,127
Loans and Advances 190 190 190 190
Other Non-current assets 146 146 146 146
Capital Works in Progress 793 149 (20) (113)
Net Fixed Assets 8,700 9,260 9,579 9,680
Total Assets 10,411 11,011 11,234 11,444
Liabilities
Long Term Debt 1,642 2,149 2,454 2,550
Other Long-Term Debt 1,621 1,621 1,621 1,621
Working Capital Loan/ Short term borrowings 2,073 2,129 2,167 2,195
Cash deficit loan - - 382 1,380
Trade payables 2,050 2,065 2,087 2,116
Short term provisions 171 171 171 171
Current Liabilities 2,104 2,104 2,104 2,104
Total 9,661 10,240 10,988 12,137
Equity
Share Capital 736 912 1,040 1,152
Grants 39 285 311 327
Capital Liabilities - - - -
Retained Earnings (24) (425) (1,105) (2,172)
Total 751 772 246 (693)
Total Liabilities 10,411 11,011 11,234 11,444
Cash Flow Statement FY 16 FY 17 FY 18 FY 19
Cash from Operations
Revenue 4,677 5,009 5,349 5,690
Operating Costs (3,900) (4,455) (4,923) (5,471)
Increase in Short term capital requirements 261 (25) (21) (10)

Power for All – Himachal Pradesh
Page | 72
Cash Flow Statement FY 16 FY 17 FY 18 FY 19
Tax - - - -
Net Cash from Operations 1,038 529 405 208
Cash from Investment Activities
Capex (879) (943) (755) (575)
Net Cash from Investment Activities (879) (943) (755) (575)
Cash from Financing Activities
Equity Investments 155 176 128 112
Debt Drawn 724 767 627 463
Loan Repayment (182) (259) (322) (368)
Increase in working capital loan (38) 56 38 28
Payment of past current liabilities - - - -
Grants 39 246 27 15
Interest on cash deficit loan - - (26) (119)
Interest on Loans (515) (578) (626) (650)
Interest on Working Capital Loan (95) (103) (108) (112)
Net Cash from Financing Activities 62 305 (263) (631)
Net Cash Balances
Cash BF 118 339 231 (382)
Cash Flow during the year 221 (108) (613) (998)
Cash 339 231 (382) (1,380)
Cash CF to balance sheet - post deficit loan 339 231 - -
Scenario 1: Tariff Hike
Balance Sheet FY 16 FY 17 FY 18 FY 19
Current Assets
Cash @ Bank 339 501 497 558
Stocks - Stores 69 81 97 106
Receivables 826 1,017 1,201 1,377
Total 1,712 2,077 2,273 2,520
Non-current Assets
Gross Fixed Assets 8,127 9,714 10,637 11,305
Less: Accumulated Depreciation (2,129) (2,512) (2,948) (3,422)
Intangible Assets 16 16 16 16
Non Current Investments 431 431 431 431
Other current assets 1,127 1,127 1,127 1,127
Loans and Advances 190 190 190 190
Other Non-current assets 146 146 146 146
Capital Works in Progress 793 149 (20) (113)
Net Fixed Assets 8,700 9,260 9,579 9,680
Total Assets 10,411 11,336 11,852 12,199
Liabilities
Long Term Debt 1,642 2,149 2,454 2,550

Power for All – Himachal Pradesh
Page | 73
Balance Sheet FY 16 FY 17 FY 18 FY 19
Other Long-Term Debt 1,621 1,621 1,621 1,621
Working Capital Loan/ Short term borrowings 2,073 2,176 2,268 2,358
Cash deficit loan - - - -
Trade payables 2,050 2,065 2,087 2,116
Short term provisions 171 171 171 171
Current Liabilities 2,104 2,104 2,104 2,104
Total 9,661 10,287 10,707 10,920
Equity
Share Capital 736 912 1,040 1,152
Grants 39 285 311 327
Capital Liabilities - - - -
Retained Earnings (24) (148) (207) (199)
Total 751 1,049 1,145 1,279
Total Liabilities 10,411 11,336 11,852 12,199
Cash Flow Statement FY 16 FY 17 FY 18 FY 19
Cash from Operations
Revenue 4,677 5,286 5,946 6,655
Operating Costs (3,900) (4,455) (4,923) (5,471)
Increase in Short term capital requirements 261 (72) (76) (72)
Tax - - - (4)
Net Cash from Operations 1,038 759 947 1,108
Cash from Investment Activities
Capex (879) (943) (755) (575)
Net Cash from Investment Activities (879) (943) (755) (575)
Cash from Financing Activities
Equity Investments 155 176 128 112
Debt Drawn 724 767 627 463
Loan Repayment (182) (259) (322) (368)
Increase in working capital loan (38) 104 92 90
Payment of past current liabilities - - - -
Grants 39 246 27 15
Interest on cash deficit loan - - - -
Interest on Loans (515) (578) (626) (650)
Interest on Working Capital Loan (95) (109) (122) (134)
Net Cash from Financing Activities 62 346 (197) (472)
Net Cash Balances
Cash BF 118 339 501 497
Cash Flow during the year 221 162 (4) 61
Cash 339 501 497 558
Cash CF to balance sheet - post deficit loan 339 501 497 558

Power for All – Himachal Pradesh
Page | 74
Scenario 2: Grants not available
Balance Sheet FY 16 FY 17 FY 18 FY 19
Current Assets
Cash @ Bank 325 - - (0)
Stocks - Stores 69 81 97 106
Receivables 826 962 1,081 1,180
Total 1,698 1,521 1,655 1,764
Non-current Assets
Gross Fixed Assets 8,127 9,714 10,637 11,305
Less: Accumulated Depreciation (2,130) (2,517) (2,965) (3,454)
Intangible Assets 16 16 16 16
Non Current Investments 431 431 431 431
Other current assets 1,127 1,127 1,127 1,127
Loans and Advances 190 190 190 190
Other Non-current assets 146 146 146 146
Capital Works in Progress 817 412 265 184
Net Fixed Assets 8,724 9,518 9,847 9,944
Total Assets 10,408 11,039 11,502 11,708
Liabilities
Long Term Debt 1,657 2,315 2,615 2,701
Other Long-Term Debt 1,621 1,621 1,621 1,621
Working Capital Loan/ Short term borrowings 2,073 2,129 2,167 2,195
Cash deficit loan - 70 776 1,887
Trade payables 2,050 2,065 2,087 2,116
Short term provisions 171 171 171 171
Current Liabilities 2,104 2,104 2,104 2,104
Total 9,677 10,475 11,542 12,795
Equity
Share Capital 744 990 1,124 1,236
Grants 14 22 27 30
Capital Liabilities - - - -
Retained Earnings (26) (448) (1,191) (2,353)
Total 732 564 (40) (1,086)
Total Liabilities 10,408 11,039 11,502 11,708
Cash Flow Statement FY 16 FY 17 FY 18 FY 19
Cash from Operations
Revenue 4,677 5,009 5,349 5,690
Operating Costs (3,900) (4,455) (4,923) (5,471)
Increase in Short term capital requirements 261 (25) (21) (10)
Tax - - - -
Net Cash from Operations 1,038 529 405 208
Cash from Investment Activities

Power for All – Himachal Pradesh
Page | 75
Cash Flow Statement FY 16 FY 17 FY 18 FY 19
Capex (903) (1,181) (776) (587)
Net Cash from Investment Activities (903) (1,181) (776) (587)
Cash from Financing Activities
Equity Investments 163 246 134 112
Debt Drawn 741 935 642 475
Loan Repayment (184) (278) (342) (389)
Increase in working capital loan (38) 56 38 28
Payment of past current liabilities - - - -
Grants 14 8 5 4
Interest on cash deficit loan - (5) (57) (180)
Interest on Loans (516) (589) (647) (670)
Interest on Working Capital Loan (95) (103) (108) (112)
Net Cash from Financing Activities 59 271 (335) (732)
Net Cash Balances
Cash BF 118 311 (70) (776)
Cash Flow during the year 193 (381) (707) (1,111)
Cash 311 (70) (776) (1,887)
Cash CF to balance sheet - post deficit loan 311 - - -
Scenario 3: Under-achievement of T&D loss target
Balance Sheet FY 16 FY 17 FY 18 FY 19
Current Assets
Cash @ Bank 304 172 - (0)
Stocks - Stores 69 81 97 106
Receivables 826 962 1,081 1,180
Total 1,677 1,693 1,655 1,764
Non-current Assets
Gross Fixed Assets 8,127 9,714 10,637 11,305
Less: Accumulated Depreciation (2,129) (2,512) (2,948) (3,422)
Intangible Assets 16 16 16 16
Non Current Investments 431 431 431 431
Other current assets 1,127 1,127 1,127 1,127
Loans and Advances 190 190 190 190
Other Non-current assets 146 146 146 146
Capital Works in Progress 793 149 (19) (101)
Net Fixed Assets 8,700 9,260 9,579 9,692
Total Assets 10,377 10,953 11,235 11,456
Liabilities
Long Term Debt 1,642 2,149 2,455 2,561
Other Long-Term Debt 1,621 1,621 1,621 1,621
Working Capital Loan/ Short term borrowings 2,070 2,129 2,167 2,195
Cash deficit loan - - 472 1,526

Power for All – Himachal Pradesh
Page | 76
Balance Sheet FY 16 FY 17 FY 18 FY 19
Trade payables 2,052 2,065 2,087 2,116
Short term provisions 171 171 171 171
Current Liabilities 2,104 2,104 2,104 2,104
Total 9,661 10,240 11,078 12,294
Equity
Share Capital 736 912 1,040 1,152
Grants 39 285 311 314
Capital Liabilities - - - -
Retained Earnings (59) (484) (1,194) (2,304)
Total 716 714 157 (838)
Total Liabilities 10,377 10,953 11,235 11,456
Cash Flow Statement FY 16 FY 17 FY 18 FY 19
Cash from Operations
Revenue 4,669 4,985 5,324 5,663
Operating Costs (3,927) (4,455) (4,923) (5,471)
Increase in Short term capital requirements 263 (27) (21) (10)
Tax - - - -
Net Cash from Operations 1,005 503 380 182
Cash from Investment Activities
Capex (879) (943) (755) (587)
Net Cash from Investment Activities (879) (943) (755) (587)
Cash from Financing Activities
Equity Investments 155 176 128 112
Debt Drawn 724 767 628 475
Loan Repayment (182) (259) (322) (369)
Increase in working capital loan (40) 59 38 28
Payment of past current liabilities - - - -
Grants 39 246 26 4
Interest on cash deficit loan - - (32) (135)
Interest on Loans (515) (578) (626) (651)
Interest on Working Capital Loan (95) (103) (108) (112)
Net Cash from Financing Activities 60 308 (269) (649)
Net Cash Balances
Cash BF 118 304 172 (472)
Cash Flow during the year 186 (132) (645) (1,054)
Cash 304 172 (472) (1,526)
Cash CF to balance sheet - post deficit loan 304 172 - -
Scenario 4: UDAY Scheme
Balance Sheet FY 16 FY 17 FY 18 FY 19
Current Assets

Power for All – Himachal Pradesh
Page | 77
Balance Sheet FY 16 FY 17 FY 18 FY 19
Cash @ Bank 156 477 325 (0)
Stocks - Stores 69 81 97 106
Receivables 826 962 1,081 1,180
Total 1,529 1,998 1,980 1,764
Non-current Assets
Gross Fixed Assets 8,127 9,714 10,637 11,305
Less: Accumulated Depreciation (2,129) (2,512) (2,948) (3,422)
Intangible Assets 16 16 16 16
Non Current Investments 431 431 431 431
Other current assets 1,127 1,127 1,127 1,127
Loans and Advances 190 190 190 190
Other Non-current assets 146 146 146 146
Capital Works in Progress 793 149 (20) (113)
Net Fixed Assets 8,700 9,260 9,579 9,680
Total Assets 10,229 11,258 11,559 11,444
Liabilities
Long Term Debt 1,174 1,489 1,877 2,054
Other Long-Term Debt 784 575 575 575
Working Capital Loan/ Short term borrowings 1,017 546 584 612
Cash deficit loan - - - 137
Trade payables 2,050 2,065 2,087 2,116
Short term provisions 171 171 171 171
Current Liabilities 2,104 2,104 2,104 2,104
Total 7,301 6,950 7,398 7,770
Equity
Share Capital 736 912 1,040 1,152
Grants 2,063 3,321 3,348 3,363
Capital Liabilities - - - -
Retained Earnings 129 74 (227) (840)
Total 2,928 4,307 4,161 3,674
Total Liabilities 10,229 11,258 11,559 11,444
Cash Flow Statement FY 16 FY 17 FY 18 FY 19
Cash from Operations
Revenue 4,677 5,009 5,349 5,690
Operating Costs (3,900) (4,455) (4,923) (5,471)
Increase in Short term capital requirements 261 (25) (21) (10)
Tax (60) - - -
Net Cash from Operations 978 529 405 208
Cash from Investment Activities
Capex (879) (943) (755) (575)
Net Cash from Investment Activities (879) (943) (755) (575)

Power for All – Himachal Pradesh
Page | 78
Cash Flow Statement FY 16 FY 17 FY 18 FY 19
Cash from Financing Activities
Equity Investments 155 176 128 112
Debt Drawn 724 767 627 463
Loan Repayment (650) (452) (239) (286)
Increase in working capital loan (38) 56 38 28
Payment of past current liabilities - - - -
Grants 2,063 1,258 27 15
Interest on cash deficit loan - - - (9)
Interest on Loans (302) (232) (273) (307)
Interest on Working Capital Loan (95) (103) (108) (112)
Net Cash from Financing Activities (61) 734 199 (95)
Net Cash Balances
Cash BF 118 156 477 325
Cash Flow during the year 38 321 (151) (463)
Cash 156 477 325 (137)
Cash CF to balance sheet - post deficit loan 156 477 325 -