power generation asset management technology roadmap business/technologyinnovation... · this is...
TRANSCRIPT
Power Generation Asset Management
Technology Roadmap
N o v e m b e r 2 0 1 4


P o w e r G e n e r a t i o n A s s e t M a n a g e m e n t T e c h n o l o g y R o a d m a p , N o v e m b e r 2 0 1 4 i
S P E C I A L N O T E F O R T H E N O V E M B E R 2 0 1 4
P O W E R G E N E R A T I O N A S S E T M A N A G E M E N T T E C H N O L O G Y R O A D M A P
This is the first draft of the Power Generation Asset Management
(PG) Technology Roadmap for the Bonneville Power Administration
(BPA) as a result of the roadmapping project between May and
November in 2014.
The PG roadmap project was initiated as a pilot effort comprising a
limited number of technologies areas under the leadership of Steve
Kerns (BPA). The Senior Managers Group in PG identified seven
areas for the initial roadmapping effort in 2014. The initial input to
the workshop was based on a previous document, “PG Technology and
Innovation Roadmap” dated Dec. 5 2013.
Steve Kerns lead interviews and meetings to finalize the drivers and
capability gaps. Subsequently, subject matter experts in each of the
technology areas identified for the pilot met to discuss technology
characteristics and capture in-process research. Finally, a team from
the Portland State University Engineering and Technology
Management Department transcribed the workshop content into
electronic files. These files were reviewed by external and BPA
subject matter representatives who participated in the technical
workshop. The purpose of the first revision is to validate the workshop
transcription and update the document to reflect any changes. This
document is a result of that revision. The second review will be
performed from December to February by a selected expert panels for
a more rigorous fact-check and to provide additional input on R&D
programs and potential technologies.
This roadmap is considered a “living” document. Particularly since the
current document is the culmination of a months-long, multi-stage
process, readers may find errors, omissions, or opportunities to add
other important content that would enhance this resource. The project
team always welcomes opportunities to strengthen this roadmap and
invites all readers to provide critical comment. Input received by
January 15, 2015, will be vetted during the second review and
considered for inclusion in the March 2015 version - this version will
be part of the annual BPA Technology Innovation Office’s Funding
Opportunity Announcement.
For more information about the
Power Generation Asset Management Technology Roadmap
or to offer revision suggestions, contact:
Jisun Kim
Project Manager
(CONTR) AEROTEK
Bonneville Power Administration
[email protected], 503.230.3805

P o w e r G e n e r a t i o n A s s e t M a n a g e m e n t T e c h n o l o g y R o a d m a p , N o v e m b e r 2 0 1 4 i i

P o w e r G e n e r a t i o n A s s e t M a n a g e m e n t T e c h n o l o g y R o a d m a p , N o v e m b e r 2 0 1 4 i i i
L E T T E R O F I N T R O D U C T I O N
At the Bonneville Power Administration we believe that technology
plays a very important role in our ability to continue to provide low
cost, reliable power to the Pacific Northwest. Since 2006, we have
actively invested in a portfolio of research projects intended to help us
achieve our strategic business objectives. Each year new projects are
added while old ones are either completed or pruned.
A key component of the portfolio selection process is the roadmap, in
this case the Power Generation Asset Management (PG) Technology
Roadmap, presented here. This roadmap clearly articulates the
research needed in the Federal Columbia River Power System’s hydro
electric technology area. Researchers throughout academia,
laboratories, and industry can use this roadmap to understand how
their work can benefit BPA and, through BPA, the customers of the
Pacific Northwest.
The roadmap also shows how research in a given area relates to
capability gaps as well as strategic business drivers. Utility executives
and stakeholders can use the roadmap to better understand how
investments in technology can advance BPA’s business objectives. As
we invest in new research and technologies, we must seek to
understand what other utilities, universities, laboratories, and
manufacturers are doing so to avoid duplication of effort or conversely
see opportunities for partnership. The roadmap content was derived
from a workshop with attendees representing utilities, national
laboratories, universities, government agencies, and industry.
Understanding the areas of mutual interest can lead to more
productive, collaborative research.
I would like to use this opportunity thank all of the people who have
contributed to his effort. Total 49 subject matter experts from 27
organizations participated in the workshop. They have provided
content and have contributed their time and expertise to guide the
effort. BPA and external representatives of each area from the
workshop contributed further in fact checking, and in their review and
edits of the workshop output. A team from Portland State University’s
Engineering and Technology Management provided road mapping
expertise and translated the workshop output into the diagrams you
see in this document.
The Power Generation (hydro) Asset Management Technology
Roadmap is being made publicly available after the second revision
from December to February so that the entire industry may benefit.
The seven roadmaps in this document represent only part of BPA
areas of interest. More work is needed to articulate research needs in
the remaining technology areas identified during this process. It is my
hope that others within the industry will find this roadmap useful and
will apply this methodology to guide their research investments.
Together we can ensure that the right technologies are available for
the continued delivery of low cost reliable electric power for
generations to come.
Terry Oliver
Chief Technology Innovation Officer
Bonneville Power Administration

P o w e r G e n e r a t i o n A s s e t M a n a g e m e n t T e c h n o l o g y R o a d m a p , N o v e m b e r 2 0 1 4 i v

P o w e r G e n e r a t i o n A s s e t M a n a g e m e n t T e c h n o l o g y R o a d m a p , N o v e m b e r 2 0 1 4 v
E X E C U T I V E S U M M A R Y
Technology roadmaps are used to guide investments in research, to
articulate research questions of interest, and to inform stakeholders of
the potential benefits of new technology. This document represents
Power Generation Asset Management (PG) Technology Roadmap of
Bonneville Power Administration (BPA). This roadmap and the
revisions that will follow may be used in conjunction with BPA’s
annual R&D solicitation. The PG Technology roadmap will be revised
and updated periodically to accurately reflect the current state of
technology. The PG Technology Roadmap pilot effort was established
to develop an entirely new roadmap based on the following principles:
Create a Power Generation Asset Management technology
roadmap that utilizes industry best practices for roadmapping.
Solicit participation from practitioners and other thought
leaders in this sector to guide the BPA Technology Innovation
Office’s investment in research, development, and
demonstration projects of importance to BPA PG.
The core team responsible for developing the roadmap consisted of
BPA Technology Roadmapping Steering Committee, Subject Matter
Representatives of Power Generation Asset Management group, and
the Portland State University Engineering and Technology
Management Department (PSU). BPA provided project management
and subject matter expertise. PSU provided road mapping best
practices and processed workshop output.
This document is a result of the first revision by external and BPA
subject matter representatives who participated in the technical
workshop on November 17, 2014 at Portland. The purpose of the first
revision is to validate the workshop transcription and update the
document to reflect any changes. The second review will be performed
from December to February by a selected expert panels for a more
rigorous fact-check and to provide additional input on R&D programs
and potential technologies. Total 49 subject matter experts from 27
organizations participated in the workshop. They have provided
content and have contributed their time and expertise to guide the
effort. BPA and external representatives of each area from the
workshop contributed further in fact checking, and in their review and
edits of the workshop output. A team from Portland State University’s
Engineering and Technology Management provided road mapping
expertise and translated the workshop output into the diagrams.
The PG roadmap project was initiated as a pilot effort comprising a
limited number of technologies areas under the leadership of Steve
Kerns (BPA). The initial PG roadmap project was proposed to include
eight areas: 1) Flexibility Metrics, 2) Weather Monitoring Site Study,
3) Weather Monitoring Equipment, 4) Hydropower Reliability and Life
Extension, 5) Joint Transmission and Hydropower Modeling, 6) Sub-
Hourly Operations, 7) State Awareness Displays, and 8) Flood
Control.
The Senior Managers Group in PG reviewed the initial list of the
areas and identified total nine roadmap areas: 1) Flexibility
Assessment and Value, 2) Managing Short- and Long-Term Ensemble
Streamflow Forecasts, 3) Variable Resource Forecasting, 4)
Hydropower Reliability and Life Extension, 5) Joint Transmission and
Hydropower Modeling, 6) State Awareness, 7) Flood Risk
Management, 8) Load and Obligations Forecasting, and 9) Aquatic
Nuisance Species (ANS) Prevention and Impact Mitigation.

P o w e r G e n e r a t i o n A s s e t M a n a g e m e n t T e c h n o l o g y R o a d m a p , N o v e m b e r 2 0 1 4 v i
There are two areas which are not included in this phase of the PG
roadmapping effort. The BPA Technology Roadmapping Steering
Committee decided to hold the area of Managing Short- and Long-
Term Ensemble Streamflow Forecast for the following year because of
resource constraints and the scope of a current pilot project. Instead,
some of the content that would have been separately address were
included within Flexibility Assessment and Value. Flood Risk
Management is another area that BPA subject matter experts
recommended not to include as result of discussion with the critical
regional stakeholder for this area, U.S. Army Corps Engineers. There
was concern that addressing it at this time and in this forum would
have created issues with the regional efforts underway to review flood
risk management such as climate change modeling and assessment.
Aquatic Nuisance Species (ANS) Prevention and Impact Mitigation
was the area BPA previously investigated thoroughly with subject
matter experts and stakeholders from BPA and the Pacific Northwest
region. The initial roadmap of this area was drafted from their report,
“Recommendations for Dreissenid Mussel Prevention, Management,
Research, Coordination, and Outreach for the Columbia River Basin:
A Roadmap to Make Strategic Investments in Federal Columbia River
Power System and Technology Innovation Programs”. BPA subject
matter experts in the area and the Technology Roadmapping Steering
Committee concluded that workshop of this area was not necessary.
Internal and external experts who prepared the report revised the
draft roadmap by focusing technologies and research programs, and
the result was included in this document.
This phase of the Power Generation Asset Management Roadmap
project focused on seven areas:
1) Flexibility Assessment and Value
The increase of renewable generation is resulting in changing
requirements for resource adequacy. In response to the addition
of solar generation changing the Net Load profile, the California
ISO is considering adding a flexibility requirement to ensure that
ramping capability and sustainability of generation exist to meet
Net Load peaks. While the concept of resource “flexibility” is
fairly clear, there are currently no agreed upon methodology for
how to measure flexibility. FCRPS hydro generation has very
unique characteristics that warrant research in techniques in
how to measure flexibility.
2) Joint Transmission and Hydropower Modeling
The current state of practice in modeling the FCRPS and BPA’s
transmission assets is to develop an expected or stressed (e.g.
peak) case on the hydro system and use those as generation
inputs to a power flow model to estimate flows on the grid. This
is an iterative process that does not utilize the potential benefits
of developing generation patterns that simultaneously best meet
both transmission and generation constraints. Research would
focus on computational methods and simulation/optimization
algorithms that solve the combined federal power and
transmission system within defined constraints and objective
functions.
3) State Awareness
Large amounts of data are used to assess the current and near-
term state of the FCRPS, and the amount of data is likely to
increase in response to new initiatives (15-minutes scheduling,
zonal/nodal scheduling (EIM), etc.) Conventional approaches
have sought to create displays for similar data types and efficient
navigation between displays. This could be advanced by
researching what data types are used to support routine decisions
and develop data-rich displays that present several data types in
ways that the brain can process more efficiently than the current
standard.
4) Hydropower Reliability and Life Extension
As the facilities age, the conditions degrade, and the likelihood of
equipment damage or failure increases. Such failures can result
in forced outages of units that can hamper BPA’s ability to meet
power demand, the Dam’s ability to meet other operating

P o w e r G e n e r a t i o n A s s e t M a n a g e m e n t T e c h n o l o g y R o a d m a p , N o v e m b e r 2 0 1 4 v i i
constraints, and can force additional spill. Failures can pose
safety risks and unplanned outages can prove costly. As the
equipment ages, the safest approach would be to plan
replacements after the equipment has exceeded its design life and
failure risk has increased, however, funding resources are limited
and this is not always possible. Therefore it is critical to find new
tools to predict failure or damage which could increase safety and
extend the life of the units.
5) Load and Obligations Forecasting
(Definition here)
6) Variable Resource Forecasting
Wind power forecasting can be greatly improved with the
deployment of weather monitoring equipment like anemometers.
In 2009 BPA deployed 14 new anemometers in the Northwest,
bringing BPA’s met tower network up to 20 sites. BPA is
interested in a study that will highlight where the next met tower
should go. This study would identify location for anemometers
that would provide the most benefit to wind power forecasting of
wind generation in the BPA BAA. BPA has traditionally used
anemometers for weather monitoring to support wind power
forecasting. BPA would be interested in investigating alternative
or emerging technologies like SODAR or LIDAR. Studies in the
Midwest showed benefit but the technology has not been testing
in the complex terrain of the Northwest.
7) Aquatic Nuisance Species (ANS) Prevention and Impact
Mitigation
Aquatic Invasive Species (AIS), and particularly dreissenid
mussels, have been receiving increased attention from decision
makers and natural resource agencies in recent years because of
their technical, economic, environmental, and social threats. The
hydroelectric dams that comprise the FCRPS are vulnerable to
operational and maintenance (O&M) impacts resulting from
aquatic nuisance species. Research will seek for technological
solutions to the areas of prevention, management,
mitigation/control, and monitoring of the species
Development of past roadmaps has demonstrated the value in
collaborating with other organizations with similar interests and
needs. Research investments are best leveraged and optimized by
identifying those research themes that are broadly applicable. Proper
alignment of research effort results in mutually-beneficial outcomes.
Any technology roadmap must constantly evolve to reflect accurately
the changing technology landscapes and business environments. This
document accurately reflects the current state of Power Generation
Asset Management Technology research needs in the seven Research
Areas listed above. Continued work is required to maintain the
relevance of this information. The content of the roadmap should be
refreshed periodically as research questions are answered and as new
priorities emerge. The scope of the roadmap can be expanded to
incorporate new roadmaps or even new Research Areas.

P o w e r G e n e r a t i o n A s s e t M a n a g e m e n t T e c h n o l o g y R o a d m a p , N o v e m b e r 2 0 1 4 v i i i

P o w e r G e n e r a t i o n A s s e t M a n a g e m e n t T e c h n o l o g y R o a d m a p , N o v e m b e r 2 0 1 4 i x
T A B L E O F C O N T E N T S
SPECIAL NOTE FOR THE NOVEMBER 2014 ...................................................... I
POWER GENERATION ASSET MANAGEMENT TECHNOLOGY ROADMAP ................... I
LETTER OF INTRODUCTION ........................................................................ III
EXECUTIVE SUMMARY .............................................................................. V
TABLE OF CONTENTS ............................................................................... IX
INTRODUCTION ....................................................................................... 1
What is Roadmapping? ..................................................................................... 3
How to Use This Roadmap ................................................................................ 5
Roadmap “Swim Lane” Definitions ............................................................... 5
What is the difference between a “Technology Characteristic” and a
“Capability Gap?” ......................................................................................... 6
Roadmap Key .................................................................................................... 7
FLEXIBILITY ASSESSMENT AND VALUE ........................................................... 9
JOINT TRANSMISSION AND HYDROPOWER MODELING.................................... 27
STATE AWARENESS ................................................................................ 37
HYDROPOWER RELIABILITY AND LIFE EXTENSION .......................................... 43
LOAD AND OBLIGATIONS FORECASTING ...................................................... 53
VARIABLE RESOURCE FORECASTING ........................................................... 57
AQUATIC NUISANCE SPECIES (ANS) PREVENTION AND IMPACT MITIGATION ....... 63
PROJECT TEAM ..................................................................................... 73
BPA Generation and Asset Management Executive Sponsor ..................... 73
BPA Project Sponsor Team .......................................................................... 73
Project Implementation Team .................................................................... 73
BPA SUBJECT MATTER REPRESENTATIVES AND ROADMAP OWNERS.................. 74
CONTRIBUTORS .................................................................................... 75
Workshop Hosts and Participants, November 17 2014 .............................. 75
P o w e r G e n e r a t i o n A s s e t M a n a g e m e n t T e c h n o l o g y R o a d m a p , N o v e m b e r 2 0 1 4 x

P o w e r G e n e r a t i o n A s s e t M a n a g e m e n t T e c h n o l o g y R o a d m a p , N o v e m b e r 2 0 1 4 1
I N T R O D U C T I O N
“A roadmap is an extended look at the future of a chosen field of
inquiry composed from the collective knowledge and imagination of the
brightest drivers of the change.”
Robert Galvin, former Chairperson of Motorola
Roadmaps are used as communication tools to align technology plans
with organizational strategies, to articulate long-term plans, and to
prioritize research investments. The Bonneville Power Administration
(BPA) has successfully demonstrated the benefits of engaging senior
executives, subject-matter-experts, regional partners, and industry to
develop several technology roadmaps for the utility industry.
Roadmapping serves as the basis for developing a research portfolio
that aligns with strategic agency needs. BPA has earned international
acknowledgement for demonstrating roadmapping best practices,
specifically in reference to the agency’s work in energy efficiency
technology roadmapping. Further evidence of BPA’s ability to use
roadmaps to drive a results-oriented research portfolio to demonstrate
millions of dollars in savings to regional rate payers include energy-
efficient ductless heat pumps and helical shunts for transmission
conductors.
BPA developed its first set of technology roadmaps in 2006 with the
help of Portland State University Engineering and Technology
Management Department. These initial resource have been revised
over the years as needs have changed and best practices have evolved,
but there is always room for improvement.
BPA recognized this when enhancing its roadmaps for energy
efficiency and transmission technologies and has reached out to other
electric utility industry partners to develop roadmaps that would
represent collective research needs. This diverse input is important
because these other organizations represent a broader perspective;
further, their technology needs may be somewhat different from—but
complementary to—BPA’s needs.
To enhance further BPA’s collaborative network within the utility
industry, agency staff also participate in the Research Technology
Management (RTM) Forum, a national technology management
benchmarking group. This entity is comprised of transmission owners
and operators that have an interest in understanding how other
institutions manage research and development (R&D) and have a
desire to adopt the best practices in their own organizations.
In addition to utility and independent system operator (ISO) partners,
BPA has worked closely with the Electric Power Research Institute
(EPRI). EPRI is a recognized international leader in conducting
research and development on behalf of the global utility industry.
EPRI brings together its scientists and engineers, as well as experts
from academia and industry, to help address electric power industry
challenges through collaborative efforts with utilities and ISOs. EPRI
also has been developing technology roadmaps for generation,
transmission, distribution, and end-use customer segments, in
collaboration with its member utilities and ISOs. The perspectives and
expertise at BPA and EPRI complement one other, which has made for
strong teams to develop these technology roadmaps.
This Power Generation Asset Management (PG) Technology Roadmap
specified and centralized research needed in the Federal Columbia
River Power System’s hydro electric technology area. It incorporates
lessons learned from BPA and EPRI collaboration to produce the
National Energy Efficiency Technology Roadmap Portfolio and the

P o w e r G e n e r a t i o n A s s e t M a n a g e m e n t T e c h n o l o g y R o a d m a p , N o v e m b e r 2 0 1 4 2
Collaborative Transmission Technology Roadmap (both of which can
be found at www.bpa.gov/ti).
As with its previous roadmap projects, this document represents a
sub-set of research topics within the fuller “universe” of topics. The
intention is to expand and enhance this resource as needs evolve and
as other opportunities arise to collaborate with external partners.
The Senior Managers Group in BPA PG Power Generation Asset
Management senior managers met to agree upon the content
parameters of the 2014 project phase included in this document. With
this direction, Steve Kerns lead interviews and meetings to finalize
the drivers and capability gaps within each research area.
The technical workshop followed in November to gather “tactical-level”
information from a wider array of technical subject matter experts
from utilities, national laboratories, universities, vendors, and other
research entities from throughout North America. These experts
included those with hands-on roles as operations managers or staff,
plus technical specialists engaged in R&D. They linked R&D
Programs and Technology Characteristics to the Capability Gaps and
Drivers identified by BPA internal discussion.
The first draft of this document is being published in November 2014.
Revisions will be incorporated into a March 2015 version that the BPA
Technology Innovation Office will include in its annual R&D
solicitation.
Table 1 summarizes this schedule. See the appendix for supporting
documentation and minutes from the workshops.
Table 1: Project Implementation
Event Date Summary
Initial Draft May,
2014
The lead of PG Technology Roadmap, Steve
Kerns, drafted initial roadmap by including drivers
and capability gaps from the previous PG focused
research areas
PG Manager
Meeting
Aug,
2014
PG managers convened to establish pilot project
parameters.
Internal
Discussion
Sep. –
Oct.
2014
Strategic experts to articulate key technology
Drivers and the Capability Gaps: Senior leadership,
and Senior-level operational managers.
Workshop Nov. 17,
2014
Tactical subject matter experts to articulate
Technology characteristics required to bridge
Capability Gaps and R&D Program descriptions
needed to develop these characteristics.
Publish Draft
Roadmap
Nov. 26,
2014
First complete draft sent to all workshop
participants and BPA Technology Confirmation and
Innovation Council members.
BPA
Technology
Innovation
Solicitation
March
2015
Revised roadmap to be published as part of BPA’s
annual R&D solicitation
References
Electric Power Research Institute, www.epri.com.
Asher Lessels, Background Paper on Technology Roadmaps, Technology Executive
Committee of the United Nations Framework Convention on Climate Change,
April, 2013, http://unfccc.int/ttclear/sunsetcms/storage/contents/stored-file-
20130522123304914/TEC%20-%20background%20paper%20on%20technology
%20roadmaps.pdf.
Collaborative Transmission Technology Roadmap (Portland, Oreg.: Bonneville Power
Administration), March 2014, www.bpa.gov/ti.
National Energy Efficiency Technology Roadmap Portfolio (Portland, Oreg.: Bonneville
Power Administration), March 2014, www.bpa.gov/ti.

P o w e r G e n e r a t i o n A s s e t M a n a g e m e n t T e c h n o l o g y R o a d m a p , N o v e m b e r 2 0 1 4 3
W H A T I S R O A D M A P P I N G ?
Technology Roadmapping (TRM) is a strategic approach for research
and development (R&D) planning. Since Motorola initiated the use of
TRMs in the 1970s, this planning tool has become standard for R&D-
driven organizations. Robert Galvin, former Chair of Motorola and an
advocate of science and technology roadmaps, defines a roadmap as
“an extended look at the future of a chosen field of inquiry composed
from the collective knowledge and imagination of the brightest drivers
of the change.”
Technology roadmaps provide a framework for future innovations in a
number of key technology areas and ensure that investment in
technology and research is linked to key business drivers and market
trends. These facilitate resource allocation decisions and help optimize
R&D investments. Roadmaps also assist in filtering alternate
technological options and to help decision makers focus on promising
technologies. In today’s competitive business environment it is crucial
to make the right decisions at the appropriate time.
A wide array of public and private organizations use various
roadmapping tools that are readily tailored and eminently scalable.
These tools have been used to develop roadmaps that apply to specific
products, broader technology areas, company-wide strategic plans,
industry-wide alignment, or articulating common national and
international goals. Private firms, non-governmental organizations,
academic institutions, industry consortia, community groups, and
government entities have found technology roadmapping a fruitful
approach.
Concurrent with this diversity are the many applications to which a
tailored roadmapping structure has been put—including the
electronics, aerospace, defense, manufacturing, information
technology, communications, healthcare, and transportation
industries—and also to address pressing policy issues such as
environmental remediation and climate change. Technology roadmaps
have also been used in the energy sector at an increasing rate over the
past decade.
There are four major phases in the roadmapping process:
1) Apply strategic planning tools—such as Strengths,
Weaknesses, Opportunities, and Threats (SWOT)
assessments—to articulate drivers confronting the
organization;
2) Identify desired capabilities to help meet drivers;
3) Use technology forecasting or other methods to identify
technologies to help deliver desired capabilities; and
4) Delineate R&D required to develop desired technologies,
including specification of key research questions.
The purpose and goals of the particular roadmapping project
determine the most suitable approach to take in developing the final
deliverable:
A high-level landscape analysis called an “S–Plan” or Strategic
Plan.
A more detailed product- or capability-focused approach
known as a “T–Plan” or Tactical Plan.
These two categories are not mutually exclusive and, in fact, are quite
complementary. S-Plans can be the first step in understanding the full
landscape of opportunities and challenges, and once these have been

P o w e r G e n e r a t i o n A s s e t M a n a g e m e n t T e c h n o l o g y R o a d m a p , N o v e m b e r 2 0 1 4 4
articulated T-Plans can be developed to go into further detail on
specific priority areas. T-Plans are more likely than S-Plans to be
structured along a time scale not only to link R&D needs with
important drivers (as an S-Plan does) but also to begin to identify
stages of technology development and the necessary teams best
equipped to lead particular work streams.
As with the National Energy Efficiency Technology Roadmap Portfolio
and the Collaborative Transmission Technology Roadmap, this
document has been developed using the S-Plan framework to provide
the data necessary for future refinement of prioritized sections into T-
Plans. Recognizing that these roadmapping projects are highly
collaborative and bring together organizations with broadly-shared
goals but potentially very different corporate cultures, strategic plans,
and legal mandates, neither document attempts to specify a
technology development timeline that would apply to all contributors.
However, collaborating entities may work together in the future to
produce one or more T-Plan timelines to provide guidance to the
research community regarding logical time-sequencing of R&D
activities. Such future collaboration will benefit from the expertise
consolidated within these pages.
References
M. Amer and Tugrul Daim, “Application of Technology Roadmaps for Renewable Energy
Sector,” Technological Forecasting and Social Change 77:8 (2010), 1355–1370.
O. H. Bray and M. L. Garcia, “Technology Roadmapping: The Integration of Strategic
and Technology Planning for Competitiveness,” Innovation in Technology
Management—The Key to Global Leadership: PICMET '97 (Portland
International Conference on Management and Technology), 25–28.
Tugrul Daim, et al., “Technology Roadmapping: Wind Energy for Pacific NW,” Journal
of Cleaner Production 20:1 (Jan. 2012), 27–37.
Tugrul Daim and Terry Oliver, “Implementing Technology Roadmap Process in the
Energy Services Sector: A Case Study of a Government Agency,” Technology
Forecasting and Social Change 75:5 (June 2008), 687–720.
Tugrul Daim, Terry Oliver, and Jisun Kim, Research and Technology Management in
the Electric Industry. New York: Springer, 2013.
D. Fenwick, Tugrul Daim, and N. Gerdsri, “Value Driven Technology Road Mapping
(VTRM) Process Integrating Decision Making and Marketing Tools: Case of
Internet Security Technologies,” Technological Forecasting and Social Change
76:8 (2009), 1055–1077.
R. N. Kostoff and R. R. Schaller, “Science and Technology Roadmaps,” IEEE
Transactions on Engineering Management 48:2 (2001), 132–143.
A. Lamb, Tugrul Daim, and S. Leavengood, “Wood Pellet Technology Roadmap,” IEEE
Transactions on Sustainable Energy 3:2 (2012), 218–230.
A. Nauda and D.L. Hall, “Strategic Technology Planning: Developing Roadmaps for
Competitive Advantage,” PICMET '91 (Portland International Conference on
Management of Engineering and Technology), 745–748.
Robert Phaal, “Technology Roadmapping: A Planning Framework for Evolution and
Revolution,” Technological Forecasting and Social Change 71:1–2 (2004), 5-26.
Robert Phaal, Clare J. P. Farrukh, and David R. Probert, “Technology Roadmapping: A
Planning Framework for Evolution and Revolution,” Technological Forecasting
and Social Change 71:1–2 (Jan.–Feb. 2004), 5–26.
D. R. Probert, Clare J. P. Farrukh, and Robert Phaal, “Technology Roadmapping:
Developing a Practical Approach for Linking Resources to Strategic Goals,”
Proceedings of the Institution of Mechanical Engineers, Part B: Journal of
Engineering Manufacture 217:9 (2003), 1183–1195.
D. R. Probert and M. Radnor, “Frontier Experiences from Industry-Academia
Consortia,” Research Technology Management 42:2 (2003), 27–30.
C. H. Willyard and C. W. McClees, “Motorola’s Technology Roadmapping Process,”
Research Management Sept.-Oct. 1987, 13–19.
J. J. Winebrake, “Technology Roadmaps as a Tool for Energy Planning and Policy
Decisions,” Energy Engineering: Journal of the Association of Energy
Engineering 101:4 (2004), 20–36.

P o w e r G e n e r a t i o n A s s e t M a n a g e m e n t T e c h n o l o g y R o a d m a p , N o v e m b e r 2 0 1 4 5
H O W T O U S E T H I S R O A D M A P
The Power Generation Asset Management Technology Roadmap is a
reference tool designed to be a living, working document. It was not
crafted with any expectation that it would be read from beginning to
end like a traditional report or narrative. Rather, its design allows for
quick reference of technology development research needs within some
important Research Areas.
The content herein is organized into seven roadmaps based on the
original priority research areas that the Senior Managers Group in PG
identified in August 2014. The sections are:
1. Flexibility Assessment and Value
2. Joint Transmission and Hydropower Modeling
3. State Awareness
4. Hydropower Reliability and Life Extension
5. Load and Obligations Forecasting
6. Variable Resource Forecasting
7. Aquatic Nuisance Species (ANS) Prevention and
Impact Mitigation
Roadmap “Swim Lane” Definitions
Roadmap diagrams are composed of the following four “swim lanes”:
Drivers: Critical factors that constrain, enable, or otherwise influence
organizational decisions, operations, and strategic plans, to
include: existing or pending regulations and standards; market
conditions and projections; consumer behavior and preferences;
and organizational goals and culture, among others.
Capability Gaps: Barriers or shortcomings that stand in the way of meeting
Drivers.
Technology Characteristics: Specific technical attributes of a product,
model, system, etc., that are necessary to overcome Capability
Gaps. To be included in the technology roadmap these will either
be: Commercially Available but facing technical barriers needing
to be addressed; or Commercially Unavailable and needing to be
developed.
R&D Programs: The iterative process undertaken at universities, national
laboratories, some businesses, and related organizations to
generate new ideas, evaluate these ideas, and deliver the needed
Technology Characteristics. This represents current and planned
R&D intended to develop models and prototypes, evaluate these in
laboratory settings, demonstrate them in the field, and conduct
engineering and production analyses. The generic abbreviation
“R&D” is to be understood as including, when appropriate, design,
deployment, and demonstration in addition to research and
development.

P o w e r G e n e r a t i o n A s s e t M a n a g e m e n t T e c h n o l o g y R o a d m a p , N o v e m b e r 2 0 1 4 6
What is the difference between a “Technology
Characteristic” and a “Capability Gap?”
A food processing company finds that the machine it currently uses to
peel potatoes removes a significant amount of the flesh of the potato.
Removing too much of the flesh reduces the yield of each processed
potato and this reduced yield means that the company is not getting
as much saleable product out of each unit of potatoes. The company
must also pay increased costs to dispose of their wastes.
Faced with this situation, the company is facing three Drivers: 1) the
desire to increase processing efficiency; 2) the desire to reduce product
unit costs; and 3) the desire to reduce waste disposal costs.
Motivated by these Drivers, company officials are seeking a solution
that will improve the yield of their potato peeling machine. This is
their Capability Gap: A peeling machine that is more efficient than
existing technology.
Company officials take their request to their engineering team and
ask them to develop a solution that will overcome the Capability Gap
and, thereby, meet the three Drivers. The engineering team applies
their technical expertise to suggest that if they were to reduce the
thickness of the peeler blade they would be able to meet the
requirements and overcome the Capability Gap. Thus the engineers
have established a Technology Characteristic: thinner cutting
blades.
The engineers’ next step is to commence an R&D Program in which
they investigate the kinds of metal they could use to create thinner
blades.
The diagram at right illustrates this example:
Drivers:
What are the reasons to
change?
Capability Gaps:
What are the barriers to
change?
Technology Characteristics:
What are the technological
solutions needed to overcome
barriers to change?
R&D Programs:
What are the research
programs and key research
questions to pursue to
develop technological
solutions?
Produce thinner peeler blades using the most appropriate type of metal
ACME, Inc.
Thinner peeler blades
A potato peeling machine that is more efficient than existing technologies
Increase processing efficiency
Decrease waste disposal costs
Reduce product unit costs

P o w e r G e n e r a t i o P o w e r G e n e r a t i o n A s s e t M a n a g e m e n t T e c h n o l o g y R o a d m a p 7
R O A D M A P K E Y
“Sw
im L
an
es”
Research Area :Demand Response
Technology Roadmap
Technology Roadmap:
R&D Program Requirement
Existing R&D Program
Commercially Unavailable Technology
Commercially Available Technology
Capability Gap
Driver
Dri
vers
Cap
ab
ilit
y G
ap
sT
ech
no
log
y
Ch
ara
cte
risti
cs
R&
D
Pro
gra
ms
Product or Service Area Title
Roadmap Title
AVAILABLE TECHNOLOGY CHARACTERISTICS
Technology Characteristics available in the
marketplace needed to address the Capability Gap(s)
above but that are facing technical barriers
CAPABILITY GAP
Product or service performance gap needing to be
addressed; linked to Driver(s) above and
Technology Characteristic(s) below
EXISTING R&D PROGRAM(S)
R&D in progress; shown connected to an R&D Program box only if an R&D program or
project has been identified for the R&D need
R&D PROGRAM DESCRIPTION
R&D programs needed to develop the Unavailable Technology Characteristics linked above or
to help overcome technical barriers that Available Technology Characteristics are facing
UNAVAILABLE TECHNOLOGY CHARACTERISTICS
Technology Characteristics needed to address the
Capability Gap(s) above and not currently available in the
marketplace
10
DRIVER
Driver identified for the linked Capability Gap(s)
This symbol references
other roadmaps
providing insights into
the linkages

P o w e r G e n e r a t i o P o w e r G e n e r a t i o n A s s e t M a n a g e m e n t T e c h n o l o g y R o a d m a p 8
R&D Program Summaries
R&D Program Title. Brief summary of R&D program needed to
develop the associated Unavailable Technology Characteristics or
to help overcome technical barriers that Available Technology
Characteristics are facing.
Key research questions:
1. One or more research questions that subject matter
experts have identified as among the key questions and
topic areas to pursue within the R&D program or project;
numbers provided for identification only and do not imply
prioritization.
Existing research: Institution(s) listed where R&D program(s)
are ongoing.
Brief descriptive summaries of each institution’s R&D
program that may include, where applicable, hyperlinks to
web pages and/or reference to further program details.
R&D Program Title. Brief summary of R&D program needed to
develop the associated Unavailable Technology Characteristics or
to help overcome technical barriers that Available Technology
Characteristics are facing.
Key research questions:
1. One or more research questions that subject matter
experts have identified as among the key questions and
topic areas to pursue within the R&D program or project;
numbers provided for identification only and do not imply
prioritization.
Existing research: None identified.

P o w e r G e n e r a t i o P o w e r G e n e r a t i o n A s s e t M a n a g e m e n t T e c h n o l o g y R o a d m a p 9
F l e x i b i l t y A s s e s s m e n t a n d V a l u e
F L E X I B I L I T Y A S S E S S M E N T A N D V A L U E
Roadmap Area Definition
The increase of renewable generation is resulting in changing
requirements for resource adequacy. In response to the addition of
solar generation changing the Net Load profile, the California ISO is
considering adding a flexibility requirement to ensure that ramping
capability and sustainability of generation exist to meet Net Load
peaks. While the concept of resource “flexibility” is fairly clear, there
are currently no agreed upon methodology for how to measure
flexibility. FCRPS hydro generation has very unique characteristics
that warrant research in techniques in how to measure flexibility.
Summary
The workshop participants noticed a tension between three drivers
(Balancing Reserves for Variable Resource Integration, Reliability,
and Biological Opinion and other High-Priority Operational
Objectives) which represent mostly inviolable constraints relating to
hydro objectives and environmental/fish operations, and the other
drivers (Maximizing Value of FCRPS and Security Constrained
Economic Dispatch) which identify areas of potential hydro flexibility
optimization. “What is feasible vs. what is flexible”
When valuing “flexibility”, team is referring to economic flexibility, i.e.
value created by ability to move generation from one period to another
(not operational flexibility of units to ramp quickly, etc). Two primary
areas of focus: Modeling and optimizing flexibility, and
understanding/mitigating/reducing uncertainty. Regardless of
capability and model results, implementation of risk-informed policy
needs to happen at an executive and regional stakeholder level – the
best optimization model will fail if governing parties do not buy in or
do not understand the significance of 1% exceedance, or the cost of
managing to 0% or 0.01% exceedance, for example. Some of the true
value of this effort may be to better illustrate to decision-makers the
tradeoff between costs and benefits in managing operational
constraints and system flexibility at various points of risk.
The insights and observations of the subject matter experts who
participated in Workshop were presented, summarized, and reviewed
by:
David Dernovsek (Bonneville Power Administration)
Steve Kerns (Bonneville Power Administration)

P o w e r G e n e r a t i o n A s s e t M a n a g e m e n t T e c h n o l o g y R o a d m a p 1 0
F L E X I B I L I T Y A S S E S S M E N T A N D V A L U E
Roadmap Area :
R&D Program Requirement
Existing R&D Program or Project
Commercially Unavailable Technology
Commercially Available Technology
Capability Gap
Driver
Power Generation Asset
Management
Technology Roadmap
Dri
vers
Cap
ab
ilit
y G
ap
sT
ech
no
log
y
Ch
ara
cte
risti
cs
R&
D
Pro
gra
ms
RD12 Short-term to real-time
database guidance tool for trading
group
RD1 TIP 265 in flight projects - Computationally
Efficient, Flexible, Short-Term Hydropower
Optimization and Uncertainty Analysis (SHOA) for
the BPA System
BPA
RD2 TIP 258 in flight - Development of a State-of-
the-Art Computational Framework and Platform for
the Optimal Control of Multi-reservoir Systems
under Uncertainty
BPA
RD3 TIP 259 in flight projects: Short-Term
Hydropower Production and Marketing
Optimization (HyProM)
BPA
D1 Balancing Reserves for Variable Resource Integration: Additional variable resources being built in the BPA Balancing Authority will increase the demand for flexible resources to provide balancing reserves. The FCRPS is running out of flexibility to meet balancing reserve needs within current cost, capability, and commitment constraints.
D2 Reliability: The Northwest Power Pool is considering adding a resource sufficiency standard to ensure that ramping capability and sustainability of generation exist to meet load obligations. Understanding remaining FCRPS flexibility will be critical to meeting resource sufficiency standards.
D3 BiOp and other High-Priority Operational Objectives: FCRPS operational flexibility is essential in meeting Biological Opinion and other high-priority operational objectives, however, sometimes it is not possible to meet all objectives simultaneously. Increased demands on FCRPS flexibility and more generation outages threaten the ability to meet operational objectives.
D4 Maximizing Value of FCRPS: Secondary marketing of any remaining FCRPS flexibility lowers power rates. However, the amount of remaining flexibility for secondary marketing is expected to decrease due to increasing demands for balancing reserves, additional operational constraints, and more generation outages
D5 SCED: The Northwest Power Pool is considering developing an imbalance market that will use a Security Constrained Economic Dispatch (SCED) to dispatch generating units. This will require a determination of an offer curve which will require the ability to determine the opportunity cost of any remaining FCRPS flexibility
CG1 Current multi-objective models for assessing flexibility are unable to provide probabilistic results using fine time resolution.
CG2 Limited understanding of uncertainty that exists within streamflows, loads, obligations, and deployment of balancing reserves in order to determine discretionary FCRPS flexibility.
CG3 Current approach for valuing both obligational and discretionary flexibility is informal.
TC1 Models that produce fast, feasible high resolution studies for FCRPS hydroelectric projects under a number of different operating conditions in order to determine the ability to move generation from one hydro project to another and to/from different time horizons
TC4 State of the art visualization techniques and displays that show uncertainties and remaining operational flexibility
TC12 For real-time trading purpose, development of a regression-based tool that utilizes historical data and searches for most similar condition for decision-support purposes
TC14 Tools that reduce error in the estimation of uncertainty
I. Flexibility Assessment and Value (1/7)

P o w e r G e n e r a t i o n A s s e t M a n a g e m e n t T e c h n o l o g y R o a d m a p 1 1
F L E X I B I L I T Y A S S E S S M E N T A N D V A L U E
R&D Program Summaries
Computationally Efficient, Flexible, Short-Term
Hydropower Optimization and Uncertainty Analysis
(SHOA) for the BPA System. The Short-term Hydropower
Optimization and Analysis (SHOA) is an open-source short-term
reservoir/river modeling system that investigates operation of the
Columbia River Basin and its water management facilities. SHOA
will be used to explore a range of model structures and
computational procedures for addressing BPA’s short-term
reservoir operation challenges, including (1) use of ensemble
streamflow predictions (ESP) to describe hydrologic and load
uncertainty, (2) ensemble representations of load scenarios, (3)
pre-computed powerhouse energy production functions, and (4)
two stage Sampling Stochastic Dynamic Programming (SSDP)
with a compact state-space corridor to identify the best possible
operations. The SHOA system allows the investigation of
alternative stochastic optimization algorithms and uncertainty
representations, and other modeling and optimization innovations,
so that BPA can design a new short-term reservoir-operations
decision support system that will meet needs of power,
environmental conservation, and water management in the
Columbia Basin.
Key research questions:
1. How to model and describe the joint distribution of
forecasts, streamflows, and loads, and the sequential
resolution of the uncertainty as successive decisions?
2. How to develop and evaluate new algorithms for
hydropower operation?
3. What are the metrics to quantify operational flexibility,
and the reliability with which various targets and
obligations can be met?
4. What are the alternative computational strategies to
reduce computational requirements of optimization and
uncertainty analysis of the complex BPA system?
Existing research: BPA TIP 265 in flight projects
Development of a State-of-the-Art Computational
Framework and Platform for the Optimal Control of Multi-
reservoir Systems under Uncertainty. The state‐of-the‐art
model to be developed will (1) handle uncertainty and risk
analysis, (2) quantify operational flexibility, (3) visualize and
display large amounts of complex data to support real‐time and
planning decisions, and (4) support parallel computing that fully
utilizes the advanced capabilities of high performance clusters.
Key research questions:
1. What is the most robust and computationally efficient
hybrid (combined genetic algorithm-local search method)
and parallelizable approach (with no uncertainty)?
2. What innovative model is needed to include uncertainty
with propagation framework?

P o w e r G e n e r a t i o n A s s e t M a n a g e m e n t T e c h n o l o g y R o a d m a p 1 2
F L E X I B I L I T Y A S S E S S M E N T A N D V A L U E
The computer model to be developed will produce simulation,
optimization and visualization results in a small fraction of time
compared to that produced using a single processor as is currently
done at BPA.
3. How flexibility can be model: Developing a flexibility
framework and its implementation into the multi-objective
optimization model?
4. How to model Visualization: Assembling a state-of-the art
and operator preferred visualization in MATLAB?
5. How to integrate the developed components: Tools that
parallelized hybrid model for real-time operation and
planning of multi-objective and multi-reservoir systems
that accounts for uncertainty and flexibility?
Existing research: BPA TIP 258 in flight project
Short-Term Hydropower Production and Marketing
Optimization (HyProM). The project focuses on the integrated
short-term management of hydropower production and marketing
over a period of up to 20 days ahead. It develops a robust and
computationally efficient framework for the real-time operation of
multi-objective and multi-reservoir systems that accounts for
uncertainty and operational flexibility. That includes devising a
novel methodology for the incorporation of uncertainty into the
FCRPS computational system, investigating hybrid optimization
approaches, allowing for scalable parallelization in numerical
methods and combining all components into an integrated
platform with a user-friendly graphical interface.
Key research questions:
1. How to integrate and develop a model library for the
process description of hydro power production (including
routing in the downstream river reaches), marketing, and
energy networks or other processes if they constrain
hydropower management?
2. How to represent and describe uncertainty of a system by
non-parametric scenario, using tree methods in particular
for describing the meteorological uncertainty derived from
ensemble forecasts?
3. How to design and implement Stochastic Optimization of
online optimization algorithms? i.e. algorithms which run
in an operational setting, both in deterministic and multi-
stage stochastic mode for supporting the short-term
management of the short-term planning group.
4. How to analyze online assessment of the operational
flexibility of the system associated with sensitivity to
constraints and related to different stream flow and load
scenarios?
Existing research: BPA TIP 259 in flight project

P o w e r G e n e r a t i o n A s s e t M a n a g e m e n t T e c h n o l o g y R o a d m a p 1 3
F L E X I B I L I T Y A S S E S S M E N T A N D V A L U E
Short-term to real-time database guidance tool for trading
group. Develop a database tools with customizable GUI that
allows BPA traders to take in current state variables of the
FCRPS and regional trading hubs, utilizes results of short-term
FCRPS hydro modeling decision-support as “base case”, and
provides multivariate regressions of available historical scenarios
for guidance on previous decisions and resulting outcomes.
Key research questions:
1. How do real-time operations staff (i.e. traders) make
informal and reasonable decisions with a mix of short-term
optimization model output and historical experience?
2. How can a blend of quantitative and qualitative data be
integrated into an intuitive display for quick decision-
making and risk evaluation?
3. What are the key variables of flexibility that the decision-
maker needs to be aware of at the time of the potential
transaction?

P o w e r G e n e r a t i o n A s s e t M a n a g e m e n t T e c h n o l o g y R o a d m a p 1 4
F L E X I B I L I T Y A S S E S S M E N T A N D V A L U E
Roadmap Area :
R&D Program Requirement
Existing R&D Program or Project
Commercially Unavailable Technology
Commercially Available Technology
Capability Gap
Driver
Power Generation Asset
Management
Technology Roadmap
Dri
vers
Cap
ab
ilit
y G
ap
sT
ech
no
log
y
Ch
ara
cte
risti
cs
R&
D
Pro
gra
ms
RD5 Quantification and valuation
of risk associated with BPA
operational obligation
RD7 Incorporation of flexibility
constraints in Security Constrained
Economic Dispatch (SCED)
Pacific Northwest National Laboratory
is proposing the research.
CG2 Limited understanding of uncertainty that exists within streamflows, loads, obligations, and deployment of balancing reserves in order to determine discretionary FCRPS flexibility.
CG3 Current approach for valuing both obligational and discretionary flexibility is informal.
TC2 Methodologies and tools that can provide an assessment of streamflow, load, obligations and deployment of balancing reserve uncertainty and that can provide ensemble forecasts to models.
TC3 Models that can produce the marginal value of flexibility at each FCRPS project at different times and different nodes.
TC5 Models that can produce high resolution price forecasts at different nodes
D1 Balancing Reserves for Variable Resource Integration: Additional variable resources being built in the BPA Balancing Authority will increase the demand for flexible resources to provide balancing reserves. The FCRPS is running out of flexibility to meet balancing reserve needs within current cost, capability, and commitment constraints.
D2 Reliability: The Northwest Power Pool is considering adding a resource sufficiency standard to ensure that ramping capability and sustainability of generation exist to meet load obligations. Understanding remaining FCRPS flexibility will be critical to meeting resource sufficiency standards.
D3 BiOp and other High-Priority Operational Objectives: FCRPS operational flexibility is essential in meeting Biological Opinion and other high-priority operational objectives, however, sometimes it is not possible to meet all objectives simultaneously. Increased demands on FCRPS flexibility and more generation outages threaten the ability to meet operational objectives.
D4 Maximizing Value of FCRPS: Secondary marketing of any remaining FCRPS flexibility lowers power rates. However, the amount of remaining flexibility for secondary marketing is expected to decrease due to increasing demands for balancing reserves, additional operational constraints, and more generation outages
D5 SCED: The Northwest Power Pool is considering developing an imbalance market that will use a Security Constrained Economic Dispatch (SCED) to dispatch generating units. This will require a determination of an offer curve which will require the ability to determine the opportunity cost of any remaining FCRPS flexibility
RD4 Agent-based trading in
production cost models/system
models
I. Flexibility Assessment and Value (2/7)
CG5 Current price forecasts are have limited resolution and scope
P o w e r G e n e r a t i o n A s s e t M a n a g e m e n t T e c h n o l o g y R o a d m a p 1 5
F L E X I B I L I T Y A S S E S S M E N T A N D V A L U E
R&D Program Summaries
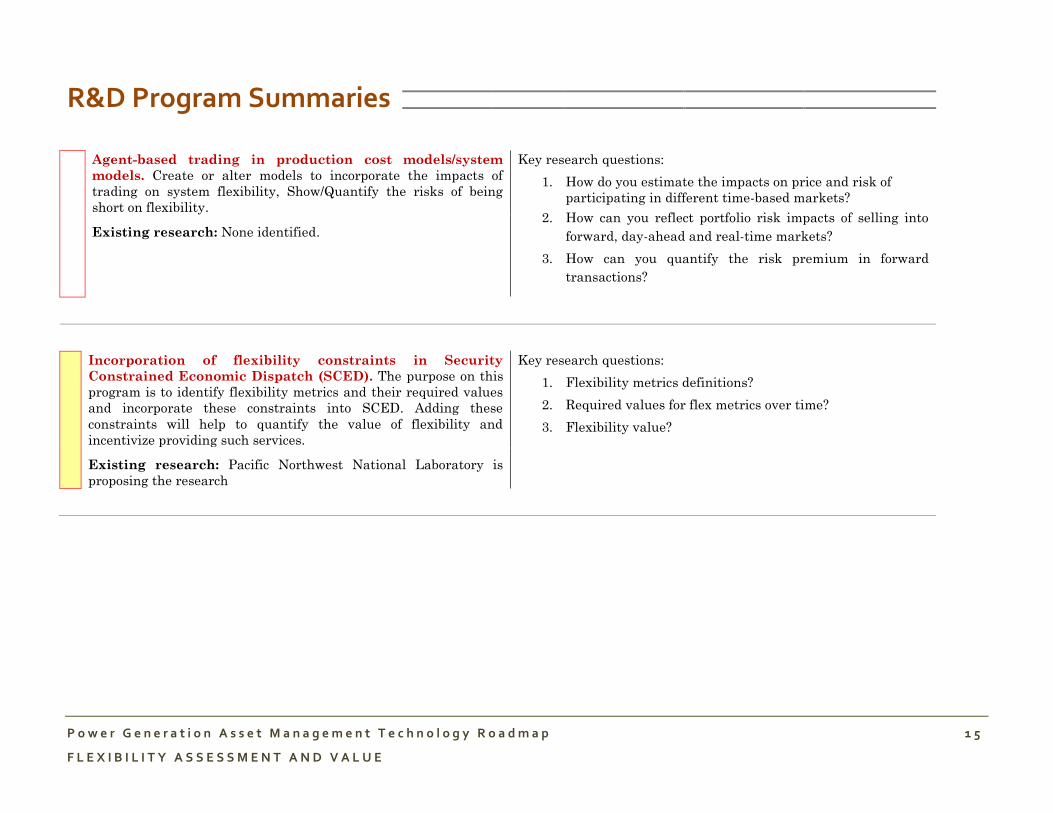
Agent-based trading in production cost models/system
models. Create or alter models to incorporate the impacts of
trading on system flexibility, Show/Quantify the risks of being
short on flexibility.
Key research questions:
1. How do you estimate the impacts on price and risk of
participating in different time-based markets?
2. How can you reflect portfolio risk impacts of selling into
forward, day-ahead and real-time markets?
3. How can you quantify the risk premium in forward
transactions?
Existing research: None identified.
Incorporation of flexibility constraints in Security
Constrained Economic Dispatch (SCED). The purpose on this
program is to identify flexibility metrics and their required values
and incorporate these constraints into SCED. Adding these
constraints will help to quantify the value of flexibility and
incentivize providing such services.
Key research questions:
1. Flexibility metrics definitions?
2. Required values for flex metrics over time?
3. Flexibility value?
Existing research: Pacific Northwest National Laboratory is
proposing the research

P o w e r G e n e r a t i o n A s s e t M a n a g e m e n t T e c h n o l o g y R o a d m a p 1 6
F L E X I B I L I T Y A S S E S S M E N T A N D V A L U E
Quantification and valuation of risk associated with BPA
operational obligation. BPA currently has many obligations it
must meet during hydro operations. Due to increasingly limited
flexibility, its ability to meet all obligations simultaneously will be
reduced. BPA will need rules for deciding which obligation not to
meet, and have to value meeting obligation in operation.
Key research questions:
1. What is the value of unserved energy in the BPA service
area?
2. What is the value of ensuring sufficient operational
ramping capability?
3. What is the cost of not meeting flood control and biological
constraints?
4. What is the cost of curtailing wind generation due to lack
of flexibility?
5. How should each of these parameters be factored be
factored into FCRPS operations?
Existing research: None identified.

P o w e r G e n e r a t i o n A s s e t M a n a g e m e n t T e c h n o l o g y R o a d m a p 1 7
F L E X I B I L I T Y A S S E S S M E N T A N D V A L U E
Roadmap Area :
R&D Program Requirement
Existing R&D Program or Project
Commercially Unavailable Technology
Commercially Available Technology
Capability Gap
Driver
Power Generation Asset
Management
Technology Roadmap
Dri
vers
Cap
ab
ilit
y G
ap
sT
ech
no
log
y
Ch
ara
cte
risti
cs
R&
D
Pro
gra
ms
RD15 Maximizing flexibility by robust optimization.
Existing Research: None.
BPA - TIP 258: model input uncertainties and propagate
through hydro system, robust and probabilistically
constrained optimization, On-going : model flexibility
as envelope around optimal strategy, maximize spread
CG2 Limited understanding of uncertainty that exists within streamflows, loads, obligations, and deployment of balancing reserves in order to determine discretionary FCRPS flexibility.
CG3 Current approach for valuing both obligational and discretionary flexibility is informal.
TC3 Models that can produce the marginal value of flexibility at each FCRPS project at different times and different nodes.
TC6 Capture flexibility impacts on total system cost of the Pacific Northwest
TC13 Models that incorporate uncertain constraints in optimization
TC15 Decision support tools that incorporate maximizing (conserving) future flexibility as an objective
TC9 Understanding the costs of variable O&M due to increased unit cycling
RD13 Impact of dispatch on
equipment life/costs, and
quantification of variable operations
and maintenance factors
CG1 Current multi-objective models for assessing flexibility are unable to provide probabilistic results using fine time resolution.
CG4 Understanding interaction between BPA, BA (Balancing Authority) generators, and FCRTS
D1 Balancing Reserves for Variable Resource Integration: Additional variable resources being built in the BPA Balancing Authority will increase the demand for flexible resources to provide balancing reserves. The FCRPS is running out of flexibility to meet balancing reserve needs within current cost, capability, and commitment constraints.
D2 Reliability: The Northwest Power Pool is considering adding a resource sufficiency standard to ensure that ramping capability and sustainability of generation exist to meet load obligations. Understanding remaining FCRPS flexibility will be critical to meeting resource sufficiency standards.
D3 BiOp and other High-Priority Operational Objectives: FCRPS operational flexibility is essential in meeting Biological Opinion and other high-priority operational objectives, however, sometimes it is not possible to meet all objectives simultaneously. Increased demands on FCRPS flexibility and more generation outages threaten the ability to meet operational objectives.
D4 Maximizing Value of FCRPS: Secondary marketing of any remaining FCRPS flexibility lowers power rates. However, the amount of remaining flexibility for secondary marketing is expected to decrease due to increasing demands for balancing reserves, additional operational constraints, and more generation outages
D5 SCED: The Northwest Power Pool is considering developing an imbalance market that will use a Security Constrained Economic Dispatch (SCED) to dispatch generating units. This will require a determination of an offer curve which will require the ability to determine the opportunity cost of any remaining FCRPS flexibility
I. Flexibility Assessment and Value (3/7)
CG5 Current price forecasts are have limited resolution and scope

P o w e r G e n e r a t i o n A s s e t M a n a g e m e n t T e c h n o l o g y R o a d m a p 1 8
F L E X I B I L I T Y A S S E S S M E N T A N D V A L U E
R&D Program Summaries
Impact of dispatch on equipment life/costs, and
quantification of variable operations and maintenance
factors. Quantifying/qualifying cost variability on Equipment
O&M as well as life, based on dispatch and operation of
equipment.
Key research questions:
1. Impact of cycling cost on O&M & equipment life?
2. Impact of start/stops on O&M & equipment life?
3. Impact of operating in rough zones on O&M & equipment
life? Existing research: None identified.
Extend Reliability models for flexibility. Use quantification of
input uncertainty and flexibility to formulate multi objective
robust, probabilistically constrained optimal control problem to
maximize and valuate flexibility. Develop visualization techniques
to enables decision maker to utilize valuation.
Key research questions:
1. Howe to define, model and quantify flexibility in decisions
at each project at each time (e.g. Potential excess storage)?
2. How to quantify relevant constraints and objectives
(probabilistically)?
3. How to access changes in utility resulting from changes in
flexibility (e.g. how does flexibility mitigate uncertainty)?
4. How to formulate the multi objective robust optimal
control problem with maximizing flexibility? How to solve?
5. Can one use solutions to multi objective problem to
determine tradeoff curves which can inform valuation of
flexibility?
6. Can valuation and trade off curve be used to give (real
time) opportunity cost for flexibility for a given time span?
How to visualize??
Existing research: BPA TIP 258: model input uncertainties and
propagate through hydro system, robust and probabilistically
constrained optimization. On-going: model flexibility as envelope
around optimal strategy, maximize spread.

P o w e r G e n e r a t i o n A s s e t M a n a g e m e n t T e c h n o l o g y R o a d m a p 1 9
F L E X I B I L I T Y A S S E S S M E N T A N D V A L U E
Roadmap Area :
R&D Program Requirement
Existing R&D Program or Project
Commercially Unavailable Technology
Commercially Available Technology
Capability Gap
Driver
Power Generation Asset
Management
Technology Roadmap
Dri
vers
Cap
ab
ilit
y G
ap
sT
ech
no
log
y
Ch
ara
cte
risti
cs
R&
D
Pro
gra
ms
RD8 Virtual flexibility: Optimizing
decisions over time
RD16 Price forecasts incorporating
strategic behaviour with imperfect
competition
CG2 Limited understanding of uncertainty that exists within streamflows, loads, obligations, and deployment of balancing reserves in order to determine discretionary FCRPS flexibility.
CG3 Current approach for valuing both obligational and discretionary flexibility is informal.
TC3 Models that can produce the marginal value of flexibility at each FCRPS project at different times and different nodes.
TC5 Models that can produce high resolution price forecasts at different nodes
TC8 Tools that can produce a range of high resolution price forecasts using various models
TC14 Tools that reduce error in the estimation of uncertainty
D1 Balancing Reserves for Variable Resource Integration: Additional variable resources being built in the BPA Balancing Authority will increase the demand for flexible resources to provide balancing reserves. The FCRPS is running out of flexibility to meet balancing reserve needs within current cost, capability, and commitment constraints.
D2 Reliability: The Northwest Power Pool is considering adding a resource sufficiency standard to ensure that ramping capability and sustainability of generation exist to meet load obligations. Understanding remaining FCRPS flexibility will be critical to meeting resource sufficiency standards.
D3 BiOp and other High-Priority Operational Objectives: FCRPS operational flexibility is essential in meeting Biological Opinion and other high-priority operational objectives, however, sometimes it is not possible to meet all objectives simultaneously. Increased demands on FCRPS flexibility and more generation outages threaten the ability to meet operational objectives.
D4 Maximizing Value of FCRPS: Secondary marketing of any remaining FCRPS flexibility lowers power rates. However, the amount of remaining flexibility for secondary marketing is expected to decrease due to increasing demands for balancing reserves, additional operational constraints, and more generation outages
D5 SCED: The Northwest Power Pool is considering developing an imbalance market that will use a Security Constrained Economic Dispatch (SCED) to dispatch generating units. This will require a determination of an offer curve which will require the ability to determine the opportunity cost of any remaining FCRPS flexibility
I. Flexibility Assessment and Value (4/7)
CG5 Current price forecasts are have limited resolution and scope
RD11 What is the sensitivity of the
market price to short term changes in
load, wind, hydro, imports/exports,
other fundamental drivers?
TC1 Models that produce fast, feasible high resolution studies for FCRPS hydroelectric projects under a number of different operating conditions in order to determine the ability to move generation from one hydro project to another and to/from different time horizons
CG1 Current multi-objective models for assessing flexibility are unable to provide probabilistic results using fine time resolution.

P o w e r G e n e r a t i o n A s s e t M a n a g e m e n t T e c h n o l o g y R o a d m a p 2 0
F L E X I B I L I T Y A S S E S S M E N T A N D V A L U E
R&D Program Summaries
What is the sensitivity of the market price to short term
changes in load, wind, hydro, imports/exports, other
fundamental drivers. The value of flexibility in the short term
(3-30 days) is dependent on the anticipated market prices.
Markets are sensitive to a variety of physical drivers. It will be
important of BPA to have a strong understanding how these
relationship work.
Key research questions:
1. How does the market price change in the near-term with
changes in wind generation? Temperature? Load? Hydro
availability? Availability of solar & wind power in
California?
2. Develop a regression based model that provides high level
estimates of market price sensitivity in the short run
without requiring a computer optimization that takes
multiple hours to solve?
Existing research: None identified.
Virtual flexibility: Optimizing decisions over time. Optimize
the decision making process to ensure that decision are made at
the right time considering their impact on the availability of
resources down the line.
Key research questions:
1. Quantify the value of decisions at various point in time?
2. Quantify the implication of these decisions in terms of lost
flexibility?
3. Develop an optimization process that consider how
decision should be made over time?
Existing research: None identified.
Price forecasts incorporating strategic behavior with
imperfect competition. Not defined.
Key research questions:
1. Not defined.
Existing research: None identified.
P o w e r G e n e r a t i o n A s s e t M a n a g e m e n t T e c h n o l o g y R o a d m a p 2 1
F L E X I B I L I T Y A S S E S S M E N T A N D V A L U E
Roadmap Area :
R&D Program Requirement
Existing R&D Program or Project
Commercially Unavailable Technology
Commercially Available Technology
Capability Gap
Driver
Power Generation Asset
Management
Technology Roadmap
Dri
vers
Cap
ab
ilit
y G
ap
sT
ech
no
log
y
Ch
ara
cte
risti
cs
R&
D
Pro
gra
ms
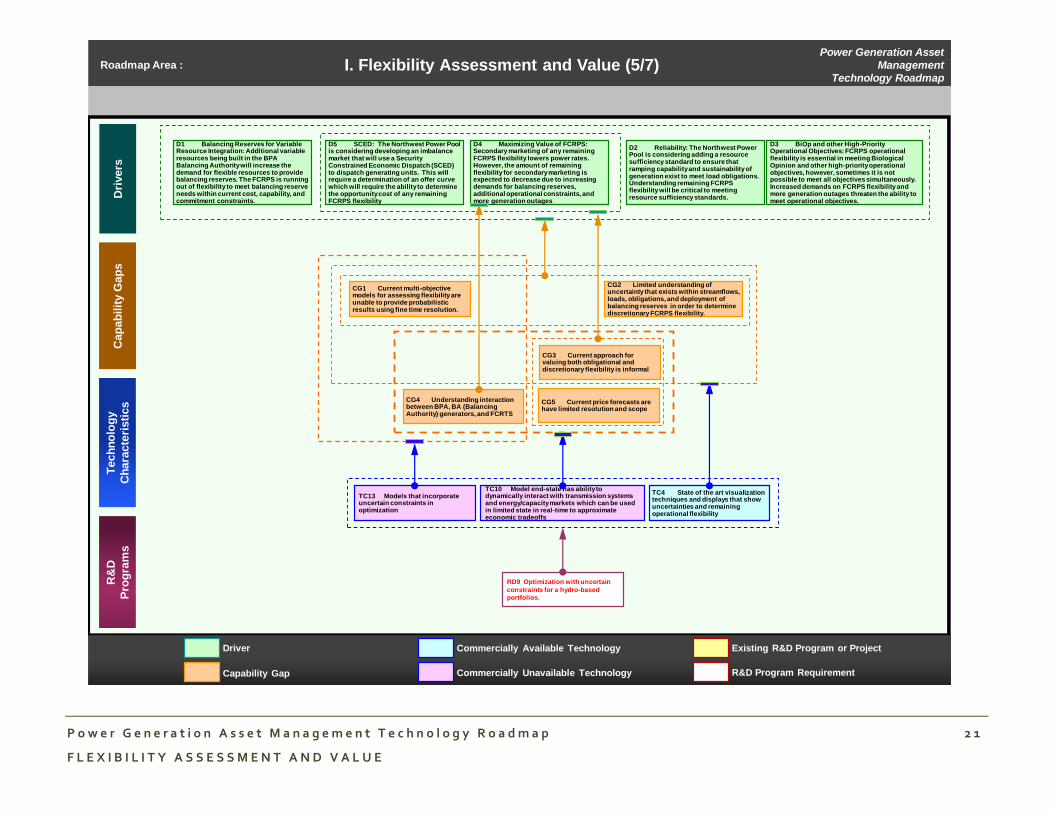
RD9 Optimization with uncertain
constraints for a hydro-based
portfolios.
CG1 Current multi-objective models for assessing flexibility are unable to provide probabilistic results using fine time resolution.
CG2 Limited understanding of uncertainty that exists within streamflows, loads, obligations, and deployment of balancing reserves in order to determine discretionary FCRPS flexibility.
CG3 Current approach for valuing both obligational and discretionary flexibility is informal
CG4 Understanding interaction between BPA, BA (Balancing Authority) generators, and FCRTS
TC4 State of the art visualization techniques and displays that show uncertainties and remaining operational flexibility
TC10 Model end-state has ability to dynamically interact with transmission systems and energy/capacity markets which can be used in limited state in real-time to approximate economic tradeoffs
TC13 Models that incorporate uncertain constraints in optimization
D1 Balancing Reserves for Variable Resource Integration: Additional variable resources being built in the BPA Balancing Authority will increase the demand for flexible resources to provide balancing reserves. The FCRPS is running out of flexibility to meet balancing reserve needs within current cost, capability, and commitment constraints.
D2 Reliability: The Northwest Power Pool is considering adding a resource sufficiency standard to ensure that ramping capability and sustainability of generation exist to meet load obligations. Understanding remaining FCRPS flexibility will be critical to meeting resource sufficiency standards.
D3 BiOp and other High-Priority Operational Objectives: FCRPS operational flexibility is essential in meeting Biological Opinion and other high-priority operational objectives, however, sometimes it is not possible to meet all objectives simultaneously. Increased demands on FCRPS flexibility and more generation outages threaten the ability to meet operational objectives.
D4 Maximizing Value of FCRPS: Secondary marketing of any remaining FCRPS flexibility lowers power rates. However, the amount of remaining flexibility for secondary marketing is expected to decrease due to increasing demands for balancing reserves, additional operational constraints, and more generation outages
D5 SCED: The Northwest Power Pool is considering developing an imbalance market that will use a Security Constrained Economic Dispatch (SCED) to dispatch generating units. This will require a determination of an offer curve which will require the ability to determine the opportunity cost of any remaining FCRPS flexibility
I. Flexibility Assessment and Value (5/7)
CG5 Current price forecasts are have limited resolution and scope
P o w e r G e n e r a t i o n A s s e t M a n a g e m e n t T e c h n o l o g y R o a d m a p 2 2
F L E X I B I L I T Y A S S E S S M E N T A N D V A L U E
R&D Program Summaries
Optimization with uncertain constraints for a hydro-based
portfolios. Optimization generally treats constraints as either
hard or at a penalty to the objective function. This program
examines how to optimize a problem with the constraint being a
probability of reaching a particular future state.
Key research questions:
1. How do you incorporate constraint uncertainty into an
optimization problem for a hydro-system-based portfolio?
2. For long-term forecasts, how do you optimize with
consideration for meeting an obligation with some
certainty?
Existing research: None identified.

P o w e r G e n e r a t i o n A s s e t M a n a g e m e n t T e c h n o l o g y R o a d m a p 2 3
F L E X I B I L I T Y A S S E S S M E N T A N D V A L U E
Roadmap Area :
R&D Program Requirement
Existing R&D Program or Project
Commercially Unavailable Technology
Commercially Available Technology
Capability Gap
Driver
Power Generation Asset
Management
Technology Roadmap
Dri
vers
Cap
ab
ilit
y G
ap
sT
ech
no
log
y
Ch
ara
cte
risti
cs
R&
D
Pro
gra
ms
CG2 Limited understanding of uncertainty that exists within streamflows, loads, obligations, and deployment of balancing reserves in order to determine discretionary FCRPS flexibility.
CG3 Current approach for valuing both obligational and discretionary flexibility is informal.
TC6 Capture flexibility impacts on total system cost of the Pacific Northwest
TC11 Need an approach for placing a value on the risk of violating or not meeting obligations, e.g. flood control, operating reserves
RD10 Adaptive metrics for
flexibility in different decision time
frames
TC7 No common set of adaptive metrics for quantifying and valuing flexibility
D1 Balancing Reserves for Variable Resource Integration: Additional variable resources being built in the BPA Balancing Authority will increase the demand for flexible resources to provide balancing reserves. The FCRPS is running out of flexibility to meet balancing reserve needs within current cost, capability, and commitment constraints.
D2 Reliability: The Northwest Power Pool is considering adding a resource sufficiency standard to ensure that ramping capability and sustainability of generation exist to meet load obligations. Understanding remaining FCRPS flexibility will be critical to meeting resource sufficiency standards.
D3 BiOp and other High-Priority Operational Objectives: FCRPS operational flexibility is essential in meeting Biological Opinion and other high-priority operational objectives, however, sometimes it is not possible to meet all objectives simultaneously. Increased demands on FCRPS flexibility and more generation outages threaten the ability to meet operational objectives.
D4 Maximizing Value of FCRPS: Secondary marketing of any remaining FCRPS flexibility lowers power rates. However, the amount of remaining flexibility for secondary marketing is expected to decrease due to increasing demands for balancing reserves, additional operational constraints, and more generation outages
D5 SCED: The Northwest Power Pool is considering developing an imbalance market that will use a Security Constrained Economic Dispatch (SCED) to dispatch generating units. This will require a determination of an offer curve which will require the ability to determine the opportunity cost of any remaining FCRPS flexibility
RD6 Incorporating feasible hydro
dispatch decision guidance into
production cost models.
TC5 Models that can produce high resolution price forecasts at different nodes
I. Flexibility Assessment and Value (6/7)
CG5 Current price forecasts are have limited resolution and scope

P o w e r G e n e r a t i o n A s s e t M a n a g e m e n t T e c h n o l o g y R o a d m a p 2 4
F L E X I B I L I T Y A S S E S S M E N T A N D V A L U E
R&D Program Summaries
Incorporating feasible hydro dispatch decision guidance
into production cost models. Production cost models typically
do not directly consider hydropower constraints when dispatching
hydro resources or perform stochastic analysis on fuel supply. This
program would look at directly integrating a hydraulic model that
considers constraints with a production cost model.
Key research questions:
1. Can a marginal value for flexibility be developed?
2. What is the cost of meeting high-priority operational
objectives?
3. What are the total system costs associated with the use of
flexibility? Existing research: None identified.
Adaptive metrics for flexibility in different decision time
frames. Explore and/or create a set of adaptive metrics for
representing flexibility of a resource, set of resources and entire
system. Determine in which time frame (decision-making) a
simplification of the complexity of system flexibility is most
needed for system operators.
Key research questions:
1. What timeframes is it most necessary to create “rules of
thumb” of simplifying metrics for decision makers? And
what decision-makes does it help?
2. Can or should metrics combine reliability and value
considerations?
3. For a metric to be adaptive and useful in a broad set of
situations, what characteristics will need to be implicit in
its formulation?
4. What distinguishes a new metric from existing metrics
used to quantify flexibility?
5. Can similar types of metrics be used for all timeframes in
which flexibility is an issue? If not, what distinguishes
how a metric is used?
Existing research: None identified.

P o w e r G e n e r a t i o n A s s e t M a n a g e m e n t T e c h n o l o g y R o a d m a p 2 5
F L E X I B I L I T Y A S S E S S M E N T A N D V A L U E
Roadmap Area :
R&D Program Requirement
Existing R&D Program or Project
Commercially Unavailable Technology
Commercially Available Technology
Capability Gap
Driver
Power Generation Asset
Management
Technology Roadmap
Dri
vers
Cap
ab
ilit
y G
ap
sT
ech
no
log
y
Ch
ara
cte
risti
cs
R&
D
Pro
gra
ms
RD14 Extend Reliability models for
flexibility
CG2 Limited understanding of uncertainty that exists within streamflows, loads, obligations, and deployment of balancing reserves in order to determine discretionary FCRPS flexibility.
CG3 Current approach for valuing both obligational and discretionary flexibility is informal.
TC3 Models that can produce the marginal value of flexibility at each FCRPS project at different times and different nodes.
TC6 Capture flexibility impacts on total system cost of the Pacific Northwest
TC11 Need an approach for placing a value on the risk of violating or not meeting obligations, e.g. flood control, operating reserves
D1 Balancing Reserves for Variable Resource Integration: Additional variable resources being built in the BPA Balancing Authority will increase the demand for flexible resources to provide balancing reserves. The FCRPS is running out of flexibility to meet balancing reserve needs within current cost, capability, and commitment constraints.
D2 Reliability: The Northwest Power Pool is considering adding a resource sufficiency standard to ensure that ramping capability and sustainability of generation exist to meet load obligations. Understanding remaining FCRPS flexibility will be critical to meeting resource sufficiency standards.
D3 BiOp and other High-Priority Operational Objectives: FCRPS operational flexibility is essential in meeting Biological Opinion and other high-priority operational objectives, however, sometimes it is not possible to meet all objectives simultaneously. Increased demands on FCRPS flexibility and more generation outages threaten the ability to meet operational objectives.
D4 Maximizing Value of FCRPS: Secondary marketing of any remaining FCRPS flexibility lowers power rates. However, the amount of remaining flexibility for secondary marketing is expected to decrease due to increasing demands for balancing reserves, additional operational constraints, and more generation outages
D5 SCED: The Northwest Power Pool is considering developing an imbalance market that will use a Security Constrained Economic Dispatch (SCED) to dispatch generating units. This will require a determination of an offer curve which will require the ability to determine the opportunity cost of any remaining FCRPS flexibility
I. Flexibility Assessment and Value (7/7)
CG5 Current price forecasts are have limited resolution and scope
P o w e r G e n e r a t i o n A s s e t M a n a g e m e n t T e c h n o l o g y R o a d m a p 2 6
F L E X I B I L I T Y A S S E S S M E N T A N D V A L U E
R&D Program Summaries
Extend Reliability models for flexibility. Incorporate system
flexibility requirements into reliability models and system
expansion models.
Key research questions:
1. How should a system be committed to ensure adequate
flexibility?
2. 2. Can Loss of Load Probability (LOLP) models capture
ramping problems?
3. 3.-How can system expansion models take flexibility
requirements into account?
Existing research: None identified.

P o w e r G e n e r a t i o n A s s e t M a n a g e m e n t T e c h n o l o g y R o a d m a p 2 7
J O I N T T R A N S M I S S I O N A N D H Y D R O P O W E R M O D E L I N G
J O I N T T R A N S M I S S I O N A N D H Y D R O P O W E R
M O D E L I N G
Roadmap Area Definition
The current state of practice in modeling the FCRPS and BPA’s
transmission assets is to develop an expected or stressed (e.g. peak)
case on the hydro system and use those as generation inputs to a
power flow model to estimate flows on the grid. This is an iterative
process that does not utilize the potential benefits of developing
generation patterns that simultaneously best meet both transmission
and generation constraints. Research would focus on computational
methods and simulation/optimization algorithms that solve the
combined federal power and transmission system within defined
constraints and objective functions.
Summary
Improved efficient and operations can be gained by joint modelling
efforts between Power and Transmission business group. The drivers
for enhancing these technologies are the need for increase reliability,
flexibility, and the goal of maximizing the value of the power and
transmission systems. It is a significant undertaking and will be
necessary to break down the tasks into achievable incremental
advances. Currently available architectures may be sufficient to
address some of these tasks.
Research should be done to analyze methods to model hydropower and
transmission operations jointly that meet operational requirements
and support RAS. We do not currently have the ability to model
contingencies well if hydro conditions or system topology change, as
they are often interdependent. A common system that will handle
maintenance planning for both transmission and generator outages
would help to optimize operation and yield useful information. We
would be able to quantify system constraints that affect generation
patterns, water movement, and power flows, as well as which
constraints are truly binding. This data can be feedback into our
current modelling platforms or support development of more robust
modeling platforms that take these factors into account explicitly.
The insights and observations of the subject matter experts who
participated in Workshop were presented, summarized, and reviewed
by:
Christopher Allen (Bonneville Power Administration)
Steve Barton (Bonneville Power Administration)

P o w e r G e n e r a t i o n A s s e t M a n a g e m e n t T e c h n o l o g y R o a d m a p 2 8
J O I N T T R A N S M I S S I O N A N D H Y D R O P O W E R M O D E L I N G
Roadmap Area :
R&D Program Requirement
Existing R&D Program or Project
Commercially Unavailable Technology
Commercially Available Technology
Capability Gap
Driver
Power Generation Asset
Management
Technology Roadmap
Dri
vers
Cap
ab
ilit
y G
ap
sT
ech
no
log
y
Ch
ara
cte
risti
cs
R&
D
Pro
gra
ms
II. Joint Transmission and Hydropower Modeling (1/3)
D1 Reliability: The Northwest Power Pool is considering adding a resource sufficiency standard to ensure that ramping capability and sustainability of generation exist to meet load obligations. Understanding the relationship between FCRPS project generation patterns and transmission congestions will be important in determining resource sufficiency.
D2 SCED: The Northwest Power Pool is considering developing an imbalance market that will use a Security Constrained Economic Dispatch (SCED) to dispatch generating units. Understanding the relationship between FCRPS generation patterns and potential sources of transmission congestion will be valuable in determining the value of FCRPS flexibility
D3 Maximizing Value of FCRPS/FCRTS: Aging transmission and generation facilities will result in more frequent planned maintenance. Co-optimizing planned transmission and generation maintenance will minimize the cost of these outages for both FCRPS and FCRTS customers.
CG1 The current practice in modeling the FCRPS and BPA's transmission assets is to develop an expected or stressed (e.g. peak) case on the hydro system and use those as generation inputs to a power flow model to estimate flows on the grid. This is an iterative process that does not utilize the potential benefits of developing generation patterns that simultaneously best meet both transmission and generation constraints.
CG2 Current system cannot anticipate areas of transmission congestion effectively because of increased uncertainty in FCRPS resources.
CG4 The impact of generation levels necessary to support Remedial Action Schemes (RAS) is not well understood
TC1 Computational methods and simulation / optimization algorithms that solve the combined federal power and transmission systems within defined constraints and objective functions.
TC4 Approach to convert transmission constraints to actionable inputs to generation dispatch
TC8 Model execution time fast energy to support planning decisions
TC9 Use a simulation tool (potentially on target #1) to provide insights on impacts of generation dispatch on transmission system and evaluate / suggest actions to support RAS
RD2 Optimal generation
dispatch to respond to
transmission contingencies
RD6 Real time co-simulation of transmission and
generation
The Ohio State University has one of the largest platform
for real time simulation for electric power. Earlier projects
include co-simulation of electrical and communication
network and real-time simulation of multi-terminal HVDC
systems with voltage source inverters

P o w e r G e n e r a t i o n A s s e t M a n a g e m e n t T e c h n o l o g y R o a d m a p 2 9
J O I N T T R A N S M I S S I O N A N D H Y D R O P O W E R M O D E L I N G
R&D Program Summaries
Optimal generation dispatch to respond to transmission
contingencies. Development of a tool that performs optimal
generation dispatch solutions / options based on required
transmission condition to support RAS implementation.
Key research questions:
1. What is the desired condition certain RAS is trying to
achieve?
2. What are the impacts of certain generation dispatch on the
transmission system?
3. What are the alternatives for generation dispatch to
achieve a condition required by RAS without violating the
capability of resources?
Existing research: None identified.
Real time co-simulation of transmission and generation.
Reduce calculation time by investigating different computational
architectures and multi-time scale modeling methods. Realize a
scale down modular real-time simulation models with capability
for future expansion.
Key research questions:
1. Architecture: paralleled FPGA arrays, CPU, GPU or a
hybrid solution?
2. Modeling methods: i) how to interface between different
simulation modules at the same time scale and different
time scales; ii) how to realize zoom-in & zoom-out function;
iii) how to deal with increasing numbers of FACTs devices,
HVDC and renewable energy resources; iv) how to realize
the interface between simulation models and visualization
modules?
3. Future development: i) interface with real time simulators
for communication networks; ii) capability to realize
hardware-in-the-loop systems to test SCADA and EMS
systems?
Existing research: The Ohio State University has one of the
largest platform for real time simulation for electric power. Earlier
projects include co-simulation of electrical and communication
network and real-time simulation of multi-terminal HVDC
systems.

P o w e r G e n e r a t i o n A s s e t M a n a g e m e n t T e c h n o l o g y R o a d m a p 3 0
J O I N T T R A N S M I S S I O N A N D H Y D R O P O W E R M O D E L I N G
Roadmap Area :
R&D Program Requirement
Existing R&D Program or Project
Commercially Unavailable Technology
Commercially Available Technology
Capability Gap
Driver
Power Generation Asset
Management
Technology RoadmapD
rivers
Cap
ab
ilit
y G
ap
sT
ech
no
log
y
Ch
ara
cte
risti
cs
R&
D
Pro
gra
ms
II. Joint Transmission and Hydropower Modeling (2/3)
D1 Reliability: The Northwest Power Pool is considering adding a resource sufficiency standard to ensure that ramping capability and sustainability of generation exist to meet load obligations. Understanding the relationship between FCRPS project generation patterns and transmission congestions will be important in determining resource sufficiency.
D2 SCED: The Northwest Power Pool is considering developing an imbalance market that will use a Security Constrained Economic Dispatch (SCED) to dispatch generating units. Understanding the relationship between FCRPS generation patterns and potential sources of transmission congestion will be valuable in determining the value of FCRPS flexibility
D3 Maximizing Value of FCRPS/FCRTS: Aging transmission and generation facilities will result in more frequent planned maintenance. Co-optimizing planned transmission and generation maintenance will minimize the cost of these outages for both FCRPS and FCRTS customers.
CG1 The current practice in modeling the FCRPS and BPA's transmission assets is to develop an expected or stressed (e.g. peak) case on the hydro system and use those as generation inputs to a power flow model to estimate flows on the grid. This is an iterative process that does not utilize the potential benefits of developing generation patterns that simultaneously best meet both transmission and generation constraints.
CG2 Current system cannot anticipate areas of transmission congestion effectively because of increased uncertainty in FCRPS resources.
CG3 Outage planning for maintenance activities for hydro generation and transmission are currently performed independently, which has led de-optimized availability of hydro generating resources and transmission lines.
CG4 The impact of generation levels necessary to support Remedial Action Schemes (RAS) is not well understood
TC1 Computational methods and simulation / optimization algorithms that solve the combined federal power and transmission systems within defined constraints and objective functions.
TC2 Characterize stochastic nature of inputs(Loads, Streamflow, etc.) and analytic methods
TC6 Measures and methodologies to model uncertainties (load, water, transmission capacity). Incorporate uncertainties in existing models
TC4 Approach to convert transmission constraints to actionable inputs to generation dispatch
TC7 System tracking both generator and transmission equipment maintenance, which can provide inputs to planning models (joint outage optimization)
TC9 Use a simulation tool (potentially on target #1) to provide insights on impacts of generation dispatch on transmission system and evaluate / suggest actions to support RAS
RD1 Integrated optimization
for power and transmission
operations / planning with
uncertainties
RD4 Workflow platform
integrating generation and
transmission models
RD7 Optimized collaborative
hydro generator and
transmission maintenance
scheduling
RD9 Characterizing, modeling,
and incorporating uncertainties
in joint hydropower and
transmission operations

P o w e r G e n e r a t i o n A s s e t M a n a g e m e n t T e c h n o l o g y R o a d m a p 3 1
J O I N T T R A N S M I S S I O N A N D H Y D R O P O W E R M O D E L I N G
R&D Program Summaries
Workflow platform integrating generation and
transmission models. A workflow that employs existing
optimization tools that focus on different aspects of the system,
e.g. generation and transmission, and integrate them so that the
results offer the best value while meeting constraints specified in
each tool.
Key research questions:
1. Does the platform enable the use of existing generation
optimization tool and transmission model?
2. How does the tool translate constraint violations of one
model to adjustment of results from the other models?
3. How convenient is the tool allowing replacement of one /
some of the models involved in the workflow?
4. How can the tool incorporate uncertainty information that
helps define planning / operation scenarios??
Existing research: None identified.
Characterizing, modeling and incorporating uncertainties
in joint hydropower and transmission operations. Identify
sources of uncertainties and their impacts on the system. Select
critical uncertain factors and model them. Incorporate uncertainty
models in existing operations. Goal: minimize the impacts of
uncertainties on transmission lines.
Key research questions:
1. What are the unknown/random factors (e.g., water level,
load, transmission capacity)? What are the impacts, are
there correlations, which ones are critical to transmission
lines and generations?
2. How to quantify reliability? What are the current
measurements? Any improvements needed? Are they
computable?
3. How does the current system deal with the uncertainties?
What are captured and what are missed?
4. What models that capture uncertainties are most
interested to operators? Are there models implementable?
Data available? Computationally tractable? Scalable?
Execution time? Operation settings?
5. How to justify the benefits of new models?
Existing research: None identified.

P o w e r G e n e r a t i o n A s s e t M a n a g e m e n t T e c h n o l o g y R o a d m a p 3 2
J O I N T T R A N S M I S S I O N A N D H Y D R O P O W E R M O D E L I N G
Integrated optimization for power and transmission
operations / planning with uncertainties. Development of a
tool that performs optimization of generation dispatch that
considers transmission constraints, stochastic property of variable
generation and load, and uncertainty with market activities. The
tool will provide generation schedules that meet real-time
conditions of the system and runs quickly enough to get solutions
in real time.
Key research questions:
1. . How to characterize the uncertainties with variables that
go in the model?
2. How to reduce the number of scenarios for simulations to
achieve desired computing time (e.g. doing clustering
using domain expertise)?
3. How transmission constraints / violations should dictate
the adjustment in generation dispatch and vice versa
(impacts of generation on transmission constraints)?
4. How outage of generation and transmission affects the
economics and reliability of the system?
5. What is the time resolution in the solution provided by the
simulation tool, and does it offer solutions on multiple
timescales to address needs on different time horizon?
6. What optimization and computing techniques are used to
get solutions efficiently?
Existing research: None identified.

P o w e r G e n e r a t i o n A s s e t M a n a g e m e n t T e c h n o l o g y R o a d m a p 3 3
J O I N T T R A N S M I S S I O N A N D H Y D R O P O W E R M O D E L I N G
Optimized collaborative hydro generator and transmission
maintenance scheduling. Examine current generation and
transmission maintenance schedule and procedure; find out
correlation between them; propose optimized collaborative
maintenance schedules that minimize loss of availability (cost,
etc).
Key research questions:
1. What are the current practices in generation and
transmission maintenance, and outage planning? How are
they related? How can they be collaborated?
2. How to obtain equipment health status, such as failure
rate, life cycle? How the equipment transit from one status
to another status? How the operations affect the health
status?
3. How to evaluate the impacts of maintenance on system
performance? (e.g. loss of availability, efficiency)?
4. How to incorporate maintenance (generation and
transmission) decision into system operation model?
Which method to choose: stochastic optimization,
stochastic programming?
5. How to evaluate the optimized collaborative maintenance
schedule? improved over the independent maintenance
schedules??
Existing research: None identified.
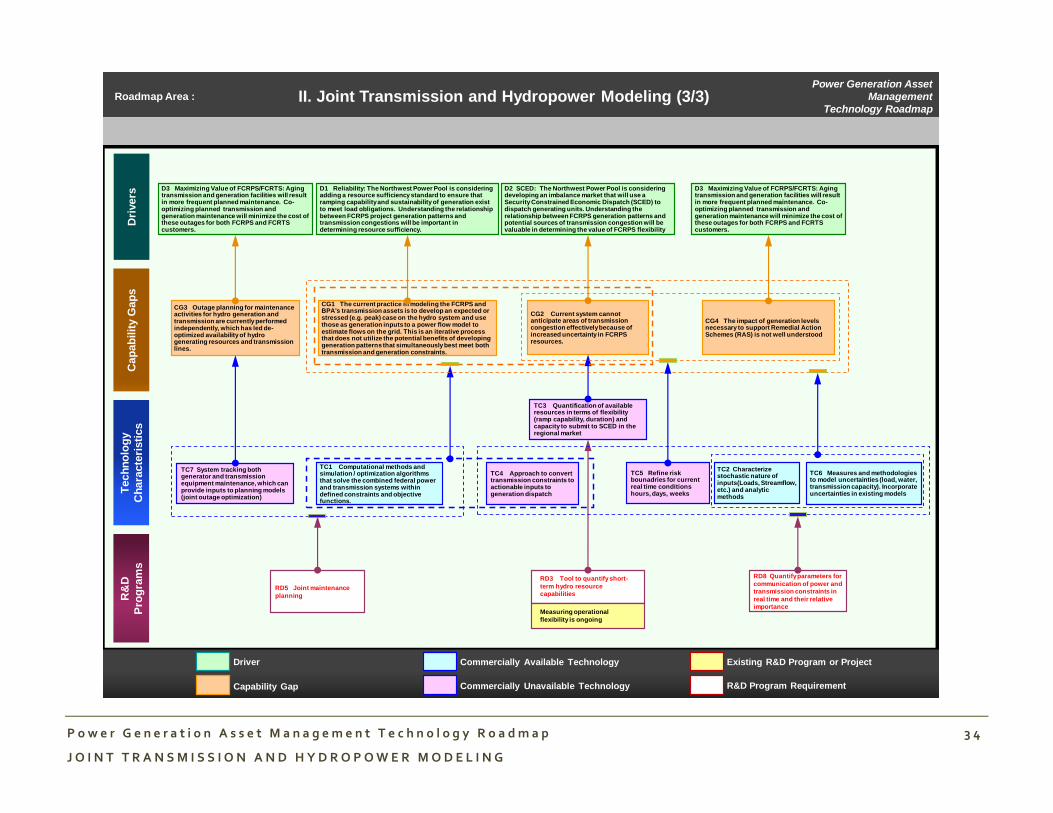
P o w e r G e n e r a t i o n A s s e t M a n a g e m e n t T e c h n o l o g y R o a d m a p 3 4
J O I N T T R A N S M I S S I O N A N D H Y D R O P O W E R M O D E L I N G
Roadmap Area :
R&D Program Requirement
Existing R&D Program or Project
Commercially Unavailable Technology
Commercially Available Technology
Capability Gap
Driver
Power Generation Asset
Management
Technology Roadmap
Dri
vers
Cap
ab
ilit
y G
ap
sT
ech
no
log
y
Ch
ara
cte
risti
cs
R&
D
Pro
gra
ms
II. Joint Transmission and Hydropower Modeling (3/3)
D1 Reliability: The Northwest Power Pool is considering adding a resource sufficiency standard to ensure that ramping capability and sustainability of generation exist to meet load obligations. Understanding the relationship between FCRPS project generation patterns and transmission congestions will be important in determining resource sufficiency.
D2 SCED: The Northwest Power Pool is considering developing an imbalance market that will use a Security Constrained Economic Dispatch (SCED) to dispatch generating units. Understanding the relationship between FCRPS generation patterns and potential sources of transmission congestion will be valuable in determining the value of FCRPS flexibility
D3 Maximizing Value of FCRPS/FCRTS: Aging transmission and generation facilities will result in more frequent planned maintenance. Co-optimizing planned transmission and generation maintenance will minimize the cost of these outages for both FCRPS and FCRTS customers.
CG1 The current practice in modeling the FCRPS and BPA's transmission assets is to develop an expected or stressed (e.g. peak) case on the hydro system and use those as generation inputs to a power flow model to estimate flows on the grid. This is an iterative process that does not utilize the potential benefits of developing generation patterns that simultaneously best meet both transmission and generation constraints.
CG2 Current system cannot anticipate areas of transmission congestion effectively because of increased uncertainty in FCRPS resources.
CG4 The impact of generation levels necessary to support Remedial Action Schemes (RAS) is not well understood
TC1 Computational methods and simulation / optimization algorithms that solve the combined federal power and transmission systems within defined constraints and objective functions.
TC3 Quantification of available resources in terms of flexibility (ramp capability, duration) and capacity to submit to SCED in the regional market
TC4 Approach to convert transmission constraints to actionable inputs to generation dispatch
TC5 Refine risk bounadries for current real time conditions hours, days, weeks
RD5 Joint maintenance
planning
RD8 Quantify parameters for
communication of power and
transmission constraints in
real time and their relative
importance
RD3 Tool to quantify short-
term hydro resource
capabilities
Measuring operational
flexibility is ongoing
TC2 Characterize stochastic nature of inputs(Loads, Streamflow, etc.) and analytic methods
TC6 Measures and methodologies to model uncertainties (load, water, transmission capacity). Incorporate uncertainties in existing models
TC7 System tracking both generator and transmission equipment maintenance, which can provide inputs to planning models (joint outage optimization)
CG3 Outage planning for maintenance activities for hydro generation and transmission are currently performed independently, which has led de-optimized availability of hydro generating resources and transmission lines.
D3 Maximizing Value of FCRPS/FCRTS: Aging transmission and generation facilities will result in more frequent planned maintenance. Co-optimizing planned transmission and generation maintenance will minimize the cost of these outages for both FCRPS and FCRTS customers.

P o w e r G e n e r a t i o n A s s e t M a n a g e m e n t T e c h n o l o g y R o a d m a p 3 5
J O I N T T R A N S M I S S I O N A N D H Y D R O P O W E R M O D E L I N G
R&D Program Summaries
Joint maintenance planning. FCRPS and FCRTS maintenance
planning activities are largely? Processes that do not fully
considers inputs on both P&T systems. This research effort would
focus on developing a joint planning system that considers (T.P)
constraints while minimizing the collective economic impact.
Key research questions:
1. Can an algorithm be developed that optimizes T, P
maintenance?
2. Which system, P or T, is most constrained? (Is it
seasonal?)
3. Can co-optimized plans feed downstream operational
models?
4. What is the estimated reduction in costs between plan vs.
optimized results vs. blend?
Existing research: None identified.
Tool to quantify short-term hydro resource capabilities.
Development of a tool that quantify the capability of hydro
resources in terms of flexibility and capacity to facilitate the
participation of regional power market. The tool should consider
the resources and transmission constraints.
Key research questions:
1. Does the tool offer robust performance against change of
inputs and constraints?
2. Does it allow quantification of future consequences on
resource adequacy, economics?
3. Does it provide a view of resource availability and impacts
over multiple time horizons?
4. How does it measure and communicate flexibility?
Existing research: Measuring operational flexibility is ongoing
Quantify parameters for communication of power and
transmission constraints in real time and their relative
importance. Current information on generation sufficiency is
difficult to obtain as parameters need for transmission and
generation are communicated inconsistently and infrequently real
time system optimization requires revised models using
Key research questions:
1. What are the characteristics short term of stochastic
inputs (load, stream flow, etc) to scheduling and at what
frequency do they impact (hourly, daily, monthly)?
P o w e r G e n e r a t i o n A s s e t M a n a g e m e n t T e c h n o l o g y R o a d m a p 3 6
J O I N T T R A N S M I S S I O N A N D H Y D R O P O W E R M O D E L I N G
parameters that include real time (hourly, daily, weekly)
stochastic inputs, identification of constraint impacts between
generation and transmission and method for feedback
optimization to limit risk.
2. How does risk respond to greater granularity on stochastic
inputs?
3. How are resource constraints for transmission impacted
with greater granularity on inputs?
4. How are generation constrains for generation impacted
with greater granularity on impacts?
5. How is uncertainty better modeled with greater
granularity on inputs?
Existing research: None identified.
P o w e r G e n e r a t i o n A s s e t M a n a g e m e n t T e c h n o l o g y R o a d m a p 3 7
S T A T E A W A R E N E S S
S T A T E A W A R E N E S S
Roadmap Area Definition
Large amounts of data are used to assess the current and near-term
state of the FCRPS, and the amount of data is likely to increase in
response to new initiatives (15-minutes scheduling, zonal/nodal
scheduling (EIM), etc…). Conventional approaches have sought to
create displays for similar data types and efficient navigation between
displays. This could be advanced by researching what data types are
used to support routine decisions and develop data-rich displays that
present several data types in ways that the brain can process more
efficiently than the current standard.
Summary
They hydro system operators need greater state awareness to handle
future challenges. Increased variable resources, reliability
requirements, sufficiency standards, SCADA, EIM, and the goal of
maximizing the value of FCRPS are all drivers for improved state
awareness technology. Our current displays and available operational
data are barely meeting our current needs. We must anticipate our
future needs and develop tools to meet upcoming challenges.
Our current tools rely on numerical data and tabular displays. This
approach becomes unwieldy as the amount of data collected and used
for decisions increases. The schedulers need good displays with multi-
dimensional data to make informed and correct decisions. One
obstacle to the development of such tools is the current organization of
data in which multiple databases are used with multiple firewalls.
This makes it difficult for the user to get the appropriate data
displayed in the time frame required.
A number of research projects have addressed some of these
challenges. Projects to consolidate data can help to reduce data silos
and develop a single source for data management. Some work has
been done to create multi-dimensional displays using existing tools,
but results have been limited. Many users continue to rely on dense
tabular displays. A solution that aggregates data from many disparate
sources, and creates more sophisticated visualizations will be needed
to make a measureable improvement in overall state awareness.
An effective way to address this need will be to follow a proof-of-
concept methodology, as outlined:
1. Work with control room staff (and other core constituents) to
identify visualization needs based on real-world use cases (multiple
needs may be identified).
2. Identify the information that would be needed to create the content
for the identified display(s).
3. Develop prototype displays, and evaluate them against the existing
capability gaps in state awareness.
The insights and observations of the subject matter experts who
participated in Workshop were presented, summarized, and reviewed
by:
Bill Snavely (Primate Technologies, Inc.)
Francis Halpin (Bonneville Power Administration)

P o w e r G e n e r a t i o n A s s e t M a n a g e m e n t T e c h n o l o g y R o a d m a p 3 8
S T A T E A W A R E N E S S
Roadmap Area :
R&D Program Requirement
Existing R&D Program or Project
Commercially Unavailable Technology
Commercially Available Technology
Capability Gap
Driver
Power Generation Asset
Management
Technology Roadmap
Dri
ve
rsC
ap
ab
ilit
y G
ap
sT
ec
hn
olo
gy
Ch
ara
cte
ris
tic
s
R&
D
Pro
gra
ms
D1 Balancing Reserves for Variable Resource Integration: Additional variable resources being built in the BPA Balancing Authority will increase the demand for flexible resource to provide balance reserves. The FCRPS requires as many generating units online as possible reserves.
CG1 Existing data and information processing tool and visualized decision support system barely meet the needs of today’s world.
CG2 No effective data and information processing tool and visualized decision support system exists for new initiatives.
CG3 Current data visualization displays design is decades old
TC1 Informatics investigation: Better understanding of how data influences decisions and actions. Data driven decisions instead of gut driven decisions
TC2 Middle ware or data collection system that reach out to all sources of data and either bring it into a web page directly or prepare it to be read by a web page. Needs to support hundreds views without crashing databases. Data and displays need to refresh as frequently as every 8 sec.
TC6 3rd party access to data to increase use of data while reducing BPA reporting requirements
TC7 Single source for data management reduce data silos. More organizational issue but important for technology solutions to be effective
RD1 Study on how data can better support and
document decision and actions. BPA wishes to
have a better understanding of how data can
lead to quicker decisions and actions
RD2 Advanced data mining, Big
Data organization, and/or advanced
analytics to support situational
awareness.
RD5 External consumers of data
III. State Awareness (1/2)
CG4 Data resides in separate systems which do not "talk" to each other
D2 Reliability: The Northwest Power Pool is considering adding a resource sufficiency standard to ensure that ramping capability and sustainability of generation exist to meet load obligations. Understanding the relationship between FCRPS project generation patterns and transmission congestions will be important in determining resource sufficiency.
D3 Maximizing Value of FCRPS: As the facilities age, the equipment degrades, and the likelihood of damage or failure increase. Such failure can results in forced outages of units which results in less FCRPS capability to make secondary sales of energy in high value periods.
D4 SCED: The Northwest Power Pool is considering developing an imbalance market that will use a Security Constrained Economic Dispatch (SCED) to dispatch generating units. Understanding the relationship between FCRPS generation patterns and potential sources of transmission congestion will be valuable in determining the value of FCRPS flexibility.
D5 Big Data: Large amounts of data are used to assess the current and near-term state of the FCRPS, and the amount of data is likely to increase in response to new initiatives (15-minutes scheduling, zonal/nodal scheduling (SCED), etc.). Conventional approaches have sought to create displays for similar data types and efficient navigation between displays.
CG5 A view of the future state of the transmission system is needed. Awareness of planned outages or pending constraints on the transmission system will allow real-time decisions to be made that are compatible with the future capabilities of the transmission system.

P o w e r G e n e r a t i o n A s s e t M a n a g e m e n t T e c h n o l o g y R o a d m a p 3 9
S T A T E A W A R E N E S S
R&D Program Summaries
Study on how data can better support and document
decision and actions. Understanding of how data can lead to
quicker decisions and actions.
Key research questions:
1. Different technologies (GEO, Tables, Graphs, etc.) type
into visualization solutions and results. Study best type?
Existing research: None identified.
External consumers of data. Make information that is
available to control room staff also available to external users.
Key research questions:
1. Who are the external users?
2. How do they want information presented?
3. How do you handle controls, permissions?
Existing research: None identified.
Advanced data mining, Big Data organization, and/or
advanced analytics to support situational awareness.
Technology needs to integrate with a variety of data sources, type
and time step. Data eventually will be displayed in web base data
visualization displays. Technology may or may not include final
web product.
Key research questions:
1. How to integrate data from many sources and how to
visualize it for awareness purpose?
2. How to identify data of candidate interfaces available for
each system?
Existing research: None identified.

P o w e r G e n e r a t i o n A s s e t M a n a g e m e n t T e c h n o l o g y R o a d m a p 4 0
S T A T E A W A R E N E S S
Roadmap Area :
R&D Program Requirement
Existing R&D Program or Project
Commercially Unavailable Technology
Commercially Available Technology
Capability Gap
Driver
Power Generation Asset
Management
Technology Roadmap
Dri
vers
Cap
ab
ilit
y G
ap
sT
ech
no
log
y
Ch
ara
cte
risti
cs
R&
D
Pro
gra
ms
D1 Balancing Reserves for Variable Resource Integration: Additional variable resources being built in the BPA Balancing Authority will increase the demand for flexible resource to provide balance reserves. The FCRPS requires as many generating units online as possible reserves.
CG1 Existing data and information processing tool and visualized decision support system barely meet the needs of today’s world.
CG2 No effective data and information processing tool and visualized decision support system exists for new initiatives.
CG3 Current data visualization displays design is decades old
TC3 Real time situational awareness displays of tables and graphs will not meet the needs of future hydro system operation. Display design or data organization need to be brought up to a 21st century standard
TC4 Flexible views for users functions - retain consistency
TC5Design process ( with operations) based on use cases
RD3 Innovated and novel data
visualization design or data layout
for the Federal Columbia River
Power System.
RD4 Situational Awareness
Prototype Design
III. State Awareness (2/2)
D2 Reliability: The Northwest Power Pool is considering adding a resource sufficiency standard to ensure that ramping capability and sustainability of generation exist to meet load obligations. Understanding the relationship between FCRPS project generation patterns and transmission congestions will be important in determining resource sufficiency.
CG5 A view of the future state of the transmission system is needed. Awareness of planned outages or pending constraints on the transmission system will allow real-time decisions to be made that are compatible with the future capabilities of the transmission system.

P o w e r G e n e r a t i o n A s s e t M a n a g e m e n t T e c h n o l o g y R o a d m a p 4 1
S T A T E A W A R E N E S S
R&D Program Summaries
Innovated and novel data visualization design or data
layout for the Federal Columbia River Power System. Data
can include river hydrology, power generation, unit availability,
transmission inventory, etc. Designs need to be deployable to a
web environment.
Key research questions:
1. What data associated with environment needs to be
included about river hydrology, unit availability, and
transmission inventory? What new data types are likely
to have impotence to users?
2. What can be shown visually to provide upcoming alerts-a
per-emergency view- of information before a dispatcher
calls?
3. What types of displays can be developed for users who
historically prefer tabular data?
Existing research: None identified.
Situational Awareness Prototype Design. Design ultimate
system based upon resources available today and ability to
interface with each of the resources..
Key research questions:
1. Identify ease of access versus operational value to drive
delivery?
Existing research: None identified.

P o w e r G e n e r a t i o n A s s e t M a n a g e m e n t T e c h n o l o g y R o a d m a p 4 2
S T A T E A W A R E N E S S

P o w e r G e n e r a t i o n A s s e t M a n a g e m e n t T e c h n o l o g y R o a d m a p 4 3
H Y D R O P O W E R R E L I A B I L I T Y A N D L I F E E X T E N S I O N
H Y D R O P O W E R R E L I A B I L I T Y A N D L I F E E X T E N S I O N
Roadmap Area Definition
As the facilities age, the conditions degrade, and the likelihood of
equipment damage or failure increases. Such failures can result in
forced outages of units that can hamper BPA’s ability to meet power
demand, the Dam’s ability to meet other operating constraints, and
can force additional spill. Failures can pose safety risks and
unplanned outages can prove costly. As the equipment ages, the
safest approach would be to plan replacements after the equipment
has exceeded its design life and failure risk has increased, however,
funding resources are limited and this is not always possible.
Therefore it is critical to find new tools to predict failure or damage
which could increase safety and extend the life of the units.
Summary
Hydro power plants turbines face enormous wear and tear from
cavitation, cracking, and corrosion. Currently we repair worn blades
due to cavitation, corrosion by welding material back on the blades.
BPA could research how it might be possible to make a physical model
of the material that needs to be filled in and then have it blasted on
the blade so that it adheres to the blades.
Addressing these drivers we need to think of tools that can detect
vibration e.g. vibration sensors. A non-research issue that needs to be
addressed is what do you with all the data currently have and how do
we use that data. Additionally what are other industries doing with
their data?
The insights and observations of the subject matter experts who
participated in Workshop were presented, summarized, and reviewed
by:
Jack Kolze (Bonneville Power Administration)
George Brown II (Bonneville Power Administration)

P o w e r G e n e r a t i o n A s s e t M a n a g e m e n t T e c h n o l o g y R o a d m a p 4 4
H Y D R O P O W E R R E L I A B I L I T Y A N D L I F E E X T E N S I O N
Roadmap Area :
R&D Program Requirement
Existing R&D Program or Project
Commercially Unavailable Technology
Commercially Available Technology
Capability Gap
Driver
Power Generation Asset
Management
Technology Roadmap
Dri
vers
Cap
ab
ilit
y G
ap
sT
ech
no
log
y
Ch
ara
cte
risti
cs
R&
D
Pro
gra
ms
IV. Hydropower Reliability and Life Extension (1/4)
RD1 Explosive cladding for
cavitation damage repair.
RD3 Acoustic characterization of
cavitation.
RD5 Safety, Health and
environmental improvements.
TC16 Explosive cladding as a technique for cavitation damage repair on large surfaces of runner blades. - grind the damaged surface ; measure surface profile ; mill a "patch" to fit the measured profile ; explosively attach the patch to the blade.
TC17 Identification of damaging cavitation and location 3D picture -Identified in x, y, z, time.
TC18 Environmentlly acceptable improvements/ risk mitigations. Transformer type insulation oil/gas ; Ester oil/SF6 ; oilesskaplans, environmental friendly oil in plant ; environmental improvements.
TC19 Safety improvements: noise as part of spec ; noise reduction ; arc flash mitigation - modification to designs - over and above current commercially available equipment.
CG1 Need ability to assess condition and predict failure in order to assure safe and efficient operation.
CG2 Need typical failure mode data, to inform maintenance and replacement decisions.
CG3 Need comprehensive real time assessment of value of availability at each plant, to inform maintenance practices, outage extensions, and outage durations. Current power demand, price, flexibility, and flow must be considered.
D1 Balancing Reserves for Variable Resource Integration: Additional variable resources being built in the BPA Balancing Authority will increase the demand for flexible resources to provide balancing reserves. The FCRPS requires as many generating units online as possible to provide sufficient balancing reserves.
D2 Reliability: As the facilities age, the equipment degrades, and the likelihood of damage or failure increases. Such failures can result in forced outages of units that can hamper BPA's ability to meet customer power demand and can pose safety risks.
D3 BiOp and other High-Priority Operational Objectives: As the facilities age, the equipment degrades, and the likelihood of damage or failure increases. Such failures can result in forced outages of units that can hamper BPA's ability to meet BiOp and other High-Priority operational objectives without spilling in excess of state water quality standards.
D4 Maximizing Value of FCRPS: As the facilities age, the equipment degrades, and the likelihood of damage or failure increases. Such failures can result in forced outages of units which results in less FCRPS capability to make secondary sales of energy in high value periods.

P o w e r G e n e r a t i o n A s s e t M a n a g e m e n t T e c h n o l o g y R o a d m a p 4 5
H Y D R O P O W E R R E L I A B I L I T Y A N D L I F E E X T E N S I O N
R&D Program Summaries
Explosive cladding for cavitation damage repair. Use
explosive cladding to apply a pre-cutted and shaped “patch” to a
large surface area of a cavitation-damaged blade. Envisioned
steps: (1) remove damage by grinding, (2) measure x, y, z
coordinates of excavated area, (3) manufacture a patch to match x,
y, z coordinates, (4) explosively clad patch to blade.
Key research questions:
1. Can the explosive cladding be done safely without
disassembly of the unit?
2. What are the costs/economics of this approach vs.
traditional weld overlay and grind?
3. What are the positioning and accuracy limits?
4. Can exotic materials such as satellite be used?
Existing research: None identified.
Safety, health and environmental improvements. Reduce
risk to safety, health, and the environment through improved
engineering controls and designs.
Key research questions:
1. What are the inputs to improved hydro-plant hazard
mitigation?
2. What existing environmental tools to improve
environmental performance and mitigate environmental
risk of hydro-plants?
Existing research: None identified.
Acoustic characterization of cavitation. Identify location and
intensity of cavitation. Use acoustics to locate the cav in x, y, z, t
domain within the rotating runner field. Determine if the
cavitation is “touching” metal surfaces.
Key research questions:
1. Is the cavitation occurring in the free stream or contacting
metal surfaces?
2. What is the location of the origins: leading edge, aeral,
channel vertices, cone torch?
3. How “intense” is the cavitation?
Existing research: None identified.
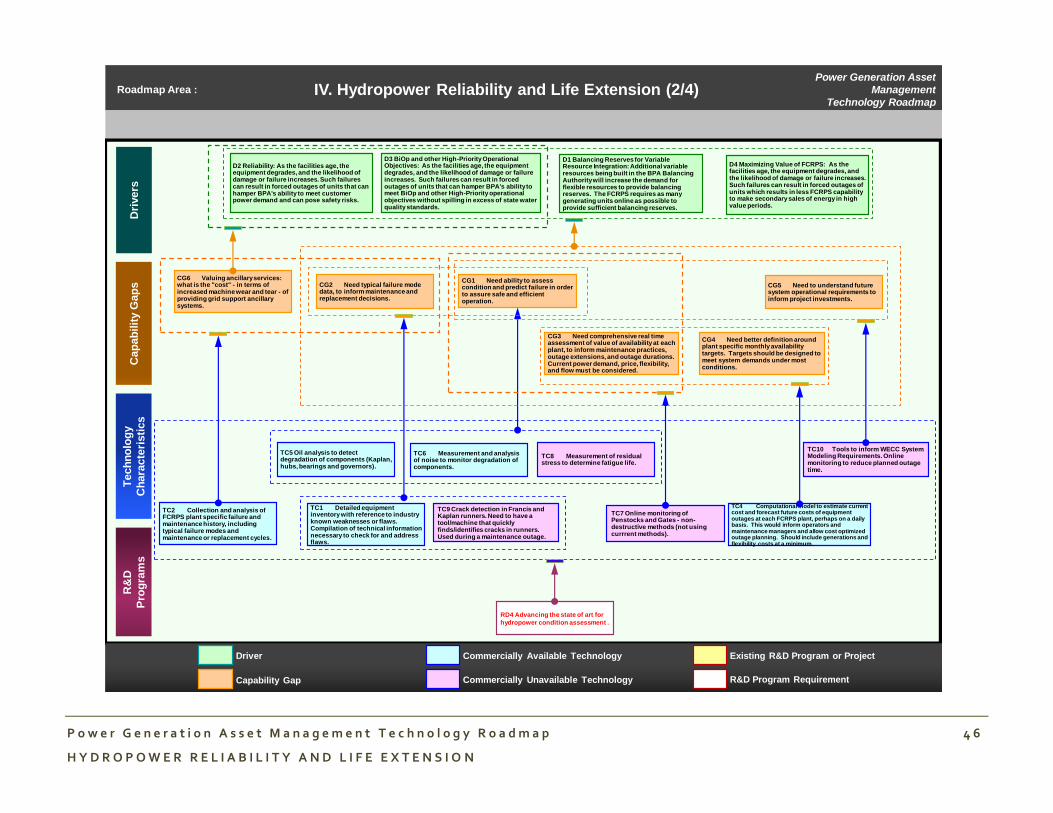
P o w e r G e n e r a t i o n A s s e t M a n a g e m e n t T e c h n o l o g y R o a d m a p 4 6
H Y D R O P O W E R R E L I A B I L I T Y A N D L I F E E X T E N S I O N
Roadmap Area :
R&D Program Requirement
Existing R&D Program or Project
Commercially Unavailable Technology
Commercially Available Technology
Capability Gap
Driver
Power Generation Asset
Management
Technology Roadmap
Dri
vers
Cap
ab
ilit
y G
ap
sT
ech
no
log
y
Ch
ara
cte
risti
cs
R&
D
Pro
gra
ms
IV. Hydropower Reliability and Life Extension (2/4)
RD4 Advancing the state of art for
hydropower condition assessment .
TC5 Oil analysis to detect degradation of components (Kaplan, hubs, bearings and governors).
TC6 Measurement and analysis of noise to monitor degradation of components.
TC7 Online monitoring of Penstocks and Gates - non-destructive methods (not using currrent methods).
TC8 Measurement of residual stress to determine fatigue life.
TC9 Crack detection in Francis and Kaplan runners. Need to have a tool/machine that quickly finds/identifies cracks in runners. Used during a maintenance outage.
TC10 Tools to inform WECC System Modeling Requirements. Online monitoring to reduce planned outage time.
CG1 Need ability to assess condition and predict failure in order to assure safe and efficient operation.
CG2 Need typical failure mode data, to inform maintenance and replacement decisions.
CG3 Need comprehensive real time assessment of value of availability at each plant, to inform maintenance practices, outage extensions, and outage durations. Current power demand, price, flexibility, and flow must be considered.
CG5 Need to understand future system operational requirements to inform project investments.
D1 Balancing Reserves for Variable Resource Integration: Additional variable resources being built in the BPA Balancing Authority will increase the demand for flexible resources to provide balancing reserves. The FCRPS requires as many generating units online as possible to provide sufficient balancing reserves.
D2 Reliability: As the facilities age, the equipment degrades, and the likelihood of damage or failure increases. Such failures can result in forced outages of units that can hamper BPA's ability to meet customer power demand and can pose safety risks.
D3 BiOp and other High-Priority Operational Objectives: As the facilities age, the equipment degrades, and the likelihood of damage or failure increases. Such failures can result in forced outages of units that can hamper BPA's ability to meet BiOp and other High-Priority operational objectives without spilling in excess of state water quality standards.
D4 Maximizing Value of FCRPS: As the facilities age, the equipment degrades, and the likelihood of damage or failure increases. Such failures can result in forced outages of units which results in less FCRPS capability to make secondary sales of energy in high value periods.
TC1 Detailed equipment inventory with reference to industry known weaknesses or flaws. Compilation of technical information necessary to check for and address flaws.
TC2 Collection and analysis of FCRPS plant specific failure and maintenance history, including typical failure modes and maintenance or replacement cycles.
TC4 Computational model to estimate current cost and forecast future costs of equipment outages at each FCRPS plant, perhaps on a daily basis. This would inform operators and maintenance managers and allow cost optimized outage planning. Should include generations and flexibility costs at a minimum.
CG6 Valuing ancillary services: what is the "cost" - in terms of increased machine wear and tear - of providing grid support ancillary systems.
CG4 Need better definition around plant specific monthly availability targets. Targets should be designed to meet system demands under most conditions.

P o w e r G e n e r a t i o n A s s e t M a n a g e m e n t T e c h n o l o g y R o a d m a p 4 7
H Y D R O P O W E R R E L I A B I L I T Y A N D L I F E E X T E N S I O N
R&D Program Summaries
Advancing the state of art for hydropower condition
assessment. A variety of efforts to improve condition assessment
methodologies and technologies.
Key research questions:
1. Can an online oil analysis system be developed and
applied to degradation of equipment?
2. Can noise (audio sensors) be used to predict degradation of
components?
3. Can an online tool , using non-destructive methods, be
used to monitor penstocks and gates?
4. Can measurement of residual stress determine fatigue
life?
5. Is there a way to quickly find cracks on blades when they
are un-watered?
6. Can new or existing monitoring equipment, online, be used
for all or part of WECC system modeling requirements?
Existing research: None identified.

P o w e r G e n e r a t i o n A s s e t M a n a g e m e n t T e c h n o l o g y R o a d m a p 4 8
H Y D R O P O W E R R E L I A B I L I T Y A N D L I F E E X T E N S I O N
Roadmap Area :
R&D Program Requirement
Existing R&D Program or Project
Commercially Unavailable Technology
Commercially Available Technology
Capability Gap
Driver
Power Generation Asset
Management
Technology Roadmap
Dri
vers
Cap
ab
ilit
y G
ap
sT
ech
no
log
y
Ch
ara
cte
risti
cs
R&
D
Pro
gra
ms
IV. Hydropower Reliability and Life Extension (3/4)
RD2 Monitoring of equipment -
Industry Standards.
TC5 Oil analysis to detect degradation of components (Kaplan, hubs, bearings and governors).
TC6 Measurement and analysis of noise to monitor degradation of components.
TC8 Measurement of residual stress to determine fatigue life.
TC17 Identification of damaging cavitation and location 3D picture -Identified in x, y, z, time.
TC18 Environmentlly acceptable improvements/ risk mitigations. Transformer type insulation oil/gas ; Ester oil/SF6 ; oiless kaplans, environmental friendly oil in plant ; environmental improvements.
CG1 Need ability to assess condition and predict failure in order to assure safe and efficient operation.
CG2 Need typical failure mode data, to inform maintenance and replacement decisions.
D1 Balancing Reserves for Variable Resource Integration: Additional variable resources being built in the BPA Balancing Authority will increase the demand for flexible resources to provide balancing reserves. The FCRPS requires as many generating units online as possible to provide sufficient balancing reserves.
D2 Reliability: As the facilities age, the equipment degrades, and the likelihood of damage or failure increases. Such failures can result in forced outages of units that can hamper BPA's ability to meet customer power demand and can pose safety risks.
D3 BiOp and other High-Priority Operational Objectives: As the facilities age, the equipment degrades, and the likelihood of damage or failure increases. Such failures can result in forced outages of units that can hamper BPA's ability to meet BiOp and other High-Priority operational objectives without spilling in excess of state water quality standards.
D4 Maximizing Value of FCRPS: As the facilities age, the equipment degrades, and the likelihood of damage or failure increases. Such failures can result in forced outages of units which results in less FCRPS capability to make secondary sales of energy in high value periods.
TC2 Collection and analysis of FCRPS plant specific failure and maintenance history, including typical failure modes and maintenance or replacement cycles.
TC3 Collection and analysis of industry wide typical failure modes and recommendations for maintenance or replacement cycles.
TC4 Computational model to estimate current cost and forecast future costs of equipment outages at each FCRPS plant, perhaps on a daily basis. This would inform operators and maintenance managers and allow cost optimized outage planning. Should include generations and flexibility costs at a minimum.
CG6 Valuing ancillary services: what is the "cost" - in terms of increased machine wear and tear - of providing grid support ancillary systems.
CG3 Need comprehensive real time assessment of value of availability at each plant, to inform maintenance practices, outage extensions, and outage durations. Current power demand, price, flexibility, and flow must be considered.
CG4 Need better definition around plant specific monthly availability targets. Targets should be designed to meet system demands under most conditions.

P o w e r G e n e r a t i o n A s s e t M a n a g e m e n t T e c h n o l o g y R o a d m a p 4 9
H Y D R O P O W E R R E L I A B I L I T Y A N D L I F E E X T E N S I O N
R&D Program Summaries
Monitoring of equipment – Industry standards. How does the
hydropower data compare with other industry?. Does other
industries use data from field in ways that the hydropower
industry could benefit.
Key research questions:
1. What do other electric gen producers monitor?
2. Benchmarks? Replacements?
3. How do they integrate monitoring data into their
preventive maintenance programs? Existing research: None identified.

P o w e r G e n e r a t i o n A s s e t M a n a g e m e n t T e c h n o l o g y R o a d m a p 5 0
H Y D R O P O W E R R E L I A B I L I T Y A N D L I F E E X T E N S I O N
Roadmap Area :
R&D Program Requirement
Existing R&D Program or Project
Commercially Unavailable Technology
Commercially Available Technology
Capability Gap
Driver
Power Generation Asset
Management
Technology Roadmap
Dri
vers
Cap
ab
ilit
y G
ap
sT
ech
no
log
y
Ch
ara
cte
risti
cs
R&
D
Pro
gra
ms
IV. Hydropower Reliability and Life Extension (4/4)
RD6 Improved analytics + planning
tools for hydropower reliability and
life extension.
TC11 Real-time condition monitoring - predictive maintenance.
TC12 Algorythm to the condition monitoring to dispatch.
TC13 Improved planning tools. Reduce frequency of outages (turbine, XFMR, generator, breakers, governors, excitation, etc.) to inform betters flexibility.
TC14 Develop a system that would allow the industry to create benchmarks related to condition monitoring/assessment, preventive maintenance, etc.. to help companies make large capital investment decisions.
TC15 Evaluating benefits of performance testing multiple hydropower machines in a family to inform improved operational/dispatch decisions.
CG1 Need ability to assess condition and predict failure in order to assure safe and efficient operation.
CG2 Need typical failure mode data, to inform maintenance and replacement decisions.
CG3 Need comprehensive real time assessment of value of availability at each plant, to inform maintenance practices, outage extensions, and outage durations. Current power demand, price, flexibility, and flow must be considered.
CG5 Need to understand future system operational requirements to inform project investments.
D1 Balancing Reserves for Variable Resource Integration: Additional variable resources being built in the BPA Balancing Authority will increase the demand for flexible resources to provide balancing reserves. The FCRPS requires as many generating units online as possible to provide sufficient balancing reserves.
D2 Reliability: As the facilities age, the equipment degrades, and the likelihood of damage or failure increases. Such failures can result in forced outages of units that can hamper BPA's ability to meet customer power demand and can pose safety risks.
D3 BiOp and other High-Priority Operational Objectives: As the facilities age, the equipment degrades, and the likelihood of damage or failure increases. Such failures can result in forced outages of units that can hamper BPA's ability to meet BiOp and other High-Priority operational objectives without spilling in excess of state water quality standards.
D4 Maximizing Value of FCRPS: As the facilities age, the equipment degrades, and the likelihood of damage or failure increases. Such failures can result in forced outages of units which results in less FCRPS capability to make secondary sales of energy in high value periods.

P o w e r G e n e r a t i o n A s s e t M a n a g e m e n t T e c h n o l o g y R o a d m a p 5 1
H Y D R O P O W E R R E L I A B I L I T Y A N D L I F E E X T E N S I O N
R&D Program Summaries
Improved analytics + planning tools for hydropower
reliability and life extension. This R&D program uses data
from improved condition monitoring technologies + methodologies,
and provides a software tool to guide decision-making. This
includes improved scheduling of planned outages, tracks/predicts
degradation of equipment, provides suggested replacement
intervals for major assets. It also ties this information to dispatch.
Key research questions:
1. How can raw data from various sensors/equipment in
various generation assets be integrated into a
management tool at the programmatic level?
2. What are industry benchmarks for planning and planning
tools?
3. Who are the target users or this planning tool? Projects?
Executive planners? Traders?
4. What information is needed by each of these groups to
help better do their job?
Existing research: None identified.

P o w e r G e n e r a t i o n A s s e t M a n a g e m e n t T e c h n o l o g y R o a d m a p 5 2
H Y D R O P O W E R R E L I A B I L I T Y A N D L I F E E X T E N S I O N
P o w e r G e n e r a t i o n A s s e t M a n a g e m e n t T e c h n o l o g y R o a d m a p 5 3
L o a d a n d O b l i g a t i o n s F o r e c a s t i n g
L O A D A N D O B L I G A T I O N S F O R E C A S T I N G
Roadmap Area Definition
Summary
Two primary themes emerged during the discussions: data (collection,
storage, retrieval, validation) and model improvement. Data collection
methods to ensure timely and accurate data, these methods must have
the ability to identify outliers. Model improvement can take many
forms. The best place to start is by identifying where our current
modeling approach is likely to fail. Improving the model for failures
that occur at key times (e.g. winter cold snaps, etc. ) provides the most
immediate benefit to BPA.
Identify / list short term load forecasting modeling methodology used
by other utilities. BPA uses a neural network model that performs
well in some conditions and not as well in other conditions. Perhaps
another utility is using a different type of model or combinations of
models.
Given the correlation between load and weather, having a better
understanding about the error of the weather forecast is important.
And determine the effect of auto-correlation in the neural network
model and how best to address it.
Need to consider a hybrid model system and/or switch control system
as a way to deal with data outliers and develop a more adaptive load
forecast model.
The insights and observations of the subject matter experts who
participated in Workshop were presented, summarized, and reviewed
by:
Cheryl Woodall (Bonneville Power Administration)
Reed Davis (Bonneville Power Administration)

P o w e r G e n e r a t i o n A s s e t M a n a g e m e n t T e c h n o l o g y R o a d m a p 5 4
L o a d a n d O b l i g a t i o n s F o r e c a s t i n g
Roadmap Area :
R&D Program Requirement
Existing R&D Program or Project
Commercially Unavailable Technology
Commercially Available Technology
Capability Gap
Driver
Power Generation Asset
Management
Technology Roadmap
Dri
vers
Cap
ab
ilit
y G
ap
sT
ech
no
log
y
Ch
ara
cte
risti
cs
R&
D
Pro
gra
ms
V. Load and Obligations Forecasting
D1 Reliability: The Northwest Power Pool is considering adding a resource sufficiency standard to ensure that ramping capability and sustainability of generation exist to meet load obligations. Accurate load forecasts will be required to ensure resource sufficiency
D2 Maximizing Value of FCRPS: Secondary marketing of any remaining FCRPS flexibility lowers power rates. However, the amount of remaining flexibility for secondary marketing can be limited due to uncertainty in load forecasts.
D3 SCED: The Northwest Power Pool is considering developing an imbalance market that will use a Security Constrained Economic Dispatch (SCED) to dispatch generating units. This will require a determination disaggregated load forecasts that can be used by the market operator.
CG1 Current load forecasts do not consider humidity and wind chill.
CG2 Uncertainty associated with loads and obligations (especially Slice and irrigation load) is not well understood.
CG3 Current load forecasts are aggregated at the Balancing Authority level.
TC5 Expand models to understand load types, associated drivers, by location.
TC1 Wind chill and humidity impact loads in the Pacific Northwest.
TC2 Research on the uncertainty that results from BPA loads and obligations.
TC3 Methodology on how to disaggregate BPA area loads to a level that can be used by the SCED.
TC7 Hybrid Systems/Switched Control Systems: (1) to handle "outlier" events that challenge current load forecasting models (2) allow for adaptive load forecast models.
TC6 Consider expanding weather variables by increasing quantity or variables and/or geographic granularity.
TC4 Identifying what customers are doing to manage their own load and uncertainty e.g. batteries, demand response.
TC8 Data Feedback Loop is too slow. Identify where data collection can be retrieved faster and incorporated in current models.
TC9 Separate uncertainty in weather forecast from the uncertainty in load.
RD2 Data Collection and
Handling Improvement.
RD3 Improved Load Forecasting
Model.
RD1 Adaptive Load Forecasting
Models.

P o w e r G e n e r a t i o n A s s e t M a n a g e m e n t T e c h n o l o g y R o a d m a p 5 5
L o a d a n d O b l i g a t i o n s F o r e c a s t i n g
R&D Program Summaries
Data Collection and Handling Improvement. Define
opportunities for BPA to improve load forecasting by improving
data collection, storage and retrieval.
Key research questions:
1. Identify relevant data that is not returned fast enough to
help with load forecast.
2. Recommend system changes that would increase the
feedback.
3. Design database changes that would speed data retrieval.
4. What data collection would increase the validity and
accuracy of load forecasting model?
Existing research: None identified.
Improved Load Forecasting Model. Improve the accuracy and
regional disaggregation at BPA area loads. This program seeks to
better capture the sensitivity of load to weather and to provide
geographically disaggregated loads.
Key research questions:
1. What are the underlying drivers at BPA short-term load
profile? Understand how different load types are affected
by different underlying drivers (e.g., weather,
precipitation, season, irrigation needs)?
2. What level of geographic aggregation and customer
aggregation provides load forecast with desired accuracy
and regional disaggregation?
3. Compare performance of artificial neural network and
regression based models for load forecasting?
4. Analyze failures to identify behavior issues?
Existing research: None identified.

P o w e r G e n e r a t i o n A s s e t M a n a g e m e n t T e c h n o l o g y R o a d m a p 5 6
L o a d a n d O b l i g a t i o n s F o r e c a s t i n g
Adaptive Load Forecasting Models. Fixed Load Forecast
Models (e.g.3 weather areas, aggregate model) may be challenged
under 1 in 10 years and large gradient events. In addition, the
new ability to monitor loads and resources (SWCE) allows
uncertainty to be better captured and understood.
Key research questions:
1. Can we detect when existing load forecasting tools will
fail? What metrics should be utilized (e.g. weather
parameter changes, electrical parameter values/changes)?
2. How many factors should be considered if “disaggregated “
load models for load forecasting should be utilized (e.g.
weather based service grouping ;electrical customer
type/behaviors) (agricultural, industrial, commercial…)?
3. What to do (e.g. switch model (2)?) if (1) occurs?
4. Uncertainty: Can we identify and attribute uncertainty in
load forecasts?
Existing research: None identified.
P o w e r G e n e r a t i o n A s s e t M a n a g e m e n t T e c h n o l o g y R o a d m a p 5 7
V A R I A B L E R E S O U R C E F O R E C A S T I N G
V A R I A B L E R E S O U R C E F O R E C A S T I N G
Roadmap Area Definition
Wind power forecasting can be greatly improved with the deployment
of weather monitoring equipment like anemometers. In 2009 BPA
deployed 14 new anemometers in the Northwest, bringing BPA’s met
tower network up to 20 sites. BPA is interested in a study that will
highlight where the next met tower should go. This study would
identify location for anemometers that would provide the most benefit
to wind power forecasting of wind generation in the BPA BAA.
BPA has traditionally used anemometers for weather monitoring to
support wind power forecasting. BPA would be interested in
investigating alternative or emerging technologies like SODAR or
LIDAR. Studies in the Midwest showed benefit but the technology
has not been testing in the complex terrain of the Northwest.
Summary
Emphasis of the discussion was on the need for more accurate
renewable forecasting. The focus was on 1-2 hr forecasts for wind and
solar. Since wind is currently predominant in the NW the focus of the
discussion was on wind, but solar-based generation is expected to grow
significantly in the NW in the coming years and the issues that should
be addressed to be prepared for that growth were discussed.
1. Technology Gaps for Wind in the Pacific NW
The primary technology gap is the lack of precise knowledge of what
variables need to be measured or where to measure the variables to
obtain maximum benefit in the performance of short-term wind-based
generation forecasts.
Four research areas that have the potential to address this gap were
identified:
1) A study to quantitatively assess the ways in which the BPA
operational decision-making process is sensitive to wind forecast error
and to define forecast error metrics that accurately represent that
sensitivity
2) An investigation of the forecast value that is provided by the
current network of (~20) BPA sensor sites based on the impact of the
data from these sites on the forecast error metrics identified in the
forecast sensitivity study (item #1).
3) An observation targeting study to determine the optimal
deployment of sensors to obtain the maximum forecast benefit/sensor
deployment cost ratio based on the forecast error sensitivity metrics
defined in item #1. The study would identify what variables to
measure, where to measure them, what sensors to use to measure
them and the likely impact on short-term forecast performance.
4) The development of a dynamic sensor deployment strategy that
would use mobile sensors to measure key atmospheric variables at the

P o w e r G e n e r a t i o n A s s e t M a n a g e m e n t T e c h n o l o g y R o a d m a p 5 8
V A R I A B L E R E S O U R C E F O R E C A S T I N G
locations that are optimal for specific seasons and/or weather regimes.
The study should also determine if this strategy has significant
benefit/cost advantages over an optimal static deployment strategy
2. Technology Gaps for Solar as an Emerging Generation Source in the
Pacific NW
The primary technology gap for the anticipated growth in solar-based
generation in the NW is the lack of information about the likely
impact of solar-based generation on the balancing process and the
information needed to optimize short-term forecasts for solar-based
generation in the NW. Four research areas were identified to address
these gaps:
1) A study to determine the current status of utility-scale and
distributed (i.e. behind-the-meter) solar-based generation in the
Pacific NW and the time-varying uncertainty inserted into the
balancing process by the variability associated with this generation.
2) An extension of the study in #1 to estimate the impact of the solar-
based generation on the balancing process over he next 10 or more
years based on reasonable scenarios of the growth of solar-based
generation over that period.
3) An investigation to determine the input data requirements to
facilitate the effective management of the uncertainty that will be
introduced into the balancing process by solar-based generation
growth over the next 10 years. This should include a specification of
the attributes of the generation assets that are needed as well as the
dynamic (real-time) data required for input into the short-term (hours
to a few days ahead) forecasting process for solar-based generation.
4) A study of the likely performance of state-of-the-art solar-based
generation forecasting methods in the Pacific NW and which methods
perform best in this area for both utility-scale and distributed solar-
based generation. This study should take advantage of the solar
forecasting research currently being supported by the DOE Sunshot
program.
The insights and observations of the subject matter experts who
participated in Workshop were presented, summarized, and reviewed
by:
John Zack (AWS TruePower)
Scott Winner (Bonneville Power Administration)

P o w e r G e n e r a t i o n A s s e t M a n a g e m e n t T e c h n o l o g y R o a d m a p 5 9
V A R I A B L E R E S O U R C E F O R E C A S T I N G
Roadmap Area :
R&D Program Requirement
Existing R&D Program or Project
Commercially Unavailable Technology
Commercially Available Technology
Capability Gap
Driver
Power Generation Asset
Management
Technology Roadmap
Dri
ve
rsC
ap
ab
ilit
y G
ap
sT
ec
hn
olo
gy
Ch
ara
cte
ris
tic
s
R&
D
Pro
gra
ms
VI. Variable Resource Forecasting (1/2)
RD3 Data requirements for solar
LGIA in BPA
RD4 Utilize R & D under DOE funded sun
shot program and solar power forecasting
systems developed under that program.
Apply methodologies to BPA BAA.
RD1 Determination of the optimal
inputs for solar power production
forecasts for the BPA control area.
DOE sponsored solar forecasting
projects led by NCAR and IBM.
TC3 Data to forecast solar generation in the pacific Northwest, both roof top distributed solar and utility level generating facilities
TC4 Solar power forecasting in the BPA BAA
CG4 Very little data and monitoring equipment available in the Pacific Northwest as it relates to solar generation (luminosity, cloud cover, etc…)
CG5 Ability to forecast solar generation has not been proven in the Pacific Northwest
D1 Balancing Reserves for Variable Resource Integration: Additional variable resources being built in the BPA Balancing Authority will increase the demand for flexible resources to provide balancing reserves. More accurate generation forecasts for variable resources and geographical diversity will reduce the demand for balancing reserves.

P o w e r G e n e r a t i o n A s s e t M a n a g e m e n t T e c h n o l o g y R o a d m a p 6 0
V A R I A B L E R E S O U R C E F O R E C A S T I N G
R&D Program Summaries
Data requirements for solar LGIA in BPA. Not defined. Key research questions:
1. Perform study to get good understanding of solar MW
growth in BPA in 10 – 15 years?
2. Data collection requirements for behind-the-meter solar
and utility –scale solar power?
3. Perform study of future PV growth‘s impacts on balancing.
4. What methodology will be best for forecasting behind-the-
meter solar? Bottom-up or Top-up?
Existing research: None identified.
Determination of the optimal inputs for solar power
production forecasts for the BPA control area. Not defined.
Key research questions:
1. What is the relative value of satellite based irradiance
data vs. ground based measurements for the performance
of solar power production forecasts? Existing research: None identified.
Utilize R & D under DOE funded sun shot program and
solar power forecasting systems developed under that
program. Apply methodologies to BPA BAA. Contents.
Key research questions:
1. What is the value of ground based measurements vs.
satellite cloud cover estimation?
2. What are specific characteristics of solar power forecasting
problem related to weather regimes (cloud cover) in BPA
BAA?
3. What is granularity of data that must be collected in order
to have an effective forecasting system?
Existing research: DOE Sun-shot program: Two teams, led by
IBM and NCAR are developing solar forecasting systems for
different lead times – short term, day ahead etc. Versions of the
Weather Research and Forecasting Model (WRF Solar) is being
developed – will be an open source.

P o w e r G e n e r a t i o n A s s e t M a n a g e m e n t T e c h n o l o g y R o a d m a p 6 1
V A R I A B L E R E S O U R C E F O R E C A S T I N G
Roadmap Area :
R&D Program Requirement
Existing R&D Program or Project
Commercially Unavailable Technology
Commercially Available Technology
Capability Gap
Driver
Power Generation Asset
Management
Technology Roadmap
Dri
vers
Cap
ab
ilit
y G
ap
sT
ech
no
log
y
Ch
ara
cte
risti
cs
R&
D
Pro
gra
ms
RD2 Improve observation and
location for wind forecast.
TC1 Identify location for anemometers that would provide the most benefit to forecasting of wind generation in the BPA BAA. Study to highlight where monitoring equipment should installed in the future.
TC2 Alternative or emerging technologies like SODAR or LIDAR (BPA has traditionally used anemometers for weather monitoring to support wind power ·forecasting); studies in the Midwest showed benefit
TC5 A forecast error metric (in addition to Bins and Peak Errors) that is optimized toward BPA-sensitive events (e.g. oversupply, price spikes in California).This can be standard metrics (e.g., range) but optimized by event OR time of year. The thought is that these events disproportionately cost BPA (and IPPS) in terms of balancing reserves, energy marketing, and opportunity costs.
TC6 Evaluation of ramp-ups and ramp-downs for each forecast.
TC7 Front performance Metric-to-be-optimized and critical look ahead time frame should be identified in order to define sensor deployment requirements. Once there are identified, an observation targeting can be done to determine optimal sensor deployment to address these criteria.
TC8 Incorporate turbine layouts, make efforts and operational status within wind power plants to have more accurate forecast of actual MW output from wind plants, in addition to pursuing more accuracy of wind speed forecast.
CG1 Insufficient number of wind monitoring equipment (like anemometers) in the right locations.
CG2 The majority of wind generators in the BPA Balancing Area are located close together, which results in high levels of balancing reserves
CG3 Monitoring equipment needs to be appropriate for the complex terrain of the Pacific Northwest
CG6 Additional BPA specific forecast metrics that can be tracked over longer period.
D1 Balancing Reserves for Variable Resource Integration: Additional variable resources being built in the BPA Balancing Authority will increase the demand for flexible resources to provide balancing reserves. More accurate generation forecasts for variable resources and geographical diversity will reduce the demand for balancing reserves.
VI. Variable Resource Forecasting (2/2)
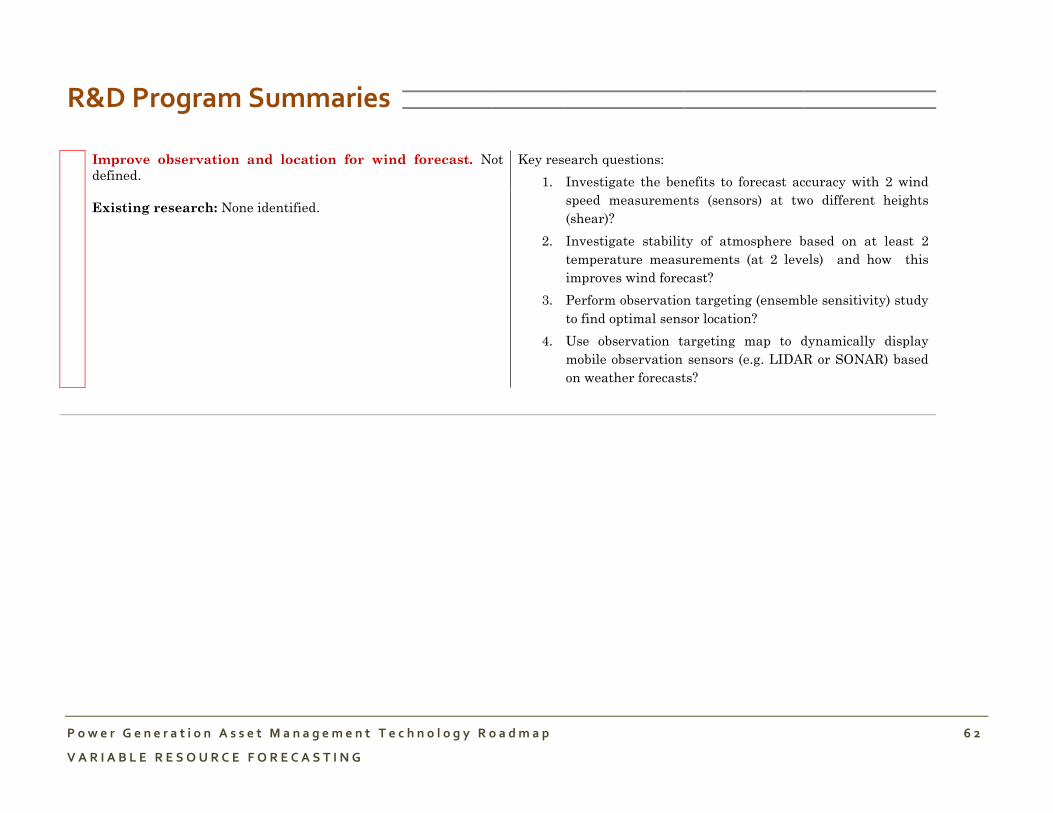
P o w e r G e n e r a t i o n A s s e t M a n a g e m e n t T e c h n o l o g y R o a d m a p 6 2
V A R I A B L E R E S O U R C E F O R E C A S T I N G
R&D Program Summaries
Improve observation and location for wind forecast. Not
defined.
Key research questions:
1. Investigate the benefits to forecast accuracy with 2 wind
speed measurements (sensors) at two different heights
(shear)?
2. Investigate stability of atmosphere based on at least 2
temperature measurements (at 2 levels) and how this
improves wind forecast?
3. Perform observation targeting (ensemble sensitivity) study
to find optimal sensor location?
4. Use observation targeting map to dynamically display
mobile observation sensors (e.g. LIDAR or SONAR) based
on weather forecasts?
Existing research: None identified.

P o w e r G e n e r a t i o n A s s e t M a n a g e m e n t T e c h n o l o g y R o a d m a p 6 3
A Q U A T I C N U I S A N C E S P E C I E S ( A N S ) P R E V E N T I O N A N D I M P A C T M I T I G A T I O N
A Q U A T I C N U I S A N C E S P E C I E S ( A N S )
P R E V E N T I O N A N D I M P A C T M I T I G A T I O N
Roadmap Area Definition
Aquatic Invasive Species (AIS), and particularly dreissenid mussels,
have been receiving increased attention from decision makers and
natural resource agencies in recent years because of their technical,
economic, environmental, and social threats. The hydroelectric dams
that comprise the FCRPS are vulnerable to operational and
maintenance (O&M) impacts resulting from aquatic nuisance species.
Research will seek for technological solutions to the areas of
prevention, management, mitigation/control, and monitoring of the
species.
The insights and observations of the subject matter experts who
contributed to the roadmap summarized, and reviewed by:
Hannah Dondy-Kaplan (Bonneville Power Administration)

P o w e r G e n e r a t i o n A s s e t M a n a g e m e n t T e c h n o l o g y R o a d m a p 6 4
A Q U A T I C N U I S A N C E S P E C I E S ( A N S ) P R E V E N T I O N A N D I M P A C T M I T I G A T I O N
Roadmap Area :
R&D Program Requirement
Existing R&D Program or Project
Commercially Unavailable Technology
Commercially Available Technology
Capability Gap
Driver
Power Generation Asset
Management
Technology Roadmap
Dri
vers
Cap
ab
ilit
y G
ap
sT
ech
no
log
y
Ch
ara
cte
risti
cs
R&
D
Pro
gra
ms
D1 Reliability: The hydroelectric dams that comprise the FCRPS are vulnerable to operational and maintenance (O&M) impacts resulting from aquatic nuisance species.These O&M vulnerabilities could lead tosignificant economic impact. Species such as zebra and quaggamussels are of particular concern. Quagga mussels were first introduced into the western United States in Lake Mead and discovered in 2007.
CG1 Understanding of likelihood of infestation in the Pacific Northwest.
RD1 “Enhanced monitoring and investigation of the
spread and potential impact of aquatic invasive
mussels in the Columbia River Basin,” (Technology
Innovation project number 276)
WSU and USGS
D2 An effective Dreissena sp. treatment and control program in the CRB includes proven technologies, operational flexibility, rapid implementation, and cost effective and dependable strategies.
D3 It is difficult to estimate the population density and growth rates of reproducing dreissenids in the CRB, yet mussel density and growth rate dictate the cost of mitigation
D4 There are examples of hydropower management agencies purchasing mitigation equipment that was never used.
CG2 Methods and tools to prevent aquatic nuisance species and minimize O&M cost impacts.
CG3 Lack of understanding of spread and impact of invasive mussels
TC6 Need research on the expected time required for newborn mussels to travel from the upper extremities of the Columbia River to particular destinations in the basin.
TC1 Need to bolster knowledge of risk of establishment by improving understanding of the ability of primary and secondary tributaries to the mainstem Columbia to support quagga and zebra mussels.
TC5 Need to investigate the possibility of reservoir management strategies that could be used for the control of established dreissenidpopulations.
TC2 Need to investigate potential for long-term reproductive success, specifically the potential for successful dreissenid spawning and juvenile survival in the CRB
TC3 Need to collect additional calcium and pH data in various parts of the Columbia watershed to better predict dreissenid mussel life history stages.
TC4 Need research on the expected time required for veligers to travel from the upper extremities of the Columbia River to particular destinations in the basin.TC7 Need better information on
larval development rates under the temperature and calcium conditions in the Columbia River.
RD2 Bonneville Technology Innovation Program
study, “Quagga Mussel Growth and Survival”
(project number 232)
BPA
VII. Aquatic Nuisance Species (ANS) Prevention and Impact Mitigation (1/3)

P o w e r G e n e r a t i o n A s s e t M a n a g e m e n t T e c h n o l o g y R o a d m a p 6 5
A Q U A T I C N U I S A N C E S P E C I E S ( A N S ) P R E V E N T I O N A N D I M P A C T M I T I G A T I O N
R&D Program Summaries
Enhanced monitoring and investigation of the spread and
potential impact of aquatic invasive mussels in the
Columbia River Basin.
Key research questions:
1. Not identified
Existing research: BPA TIP 276
Quagga Mussel Growth and Survival. Key research questions:
1. Not identified
Existing research: BPA TIP 232

P o w e r G e n e r a t i o n A s s e t M a n a g e m e n t T e c h n o l o g y R o a d m a p 6 6
A Q U A T I C N U I S A N C E S P E C I E S ( A N S ) P R E V E N T I O N A N D I M P A C T M I T I G A T I O N
Roadmap Area :
R&D Program Requirement
Existing R&D Program or Project
Commercially Unavailable Technology
Commercially Available Technology
Capability Gap
Driver
Power Generation Asset
Management
Technology Roadmap
Dri
vers
Cap
ab
ilit
y G
ap
sT
ech
no
log
y
Ch
ara
cte
risti
cs
R&
D
Pro
gra
ms
D5 Prevention - WatercraftDecontamination
CG4 Need to develop and scientifically test for efficacy new technologies for watercraft decontamination that are effective in killing and removing dreissenidmussels.
TC8 Drying time acceleration “Dip” tanks, dry ice blastingSemi-automated wash systems, andchemical treatments
RD3 Ballast water filtration system
developed by the watercraft industry
for recreational watercraft
University of Nevada Reno (final stages
of completing its testing)
D6 Alternative decontamination technology has not been rigorously field tested to date, and therefore hot pressure wash is still the most widely used decontamination technology
D7 Removing all mussels , especially from heavily fouled large watercraft has proven challenging - Decontamination of watercraft by resource agencies is accomplished through hot water pressurized wash.
D8 Removing dead mussels is important because a false positive finding may result from the presence of mussel shells or DNA in samples collected for genetic analysis (polymerase chain reaction{PCR}). This can result in unnecessary concern and expensive action if unexplained shells drop or are scrapped-off the hull and are subsequently discovered at a boat ramp or the lake bottom
D9 Prevention – Watercraft Inspection
D10 The CRB is a boater destination and therefore receives watercraft traffic from throughout the United States and parts of Canada.
D11 Because of budget constraints, however, watercraft inspection and decontamination (WID) stations are only open seasonally and usually closed during nighttime hours. As a result, state aquatic invasive species managers are concerned that contaminated boats are passing through these defenses.
D12 Monitoring
D13 Need to detect the earliest stages of dreissenid mussel exposure or infestation so that response planning and budgeting for protective measures can be initiated.
D14 The sheer volume of water and number of hydropower and dam facilities
CG5 Need to decontaminate ballast tanks
CG6 Need to work with watercraft/recreational industry partners in the development of watercraft designs that reduce the threat of spreading AIS.
CG7 Continue to develop western region electronic database for interjurisdictional information sharing on watercraft at inspection stations
CG8 Need additional watercraft inspection time and geographic coverage to form a perimeter defense to help prevent an introduction in cooperation with other western state AIS programs
CG9 Need to detect the earliest stages of dreissenid mussel exposure or infestation so that response planning and budgeting for protective measures can be initiated.
CG11 Need to research and apply in the CRB or develop new technologies for early detection.
CG10 Need to prioritize the highest risk water bodies in the CRB
CG12 Need to identify and sample in areas at high risk for mussel introduction and establishment, and at locations where monitoring is not currently occurring or where additional efforts would increase detectability.
TC9 Ballast water filtrationTC10 Program - Electronic Data Collection System
TC11 Geographic Information System (GIS) layer describing all of the river access points on the mainstream Columbia and Snake Rivers and major tributaries, and information to enhance current understanding of relative use of these river access points.
TC13 FlowCAM - flow-through device with a digital camera, microscope lenses and (in the case of this particular model) polarizing camera.
TC14 PCR - Molecular assays based on PCR can amplify DNA in water samples (i.e., environmental DNA or eDNA) and detect the presence of AIS at high levels of sensitivity and
RD4 “Semi-Green” watercraft.
Aquatic Nuisance Species Task Force
Meeting
RD9 “Enhanced monitoring and
investigation of the spread and
potential impact of aquatic
invasive mussels in the Columbia
River Basin.”
WSU/USGS project #276
RD5 Determination of the
appropriate level of sampling
to obtain optimal coverage (i.e.
probability of detection).
RD6 Increase monitoring
capacity (sampling and
analysis) in the CRB.
RD7 Determination of volume
of water that is currently being
sampled (veligers) for
dreissenids by all agencies in
the CRB
RD8 Consider the
practicality of establishing a
CRB-based PCR (eDNA)
laboratory
RD10 100th Meridian Initiative -
Coordination of monitoring
CRB Team.
RD11 Data collection PSMFC and the
USGS
PSMFC and the USGS (Cook,
Washington)
RD12 Technology
Innovation project number
276 . USGS/WSU
Technology Innovation
project number 276
USGS/WSU
RD13 Evaluating and
prioritizing dreissenid
monitoring activities to ensure
highest risk water bodies
VII. Aquatic Nuisance Species (ANS) Prevention and Impact Mitigation (2/3)
TC12 Laser transmission spectroscopy (LTS) is a quantitative and rapid in vitro technique for measuring the size, shape, and number of nanoparticles in suspension.
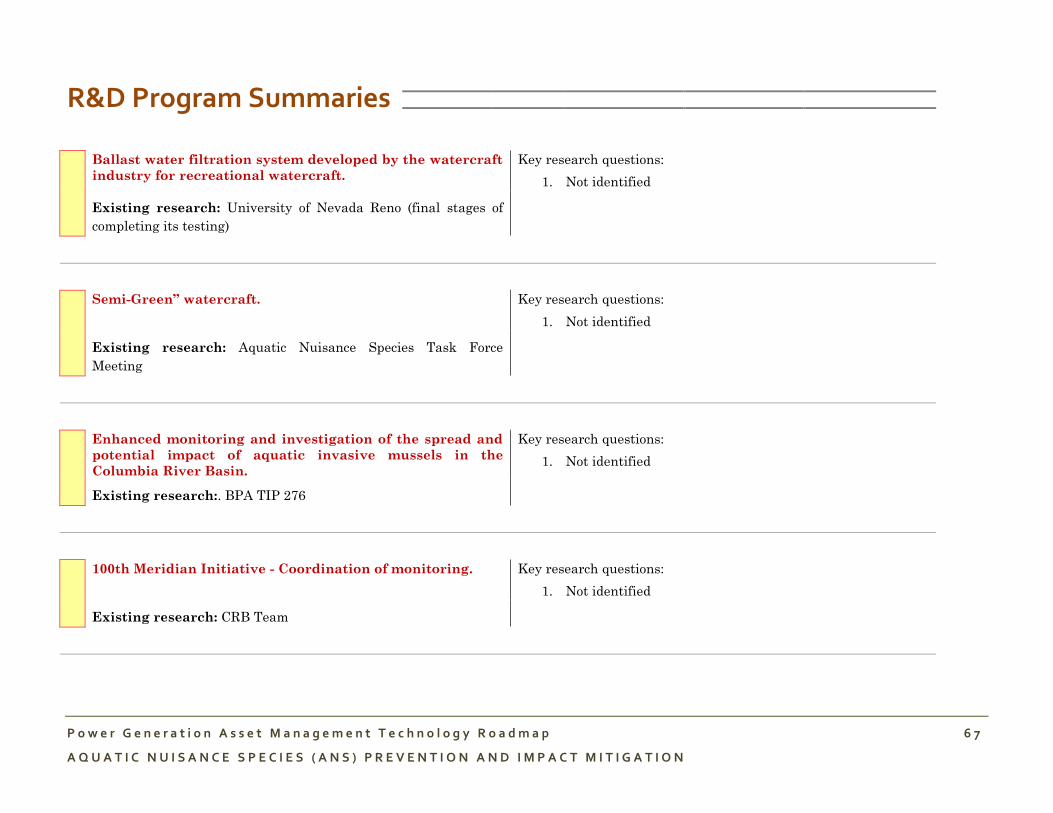
P o w e r G e n e r a t i o n A s s e t M a n a g e m e n t T e c h n o l o g y R o a d m a p 6 7
A Q U A T I C N U I S A N C E S P E C I E S ( A N S ) P R E V E N T I O N A N D I M P A C T M I T I G A T I O N
R&D Program Summaries
Ballast water filtration system developed by the watercraft
industry for recreational watercraft.
Key research questions:
1. Not identified
Existing research: University of Nevada Reno (final stages of
completing its testing)
Semi-Green” watercraft. Key research questions:
1. Not identified
Existing research: Aquatic Nuisance Species Task Force
Meeting
Enhanced monitoring and investigation of the spread and
potential impact of aquatic invasive mussels in the
Columbia River Basin.
Key research questions:
1. Not identified
Existing research:. BPA TIP 276
100th Meridian Initiative - Coordination of monitoring. Key research questions:
1. Not identified
Existing research: CRB Team

P o w e r G e n e r a t i o n A s s e t M a n a g e m e n t T e c h n o l o g y R o a d m a p 6 8
A Q U A T I C N U I S A N C E S P E C I E S ( A N S ) P R E V E N T I O N A N D I M P A C T M I T I G A T I O N
Data collection PSMFC and the USGS. Key research questions:
1. Not identified
Existing research: PSMFC and the USGS (Cook, Washington)
Technology Innovation project number 276 . USGS/WSU
Technology.
Key research questions:
1. Not identified
Existing research: BPA TIP 276
Determination of the appropriate level of sampling to
obtain optimal coverage (i.e. probability of detection).
Key research questions:
1. Not identified
Existing research: None identified.
Determination of volume of water that is currently being
sampled (veligers) for dreissenids by all agencies in the
CRB.
Key research questions:
1. Not identified
Existing research: None identified.
Increase monitoring capacity (sampling and analysis) in
the CRB.
Key research questions:
1. Not identified
Existing research: None identified.

P o w e r G e n e r a t i o n A s s e t M a n a g e m e n t T e c h n o l o g y R o a d m a p 6 9
A Q U A T I C N U I S A N C E S P E C I E S ( A N S ) P R E V E N T I O N A N D I M P A C T M I T I G A T I O N
Consider the practicality of establishing a CRB-based PCR
(eDNA) laboratory.
Key research questions:
1. Not identified
Existing research: None identified.
Evaluating and prioritizing dreissenid monitoring
activities to ensure highest risk water bodies.
Key research questions:
1. Not identified
Existing research: None identified.

P o w e r G e n e r a t i o n A s s e t M a n a g e m e n t T e c h n o l o g y R o a d m a p 7 0
A Q U A T I C N U I S A N C E S P E C I E S ( A N S ) P R E V E N T I O N A N D I M P A C T M I T I G A T I O N
Roadmap Area :
R&D Program Requirement
Existing R&D Program or Project
Commercially Unavailable Technology
Commercially Available Technology
Capability Gap
Driver
Power Generation Asset
Management
Technology Roadmap
Dri
vers
Cap
ab
ilit
y G
ap
sT
ech
no
log
y
Ch
ara
cte
risti
cs
R&
D
Pro
gra
ms
D15 Management -IDreissenid MusselEradication
CG13 Need state and federal water resource managers to develop their own planning mechanisms because each jurisdiction differs in its regulatory requirements for mussel eradication
TC15 Vulnerability Assessment (VA) Team: survey to determine the status of VA’s in the CRB -document prioritizing high-risk facilities PSMFC (with support from BPA)
D16 Importance of environmental compliance issues - the eradication of a mussel population will almost certainly employ a
D17 If mussels are found in the mainstream of the Columbia River, it is unlikely eradication will be possible, however, if they are found at a boat ramp or embayment on the Columbia River, where a section of the water can be isolated and treated, eradication may be feasible
D18 The use of biocides or other mitigation techniques may require permits under the Clean Water Act (CWA), ESA, FIFRA, and NEPA (state and federal).
D19 Management - Rapid Response Preparedness
D20 Dreissenid mussels typically establish firmly in a watershed prior to detection, detected population has not dispersed widely or reproduced (i.e., eradication is still reasonable to consider) (CRB)
D21 CRB Plan are intended to enhance interagency coordination beginning with the discovery of an infestation through containment and initial control efforts
D22 Vulnerability Assessment and Mitigation - Vulnerability Assessments
D23 Dreissenid mussels are aggressive bio-foulers. When present in raw cooling water, they can seriously jeopardize industrial facilities using this water unless defensive steps are
D24 A facility assessment process usually requires considerable time for planning and coordination, background research, site visits, evaluation of data and preparation of a report.
D25 The specific risks and problems that a particular facility will have with a dreissenid introduction will depend on how the raw water enters the facility; any processes to treat or transform the water for various facility applications; the routing of all piping branches and location of components and equipment, including materials of construction; and the operating envelope of the various water systems (e.g., maximum and minimum flow rates, frequency of operation, temperature ranges).
D26 Vulnerability Assessment and Mitigation - Mitigation
D27 There are a number of commercial treatment products that have not been listed, but may be applicable in various situations
D28 The CRB poses some unique challenges for the use of biocides in mitigation because of Endangered Species Act considerations (e.g., salmon and steelhead) and the necessary environmental assessments that would need to be undertaken before a proved.
CG14 Continue regional work to coordinate a rapid, effective, and efficient interagency response to delineate, contain, and when feasible, eradicate zebra, quagga, and other dreissenid mussel populations if they are introduced in CRB waters
CG15 Facility managers need to be prepared to address the consequences of an infestation.
CG18 Continue to develop vulnerability assessments at the water project level
CG16 Need means and technologies for ong-term monitoring and control of an infestation
CG17 Need a separate management plan developed and implemented by the individuals or organizations with authority and responsibility for managing the infested site(s) -
CG19 Continue to develop vulnerability assessments at the water project level
CG20 Need management strategies and cost options for long-term mitigation of an infestation (i.e., identifying actions or technologies best suited for maintaining water operations and reducing operations and maintenance costs or other expenses).
CG22 Need Environmental Permitting including—ESA,NEPA and local permits
CG21 Need Mitigation Strategy Options: (both physical and chemical) that include cost estimates for hydropower facilities and fishes species impacts.
TC16 Ultraviolet light
TC19 Sodium Hypochlorite
TC22 Estimating costs of using foul-release type coatings to mitigate Dreissena sp. mussel macrofouling at a FCRPS facility (Wells and Sytsma 2013).
TC17 Zequanox® (biopesticide)
TC23 Potential Economic Impacts of Zebra Mussels on the Hydropower Facilities in the Columbia River Basin (Phillips et al. 2005)
TC20 Micro-filtration.
RD14 Vulnerability Assessments at
Hydropower Projects In The
Columbia River Basin.
RD15 Examination of bundling
opportunities based on
characteristics of hydropower
facilities and proximity to one
another.
RD16 Develop inventory of highest
priority mitigation technologies
suitable for FCRPS hydropower and
fish facilities.
RD18 Solicit a Request for
Proposals to create mitigation
management plans for FCRPS
hydropower and fish facilities
(including cost estimates)
RD17 Build on the work currently
undertaken by the RRWG.
RD19 Coordinate efforts within
the CRB to continue research
into foul-release coatings, and
sharing the results of the
research with regional entities
VII. Aquatic Nuisance Species (ANS) Prevention and Impact Mitigation (3/3)
TC18 Pulse-power technology has the potential to proactively control aquatic nuisance species within water intakes and piping systems
TC21 Plasma Sparker: The device produces a plasma pulse, which is a physical, nonchemical, nonthermalprocess that introduces energy

P o w e r G e n e r a t i o n A s s e t M a n a g e m e n t T e c h n o l o g y R o a d m a p 7 1
A Q U A T I C N U I S A N C E S P E C I E S ( A N S ) P R E V E N T I O N A N D I M P A C T M I T I G A T I O N
R&D Program Summaries
Vulnerability Assessments at Hydropower Projects In The
Columbia River Basin.
Key research questions:
1. Not identified
Existing research: None identified.
Examination of bundling opportunities based on
characteristics of hydropower facilities and proximity to
one another.
Key research questions:
1. Not identified
Existing research: None identified.
Develop inventory of highest priority mitigation
technologies suitable for FCRPS hydropower and fish
facilities.
Key research questions:
1. Not identified
Existing research: None identified.
Solicit a Request for Proposals to create mitigation
management plans for FCRPS hydropower and fish
facilities (including cost estimates).
Key research questions:
1. Not identified
Existing research: None identified.

P o w e r G e n e r a t i o n A s s e t M a n a g e m e n t T e c h n o l o g y R o a d m a p 7 2
A Q U A T I C N U I S A N C E S P E C I E S ( A N S ) P R E V E N T I O N A N D I M P A C T M I T I G A T I O N
Build on the work currently undertaken by the RRWG. Key research questions:
1. Not identified
Existing research: None identified.
Coordinate efforts within the CRB to continue research
into foul-release coatings, and sharing the results of the
research with regional entities.
Key research questions:
1. Not identified
Existing research: None identified.

P o w e r G e n e r a t i o n A s s e t M a n a g e m e n t T e c h n o l o g y R o a d m a p , N o v e m b e r 2 0 1 4 7 3
P R O J E C T T E A M BPA Generation and Asset Management Executive Sponsor
Kieran Connolly, Vice President, Generation and Asset Management
BPA Project Sponsor Team
Terry Oliver, Chief Technology Innovation Officer
Steve Kerns, Supervisory Public Utility Specialist, Generation and Asset Management
Project Implementation Team
Project Manager & Workshop Facilitation
Jisun Kim, AeroTek
Strategy Consultant
Tugrul Daim, Portland State University Engineering and Technology Management Department
Facilitation, Logistics, Transcription & Other Support
Bonneville Power Administration: Judith Estep, Jim Bowen, James Hillegas-Elting
Portland State University Engineering and Technology Management Department: Edwin Garces, Fahad Aldhaban, Montaj Khanam, Chih-Jen Yu,
Yonghee (Joseph) Cho, and Joao Ricardo Lavoie
Document Production
Editor and Lead Author: Jisun Kim
Contributors: Steve Kerns, Judith Estep, James Hillegas-Elting, Jim Bowen, and Justin Reel
P o w e r G e n e r a t i o n A s s e t M a n a g e m e n t T e c h n o l o g y R o a d m a p , N o v e m b e r 2 0 1 4 7 4
B P A S U B J E C T M A T T E R R E P R E S E N T A T I V E S A N D
R O A D M A P O W N E R S
Flexibility Assessment and Value
Steve Kerns, Supervisory Public Utility Specialist
Joint Transmission and Hydropower Modeling
Steve Barton, Operations Research Analyst
State Awareness
Pamela Van Calcar, Duty Scheduling Manager
Hydropower Reliability and Life Extension
George Brown, Mechanical Engineer
Load and Obligations Forecasting
Reed Davis, Supervisory Public Utilities Specialist
Variable Resource Forecasting
Scott Winner, Public Utilities Specialist
Aquatic Nuisance Species (ANS) Prevention and Impact Mitigation
Hannah Dondy-Kaplan, Fish and Wildlife Project Manager, on behalf of Mark Jones (Federal Hydro Projects Manager)

P o w e r G e n e r a t i o n A s s e t M a n a g e m e n t T e c h n o l o g y R o a d m a p , N o v e m b e r 2 0 1 4 7 5
C O N T R I B U T O R S Workshop Hosts and Participants, November 17 2014
Flexibility Assessment and Value
1. Steve Kerns (HOST), Bonneville Power Administration
2. David Dernovsek, Bonneville Power Administration
3. Steve Bellcoff, Bonneville Power Administration
4. Eric Federovitch, Bonneville Power Administration
5. Nathan Gibson, Oregon State University
6. Ryan Jones, Energy and Environmental Economics, Inc. (E3)
7. Rick Jones, HDR Engineering Inc.
8. Daniel S. Kirschen, University of Washington
9. Ben Kujala, Northwest Power & Conservation Council
10. Yuri Makarov, Pacific Northwest National Laboratory
11. Debbie Mursch, Alstom
12. John Ollis, Northwest Power & Conservation Council
13. Arne Olson, Energy and Environmental Economics, Inc. (E3)
Joint Transmission and Hydropower Modeling
14. Steve Barton (HOST), Bonneville Power Administration
15. Christopher Allen, Bonneville Power Administration
16. Branko Kosovic, National Center for Atmospheric Research
17. Shuai Lu, Pacific Northwest National Laboratory
18. Feng Qiu, Argonne National Laboratory
19. Ronald Schellberg, Idaho Power
20. Jin Wang, Ohio State University
State Awareness
21. Francis Halpin (HOST), Bonneville Power Administration
22. Shawn Martin (HOST), Bonneville Power Administration
23. JJ Jamieson, Versify solutions, Inc.
24. Jeff Leahey, National Hydro Power Association
25. Rita Patterson, Primate Technologies, Inc.
26. Bill Snavely, Primate Technologies, Inc.
Hydropower Reliability and Life Extension
27. Jack Kolze (HOST), Bonneville Power Administration
28. Charlie Allen, U.S. Army Corps of Engineers
29. Scott Cotner, U.S. Army Corps of Engineers
30. Erin K. Foraker, Bureau of Reclamation
31. Christopher Lang, Voith
32. Stephen Meicke, HDR Engineering, Inc.
33. Rick Miller, HDR Engineering, Inc.
34. Michael Pulskamp, Bureau of Reclamation
35. Michel Sabourin, Alstom
36. Wayne Todd, U.S. Army Corps of Engineers
37. Michelle Vargo, Seattle City Light
Load and Obligations Forecasting
38. Cheryl Woodall (HOST), Bonneville Power Administration
39. Diane Lozovoy, Bonneville Power Administration
40. Karen Miu, Drexel University
41. Ramteen Sioshansi, Ohio State University
Variable Resource Forecasting
42. Scott Winner (HOST), Bonneville Power Administration
43. Wenzhong David Gao, University of Denver
44. Christopher Hayes, DNV GL
45. Jeff Lerner, Vaisala, Inc.
46. Alva Svoboda, Pacific Gas and Electric Company
47. John Zack, AWS TruePower
48. Zhi Zhou, Argonne National Laboratory

P o w e r G e n e r a t i o n A s s e t M a n a g e m e n t T e c h n o l o g y R o a d m a p , N o v e m b e r 2 0 1 4 7 6