power procurement strategy--mr. rohit bajaj
TRANSCRIPT

Power Procurement Strategy
01.03.16 IIT-Kanpur
For Public Use
POWER SECTOR OVERVIEW

Source: Executive Summary of October 2015, CEA *including renewable generation
Category Installed Capacity
(MW)
Share in Total(%)
Generation (BUs)
Share in Total(%)
Coal 170,138 61% 836 80%
Gas 24,473 9% 41 4%
Diesel 994 0.4% 1.4 0%
Hydro 42,473 15% 129 12%
Nuclear 5,780 2% 36 3%
RE 36,471 13% - -
Total 280,328 1042
Installed Capacity (All)
Coal, 61% Hydro, 15%
RE, 13%
Gas 9%
Nu
clear, 2
%
Diesel, 0
.4%

Source: Executive Summary of October 2015, CEA *including renewable generation
Category Installed
Capacity (MW) Share in total
RE (%)
Wind Power 23,763 65%
Small Hydro 4,102 11%
Bio Power 4,546 12%
Solar 4,061 11%
Total 36,471
Installed Capacity (Renewable)
Wind Power,
65% Bio Power,
13%
Small Hydro, 11%
Solar, 11%

16.73 19.25 27.28
67.55
88.5 100
0
20
40
60
80
100
120
8th Plan 9th Plan 10th Plan 11th Plan 12th Plan (2012-17)
13th Plan (2017-22)
Gig
a W
att
Generation Capacity Addition (GW)
69.21 Actual
till Oct’15
• Investments of around US$ 225 billion planned for the power sector during the 12th Plan. • In addition, Renewable energy capacity of 175 GW is planned till 2022.
Source: CEA
Growing impetus on capacity addition
Ambitious targets to capacity addition

Power Situation in the Country
Year
Installed Capacity (at the end of FY)
(MW)
Peak Met ( MW )
2009-10 1,59,398 1,04,009
2010-11 1,73,626 1,10,256
2011-12 1,99,877 1,16,191
2012-13 2,23,344 1,23,294
2013-14 2,43,029 1,29,815
2014-15 2,67,367 1,41,160
2015-16* 2,843,03 1,48,463
• In last six years, capacity has increased by 1,24,905 MW and demand has increased by 44,454 MW only.
• The country as a whole has witnessed a decline in the deficits.
Source: Executive Summary, Power Sector, CEA, *Upto Dec, 2015

Financial health of Generators
• Total installed capacity in the Country is 2,80,328 MW
• Peak demand met : 1,48,005 MW
• PLF of coal/lignite plants
– Around 65% in FY 14-15
– Around 62% in FY 15-16 (till Oct)
– FY 07-08 - 78%
• PLF of gas based plants: 25% due to shortage of fuel
• Stranded capacity in the country: A total 50,000 MW stressed
– 27,880 MW of coal capacity stranded
– 24,000 MW of Gas based Capacity stranded
• Key Issues: Lack of fuel, Transmission, Competition, Weak distribution system, Discoms’ inability to buy
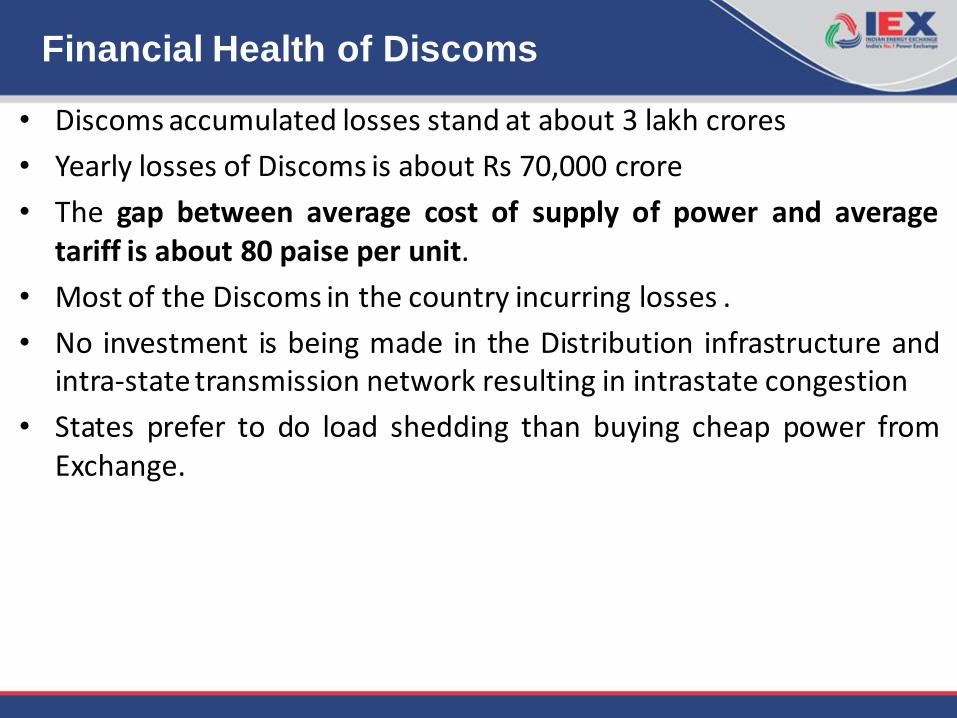
Financial Health of Discoms
• Discoms accumulated losses stand at about 3 lakh crores
• Yearly losses of Discoms is about Rs 70,000 crore
• The gap between average cost of supply of power and average tariff is about 80 paise per unit.
• Most of the Discoms in the country incurring losses .
• No investment is being made in the Distribution infrastructure and intra-state transmission network resulting in intrastate congestion
• States prefer to do load shedding than buying cheap power from Exchange.

State wise status Population (in Cr)
Avg. MW Supply FY 14-15
Per Capita Consum kWh (2011-12)
Punjab 2.8 5,623 1,799
Gujarat 6.0 9,344 1,663
Haryana 2.5 5,978 1,628
Delhi 1.7 3,991 1,587
Chhattisgarh 2.6 3,810 1,320
Himachal Pradesh 0.7 1,287 1,289
Tamil Nadu 7.2 10,517 1,277
Uttarakhand 1.0 1,529 1,232
Maharashtra 11.2 11,507 1,204
Andhra Pradesh 8.5 10,034 1,157
Odisha 4.2 3,099 1,146
Karnataka 6.1 6,803 1,081
Jammu & Kashmir 1.3 1,296 1,015
Rajasthan 6.9 6,529 927
Jharkhand 3.3 844 790
Madhya Pradesh 7.3 7,171 672
Kerala 3.3 1,935 594
West Bengal 9.1 5,319 564
Uttar Pradesh 20.0 9,916 450
Assam 3.1 679 250
Bihar 10.4 1,538 134

Long Term
Short-Term
PPA for over 25 years through long term
Source: Percentage as per CERC Report on Short Term Power Market FY-14
93.86%
6.1%
90.5%
Through traders 3.2% 3.4%
Direct Bilateral 0.5% 1.5%
9.5%
Exchanges 0.4% 2.73%
Unscheduled Interchange 2.1% 1.9%
FY 2009 FY 2015
• Short term market grew at an encouraging rate with a CAGR of 22% (FY-09 to FY 15). • Power Exchanges witnessed growth at a CAGR of 62% (FY-09 to FY 15).
Indian Power Market Snapshot

Coal production and supply
in the Country
Total Coal
Production (MT) YoY inc (%) Import (MT) YoY inc (%)
Import Cost (Crores INR)
2009-10 532 73 39,180
2010-11 533 0.12% 69 -5.92% 41,550
2011-12 540 1.36% 103 49.24% 78,838
2012-13 556 3.05% 146 41.74% 86,846
2013-14 566 1.68% 167 14.45% 92,329
2014-15 612 8.25% 212 27.12% 1,04,524
11
• In FY 15, the domestic coal production increased by 8.5% to 612 MT.
• The GoI has set a target of increasing domestic coal production to 1.5 billion tonnes (including one bt from CIL) by FY 2021
• This could create a surplus situation and reduce import of coal which in FY 15 was worth Rs.1045 Billion.
Source: Coal Statistics, Ministry of Coal

Impact of coal availability on
Power Markets
• Increased availability of coal for the power sector has had a positive impact.
• Generation has increased by 6% and many stranded plants have started operating
• Sale of power on IEX has increased
12 Source: Demand and Supply of Coal from Coal Statistics 2014-15, Ministry of Coal
3.61 3.28
3.89 3.76
4.49 4.18 4.17
2.68 2.62 2.56 2.74 2.82
3.68
3.03
0.00
1.00
2.00
3.00
4.00
5.00
0
1000
2000
3000
4000
5000
6000
7000
Apr May Jun Jul Aug Sep Oct
Pri
ce (R
s./k
Wh
)
Ave
rage
Dai
ly M
W
Average Daily Sale Bids (MW) and Market Clearing Price
2014-15 2015-16 2014-15 2015-16

Price and Volume: Bilateral vs. IEX DAM
2.62 6.17 11.80 13.79 22.35 28.92 28.12 16.27
21.92
26.72 27.70
35.84 36.64 35.11 35.50
20.37
7.16
5.33
3.58 3.47 3.73
2.87
3.46
2.80
7.46
5.32
4.74
4.23 4.34 4.24 4.30
4.06
-1
1
2
3
4
5
6
7
8
-
5
10
15
20
25
30
35
40
FY08-09 FY09-10 FY10-11 FY11-12 FY12-13 FY13-14 FY14-15 FY15-16
Pri
ce (
Rs.
/kW
h)
Vo
lum
e (
BU
)
IEX Volume Trader Volume IEX Price Bilateral Price
Prices at the Exchange have always been lower than Bilateral Prices
*Data up to Sep 2015, Source: CERC MMC Reports

Opportunities for DISCOMS

Option with the Discoms: Utilising Exchange Market
• PPA for base load only
i. Discoms should tie-up PPA only to manage their base
demand
ii. Many Discoms have tied PPAs to meet their peak
demand as well. The Discoms have to pay the capacity
charge for this quantum even in the off peak time
example Gujarat, Haryana, Delhi, Punjab
iii. So for optimum utilisation, Long Term PPA should be
only for base demand and seasonal variations should
be bought through other available market options

1 2 3 4 5 6 7 8 9 10 11 12 13 14 15 16 17 18 19 20 21 22 23 24
36
34
32
30
28
26
24
22
PPA (Base load) contract
Short Term Market (for Peak Load)
Day Ahead
Sell
Buy Buy
Sell
Forecasted
demand
Ancillary
Service
Intra Day
Market
Real-time
demand
Surpluses/Deficits - Balance physical supply and demand
Meeting Shortages/Surplus through STM Maximizing efficiency – Ideal Scenario
Forecasted Demand Curve of the Discom
Actual Demand Real time variations

Cost Optimization through Exchange

Replacement of high variable cost power by Exchange power
• Replacement of high variable cost power by Exchange power
I. Under long term PPA two component
• Capacity charges (commitment charges): paid irrespective of whether discom purchase power from these plants or not
• Energy charges : Paid corresponding to the number of units of power purchased from that particular plant
II. Discoms can replace costlier long term power by procurement from IEX, if,
• Energy charge of power plant is greater than IEX rates
• During night hours prices at IEX are further low and savings can be enhanced
III. Discoms can continue paying fixed charge to Long Term PPAs and substitute where energy charge is higher than IEX price
IV. IEX prices are around 25%-30% lower than the Bilateral Prices

Cost Optimisation by Discoms
• Discoms can devise least cost option to meet demand in the state by tracking prices
at IEX
– Energy charge greater than prevailing ACP can be substituted with power from IEX
– During off-peak hours, when prices at IEX are low, savings can be enhanced replacing power from LT to PX Transactions
Type Dispatch Mode Capacity
(MW)
Energy Charge
(INR/kWh)
Plant A Hydro Must Run 100 0.00
Plant B Hydro Must Run 150 0.00
Plant C Nuclear Must Run 500 2.80
Plant D Coal Merit 120 3.00
Plant E Coal Merit 120 3.20
Plant F Coal Merit 100 3.50
Plant G Coal Merit 90 3.80
Plant H Coal Merit 90 4.00
Merit Based Capacity (MW) 520
Substituted with power @ INR
2.50 during off peak hours
from IEX
Substituted with power @ INR
3.45 from IEX
ACP= INR 3.45/kWh
Merit Order for Dispatch in State
Off-peak ACP= INR 2.50/kWh
*Assumptions: 12 number of hours are considered in off-peak hours
Potential Savings: INR 50 Crore a month

Discoms exhaust long term and medium term contracts first despite availability of power at cheaper prices at PXs
Long Term
Medium Term
Short Term
Purchase on economic principle of Merit Order
Optimization of Power Procurement Cost
PPA 1 I 3.70
PPA 2 I 4.06
Long Term Contracts
Bilateral Contracts
Exchange
Capacity Tied up by Discom
IEX Price I 2.45
Merit Order Baseline
PPA 3 I 3.00
PPA 4 I 1.99
PPA 5 I 2.00
PPA I Variable Cost
Must Run Plants (includes all hydro, nuclear or
other ‘take or pay’ type contractual plants)
Contract 1 I 4.70
Contract 2 I 3.50
Contract 3 I 2.10
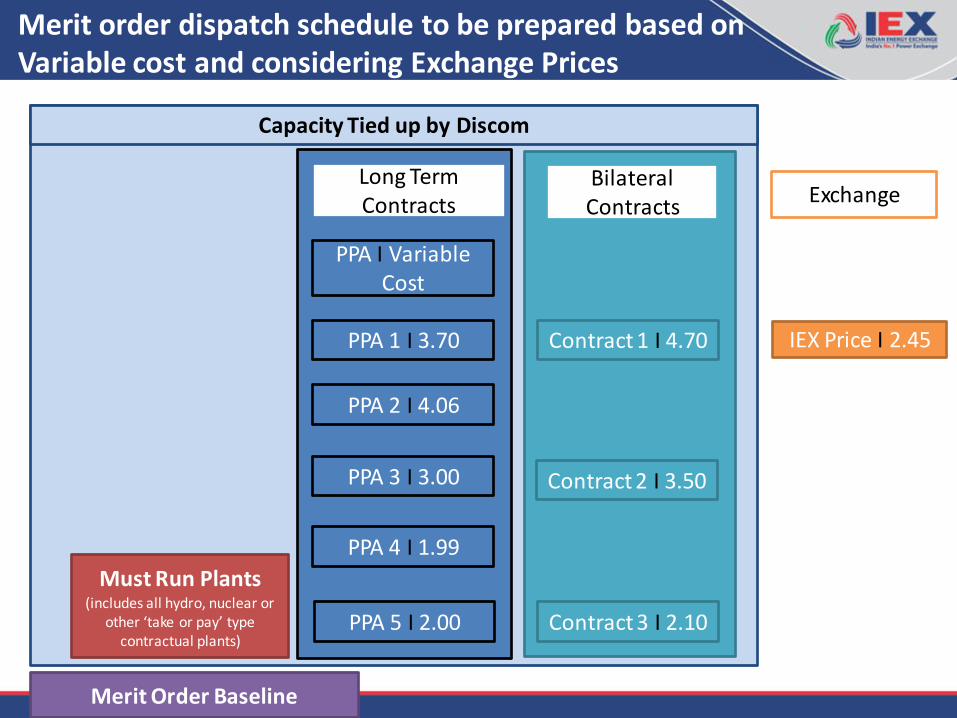
Merit order dispatch schedule to be prepared based on Variable cost and considering Exchange Prices

PPA 1 I 3.70
PPA 2 I 4.06
IEX Price I 2.45
PPA 3 I 3.00
PPA 4 I 1.99
PPA 5 I 2.00
Must Run Plants (includes all hydro, nuclear or
other ‘take or pay’ type contractual plants)
Contract 1 I 4.70
Contract 2 I 3.50
Contract 3 I 2.10
Incre
asing V
ariable C
ost
To b
e disp
atched
in th
is Ord
er based
on
Energy
Dem
and
of th
e Disco
m
Merit Order Baseline
Merit order dispatch schedule to be prepared based on Variable cost and considering Exchange Prices
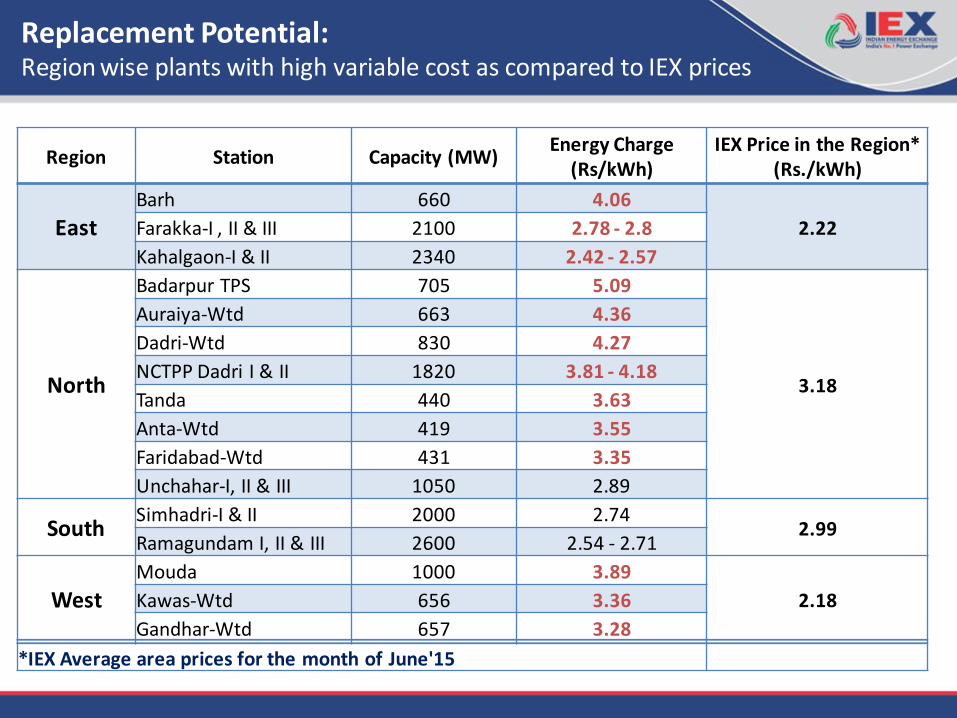
Replacement Potential: Region wise plants with high variable cost as compared to IEX prices
Region Station Capacity (MW) Energy Charge
(Rs/kWh) IEX Price in the Region*
(Rs./kWh)
East Barh 660 4.06
2.22 Farakka-I , II & III 2100 2.78 - 2.8
Kahalgaon-I & II 2340 2.42 - 2.57
North
Badarpur TPS 705 5.09
3.18
Auraiya-Wtd 663 4.36
Dadri-Wtd 830 4.27
NCTPP Dadri I & II 1820 3.81 - 4.18
Tanda 440 3.63
Anta-Wtd 419 3.55
Faridabad-Wtd 431 3.35
Unchahar-I, II & III 1050 2.89
South Simhadri-I & II 2000 2.74
2.99 Ramagundam I, II & III 2600 2.54 - 2.71
West Mouda 1000 3.89
2.18 Kawas-Wtd 656 3.36
Gandhar-Wtd 657 3.28
*IEX Average area prices for the month of June'15

Cost Optimisation Potential in Bihar
Annual: Plant-wise
Source: • Variable Cost taken from ARR of NBPDCL & SBPDCL • Variable Cost of Rs. 4.06 is considered as 4.06 for April 15 as per ARR of FY 2015-16 • Source for Volume:
• Volume of CGS taken from ERPC • Volume of SGS taken from ARR
S. No Power Plant Allocated Capacity (MW)
Variable Cost-FY15 (Rs./kWh)
Replaceable Volume (MU)
Annual Volume (MU)
Potential Savings (Cr)
1 KBUNL Stage 1 U-1 220 4.06 700 700 112
2 BARH STPS II 430 4.06 1,290 1,290 174
3 Adani-Gujarat 300 3.17 515 1,612 20
4 Barauni TPS 220 3.00 359 836 9
5 Farakka STPS I & II 379 2.80 1,189 3,429 18
6 Farakka STPS III 55 2.78 203 714 2
7 KhSTPS I 293 2.57 223 2,220 0
8 KhSTPS II 78 2.42 0 515 0
9 Talcher STPS I 344 1.47 0 2,855 0
10 GMR 200 1.46 0 870 0
Total 2,419 4,476 15,041 335
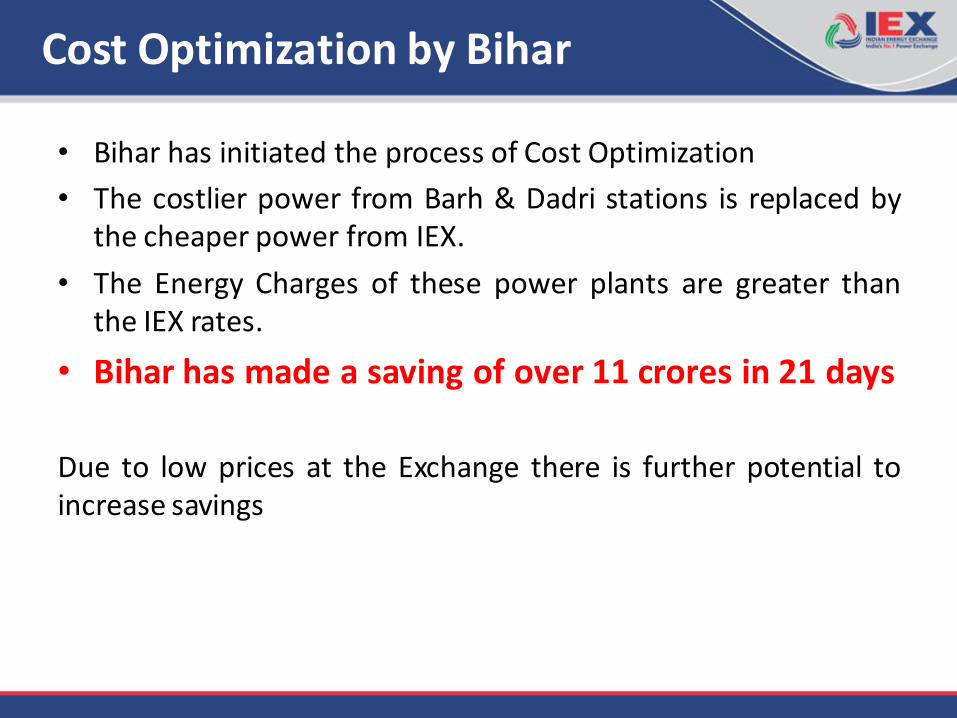
Cost Optimization by Bihar
• Bihar has initiated the process of Cost Optimization
• The costlier power from Barh & Dadri stations is replaced by the cheaper power from IEX.
• The Energy Charges of these power plants are greater than the IEX rates.
• Bihar has made a saving of over 11 crores in 21 days
Due to low prices at the Exchange there is further potential to increase savings

Utility Software created by IEX for Bid Optimization
• IEX has created a utility software for Discoms and is providing it free of cost
• The software is customised for each Discom to take into account its existing PPAs along with their variable cost and status of must run plants etc.
• Based on the inputs fed into the software, it provides with the optimisation bid which should be put into the IEX bidding platform along with details of backing down if the Bid is selected
• Benefits: – Discoms need not be bothered about Exchange prices for bidding – The software will create bid as per the Discoms merit order and other
constraints fed to it – On acceptance of the Bid, the Discom can backdown the plants

Banking Transactions
• Banking transactions takes place directly between Discoms, the transactions are cashless in nature, where one Discom banks power to other for utilising it later.
• Commercial considerations required for Banking
transactions with the reference price available.

Case Study: Banking @ 500 MW quantum
MONTH DRAWAL by
Discom-1 (MUs) IEX PRICE (Rs/KWh)
DRAWAL by Discom-2 (MUs)
IEX PRICE (Rs/KWh)
Nov'14 365 2.63 Dec'14 372 2.96 Jan'15 372 2.70 Feb'15 320 2.60 Jun'15 350 3.18 Jul'15 362 3.2 Aug'15 362 2.64 Sept'15 372 3.43 Weighted Avg (as per data availaible)
1429 2.72 1446 3.11
TOTAL 1429 2.72 1446 3.11 Profit/Loss to Discom-1 Rs Crore
(60)

Cost Benefit Analysis for Open Access Consumer
*Assumption: Buy Quantity is 10 MW for 24 hours and 1000 Portfolios are selected everyday
Voltage Level 33 kV 132 kV
Volume Traded in MW 10 10
Hours Traded 24 24
Total Volume in MWh (at Regional Periphery) 240 240
IEX Rate at Regional Periphery (in INR per unit) 3.00 3.00
Losses Assam Withdrawal POC Loss 2.05% 2.05%
State Loss 3.64% 3.64%
Wheeling Losses 17.60% 0.00%
Cost After Losses (in INR per unit) 3.73 3.17
Charges State Transmission Charges (in Rs/unit ) 0.42 0.42
Assam Withdrawal POC Charges (in Rs/unit) 0.17 0.17
Wheeling Charges (in Rs/unit) 0.22 0.00
NLDC Operating Charges+ NLDC Application Charges + SLDC Charges* 0.03 0.03
IEX Transaction Charges @ Rs 20 per MW (in INR/unit) 0.02 0.02
Professional Fees ( If transacted through Member)* * 0.02 0.02
Cross Subsidy Charges (in INR/unit) 0.54 0.54
IEX Rate @ ex ABT Meter (in INR/unit) 5.15 4.37 Energy Charges (in INR/unit) 7.16 7.16
Savings Per Unit (in INR/unit) 2.01 2.79
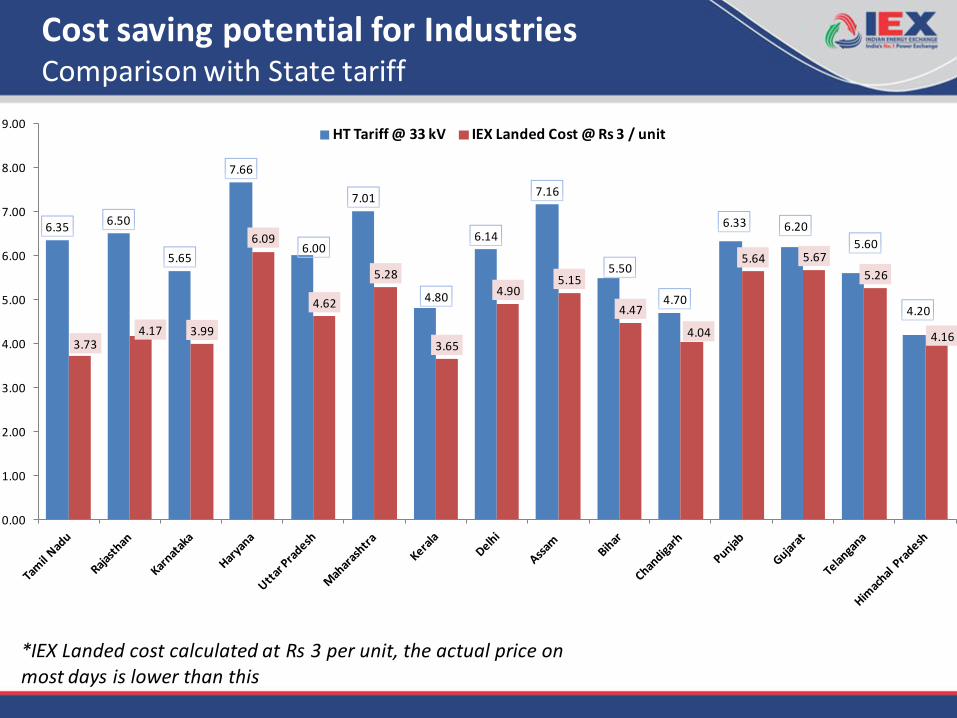
Cost saving potential for Industries Comparison with State tariff
*IEX Landed cost calculated at Rs 3 per unit, the actual price on most days is lower than this
6.35 6.50
5.65
7.66
6.00
7.01
4.80
6.14
7.16
5.50
4.70
6.33 6.20
5.60
4.20
3.73 4.17 3.99
6.09
4.62
5.28
3.65
4.90 5.15
4.47
4.04
5.64 5.67
5.26
4.16
0.00
1.00
2.00
3.00
4.00
5.00
6.00
7.00
8.00
9.00 HT Tariff @ 33 kV IEX Landed Cost @ Rs 3 / unit

Thank You
31

Growing Share of Short Term Market in
Total Gen.
2.7 7.1 13.5 14.8 23.0
30.0 29.4 14.9
26.8 29.7
36.6
36.6 35.8 34.56
3.3
6.2
10.3
15.4 14.5
17.4 15.58
14.4
25.8
28.1
27.8 24.8
21.5 19.45
7.4%
8.6%
10.0% 10.8% 10.9% 10.9%
9.5%
0%
2%
4%
6%
8%
10%
12%
0
20
40
60
80
100
120
FY08-09 FY09-10 FY10-11 FY11-12 FY12-13 FY13-14 FY14-15
Shar
e o
f Sh
ort
Te
rm T
rad
e in
To
t G
en
(%
)
Vo
lum
e (B
U)
PXs Trader Direct UI Share of ST in Tot Gen
• Short term market growing at an encouraging rate with a CAGR of 22% in the past six years.
• Power Exchanges witnessing growth at a CAGR of 62% (last six years). 32