power protection analysis for a ten bus system by sean hanna
TRANSCRIPT

i
Power Protection Analysis for a Ten Bus System
by
Sean Hanna
Senior Project
Electrical Engineering Department
California Polytechnic State University, San Luis Obispo
December 2015

ii
Table of Contents
Section Page
Title Page...........................................................................................................................................i
Table of Contents..............................................................................................................................ii
Lists of Tables and Figures..............................................................................................................iii
Abstract..............................................................................................................................................1
Chapter 1: Introduction......................................................................................................................1
Chapter 2: Customer Needs, Requirements and Specifications.........................................................3
Chapter 3: Ten Bus Network…..………………………………………………………………..…..4
3.1 Network Construction in ETAP……….……….………………………………………4
3.2 Load Flow Analysis…………….………………………………………………………6
3.3 Fault Analysis………………….……………………………………………….………7
3.4 Transmission Line Protection……….………………………………………….…........9
3.5 Generator Protection…………………………………………………………………...11
3.6 Transformer Protection……………………….………………………………………..12
3.7 Bus Bar Protection………………….………………………………………………….15
3.8 Motor and Static Load Protection…………………………………………………...…18
3.9 Implementation and Simulation using ETAP…………………………………...20
Chapter 4: Conclusions…………………………………………………………………………..….22
References...........................................................................................................................................23
Appendix A. Senior Project Analysis.................................................................................................24
Appendix B: Functional Decomposition (Level 0 and Level 1)……………………………….……26
Appendix C: Project Planning (Gantt Chart and Cost Estimates)……………………………….…..27

iii
List of Tables and Figures
Table Page
1. Requirements and Specifications..................................................................................................3
2. Project Deliverables......................................................................................................................4
3. Line Protection Values Found and Calculated............................................................................10
4. Zone 1 and Zone 2 Impedances at 68 Degrees............................................................................11
5. Generator Differential Protection................................................................................................11
6. Overcurrent Generator Protection...............................................................................................12
7. Transformer Differential Protection……………………………………………………….…...14
8. Transformer Overcurrent Protection……………………………………………………….…..14
9. Bus bar Protection………………………………………………………………………….......17
10. Motor Protection…………………………………………………………………………..…...18
11. Overcurrent Protection for Static Loads……………………………………………………..…19
12. Cost Estimates………………………………………………………………………….........…27
Figure
1. One Line Diagram for the Power System......................................................................................2
2. Assumptions and Line Lengths for the Power System..................................................................2
3. Network Construction in ETAP.....................................................................................................5
4. Protection Zones of the Power System..........................................................................................5
5. Initial Load Flow Analysis.............................................................................................................6
6. ETAP System with Capacitors Added...........................................................................................7
7. Load Flow Analysis After Capacitors Added................................................................................7
8. Fault Analysis Report (Currents)...................................................................................................8
9. Fault Analysis Report (Impedance)...............................................................................................8
10. MHO Characteristic for Distance Protection of Transmission Lines...........................................10
11. Zigzag Ground Protection (Delta Side) and Ground Protection (Wye Side)……………...….....13
12. Single Bus to Breaker (Left) and Single Bus with a Tie-Breaker (Right)………………...….....15
13. The Principle for Circulating Current Protection………………………………………...….…..16
14. MHO characteristics for Locked Rotor Protection……………………………………………...19
15. ETAP Simulation with Busbar Protection Implemented………………………………………..20
16. ETAP Simulation with Relays Added…………………………………………………...………20
17. Level 0 Block Diagram……………………………………………………………………….....26
18. Level 1 Block Diagram……………………………………………………………………….…26
19. Gantt Chart ………………………………………………………………………………...........27

1
Abstract
Each power system built in the industry requires a protection plan. Undetected faults in a power
system can contribute to hazardous conditions, overheating of power devices, low or high system
voltages, unbalanced conditions, and blackouts [4]. This senior project is the design of a protection plan
for a power system using the software Electric Transient Analyzer Program (ETAP). With ten buses, five
transformers, two generators, two motors, and six transmission lines, there are many possibilities for a
fault to occur. The Load flow and fault analysis are studied before the system is protected. All
components of the system are protected using methods such as differential and overcurrent protection.
Without a proper power protection plan, any disturbance within the network has a chance of rendering the
network inoperable. This project illustrates the protection styles and techniques used by professional
engineers in the field of power.
Chapter 1: Introduction
Power protection is the art and science of safeguarding the power system components and people
during abnormal (fault) conditions. If a fault goes undetected, conditions can become hazardous, power
devices can overheat, system voltages can go low or high, conditions can be unbalanced, power flow can
be prevented, and the system can become unstable. The objectives of a protection plan are to detect and
isolate faults being selective, economical, reliable, and fast. These principles are best explained using the
5 S’s of protection; security, selectivity, sensitivity, speed, and simplicity [12]. ETAP is the leading
software in power protection and contains the tools needed to protect the network.
The power system I was tasked with protecting is shown in Figure 1. In this one line diagram,
information about the system is displayed. Those values are used for all of the calculations throughout the
entirety of the project, with any other values used being assumed. Figure 2 shows the transmission line

2
lengths and whether the transformers of the system are Y connected or delta connected. The protection
begins with load flow and fault analysis. Next, the transmission lines are protected using distance and
overcurrent protection. The generators and transformers are then protected using differential and
overcurrent protection. The busbars are protected using busbar protection, while the motors and static
loads are protected using locked rotor and overcurrent protection respectively. After the system is
completely protected, the software is used to simulate the protection plans with the addition of relays.
Figure 1: One Line Diagram for the Power System [11]
Figure 2: Assumptions and Line Lengths for the Power System

3
Whether the transformers and generators are grounded Y or delta influences the system greatly.
In delta configuration, the phase voltage is equal to the line voltage. In Y configuration, the phase voltage
is the line voltage divided by root 3. Consequently, in Y configuration, the phase current and line current
are equal. In delta configuration the phase current is line current divided by root 3. If the correct
connections aren’t known, all values could be affected by a factor of root 3.
Chapter 2: Customer Needs, Requirements, and Specifications
2.1. Customer Needs Assessment
The customer for this project is my advisor, Dr. Shaban. I was tasked by my employer to protect a
ten-bus power system network and design a protection plan for it. The tasks completed are load flow and
fault analysis for the system, generator protection, motor protection, transformer protection, bus
protection, and line protection.
2.2. Requirements and Specifications
My customer was straightforward with what he wanted and listed out what he wanted in his
assignment to me [11]. I was able to develop the requirements and specifications for this project from the
list of instructions. I used the ETAP software to analyze the power system. Shown below in Table 1 are
the marketing requirements and specifications.
Marketing
Requirements
Engineering
Specifications
Justification
1 All of the network analysis is
implemented in ETAP.
The project requires ETAP because it is the
software that Cal Poly offers to its
electrical engineering students for free use
in the student project lab.
2, 3 Load flow and fault analysis are
performed for the network, with the
voltages and currents at the different
buses documented.
The values found during the load flow and
fault analysis are needed to design the
protection plan.

4
4, 5 Generator and Motor protection are
performed with the component values
chosen documented.
Differential protection, overcurrent
protection, and impedance protection are
the types of protection that can be done for
the generators and motors.
6, 7 The transformers and buses are protected
and the component values chosen are
documented.
The transformers and busses will have
differential protection.
8 Line protection is performed and the
component values chosen for optimal
protection are documented.
Using distance relays is the most
convenient way to perform line protection.
Table 1: Requirements and Specifications
1. Completed using ETAP
2. Load Flow Analysis
3. Fault Analysis
4. Generator Protection
5. Motor Protection
6. Transformer Protection
7. Bus Protection
8. Line Protection
Delivery Date Deliverable Description
April 2015 Design Review
May 2015 EE 461 demo
May 2015 EE 461 report
Nov 2015 EE 462 demo
Dec 2015 ABET Sr. Project Analysis
Dec 2015 Sr. Project Expo Poster
Dec 2015 EE 462 Report
Table 2: Project Deliverables
Chapter 3: Ten-Bus Network
3.1 Network Construction in ETAP
Before any parts of the system could be protected, the system itself needed to be constructed in
the software. The network assembled in ETAP is shown in Figure 3 and its zones of protection shown in
Figure 4. The different protection zones overlap in the figure to show that no section of the system is
unprotected from faults. The chosen configuration of the transmission lines has a height of 70 ft. The
phase conductor type was chosen as EPRI_M with the spacing between both A and B and B and C equal

5
to 15 ft. With the spacing from A to C equal to 30 ft. The higher the voltage of the transmission line, the
greater the height and conductor spacing should be. The infinite bus also needed to have a short circuit
MVA equal to 4200 in order for the system to operate.
Figure 3: Network Construction in ETAP
Figure 4: Protection Zones of the Power System

6
3.2 Load Flow Analysis
In order to plan a full power system protection scheme for the given system, a load flow analysis
is required. The analysis spots any problems with the system which must be corrected before any
protection plan can commence. The load flow analysis shown in Figure 5 was completed using ETAP
12.5 and constructed using the given instructions with default equipment settings. The goal of the load
flow analysis is to have each bus voltage percentage be between 95% and 105%. After the initial load
flow analysis, issues were found at both generators, as well as at buses 5, 8, 9, and 10. The parts of the
network with problems are highlighted in red and those close to being a problem are highlighted in pink.
The system cannot operate with problems at its generators and buses. The method chosen to fix the
problems was to add capacitive banks to the red buses to raise the voltage percentage up and the updated
system is shown in Figure 6. The way the MVAR values were chosen for the capacitors was by adding a
synchronous generator to the bus and observing how much reactive power it was distributing to
compensate for the under voltage bus. The added capacitors also helped remove any problems with the
generators as well. The updated load flow analysis without any red highlighted components is shown in
Figure 7.
Figure 5: Initial Load Flow Analysis

7
Figure 6: ETAP System with Capacitors Added
Figure 7: Load Flow Analysis after Capacitors Added
3.3 Fault Analysis
A short circuit analysis should be performed in addition to the load flow analysis which tells the
possible fault currents in the system. Figure 8 shows the three-phase, single line to ground (SLG), line to

8
line (LL) and double line to ground (DLG) fault currents for a fault on each bus respectively. The SLG
fault currents are the highest while the LL fault currents are about 85 - 87 % of the three phase fault
current. Bus 1 and bus 10 have the highest fault currents, bus 2 and bus 3 have moderate fault currents
and busses 5 and 9 have the smallest fault currents. Figure 9 shows the positive, negative, and zero
sequence impedances of each of the buses and was also included in the short circuit report.
Figure 8: Fault Analysis Report (Currents in KA)
Figure 9: Fault Analysis Report (Impedance)

9
3.4 Transmission Line Protection
The first piece of the network to protect is the transmission lines. The transmission lines are the
link of connections within the power system and are vital to protect and be able to disconnect in case of a
fault. Distance directional protection relays are a common way design method together with pilot
protection.
Distance protection senses the impedance of the line and trips if the resulting impedance is too
low due to a fault. The impedance is derived from a voltage and current transformer. The distance
protection is then connected to a directional relay which determines where the fault is located and whether
or not to trip. The directional relay is often designed at 70 or 75° in both the forward or reversed
direction. Now, relays designed by SEL can be set at any angle. The distance protection is further divided
into different protection zones which acts as back up and overlap protection of adjacent lines. Zone 1 is
often set at 80% of the line, Zone 2 at 125% and Zone 3 at 250%. For this project Zone 3 protection is
neglected since the transmission lines aren't too long.
The equation used for the rated current throughout the project’s calculations is
√
After finding the rated current; the CTR is chosen by rounding up the rated current value to the nearest
hundred. The mho X/R radius can be found from the line impedance and the angle setting of the relay by
the equation ⟨ ⟩
. The forward directed relay is set from the origin and the reversed
directed relay is set from the end of the transmission line. The needed CT and PT ratios are here
converted directly from the load currents and bus voltages of the system. The values chosen and
calculated from the ETAP design are shown in Table 3. With those values it is possible to find the
primary and secondary zone impedances which are shown in Table 4. In Figure 10 an example of how the
different protection zones overlap is shown. The blue and green circles are the forward protection zones
and the red and aqua circles are backward protection zones. They have the same impedance values only

10
one differential relay is set from the origin and the backward relay is set from the end of the transmission
line, looking the opposite way.
Table 3: Line Protection Values Chosen and Calculated
Table 4: Zones 1 and 2 Impedance at 68 Degrees
Figure 10: MHO Characteristic for Distance Protection of Transmission Lines
11
3.5 Generator Protection
The next step is to design a generator protection scheme for both of the generators. The protection
schemes used are differential and overcurrent protection. The generators are protected from internal faults
with differential protection. The differential protection compares the ingoing and outgoing phase currents
of the machine and trips on a small imbalance. This difference is in most cases due to an internal fault
which is what we want to protect against. Some small imbalances can occur during transients and
mismatch between the current transformers and the pick-up current can account for that. A typical pickup
current for generator protection is between 0.14-0.28 A. The pickup current chosen was 0.15 A
In addition to these protection schemes, overcurrent, overheating and negative sequence
protection would be needed as well. The overcurrent protection is placed in phase and protects against
large external faults and work as a back-up protection. Each generator is assumed to handle a max load
current on 125% of the rated current. It is assumed that the solid state protection relays include both
negative sequence and overheating relays which will warn and trip for any large negative sequence
currents and overheating conditions.
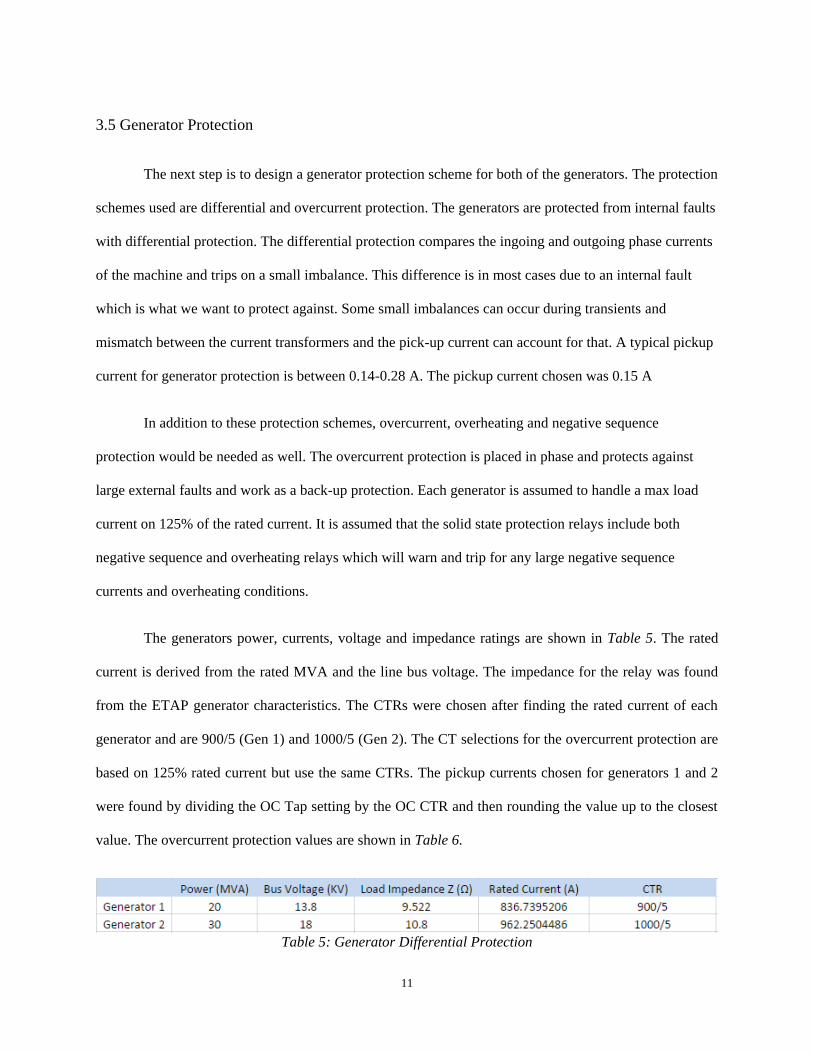
The generators power, currents, voltage and impedance ratings are shown in Table 5. The rated
current is derived from the rated MVA and the line bus voltage. The impedance for the relay was found
from the ETAP generator characteristics. The CTRs were chosen after finding the rated current of each
generator and are 900/5 (Gen 1) and 1000/5 (Gen 2). The CT selections for the overcurrent protection are
based on 125% rated current but use the same CTRs. The pickup currents chosen for generators 1 and 2
were found by dividing the OC Tap setting by the OC CTR and then rounding the value up to the closest
value. The overcurrent protection values are shown in Table 6.
Table 5: Generator Differential Protection

12
Table 6: Generator Overcurrent Protection
3.6 Transformer Protection
The system has five power transformers that need protection. This is often realized using
differential protection. While using differential protection, one must consider high magnetizing inrush
currents, different voltage levels and the delta/wye phase shifts. Since the transformers are a vital part of
the system, ground and overcurrent protection as backup will also be considered.
The differential protection is completed in two steps. The first step is to cancel out the zero
sequence and the 30 degree phase shift created by the delta-wye connection by connecting the CTs in
delta on the wye side and in wye on the delta side. Second, adjust the CT ratio and tap selection to reduce
the operating mismatch. Likewise, assure a safe margin in the mismatch percentage to account for
unknown CT errors. The mismatch percentage is given by the equation:
This differential protection may operate due to large inrush or magnetizing currents that energize
the transformer, voltage dips and/or sympathetic inrush currents from the nearby energizing transformers.
In order to avoid operation during these natural high currents, the differential protection must be set to
detect when a large mismatch is due to an internal fault or a temporarily large inrush current. A harmonic
detection observer is one solution to that problem while keeping the differential protection operational
during all time. [13]
Ground protection is another vital backup protection against external line-to-ground faults and
can be designed using differential overcurrent relays and/or autotransformers. It is assumed that CT ratios
around 100:5 would be able to detect a ground fault current while CT ratios of 1000:5 and above would
have too low of a sensitivity. If that is the case, the CT ratios could be adjusted by an autotransformer.

13
The main task for all protection schemes is to detect the zero sequence fault current and compare it to a
differential relay or to a time overcurrent relay as a backup. The transformers could be either grounded
solemnly on the wye side or through a zigzag transformer on the delta side of the transformer (Figure 11).
The ground protection is guaranteed by a differential relay with an overcurrent relay as a backup
protection. [13]
Figure 11: Zigzag Ground Protection (Delta Side) and Ground Protection (Wye Side) for the
Transformer on Left and Right Sides Respectively [13]
In addition to differential and ground protection, an overcurrent relay should be added as backup
for phase faults. This is especially vital for large loaded transformers which would inflict major damage if
the primary differential protection would fail. A typical setting for the CTs of an instantaneous
overcurrent relay is 150-200% of the largest three phase fault current [13]. The inrush current is typically
between 8-12 times the rated current and for this experiment the current was estimated at 10 times the
rated current.
Differential relay protection with harmonic detection is used as primary protection with phase
overcurrent protection as a backup for all four transformers. In addition, wye side overcurrent differential
14
grounding is added as a backup for SLG faults since they are the most common type of fault. The
transformers are connected in delta on the low voltage side and wye on the high voltage side according to
given instructions.
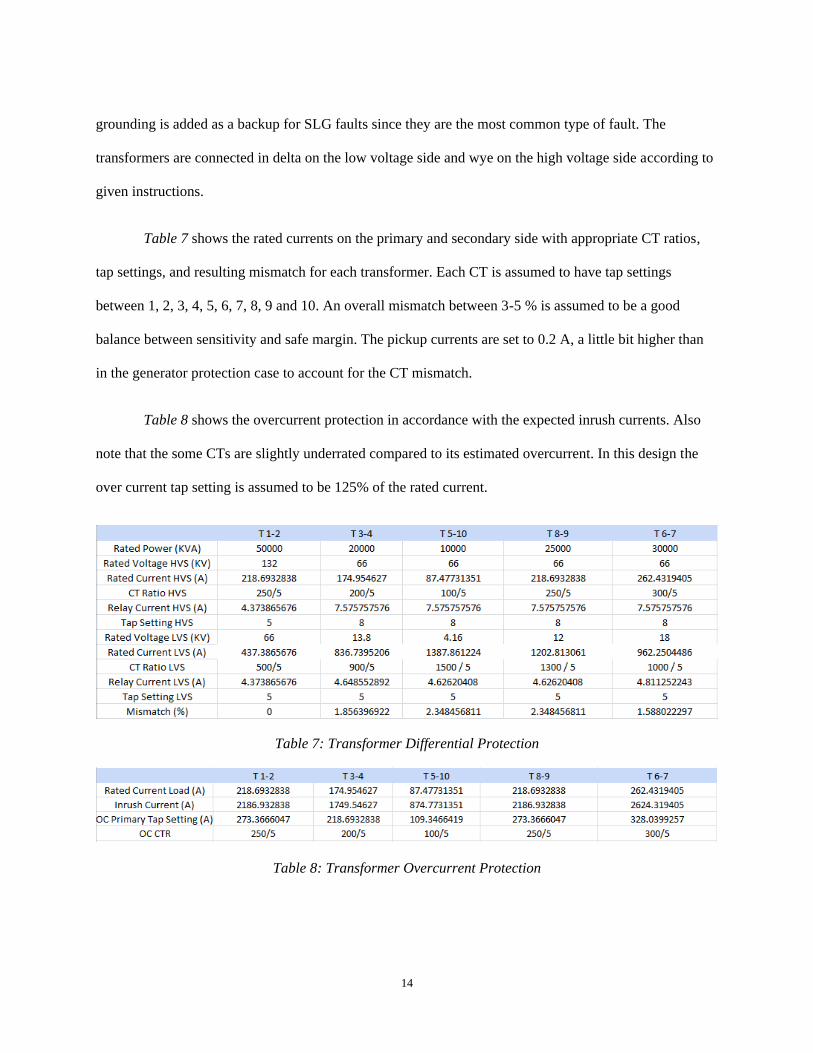
Table 7 shows the rated currents on the primary and secondary side with appropriate CT ratios,
tap settings, and resulting mismatch for each transformer. Each CT is assumed to have tap settings
between 1, 2, 3, 4, 5, 6, 7, 8, 9 and 10. An overall mismatch between 3-5 % is assumed to be a good
balance between sensitivity and safe margin. The pickup currents are set to 0.2 A, a little bit higher than
in the generator protection case to account for the CT mismatch.
Table 8 shows the overcurrent protection in accordance with the expected inrush currents. Also
note that the some CTs are slightly underrated compared to its estimated overcurrent. In this design the
over current tap setting is assumed to be 125% of the rated current.
Table 7: Transformer Differential Protection
Table 8: Transformer Overcurrent Protection
15
3.7 Busbar Protection
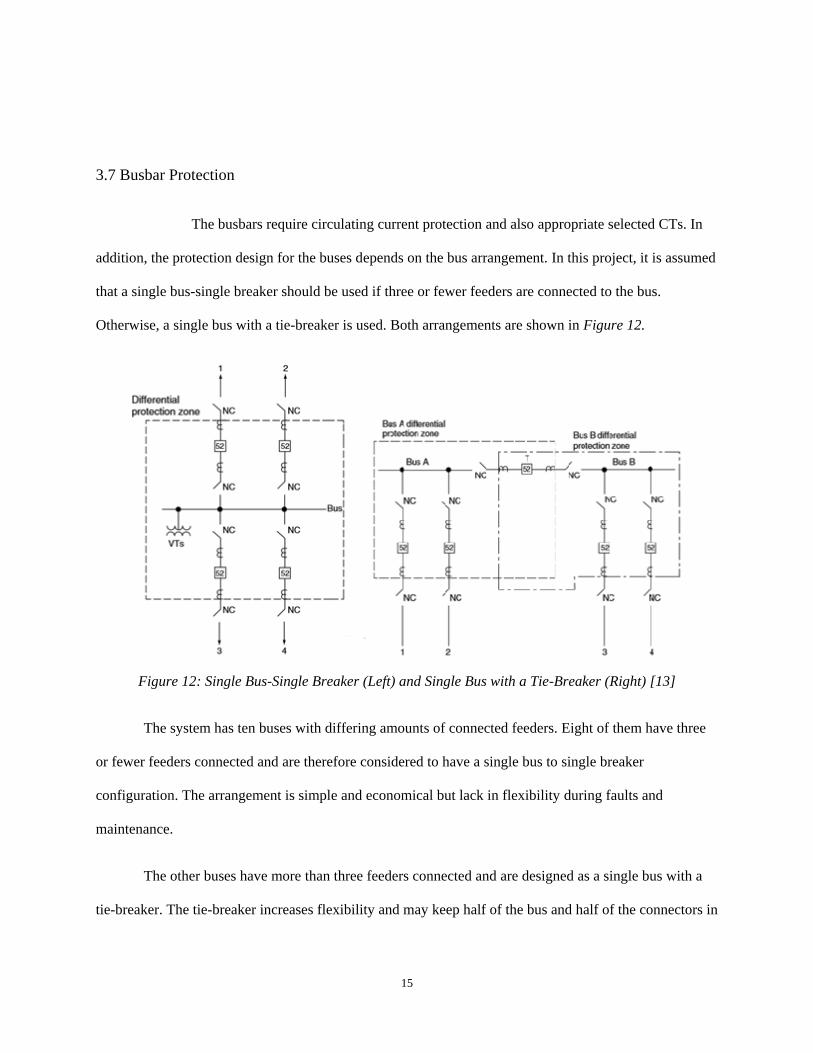
The busbars require circulating current protection and also appropriate selected CTs. In
addition, the protection design for the buses depends on the bus arrangement. In this project, it is assumed
that a single bus-single breaker should be used if three or fewer feeders are connected to the bus.
Otherwise, a single bus with a tie-breaker is used. Both arrangements are shown in Figure 12.
Figure 12: Single Bus-Single Breaker (Left) and Single Bus with a Tie-Breaker (Right) [13]
The system has ten buses with differing amounts of connected feeders. Eight of them have three
or fewer feeders connected and are therefore considered to have a single bus to single breaker
configuration. The arrangement is simple and economical but lack in flexibility during faults and
maintenance.
The other buses have more than three feeders connected and are designed as a single bus with a
tie-breaker. The tie-breaker increases flexibility and may keep half of the bus and half of the connectors in

16
operation if a fault occurs. With additional power sources, the load can be transferred through the bus
connection.
A simple protection scheme for the buses is using either differential or circulating current relays.
The circulating current relay is normally cheaper than the differential relay and would be appropriate for
simple bus arrangements as single bus-single breaker and single bus with a tie breaker. The principle is
explained in Figure 13. For each bus, the current going in is equal to the current going out. For an internal
fault, the current going in and the current going out would not add up and the resulting current would flow
through the operating relay and trip the breakers. For an external fault, the ingoing and outgoing currents
would stay the same and not trip for that fault.
Figure 13: The Principle for Circulating Current Protection [13]
This is true for a single line to ground fault. However, a line to line fault would still keep the
amount of current going in and out the same and wouldn’t detect the fault. A solution to that is to have a
circulating current relay for each phase. For the single bus with a tie breaker, the bus and feeders will be
divided into two sections, separated by the tie breaker. An additional circulating current relay is added
covering both sections for monitoring purposes.
17
The first step is to define which buses should be single bus and which ones would be single bus
with a tie breaker. In the single bus and tie-breaker case, the protection scheme must be able to operate
with the breaker both open and closed. When choosing CT relays, each relay for all feeders must have the
same ratio to guarantee that the relay currents will cancel each other. The CT ratios should also strive to
match the max load on the connected feeders to the bus. They should not risk saturation if the current
were to rise due to a loss of a neighbouring line/feeder. Let the load currents, extracted from the
generators and/or loads connected to each bus, be the general CT ratio for that specific bus. These CTs are
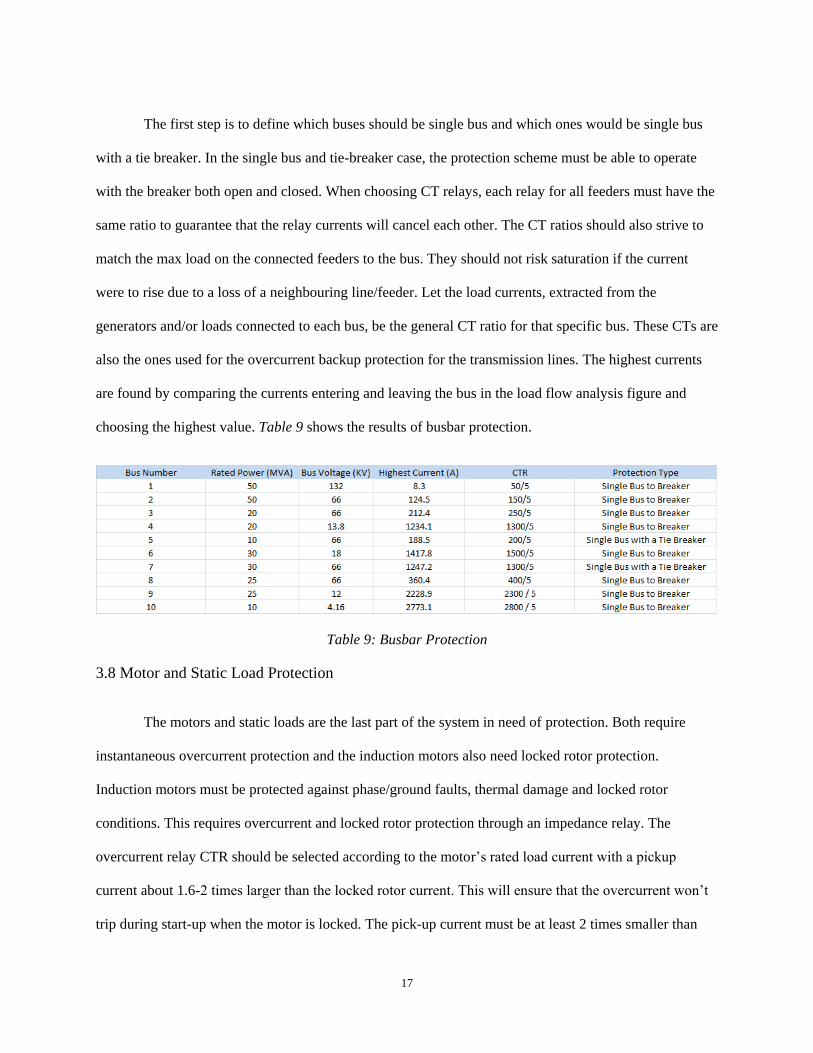
also the ones used for the overcurrent backup protection for the transmission lines. The highest currents
are found by comparing the currents entering and leaving the bus in the load flow analysis figure and
choosing the highest value. Table 9 shows the results of busbar protection.
Table 9: Busbar Protection
3.8 Motor and Static Load Protection
The motors and static loads are the last part of the system in need of protection. Both require
instantaneous overcurrent protection and the induction motors also need locked rotor protection.
Induction motors must be protected against phase/ground faults, thermal damage and locked rotor
conditions. This requires overcurrent and locked rotor protection through an impedance relay. The
overcurrent relay CTR should be selected according to the motor’s rated load current with a pickup
current about 1.6-2 times larger than the locked rotor current. This will ensure that the overcurrent won’t
trip during start-up when the motor is locked. The pick-up current must be at least 2 times smaller than

18
the possible minimum fault current which in this case is the line to line fault current. The contribution
from the induction motor to this fault has been neglected for simplicity reasons. Furthermore, adding an
impedance relay will ensure that the motor protection will trip for undesirable locked rotor conditions. A
mho relay with a time delay will trip the coil if the motor stays to long in the locked rotor condition.
Static load protection can be handled by a simple overcurrent relay with an assumed overcurrent
on 125% of the rated load current. This will disconnect the feeders and remove the load from the grid
protecting against any possible equipment damage and overheating. The power system includes two
induction motors and two static loads. The induction motor parameters are given from the ETAP
simulation and the rated KVA from the equation
. The results of the motor
protection in the system are shown in Table 10. The power factor, reactance, per unit reactance, and
efficiency are obtained from the ETAP program while the rated current, locked rotor current, and pick up
current, and multiple are calculated. The equation to find the locked rotor current is
. To
convert from per unit to amps, the value is multiplied by the rated current.
Table 10: Motor Protection
The locked rotor impedance relay is set at the induction motor’s sub-transient reactance Xd''
(Figure 14). When the detected impedance stays within the circle for too long, a time delay relay will

19
close a contact which sends a trip signal to disconnect the machine. Any inrush currents are assumed to
briefly stay within the zone without risk of tripping the time delay setting.
Figure 14: MHO characteristics for Locked Rotor Protection [13]
The static load overcurrent CT ratios were based on the expected overcurrent of 125% of the
rated current and the overcurrent protection results are shown in Table 12. The rated current was given
from each load’s power and voltage ratings.
Table 11: Overcurrent Protection for Static Loads
3.9 Implementation and Simulation using ETAP
The first part of the system protected is the busbars. In Figure 15, bus protection using ETAP is
shown. Notice how the CTs surrounding the bus are all tied together to one relay. To simplify the figure, I
chose to only show one section of the network with bus protection. Figure 16 shows the system with
relays added to protect the network. Certain connections were left out due to simplicity reasons. I used
the ETAP’s library to find the particular relay I needed. I chose to use relays manufactured by Schweitzer
since they are some of the most commonly used relays in the industry.

20
Figure 15: ETAP Simulation with Bus Bar Protection Implemented
Figure 16: ETAP Simulation with Relays Added
For the motors, two SEL-710 relays are used. These relays provide locked-rotor, overload,
unbalance and short circuit protection for the two motors. SEL-300G relays are used to provide primary
and secondary protection for the generators in the system. The SEL-267 relays are used to protect the
transmission lines with directional overcurrent and distance protection. For the transformers and bus bars,
SEL-387 relays are used since they provide differential and overcurrent protection for both. With all of
the relays, current transformers, and circuit breakers added, this system now has protection from all types
of faults.

21
Chapter 4: Conclusions
The goal of this project was to find an optimum protection strategy for the system given. The
factors considered while working on this project were security, selectivity, sensitivity, speed and
simplicity. The instrument transformers were chosen carefully to be able to sense the fault current
conditions. Tap settings were set with regards to normal operation currents as well as large inrush currents
for the induction motor and different CT requirements for the transformer differential relay. Main and
backup protection schemes have also been designed as far as possible (often made up by a distance or
differential protection as main and an overcurrent as a backup). Hence, the sensitivity, selectivity and
security design goals have been meet. Concerning speed, the relays in the system will act according to the
settings when a fault occurs, ensuring the system remains functional. Simplicity is the last requirement
which was one of the main factors considered when protecting the network. Using uniform types of relays
helps make functions operate as smooth as possible, and makes the system easier to troubleshoot. Having
the protection zones for the system overlap also helps keep the protection design as cost effective as
possible.
This project concerns a relatively small power system with only five transformers and ten buses.
However, it is clear that even for small power systems the protection requirements are important. All
pieces of the network need both main and backup protection and the different types of faults, special
equipment conditions, and overall abnormalities need to be factored in as well. In this project, only the
most basic and standard protection requirements have been considered. It should be noted that additional
main systems, backup systems thermal protection and abnormalities such as voltage drops could also be
added to the protection design. Moreover, another type of protection that will become more important
especially when upgrading to microprocessor based relays is cyber protection. It will be a high priority
when the power grid becomes more dependent on signaling and piloting between relays, ensuring that the

22
communication lines are secure. Transmission lines have previously being locally monitored at the
substation but with the developing of solid state relays, smart grids and digital signal applications
cyberspace security would also be a concern for power engineers.
References
1) G. Richards, “System and method for thermal protection in a power system” US Patent
8,742,622 B2, April 19th, 2012.
2) “Introductory Guide to ETAP for Power Students”, ETAP, Irvine, CA, 2014.
3) Triad Magnetics, "VPS10-13000 Datasheet" Triad Magnetics, Corona, CA. March 18, 2004.
4) Brown, K.; Shokooh, F.; Abcede, H.; Donner, G., "Interactive simulation of power systems:
ETAP applications and techniques," Industry Applications Society Annual Meeting, 1990.,
Conference Record of the 1990 IEEE , vol., no., pp.1930,1941 vol.2, 7-12 Oct. 1990. doi:
10.1109/IAS.1990.152451
5) Khan, R.A.J.; Junaid, M.; Asgher, M.M., "Analyses and monitoring of 132 kV grid using ETAP
software," Electrical and Electronics Engineering, 2009. ELECO 2009. International Conference
on , vol., no., pp.I-113,I-118, 5-8 Nov. 2009
6) Patil, P.S.; Porate, K.B., "Starting Analysis of Induction Motor: A Computer Simulation by Etap
Power Station," Emerging Trends in Engineering and Technology (ICETET), 2009 2nd
International Conference on , vol., no., pp.494,499, 16-18 Dec. 2009. doi:
10.1109/ICETET.2009.211
7) Aliman, O.; Musirin, I., "Overcurrent relays coordination for commercial building," Power
Engineering and Optimization Conference (PEOCO), 2013 IEEE 7th International, vol., no.,
pp.608,612, 3-4 June 2013. doi: 10.1109/PEOCO.2013.6564620

23
8) Roberts, Bradford P., "A Modular Power Conditioning System for Computer Power Protection,"
Telecommunications Energy Conference, 1981. INTELEC 1981. Third International , vol., no.,
pp.332,337, 19-21 May 1981
9) Jen-Hao Teng, "Integration of distributed generators into distribution three-phase load flow
analysis," Power Tech, 2005 IEEE Russia , vol., no., pp.1,6, 27-30 June 2005. doi:
10.1109/PTC.2005.4524350
10) Fronczak, E., "A top-down approach to high-consequence fault analysis for software systems,"
Software Reliability Engineering, 1997. Proceedings., The Eighth International Symposium on ,
vol., no., pp.259,, 2-5 Nov1997. doi: 10.1109/ISSRE.1997.630873
11) Shaban, A. “Power System Protection Senior Project”, January 2015.
12) Shaban, A. (2015) EE518 Power System Protection, [PowerPoint presentations, lecture,
PolyLearn]. Electrical Engineering Department, California Polytechnic State University, San Luis
Obispo.
13) Blackburn, J.L & Domin, T.J (2014). Protective Relaying Principles and Application. [Textbook]
CRC Press, Fourth Edition, 2014.
Appendix A: Senior Project Analysis
Power Protection Analysis for a Ten Bus System
Sean Hanna
Advisor: Ali Shaban: AS: 02/27/2015
1. Summary of Functional Requirements: This senior project solves the system by performing fault and load
flow analysis. Motor, generator, transformer, bus, and transmission line protection are performed as well
[11]. The overall design operates without error during a simulated fault.

24
2. Primary Constraints: Significant challenges were faced in the design process. Getting familiar with the
ETAP software took some time and effort. Choosing which protection method to use is also very
important since each decision has an effect on the entire system.
3. Economic: Since the project is implemented using the ETAP software installed on the computers in the
electrical engineering building, the electricity used power the computers and lights in the building. The
poster board purchased for the senior project expo will cost approximately $6.99. The input of the
experiment is the power system design in ETAP. The amount of time that this project takes is highlighted
in the Gantt chart below. This senior project takes approximately 150 hours to complete over twenty
weeks. There could be a profit if the protection strategy is used by a company. If that is the case,
assembling the system could cost the company hundreds of thousands of dollars.
4. If manufactured on a commercial basis: Techniques involving the different forms of protection could be
used if this network is manufactured on a commercial basis. There are professional engineers that could
design a better protection strategy than the one in this report and would have a better chance of getting
their product manufactured on a commercial basis.
5. Environmental: The cost of electricity to power the network will affect the surrounding environment. The
transformers, generators, and motors all have emissions that can harm the environment. If any pieces of
the system were to fail, the damages could affect its ecosystem and the species that live in it. Safety
should be a priority for the system’s operators and routine maintenance is a necessity.
6. Manufacturability: There wouldn’t be any issues with manufacturing this project since it is designed
using ETAP software. One would look at the design and then be able to manufacture the components
needed and then arrange them correctly.
7. Sustainability: If the users were to use renewable energy to power the system, the network could become
marginally sustainable. Resources consumed include the power feeding the system as well as all of the

25
materials used in constructing the network. Recycling old transformers, generators, motors, busbars, and
transmission lines can make the manufacturing process more sustainable as well.
8. Ethical: The system is designed with the goal of cost efficiency and overall safety. It is this utilitarian
approach which will benefit the largest amount of people. There might be a professional engineer that
could coordinate a better power protection plan than I so they could improve on my design, making it
more efficient.
9. Health and Safety: If the system were implemented, all of the precautions taken while working with
machinery and high voltages would have to be followed as well or someone could get seriously injured. If
a power surge happened while someone was working close to the transformer then it could explode or
electrocute the person operating the component.
10. Social and Political: This project impacts anyone who could possibly use my design to power what they
needed powered. One could use my design as a small part of their much larger system. The stakeholders
in this project are me, my advisor Dr. Shaban, and Cal Poly.
11. Development: The tool used to develop this project is the software ETAP. This software is downloaded
onto the computers in the electrical engineering building. The techniques outlined in the ETAP user’s
manual [1] are applied to complete the project.
Appendix B: Functional Decomposition (Level 0 and Level 1)
The construction of the level zero block diagram shown below in Figure 17 was relatively simple
to design. The input to the diagram is the design shown in Figure 1 while the outputs are the load flow
and fault analysis, as well as protection for the generators, motors, lines, buses, and transformers. The
module is the ETAP software which is the medium used to complete the senior project.

26
Figure 17: Level 0 Block Diagram
Module: ETAP Software.
Input: Power System Design.
Output: Load Flow Analysis, Fault Analysis, Generator Protection, Motor Protection, Line Protection,
Bus Protection, and Transformer Protection.
Functionality: Once the system is designed using the ETAP software, load flow and fault analysis is
performed. Generator, motor, line, bus, and transformer protection are performed as well.
Figure 18: Level 1 Block Diagram
Above is the level one block diagram where the outputs of the system are divided into separate blocks
since they are separate processes.

27
Appendix C: Project Planning (Gantt Chart and Cost Estimates)
Shown below in Figure 19 is the Gantt chart for the project. Each analysis and protection plan
took about two to three weeks to complete since there are many design build test iterations where steps
are repeated. Documentation for the report was also done continuously.
Figure 19: Gantt Chart
The cost estimates for the project are shown below in Table 3. Normally costing $500, the ETAP
software is available for free on the Cal Poly computers. My individual labor on the project is also free
since I am the only person working on it. The only part of the project that will actually cost me money is
the poster board needed for the senior project expo.
Task Cost Explanation
ETAP Software $0.00 The software is installed on
computers in the EE building.
Poster Board $6.99 The approximate cost of a senior
project expo poster board at
office depot.
Labor $0.00 My labor for this project is free.

28
Total $6.99 The poster board is the only thing
purchased for the project.
Table 12: Cost Estimates