power sector development and south gobi...
TRANSCRIPT

ECONOMIC CONSULTING ASSOCIATES LIMITED41 LONSDALE ROAD LONDON NW6 6RA UKTEL +44 (0)20 7604 4545 / FAX +44 (0)20 7604 4547 www.eca-uk.com
© 2008 Economic Consulting Associates Ltd
POWER SECTOR DEVELOPMENT AND SOUTH GOBI DEVELOPMENT
William DerbyshireUlaanbaatar, 30 October 2008

BACKGROUND ECA has been asked to review the least-cost means of meeting electricity demand in the South Gobi region, taking into account the needs of the Central Energy System (CES)
This presentation sets outour base assumptions on demand growth
the expansion plans considered
our analysis of the costs of these plans and preliminary findings
our estimate of the financing requirements
2

DEMAND –SOUTH GOBI
We expect electricity demand in the South Gobi to rise to around 600MW by 2020
We project that:open-pit operations at Oyu Tolgoi starting in 2012 will have a demand of 200MW, increasing to 300MW by 2016 with expansion and a shift to underground mining -operations
demand from Tavan Tolgoi (ERC) will reach 100MW by 2014
To this, we have addedassumed demand growth of 100MW by 2016 and 200MW by 2018 from additional Tavan Tolgoidevelopments
Demand from townships is subsumed into these projections
3

DEMAND - CES Electricity distributed on the CES grew at an annual average of 3.4% from 1997-2007 and 6.1% from 2002-2007. Peak demand reached 640MW in 2007
Over the period to 2020, we project average electricity demand growth of 3.5% annually
large tariff increases (up to 60%) can be expected to reduce demand growth
ongoing work to improve distribution efficiency can be expected to reduce losses
Heat demand in Ulaanbaatar grew at an annual average of 2.5% from 1997-2007 and 1.7% from 2002-2007
Over the period to 2020 we project average heat demand growth of up to 3% annually
4

SUPPLY ASSUMPTIONS
Current installed capacity on the CES is 774MW. Net available capacity is estimated at 647MW. Up to 255MW of Russian imports are available.
Of the existing power plants, we assume thatTPP#2 will be retired after 2012
TPP#3 will be retired after 2016
We assume that the Newcom wind farm project, of 50MW, will commission by 2010
We also assume that a large hydro generator (most likely Egiin) will be commissioned by 2015. A generator of this type is needed for system balancing purposes
5
CES – SOUTH GOBI INTER-CONNECTION
The Mandalgovi – Tavan Tolgoi transmission line, interconnecting the CES and South Gobi region, is assumed to commission by 2010 and the CES –Mandalgovi line by 2012
This a 640km 220kV double-circuit line. Assumed reliable capacity is around 150MW. Sustained power transfers in excess of this will require new transmission investments
Losses on a line of this length will be significant –up to 15% at full reliable capacity
6

SUPPLY-DEMAND BALANCE
We expect electricity demand to exceed supply by 2012, assuming no new generating capacity is commissioned
This assumes that the full potential Russian import capacity of 255MW is utilised
These assumptions are conservative – they assume a relatively low rate of electricity demand growth on the CES
7

ELECTRICITY BALANCE – CES AND SOUTH GOBI
8
0
500
1000
1500
2000
2500
2007 2008 2009 2010 2011 2012 2013 2014 2015 2016 2017 2018 2019 2020
MW
Imports
Egiin HPP
Oyu Tolgoi TPP
TPP#5
Tavan Tolgoi TPPTPP#4
Erdenet TPP
Darkhan TPP
TPP#3
TPP#2
Newcom
Peak demand
20% reserve margin

INVESTMENT OPTIONS
A number of possible options for new baseloadpower plants exist
TPP#5 at Ulaanbaatar
a new thermal power plant at Oyu Tolgoi
a new minemouth thermal power plant at TavanTolgoi
a new power plant associated with a CTL export project at Baganuur
a new export-oriented thermal power plant at Shivee Ovoo
The last two of these are both dependent on exports, and their development is outside the control of the Government of Mongolia. We do not, therefore, review them further
9

OVERVIEW OF INVESTMENT OPTIONS
TPP#5CHP using coal from Baganuur mine
unit size of 300MW and 700Gcal/hour
investment cost of $1,240/kW
thermal efficiency of 36%
Tavan Tolgoi TPPair-cooled sub-critical coal plant
unit size of 300MW
investment cost of $1,110/kW
thermal efficiency of 33%
Oyu Tolgoi TPPair-cooled sub-critical coal plant
unit size of 150MW
investment cost of $1,500/kW
thermal efficiency of 32%
10

TAVAN TOLGOI COAL COSTS
The 1995 JICA Coal Master Plan estimated the cost of production at Tavan Tolgoi at around US$20/t (at 2008 prices)
Other estimates of production costs provided to us are around US$10-12/t
There is also the potential for a new coal plant to use ‘middlings’ from the coal washing process
the opportunity cost of using middlings for power generation is zero or even negative
the 1995 Master Plan estimated the proportion of middlings in total production at around 9%
on annual production of up to 30Mt, this would represent sufficient coal for 600-750MW of baseload generating capacity
To represent this possible range of costs, we use an assumed coal price of $20/t and a sensitivity of $0/t
11

COMPARING EXPANSION SCENARIOS
We have estimated the present value (at a 10% discount rate) of total generation costs under three alternative expansion scenarios
Scenario 1: Develop TPP#5 and Tavan Tolgoi TPP simultaneously
Scenario 2: Develop Tavan Tolgoi TPP followed by TPP#5
Scenario 3: Develop Oyu Tolgoi TPP followed by TPP#5 and Tavan Tolgoi TOO
Our analysis takes account ofthe need for minimum levels of generation from CHP plants to meet heating demand in the CES
constraints on the transmission of power between the CES and South Gobi region
12

EXPANSION PLANS COMPARED
13
Scenario Entry dates PV costs (@10% discount rate)First plant commissioned
TPP#5 Tavan Tolgoi TPP Oyu Tolgoi TPP
Tavan Tolgoi coal price
Unit 1 Unit 2 Unit 1 Unit 2 Units 1-3 $20/t $0/t1 TPP#5 + Tavan Tolgoi 2012 2018 2012 2014 n/a 2,184 0% 2,029 0%2 Tavan Tolgoi 2013 2018 2012 2012 n/a 2,223 2% 2,050 1%3 Oyu Tolgoi 2013 2018 2015 n/a 2012 2,202 1% 2,150 6%
The least-cost expansion plan is to develop TPP#5 and Tavan Tolgoi TPP together, with the first units commissioning in 2012However, the cost differences between the alternative expansion plans are minor (1-2%)

LEAST-COST EXPANSION PLAN – SCENARIO 1
14
0
500
1000
1500
2000
2500
2007 2008 2009 2010 2011 2012 2013 2014 2015 2016 2017 2018 2019 2020
MW
Imports
Egiin HPP
Oyu Tolgoi TPP
TPP#5
Tavan Tolgoi TPPTPP#4
Erdenet TPP
Darkhan TPP
TPP#3
TPP#2
Newcom
Peak demand
20% reserve margin

LEAST-COST EXPANSION PLAN – SCENARIO 2
15
0
500
1000
1500
2000
2500
2007 2008 2009 2010 2011 2012 2013 2014 2015 2016 2017 2018 2019 2020
MW
Imports
Egiin HPP
Oyu Tolgoi TPP
TPP#5
Tavan Tolgoi TPPTPP#4
Erdenet TPP
Darkhan TPP
TPP#3
TPP#2
Newcom
Peak demand
20% reserve margin
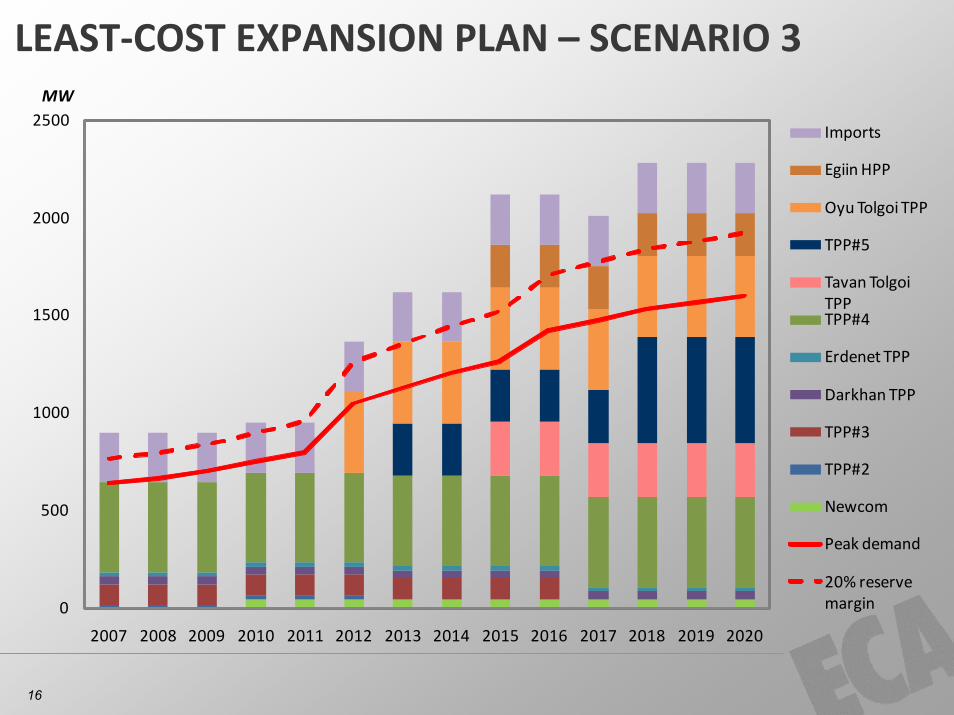
LEAST-COST EXPANSION PLAN – SCENARIO 3
16
0
500
1000
1500
2000
2500
2007 2008 2009 2010 2011 2012 2013 2014 2015 2016 2017 2018 2019 2020
MW
Imports
Egiin HPP
Oyu Tolgoi TPP
TPP#5
Tavan Tolgoi TPPTPP#4
Erdenet TPP
Darkhan TPP
TPP#3
TPP#2
Newcom
Peak demand
20% reserve margin

OTHER CONSIDERA-TIONS
As well as cost, the selection of the appropriate expansion plan needs to consider risks to the plan. Of these, the most important is the risk of delays in plant commissioning
We do not consider there are other significant differences between the alternative expansion plans
all the plans involve the development of generating capacity in both Ulaanbaatar and South Gobi
impacts on air pollution and export potential are therefore similar across the plans
17

STATUS OF PROJECT DEVELOPMENT
TPP#5 a tendering round is underway
there may be delays in evaluating submissions and negotiating final agreements due to the invitation to bidders to propose their own financing and contractual arrangements
Tavan Tolgoi TPPlimited development activities undertaken to date
Oyu Tolgoi TPPthe mine developers (Rio Tinto and Ivanhoe Mines) have completed design work and much of the permitting requirements
estimated time to completion is 30 months
18

ESTIMATING THE COSTS OF DELAY
It is reasonable to assume that Oyu Tolgoi TPP can be commissioned by 2012
There appear to be moderate risks of delays to TPP#5 and significant risks of delays to TavanTolgoi TPP
We have estimated the costs of delays in commissioning to Mongolia, assuming that
the first date that TPP#5 can be commissioned is 2013, and that Tavan Tolgoi TPP can be commissioned is 2014
delays in commissioning power generation capacity result in reduced output from the OyuTolgoi mine
the value of Oyu Tolgoi’s production to Mongolia is $0.525/lb of copper (assuming a copper price of $1.5/lb with 35% royalties and taxation)
this is equivalent to $380/MWh of unmet demand
19

COSTS OF DELAY
20
It is clear that delays would greatly increase the costs of scenarios 1 and 2The cost of the resulting unserved energy outweighs the minor savings relative to scenario 3
Scenario Entry dates (with delay) PV costs (@10% discount rate)First plant commissioned
TPP#5 Tavan Tolgoi TPP Oyu Tolgoi TPP
Assumes Tavan Tolgoi coal price of $20/t
Unit 1 Unit 2 Unit 1 Unit 2 Units 1-3 With no delay With delay1 TPP#5 + Tavan Tolgoi 2013 2018 2014 2014 n/a 2,184 0% 2,734 25%2 Tavan Tolgoi 2013 2018 2014 2014 n/a 2,223 2% 2,734 25%3 Oyu Tolgoi 2013 2018 2015 n/a 2012 2,202 1% 2,202 1%

POSSIBLE EXPANSION PLAN
These preliminary findings suggest scenario 3 should be adopted
Newcom is commissioned in 2010
Oyu Tolgoi TPP is commissioned in 2012
TPP#5 Unit 1 is commissioned in 2013 and Unit 2 in 2018
Tavan Tolgoi Unit 1 is commissioned in 2015
Egiin HPP is commissioned in 2015
Although this plan is slightly higher-cost than scenario 1, it is considerably less risky
under scenarios 1 and 2 any delay in commissioning either TPP#5 or Tavan Tolgoi TPP beyond 2012 would result in high costs to Mongolia
the risks of such delays appear high, given the current status of development of these two projects
21

FINANCING REQUIREMENTS
Annual investment needs under the Scenario 3 expansion plan average $500m from 2009-11, of which $250m would be financed by Ivanhoe / Rio Tinto and Newcom
Annual investment needs from 2012-17 average $225m
This excludes transmission and distribution investments, other than the CES – Tavan Tolgoiinterconnector
22
0
100
200
300
400
500
600
700
2009 2010 2011 2012 2013 2014 2015 2016 2017 2018 2019 2020
$m
Transmission
HOB
Egiin HPP
TPP#5
Tavan Tolgoi TPP
Oyu Tolgoi TPP
Newcom

PROCUREMENT OF NEW CAPACITY
Financing the required generating capacity within the necessary timescale is unlikely to be possible, except on a BOT basis
Best practice needs to be followed to minimisethe lead-times required to procure new capacity as BOTs
TPP#5 will need to commission within 4-5 years
Tavan Tolgoi TPP will need to commission within 6 years
This is discussed in the next session
23