power sector reform and corruption: evidence from … power sector reform and corruption: evidence...
TRANSCRIPT

www.eprg.group.cam.ac.uk
Power Sector Reform and Corruption:
Evidence from Sub-Saharan Africa
EPRG Working Paper 1801
Cambridge Working Paper in Economics 1801
Mahmud I. Imam, Tooraj Jamasb, and Manuel Llorca
In order to reduce the influence of corruption on electricity sector performance, most Sub-
Saharan African countries have implemented sector reforms. However, after nearly two and
half decades of reforms, there is no evidence whether these reforms have mitigated or
exacerbated corruption. Neither is there evidence of performance improvements of reforms in
terms of technical, economic or welfare impact. This paper aims to fill this gap. We use a
dynamic panel estimator with a novel panel data set of 47 Sub-Saharan African countries from
2002 to 2013. We analyse the impact of corruption and two key aspects of electricity reform
model – creations of independent regulatory agencies and private sector participation – on
three performance indicators: technical efficiency, access to electricity and income. We find
that corruption can significantly reduce technical efficiency of the sector and constrain the
efforts to increase access to electricity and national income. However, these adverse effects are
reduced where independent regulatory agencies are established and privatisation is
implemented. Our results suggest that well-designed reforms not only boost economic
performance of the sector directly, but also indirectly reduce the negative effects of macro level
institutional deficiencies such as corruption on micro and macro indicators of performance.
Keywords Panel data, dynamic GMM, electricity sector reform, corruption, Sub-
Saharan Africa.
JEL Classification Q48, D02, K23, D73
Contact [email protected] Publication January 2018

1
POWER SECTOR REFORM AND CORRUPTION:
EVIDENCE FROM SUB-SAHARAN AFRICA
Mahmud I. Imam*
Tooraj Jamasb
Manuel Llorca
Durham University Business School, Durham University, UK
2 January 2018
Abstract
In order to reduce the influence of corruption on electricity sector performance, most
Sub-Saharan African countries have implemented sector reforms. However, after
nearly two and half decades of reforms, there is no evidence whether these reforms
have mitigated or exacerbated corruption. Neither is there evidence of performance
improvements of reforms in terms of technical, economic or welfare impact. This
paper aims to fill this gap. We use a dynamic panel estimator with a novel panel data
set of 47 Sub-Saharan African countries from 2002 to 2013. We analyse the impact of
corruption and two key aspects of electricity reform model – creations of independent
regulatory agencies and private sector participation – on three performance indicators:
technical efficiency, access to electricity and income. We find that corruption can
significantly reduce technical efficiency of the sector and constrain the efforts to
increase access to electricity and national income. However, these adverse effects are
reduced where independent regulatory agencies are established and privatisation is
implemented. Our results suggest that well-designed reforms not only boost economic
performance of the sector directly, but also indirectly reduce the negative effects of
macro level institutional deficiencies such as corruption on micro and macro indicators
of performance.
Keywords: Panel data, dynamic GMM, electricity sector reform, corruption, Sub-
Saharan Africa
JEL classification: Q48, D02, K23, D73
* Corresponding author: Durham University Business School, Mill Hill Lane, Durham, DH1 3LB, United
Kingdom. Tel. +44 (0) 74 69627145. Email: [email protected].

2
1. Introduction
Over the past two decades, a body of literature has emerged that establishes the various
transmission channels through which corruption can constrain economic development. For
example, corruption when defined as the “abuse of entrusted power for private gain”1 is
found to have corrosive effects on economic development through increasing transaction
costs and uncertainty (Murphy et al., 1991), inefficient investments (Mauro, 1995; Shleifer
and Vishny, 1993), reduced human capital development (Reinikka and Svensson, 2005) and
misallocation of resources (Rose-Ackerman, 1999).
Recently, attention has shifted to another important but less explored micro-level channel, i.e.
the operation and regulation of electricity systems particularly in developing countries
(Wren-Lewis, 2015; Estache et al., 2009; Dal Bó, 2006; Bergara et al., 1998). The
preponderance of evidence from this strand of literature suggests that, corruption can cripple
economic development by inhibiting the performance of the electricity sector. For instance,
corruption reduces labour productivity (Wren-Lewis, 2015; Dal Bó, 2006), increases
transmission and distribution losses and constrains the efforts to increase access to electricity
services (see Estache et al., 2009).
The impacts of corruption on electricity sector performance is particularly relevant in the
Sub-Saharan Africa (SSA) context, where welfare improvements can intuitively be linked to
corruption (Gyimah-Brempong and Camacho, 2006), which appears to be widespread.
Despite the obvious difficulties of measuring corruption, the Corruption Perception Index
(CPI) produced by Transparency International (TI, 2013) shows that, eight out of the twenty
most corrupt countries in the world were SSA countries, and the only region with more than
two countries in this group. Thus, in weak institutional environments, major undertakings
such as the construction of large hydroelectric dams, government intervention in the
operations of utilities, monopolistic characteristics of the sector, absence of competition and
the substantial revenues from the sales of electricity can attract and make the sector
vulnerable to corruption (Bosshard, 2005; World Bank, 2009; Reinikka and Svensson, 2005).
The above factors could be partly blamed for turning the electricity sectors in SSA countries
into sources of corruption and cronyism (Patterson, 1999) and the concentration of electricity
services to urban areas whilst rural areas remained unconnected or underserved (Byrne and
Mun, 2003). This is referred to as ‘electricity poverty’ and is widespread in the region.2 In
order to improve efficiency and reduce corruption, many SSA countries implemented some
form of Electricity Sector Reforms (ESR) (Eberhard et al., 2016). The reforms, also referred
to as ‘standard electricity sector reform model’ and often prescribed to developing countries
by multilateral development organisations, were first implemented in OECD countries such
as Chile, Norway and the UK in the 1980s and 1990s.
1 See Kaufmann and Siegelbaum (1997) for discussions on this definition.
2According to IEA (2014), the majority of the estimated 500 million people that lack access to clean and
affordable electricity in the region are poor and rely on traditional biomass – wood, agriculture residues and
dung – for cooking and heating.
3
The experiences of these pioneer countries supported the notion that effective implementation
of ESRs would not only enhance technical efficiency of the sector, but would also translate
the efficiency gains into social welfare and economic growth (Sen et al., 2016). Moreover,
according to the World Bank (2000), as part of wider economic liberalisation, deregulation
and de-monopolisation policies, ESR policies were further underpinned by anticorruption
agendas. Thus, reformers not only promised improved efficiency and wider access to reliable
and affordable services, they also promised to reduce corruption in the sector (Estache et al.,
2009) and the wider economy (World Bank, 2000).
Despite the anticipated positive outcomes from implementation of the ESRs, there are
widespread perceptions that reforms have hurt the poor through increased tariffs, stronger
enforcement of bills collection (Scott and Seth, 2013) and unemployment, while benefitting
the powerful and wealthy notably through corruption (Auriol and Blanc, 2009). As a result,
the reforms often lacked social legitimacy, and this usually manifests through increases in
electricity theft and vandalism (Williams and Ghanadan, 2006). Moreover, as Estache et al.
(2009) have noted, large numbers of people believe that corruption remains a problem in the
sector. However, despite the anecdotes that connect corruption to sector performance after the
reform efforts, there is a lack of empirical evidence on whether the electricity sector reforms
implemented in SSA region have mitigated or indeed exacerbated the effect of corruption in
the electricity sector.
Previous empirical studies have shown the relevance of corruption as a driver of ESR in
developing countries, but they either focus on labour efficiency in electricity distribution
firms (e.g., Wren-Lewis, 2015; Dal Bó and Rossi, 2007) or on different sectors (e.g., Estache
et al., 2009). Moreover, the former two studies focused on Latin American countries while
the latter study also includes countries from different developing regions of the world.
Therefore, to our knowledge, this is the first empirical study to assess the electricity reforms
in SSA countries and among the few studies that examine the interactions between country
level institutions and micro-level electricity reform steps (e.g., Wren-Lewis, 2015; Estache et
al., 2009). Most studies of this strand of literature tend to focus on specific aspects of the
textbook reform model or on specific countries without explicitly accounting for the role of
institutions apart from those earlier mentioned.
The paper addresses the deficit in the literature and contributes to better understanding the
institutional aspect of electricity reforms (e.g., Dorman, 2014; Chang and Berdiev, 2011;
Nepal and Jamasb, 2012a; Cubbin and Stern, 2006; Erdogdu, 2013) and the political
economy literature of regulatory agencies (e.g., Pitlik, 2007; Potrafle, 2010; Scott and Seth,
2013). The paper also indirectly contributes to the literature on obsolescing bargaining
(Vernon, 1971) since political corruption entails government commitment to honour the
terms of electricity reforms and particularly the privatisation of state assets, could be doubtful.
Thus, the findings would give further insights into why investments in the SSA electricity
markets tend to be more concentrated in the generation segment than in the distribution
utilities since the former is more vulnerable to corruption.
4
The remainder of this paper is organised as follows. Section 2 reviews the nearly three
decades of ESR implementations in SSA countries and discusses how each of the key steps of
the reform model may mitigate the adverse effects of corruption on the performance of the
electricity reforms. Section 3 presents three research hypotheses related to key performance
aspects of the reforms to be tested. Section 4 presents the empirical methodology and the data
used in the study. Section 5 presents and discusses the results. Section 6 concludes the paper.
2. Electricity Sector Reforms in Sub-Saharan Africa
Historically, the generation, supply and marketing of electricity in most SSA countries, as in
many other countries in the world, were dominated by vertically integrated state-owned
utilities (Clark et al., 2005). These arrangements were partly due to factors regarded as
primary functions of the state, such as, the high fixed costs of large plants, the desire of
governments to enhance welfare, national security concerns, social equity objectives (World
Bank, 1993) and ideological reasons (Erdogdu, 2013). The state-ownership of utilities were
further reinforced by the idea that permitting more than one firm to provide electricity would
rather rise, than reduce, costs which resulted in historically higher investments by the state in
public utilities relative to private investments (USAID, 2005). However, the 1980s and 1990s
saw SSA countries, similar to other developing countries, becoming increasingly unable to
sustain their investments in the sector. Decades of government investments had not produced
the anticipated increase in performance, as services remained largely concentrated to urban
areas, nor were there improvements in quality and reliability of services.
At the same time, macroeconomic conditions external to the sector, such as, the deteriorating
international business climate, fiscal constraints faced by governments, structural adjustment
programmes, which later became part of lending conditions of the IMF and World Bank
(Jamasb, 2006) compelled SSA countries to undertake structural and institutional reforms of
their electricity sectors. Moreover, many of the arguments that supported state ownership of
electricity utilities disappeared by the 1980s as the economies of scale associated with
vertically integrated electricity utilities had exhausted (Joskow, 2006; Gilbert et al., 1996),
therefore state-ownership of the sector came to be seen as a major hindrance for the
introduction of new technologies developed mostly by the private sector (Downing et al.,
2006). The reform efforts in SSA were triggered by investment shortage and concerns that
monopolisation of electricity generation and supply activities by state-owned utilities were
wasteful and inefficient (Victor, 2005).
The first electricity sector reform was first introduced in Chile, which later spread to other
OECD countries such as, Norway and United Kingdom. From the experiences of these
countries, emerged the theory and practice of the ‘standard textbook reform model’ that later
became widely prescribed to developing countries by the IMF and World Bank. It was
believed that reforms would reduce the dominance of the state in the sector through creation
of Independent Regulatory Agencies (IRAs) and private sector participation in electricity
markets (Jamasb et al., 2016). The expected outcome of these efforts are the enhancements of
5
economic and technical efficiency of utilities and the transfer of the efficiency gains to
consumers in the form improved access to affordable and reliable electricity services (Nepal
and Jamasb, 2012b; Estache et al., 2009).
The standard reform model advocated for the unbundling of state-owned electricity utilities
vertically (generation, transmission, distribution and retailing) and horizontally (generation
and retailing). The unbundled parts amenable to competition would then be sold to the private
sector and an IRA created by the state would then supervise and regulate the monopoly-prone
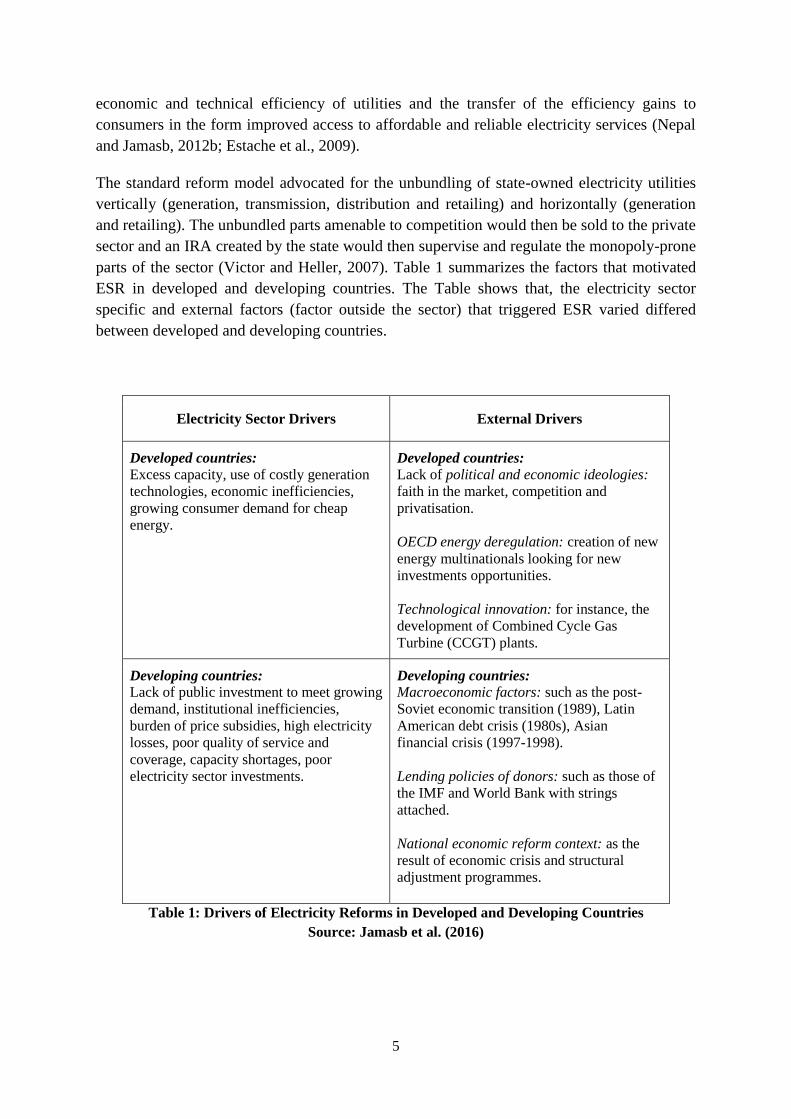
parts of the sector (Victor and Heller, 2007). Table 1 summarizes the factors that motivated
ESR in developed and developing countries. The Table shows that, the electricity sector
specific and external factors (factor outside the sector) that triggered ESR varied differed
between developed and developing countries.
Electricity Sector Drivers External Drivers
Developed countries: Excess capacity, use of costly generation
technologies, economic inefficiencies,
growing consumer demand for cheap
energy.
Developed countries: Lack of political and economic ideologies:
faith in the market, competition and
privatisation.
OECD energy deregulation: creation of new
energy multinationals looking for new
investments opportunities.
Technological innovation: for instance, the
development of Combined Cycle Gas
Turbine (CCGT) plants.
Developing countries: Lack of public investment to meet growing
demand, institutional inefficiencies,
burden of price subsidies, high electricity
losses, poor quality of service and
coverage, capacity shortages, poor
electricity sector investments.
Developing countries: Macroeconomic factors: such as the post-
Soviet economic transition (1989), Latin
American debt crisis (1980s), Asian
financial crisis (1997-1998).
Lending policies of donors: such as those of
the IMF and World Bank with strings
attached.
National economic reform context: as the
result of economic crisis and structural
adjustment programmes.
Table 1: Drivers of Electricity Reforms in Developed and Developing Countries
Source: Jamasb et al. (2016)

6
However, as pointed out in Nepal (2013), the extent and outcome of electricity reforms have
differed between developed and developing countries. The reforms in developed countries
were undertaken in the context of excess capacity and relatively stable institutions aimed at
improving economic and financial performance of technically reliable systems, encourage
interregional trade, transfer investment risks to the private sector, offer consumers alternative
choices, and reduce overinvestment in the sector (Jamasb et al., 2014; Erdogdu, 2013).
Conversely, ESR in the developing countries were implemented within a context of poor
technical and financial performances of state-owned electricity utilities, weak institutional
setting, the inabilities of both utilities and governments to mobilise sufficient investments to
expand electricity services, low tariffs and poor service quality (Jamasb et al., 2005).
However, the appropriateness of the standard ESR model for developing countries has been
questioned as its implementations usually resulted in higher prices, loss of employment,
unreliable services, and concentration of services to profitable areas since the private firms
did not have incentives to extend the service to poor areas (Transnational Institute, 2002;
Victor, 2005). Thus, in the unprofitable segments of the market there has been almost total
absence of service provision (Auriol and Picard, 2006). The poor access rates in SSA relative
to other developing regions may be partly attributed to this lack of incentives. For example,
although between 2000 and 2014, there was some progress in increasing access to electricity
in all developing regions of the world; electricity access deficit is overwhelmingly
concentrated in SSA region, as progress has fallen consistently short of population growth.
The poor outcomes have led the reform critics to argue that since costly electricity
infrastructures needed to extend services to rural and poor areas are considered risky and
unprofitable by the private sector, the state should undertake such investments since it enjoys
a monopoly on capital and investments (Victor, 2005).
Moreover, the experiences of ESR around the world have shown the difficulty of creating an
economically efficient electricity sector underpinned by genuine competitive markets that
show significant potentials to benefit consumers through reliable service, low tariffs, and
choice of alternative sources (IEA, 2014). As a result, the reform experience in SSA countries
has lagged behind the anticipated outcomes of the standard reform model and thus has led to
extensive political backlash against reforms. Higher electricity prices have been an obvious
source of political resistance in many countries, especially for groups that have become
accustomed to paying near nothing for electricity services (Victor, 2005) and this resistance
was further reinforced by the awareness that elections can be won or lost because of
electricity prices (UNDP and World Bank, 2005).
However, despite the difficulties of ESR in developing countries, they have not deterred SSA
countries from implementing some aspects of the textbook reform model. Twenty four
countries in the region have enacted ESR law, three-quarter have attracted private
participation, nearly all have corporatized their electricity utilities, two-thirds have set-up
regulatory bodies, and more than a third have Independent Power Producers (IPPs) in place
(Eberhard et al., 2016). Table 2 summarises the reform efforts in some SSA countries.
7
No ESR
Initiated
Vertically
integrated
w. priv.*
Vertically
integrated
w. IRA only
Vertically
integrated w.
IRA and priv.
Unbundled w.
IRA and priv.
Unbundled
w. IRA only
Benin
Burundi
Central
African Rep.
Djibouti
Equatorial
Guinea
Eritrea
Somalia
Seychelles
Congo Dem.
Rep.
Guinea
Botswana
Chad
Madagascar
Mauritius
Liberia
Guinea
Bissau
Comoros
Congo, Rep
Mauritania Angola
Burkina Faso
Cape Verde
Cameroon
Cote d'Ivoire
Ethiopia
Gabon
Gambia
Malawi
Mali
Mozambique
Namibia
Lesotho
Rwanda
Sao Tome and
Principe
Senegal
South Africa
Tanzania
Togo
Zambia
Ghana
Kenya**
Nigeria
Uganda
Zimbabwe**
Sudan
Niger
Swaziland
*All forms of private participation excluding management contracts, lease contracts and concession.
**Kenya and Zimbabwe have only undertaken partial unbundling unlike the other three countries that
have fully unbundled.
Table 2: Implementations of Electricity Sector Reforms in SSA countries
Sources: Eberhard et al. (2016) and World Bank Infrastructure Database (2017)
3. The Literature on Corruption and Reform
As argued by the World Bank (2000), electricity sector reforms have the potential not only to
improve technical efficiency of the sector but also to reduce the corruption associated with
state-ownership. This section reviews the relevant literature on how each key aspect of the
reforms can mitigate the adverse effects of corruption.
3.1. Corruption and Corporatization/Commercialization
The most pervasive aspect of the reform model implemented in SSA was the transformations
of incumbent state-owned utilities into separate legal entities through corporatization or
commercialization.3
Although, the corporatized utilities were distinct from government
ministries or energy departments, they are however, treated as a commercial enterprise and
thus, expected to pay interest and taxes, and earn commercially competitive rates of return on
equity capital. They can also plan and execute budgets, and initiate and implement borrowing
procurement and employment conditions (Kapika and Eberhard, 2013).
3 See Appendix A for the types, names of projects and status of management contracts in some SSA countries.
8
Although independent and incorporated under the same laws governing private corporations,
the state retains ownership of corporatized utilities and in some cases runs them through
appointed independent board of directors. However, in countries such as Cameroon, Côte
d’Ivoire, Tanzania, Namibia, Madagascar and Ghana their business decisions were contracted
out to private managers4 (Ghanadan and Eberhard, 2007). Whether managed by an appointed
board of directors or private contractors, corporatizations of utilities were mainly aimed at
reducing the inefficiencies induced by government interference in the operations of utilities,
facilitate the entry of private capital and move utilities toward cost-recovery in pricing
through improved metering, billing and collection (Eberhard and Gratwick, 2011).
Corporatized utilities have achieved modest performance improvements especially those
operated by management contractors. In Tanzania, a management contractor used a poverty
tariff for consumers using 50 kilowatt hour (kWh) a month or less and nearly doubled the
revenues of the corporatized utility (TANESCO) by reducing costs by 30%, rising collection
rates from 67 to 93%, reducing system energy losses by 5%, and connecting 30,000 new
customers (Ghanadan and Eberhard, 2007). Similarly, a management contractor in Namibia
between 1996 and 2002 succeeded in doubling the electricity consumers, and increasing
labour productivity without laying-off employees (Clark et al., 2005).
These positive outcomes and others such as improvements in bills collections and reductions
in system losses in almost all SSA with management contractors, made international aid
agencies such as the IMF and World Bank involved in almost all management contracts, to
regard them as a first step towards comprehensive reforms of the sector. However,
contracting out operations of utilities to the private sector has proved to be complex and
contentious in some countries of the region. For example, most governments were unwilling
to honour their financial obligations needed to expand capacities, reject tariff hikes (e.g., in
Senegal), unwilling to compel other government agencies to pay their bills, forbidding
utilities from reducing the size of the workforce or disconnecting delinquent consumers
(Nellis, 2005).
Other stakeholders removed from management positions, and the thousands of employees
laid off criticised such contracts especially where large contract fees were paid to
management contractors (e.g., Tanzania and aid agencies paid for the 56 months’ contract
period, $8.5 million in fixed fees and $8.9 million in performance based fees) (Eberhard and
Gratwick, 2011). The large payouts were further argued not to be in commensurate with the
modest improvements in finances of utilities and this helped galvanised political backlash
against management contracts in the region. Moreover, it was argued that, many regulators
failed to capture the benefits from the efficiency gains and competition produced by
management contractors (Nellis, 2005). As a result, management contracts were viewed by
policymakers in SSA as unsustainable, thus 16 of management contracts engaged in the
region, 4 were cancelled before their expiration dates, 12 were allowed to expire after their
initial terms, and only in Liberia and Lesotho there are management contracts currently
4
Some SSA countries contracted out the operation and management of their corporatized utilities to
management contractors.

9
active. According to Eberhard and Gratwick (2011), of all the countries with management
contracts, only those engaged in Gabon and Mali have led to further reforms.
The eventual disengagement of management contractors from most SSA countries shows that
state-owned utilities managed by government appointees are once again becoming the most
dominant players in the sector. Under state-ownership, there are temptations on part of some
governments to force utilities to charge electricity prices below the costs of generation and
supply, dictate the choice of plants locations or mandate utilities to purchase their primary
energy from state-owned national energy (e.g., oil and gas) companies (Nellis, 2005) even
while lower cost alternatives exist. Thus, it became increasing difficult to insulate
corporatized utilities from corruption usually associated with state ownership of utilities,
which has been one of the key motivators of the reforms in the region.
3.2. Corruption, Unbundling and Competition
In order to target the sources of inefficiency such as corruption and reduce their performance
impacts, reformers advocated for the introduction of competitive electricity markets after the
sector has been unbundled both vertically and horizontally. Thus, irrespective of ownership
status, reformers anticipate that competition between the unbundled segments and among
generating plants offer a reliable mechanism to reduce network energy losses and induce full
capacity usage. These efficiency gains are then expected to increase access rates, while at the
same time reducing the cost of service to pre-existing consumers (Zhang et al., 2008). More
importantly, the unbundling and the subsequent competition entails consumers to have more
freedom of choice compared to when services were provided by a state-owned monopolist
with incentives to withhold capacity or determine areas to concentrate services. This freedom
of choice therefore means consumers can escape from corruption hitherto associated with
government ownership of utilities.
Although, countries such as Ghana, Zambia, South Africa, Tanzania and Zimbabwe have
indicated their intention to introduce market competition, this has not materialised. As a
result, only Nigeria has taken steps towards wholesale competition after unbundling and
privatising its generation and distribution segments (Gratwick et al., 2006).5 Although, the
lack of competition in electricity markets of SSA countries can partly be linked to the
difficulties of reforming small systems, the absence of private participation in countries such
as Sudan,6 indicates that governance issues are still at the core of the electricity reform efforts
in many countries.
Despite the governance enhancing virtues of competition, experience reveals the difficulties
of creating genuine competitive electricity markets even in developed countries which are
usually associated with strong institutions. In Britain, the 15 electricity utilities that emerged
from the reforms of the 1990s re-integrated and consolidated to just six utilities after 5 years.
This has led to the perception that the utilities tacitly collude to charge consumers higher
5 Nigeria established a Transitional Electricity Market (TEM) on February 1, 2015.
6 Sudan has successfully unbundled its electricity market both vertically and horizontally, and has also
established an IRA.
10
prices (Lewis, 2014). Similarly, the idea that the market would discipline competing
electricity firms and thereby benefit consumers was tested by the California power crisis.
Byrne and Mun (2003) reported that various participants in California electricity market
succeeded in gaming the system to maximise short-term profits by creating artificial scarcity
through adjusting their bidding strategies. Therefore, rather than to lower prices, the day-
ahead, hour-ahead, and real-electricity markets actually led to increases in prices.
In the SSA context, the emergence of hybrid electricity markets and the absence of robust
anti-competitive laws may explain the absence of competitive electricity markets apart from
the TEM in Nigeria and the predominance of private sector participation largely in the form
of IPPs. This is because implementation of retail or wholesale competitive markets requires
sophisticated institutional and financial infrastructures, which are inadequate in SSA
(Eberhard et al., 2016). In order to mitigate investment risk in weak institutional
environments, private sector participants such as IPPs usually enter into power purchase
agreements with the incumbent off-takers by requiring measures such as government
guarantees, and the inclusion of international arbitration clauses.
3.3. Corruption and Private Sector Participation
In order to attract investments reformers advocated total privatisation of state-owned utilities
to complement other forms of private sector participation. The withdrawal of the state from
the sector would not only attract the needed extra private sector investments, but would also
reduce the burden of subsidies on the government to cover finance overruns of state-owned
utilities. Therefore, privatisation has the potential to reduce political interference or
bureaucratic rigidities in the operations and management of utilities since control rights over
these factors would no longer be under the direct control of politicians or civil servants.
This suggests that privatisation can improve electricity sector governance through changing
the incentive structure in the sector. For example, since the new owners of privatised utilities
are now the residual claimants of revenue generated by service provision, it would incentivise
them to close all types of inefficiencies including those related to corruption (Olson, 2000).
This differs considerably from when services were provided by the previously state-owned
utilities without clear residual claimants, and thus no incentives to reduce inefficiencies
especially those related to corruption. This argument was highlighted by the theoretical works
of Shapiro and Willig (1990), Shleifer and Vishny (1993) and Boycko et al. (1996) who
argued that privatisation makes it difficult for corrupt politicians and bureaucrats to control
rents produced by privatised utilities. In other words, privatised firms become more
productive and profitable relative to state-owned by closing the sources of inefficiencies
including those related to government corruption.
Despite the increase in private sector participation after the financial crisis of 2008 in SSA
electricity markets (Figure 1), there remains a funding gap for connecting the estimated 500
million people without access to electricity services in the SSA region (IEA, 2014). The
African Development Bank (ADB, 2010) notes that social welfare improvements and
productivity in the region, continues to be constrained by the inadequate generation capacity,
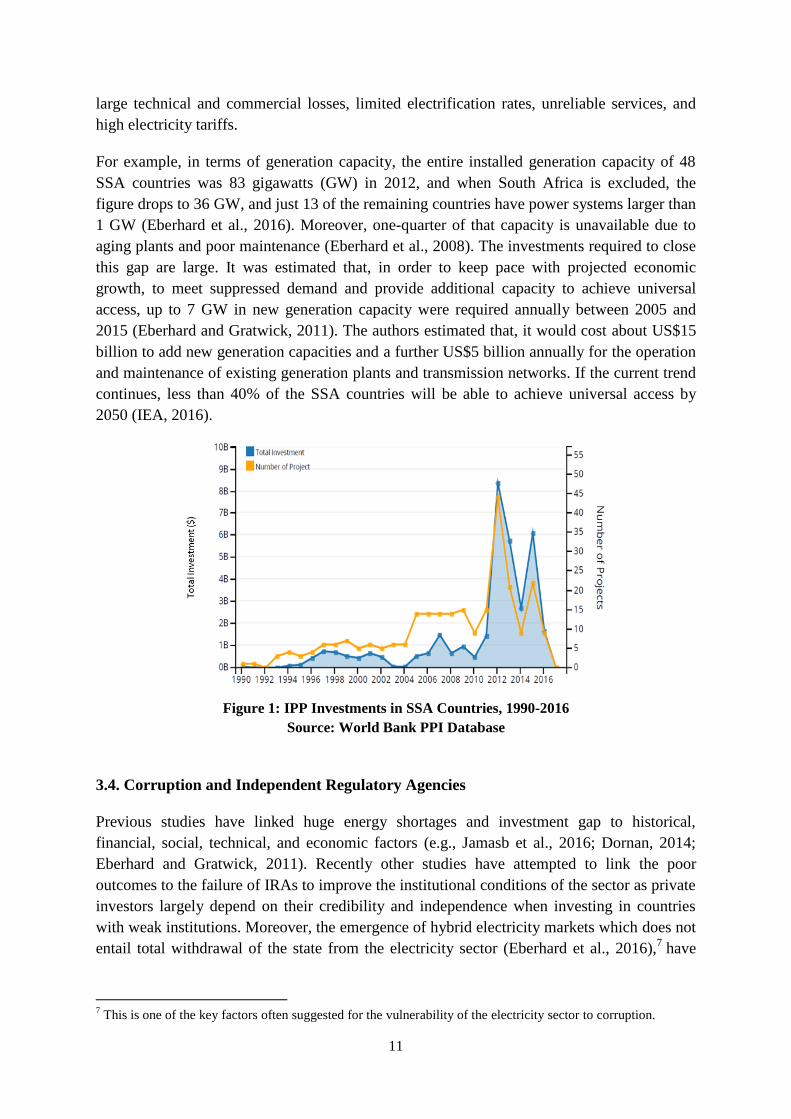
11
large technical and commercial losses, limited electrification rates, unreliable services, and
high electricity tariffs.
For example, in terms of generation capacity, the entire installed generation capacity of 48
SSA countries was 83 gigawatts (GW) in 2012, and when South Africa is excluded, the
figure drops to 36 GW, and just 13 of the remaining countries have power systems larger than
1 GW (Eberhard et al., 2016). Moreover, one-quarter of that capacity is unavailable due to
aging plants and poor maintenance (Eberhard et al., 2008). The investments required to close
this gap are large. It was estimated that, in order to keep pace with projected economic
growth, to meet suppressed demand and provide additional capacity to achieve universal
access, up to 7 GW in new generation capacity were required annually between 2005 and
2015 (Eberhard and Gratwick, 2011). The authors estimated that, it would cost about US$15
billion to add new generation capacities and a further US$5 billion annually for the operation
and maintenance of existing generation plants and transmission networks. If the current trend
continues, less than 40% of the SSA countries will be able to achieve universal access by
2050 (IEA, 2016).
Figure 1: IPP Investments in SSA Countries, 1990-2016
Source: World Bank PPI Database
3.4. Corruption and Independent Regulatory Agencies
Previous studies have linked huge energy shortages and investment gap to historical,
financial, social, technical, and economic factors (e.g., Jamasb et al., 2016; Dornan, 2014;
Eberhard and Gratwick, 2011). Recently other studies have attempted to link the poor
outcomes to the failure of IRAs to improve the institutional conditions of the sector as private
investors largely depend on their credibility and independence when investing in countries
with weak institutions. Moreover, the emergence of hybrid electricity markets which does not
entail total withdrawal of the state from the electricity sector (Eberhard et al., 2016),7 have
7 This is one of the key factors often suggested for the vulnerability of the electricity sector to corruption.

12
made the IRAs to struggle to balance the interests of private utilities and the dominant state-
owned utilities.
Thus, in the context of weak institutional environments such as those of SSA countries,
political expediency tied to the state-owned utilities tends to undermine the independence of
the IRAs (Eberhard, 2007). For example, in some SSA countries where IRAs have attempted
to exert their independence there has been a high turnover among the board members and
management (Kapika and Eberhard, 2013). As a result, the regulatory frameworks in these
countries are often viewed as compromised. This in turn leads many consumers to assume
that the utilities are in collusion with the IRAs and make excessive profits since the
regulatory framework has become prone to political capture or a tool for corrupt government
officials (Stiglitz, 1998).
Moreover, despite the importance of IRAs in providing right institutional environment for
investors to thrive and give consumers the necessary protection, the reform efforts in the
region shows that not all countries have set up IRAs. For example, according to Eberhard et
al. (2016) as of 2014, only 26 of the SSA countries have set up IRAs, while in the remaining
countries, energy ministries or departments have assumed regulatory responsibilities with the
aim of achieving specific social and economic objectives. Thus, in this later group of
countries, governments have full regulatory discretion in determining monitoring and
enforcing maximum tariffs and minimum service standards.
Some have argued that self-regulation usually allows corruption to be pervasive in the
operations of utilities as most positions in IRAs are usually staffed with friends, family, or
political and financial allies of politicians (Estache and Wren-Lewis, 2010). Similarly, even
in countries that have set up independent regulatory agencies, it has often been difficult for
these new bodies to escape from political interference and pressure and various forms of
corruption (Spiller, 1990).8
The preceding paragraphs suggest that the strategic nature of electricity to the economies of
SSA countries implies that the wider fragmented socio-political and economic environments
may largely influence guidelines on electricity generation, and transmission and distribution.
Thus, in such weak institutional environments, the efficient operation of electricity networks
could be influenced by the private agendas of regulators/government energy departments or
government corruption. Despite these links between weak institutions and performance of the
utilities, the issue of how corruption and weak governance might influence the electricity
sector performance post reforms in SSA has been neglected in both the electricity sector
reforms literature and the current policy approaches pursued by SSA governments. In order to
fill this gap, we analyse whether the implementations of ESR have offset or exacerbated the
negative influence of corruption on performance.
8 Only 26 of a total of 47 SSA countries included in our study have established independent energy regulatory
agencies.
13
3.5. Hypotheses
As noted in the introduction section, the main objective of ESR in SSA countries was to
improve technical efficiency and translating this gain into increase access rates and keep up
with the projected economic growth. In order to develop a set of hypotheses to test whether
these objectives have been achieved, we rely on the literature on corruption in regulated
sectors that on how a well-designed regulatory framework may insulate firms from corruption
(e.g., Levy and Spiller, 1994; Laffont and Tirole, 1986; Estache and Wren-Lewis, 2009).
We are further guided by the economic development literature that shows how economic
performance could be affected indirectly through the impact of corruption on private
investment (e.g., Wei, 2000). Thus, we draw on these varied set of literature to identify three
potential indicators of electricity sector performance to assess the corruption reducing
potentials of ESR policies. The variables in included in our dataset are placed into three
categories each reflecting three different dimensions of performance – i.e. technical
efficiency, access rates and economic performance. The first hypothesis focuses on the
technical efficiency of electricity sector proxy by Transmission and Distribution (T&D)
losses per capita, and expressed as follows:
H1: Electricity sector reforms in SSA countries, by offsetting or overcoming the
adverse effects of corruption, have improved technical efficiency.
Theoretically, T&D energy losses is a suitable proxy for the technical efficiency of the sector
because the higher these losses, the higher the probability that firms are not only undertaking
needed investments to upgrade and maintain supply networks, but it would also indicate firms
having operational challenges. More importantly, vandalism, illegal connections and bribes to
utilities’ workers to avoid full payment of electricity bills would also contribute to higher
losses as utilities become constrained financially to undertake further investments. These
factors all combine and adversely affect the overall sustainability and productivity of the
electricity sector. Therefore, we expect the reforms to enhance investor confidence to
undertake further investments, improve their operations and close all sources of inefficiencies
thereby leading to efficiency gains.
We extend the assessment of impacts of ESR and corruption beyond the sector since one
motivation of the reforms in SSA countries was to expand affordable and reliable electricity
services to the un-electrified majority. Therefore, our second hypothesis traces the impacts of
reforms beyond the sector to analyse the impact of reforms on access to electricity services.
Previous research has suggested how corruption and clientelistic practices (e.g., Min, 2010)
can undermine government efforts to extend electricity services to the poor. Therefore, we
expect the loosening of the ties between the government and utilities, through the creations of
IRAs and privatization, to reduce corruption usually related to direct government operations
and regulation of utilities. Moreover, we expect technical efficiency gains from ESR to
translate into expansion of electricity to those who lack access to the service. Thus, our
second hypothesis is as follows:
14
H2: implementation of ESR by reducing the negative association between corruption
and technical efficiency has increased access rates in SSA countries.
According to the International Energy Agency (IEA, 2014), ESR implementations will boost
the economic performance of SSA region by 30% in 2040, not only through new private
sector investments but also through governance improvements inside and outside the energy
sector. Moreover, World Bank (2000) notes that ESR as part of wider economic liberalisation
policies has further anticorruption potentials to reduce the negative association between
corruption and economic performance. Therefore, due to the positive association between the
economy and electricity use on the one hand, and the negative association between corruption
and economic performance, we expect the reforms to boost income levels in two ways. We
extend the performance impacts of corruption and ESR, to the wider economy and thus
postulate that:
H3: implementations ESR policies in SSA countries have enhanced economic
performance of SSA countries by reducing negative association between corruption
and economic growth.
4. Methodology and Data
4.1. Electricity Sector Performance Equation
The setup and analysis of the performance equation is influenced by the awareness that ESR
in developing countries, as in other sectoral reforms, is not an isolated undertaking but is
closely interlinked with the legal and institutional environments of reforming countries.
Therefore, in its simplest form, we postulate that electricity sector performance (Y) depends
not only on the vector of reform policies (REF) implemented by SSA countries but also on
corruption (cor) which measures the institutional quality of the countries, and a set of vector
of control variables (X). Thus, our performance output equation can be expressed as:
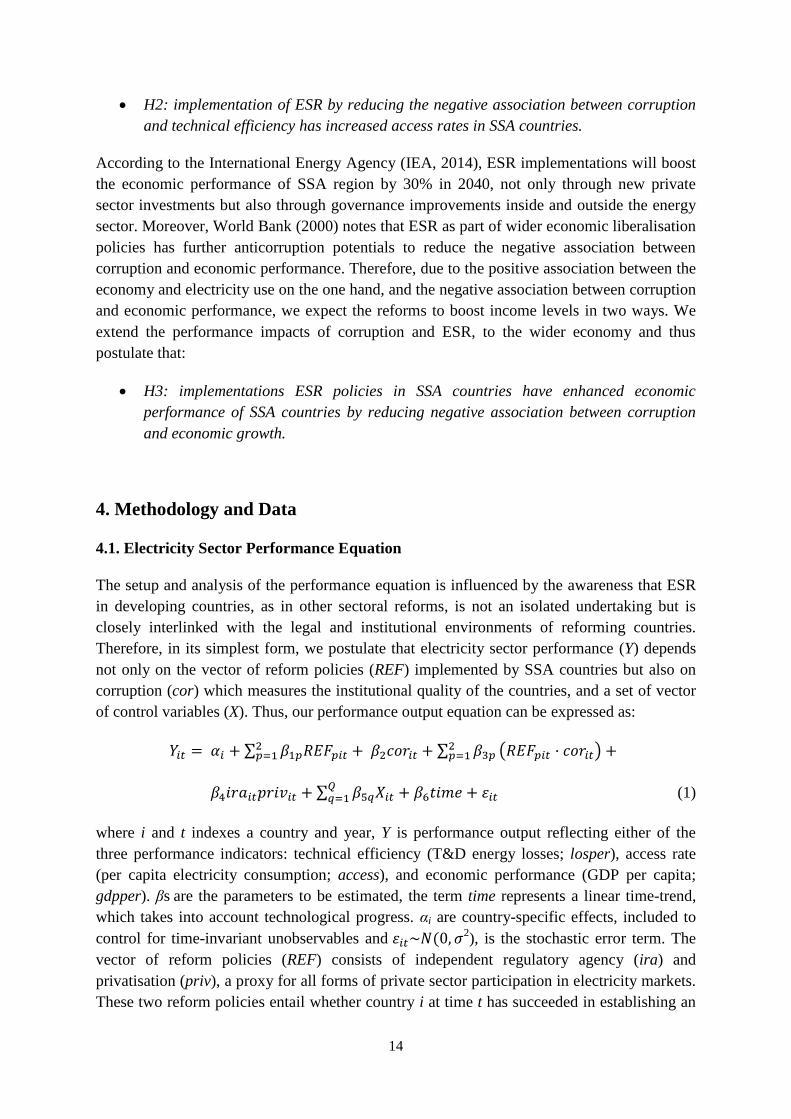
𝑌𝑖𝑡 = 𝛼𝑖 + ∑ 𝛽1𝑝𝑅𝐸𝐹𝑝𝑖𝑡2𝑝=1 + 𝛽2𝑐𝑜𝑟𝑖𝑡 + ∑ 𝛽3𝑝
2𝑝=1 (𝑅𝐸𝐹𝑝𝑖𝑡 · 𝑐𝑜𝑟𝑖𝑡) +
𝛽4𝑖𝑟𝑎𝑖𝑡𝑝𝑟𝑖𝑣𝑖𝑡 + ∑ 𝛽5𝑞𝑋𝑖𝑡𝑄𝑞=1 + 𝛽6𝑡𝑖𝑚𝑒 + 𝜀𝑖𝑡 (1)
where i and t indexes a country and year, Y is performance output reflecting either of the
three performance indicators: technical efficiency (T&D energy losses; losper), access rate
(per capita electricity consumption; access), and economic performance (GDP per capita;
gdpper). βs are the parameters to be estimated, the term time represents a linear time-trend,
which takes into account technological progress. αi are country-specific effects, included to
control for time-invariant unobservables and 𝜀𝑖𝑡~𝑁(0, 𝜎2), is the stochastic error term. The
vector of reform policies (REF) consists of independent regulatory agency (ira) and
privatisation (priv), a proxy for all forms of private sector participation in electricity markets.
These two reform policies entail whether country i at time t has succeeded in establishing an
15
independent regulatory agency and opened its doors for private participation. The vector of Q
control variables (X) depends on which of the three performance indicators is used. It
captures the demand side of the market and consists of GDP per capita (gdpper), total gross
electricity generation (genper) and, structure (struc) and size (urban) of electricity markets.
In order to capture the corruption reducing effects of ESR on performance, we follow Estache
et al. (2009) and Wren-Lewis (2015) and use interaction terms between corruption and the
two reform policies (iraXcor and privXcor). The coefficients of these two interaction terms
measure the corruption reducing potential of reforms. We also include an interaction term
between the two the reform policies (iraXpriv) to assess whether IRAs have constrained or
improved the performance of privatised utilities or if private utilities have constraint or
reinforced regulatory activity. This is important because, private investors in electricity
sectors of developing countries mostly require credible and transparent IRAs to safeguard
their investments from expropriation by the state.
Similarly, as noted in the literature on regulatory capture, there is a tendency for regulatory
capture in regulated electricity markets due to economic incentives that may push regulators
to cater for the interest of the regulated (e.g., Olson, 1965; Dal Bó and Di Tella, 2003; Leaver,
2009). These incentives may arise due to reliance of the regulators on the regulated entity for
information they need to do their duties and the desire to hold future well-paid jobs with the
regulated since human capital in the sector tends to be industry-specific. Hence, this is our
motivation for the inclusion of the third interaction term.
4.2. Estimation method
In panel data regressions, the choice of an estimator mostly lies between the Random Effects
(RE) or Fixed Effects (FE) estimators to deal with the bias of unobserved heterogeneity.
However, both estimators address the bias at the expense of a strong exogeneity assumption.
For instance, Equation (1) includes not only country-specific effects that can be correlated
with other regressors, but also other theoretically established endogenous regressors (e.g., per
capita GDP), thus the orthogonality condition is not likely to be met for a RE or FE estimator
to produce consistent estimates. Moreover, Jamasb et al. (2005) note that most ESR
researchers tend to ignore (implicitly or explicitly) another sources of endogeneity which
arises from the possibility of current values of ESR variables and past performance being a
function of past condition or performance. Therefore, the RE and FE estimators do not
produce consistent coefficient estimates in the presence of endogenous regressors and
dynamics, and thus it is not possible to make inferences based on their estimates.
In order to overcome these methodological concerns, we first transform Equation (1) into a
dynamic panel specification where lagged values of the three indicators of performance, i.e.
the alternative dependent variables (technical efficiency, access rates and per capita GDP) are
included as additional regressors. The dynamic performance equation can be expressed as in
equation (2):
16
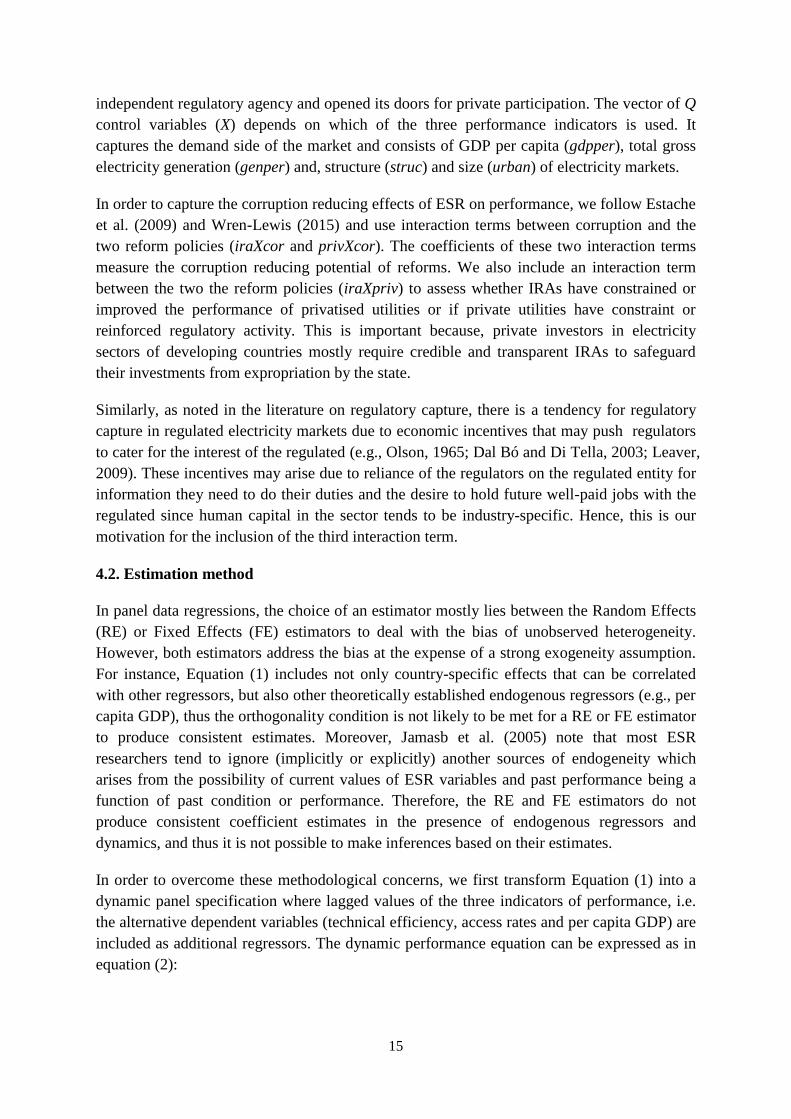
𝑌𝑖𝑡 = 𝜑𝑌𝑖𝑡−1 + 𝛼𝑖 + ∑ 𝛽1𝑝𝑅𝐸𝐹𝑝𝑖𝑡2𝑝=1 + 𝛽2𝑐𝑜𝑟𝑖𝑡 + ∑ 𝛽3𝑝
2𝑝=1 (𝑅𝐸𝐹𝑝𝑖𝑡 · 𝑐𝑜𝑟𝑖𝑡) +
𝛽4𝑖𝑟𝑎𝑖𝑡𝑝𝑟𝑖𝑣𝑖𝑡 + ∑ 𝛽5𝑞𝑋𝑖𝑡𝑄𝑞=1 + 𝛽6𝑡𝑖𝑚𝑒 + 𝜀𝑖𝑡 (2)
where 𝑌𝑖𝑡−1 presents the lagged value of performance, whilst 𝜑 is the parameter estimate of
lagged performance. All other variables and coefficients are defined as before. As noted,
neither the pooled OLS, FE nor RE estimates of 𝜑 are consistent in dynamic models when the
time span is small (Nickell, 1981). We could consider using the dynamic panel General
Method of Moments (GMM) estimator proposed by Arellano and Bond (1991). This
estimator has the potential to produce consistent estimates in the presence of endogeneity of
regressors, unobserved country fixed effects and dynamics. The estimator first eliminates the
country-specific effects αi by differencing the model and instrumenting the lagged dependent
variable (𝑌𝑖𝑡−1) with lagged levels of this variable (Arellano and Bond, 1991). However,
differencing the data removes all time-invariant variables of interest during the estimation.
Moreover, the Difference GMM (Diff-GMM) is noted to perform poorly in the presence of
persistent processes since the lagged levels may convey little information on future changes,
thus implying the problem of weak instruments and biased estimates (Roodman, 2008).
Arellano and Bover (1995) and Blundell and Bond (1998) developed a System GMM (Sys-
GMM) estimator to improve the efficiency of the Diff-GMM estimator. The Sys-GMM
estimator solves the endogeneity problem by treating the model as a system of equations in
first difference and in levels. The endogenous regressors in the first difference equation are
instrumented with lags of their levels, whilst the endogenous regressors in the level equation
are instrumented with the lags of their first differences. The consistency of the Sys-GMM
estimator depends on the assumption of no serial autocorrelation in the errors and existence
of an array of exogenous regressors. An important aspect of the estimator is that it relies on
internal instruments contained within the panel itself and therefore eliminates the need for
external instruments and it also avoids full specification of the serial correlation and
heteroscedasticity properties of the stochastic error term, or any other distributional
assumption.
Despite its advantages, the Sys-GMM estimator has limitations especially as it relies on using
the lags of both the dependent and independent variables for identification. This would
potentially give rise to a problem of weak instruments, which is usually magnified as the
number of instrumental variables increases. Although, increasing the instruments’ lag length
could make them more exogenous, it may also make them weaker. Furthermore, when using
panel data estimators such as the Sys-GMM, the bias resulting from errors in regressors may
also be magnified (Griliches and Hausman, 1986). In order to reduce the influence of these
and other limitations of the estimator on our results, we avoid the instruments counts
exceeding the number of countries in the sample or overfitting of the instrumented regressors.
Thus, we collapse the instrument set as recommended by Roodman (2009) and report the
instrument count for each of the estimations.
17
Obtaining consistent, efficient and unbiased results using the Sys-GMM estimator is
contingent on two specification tests; Hansen test for over-identification restrictions and the
Arellano and Bond (1991) test for serial correlation (AR) of the disturbances up to the second
order. The Hansen test of over-identification restrictions is a joint test of model specification
and appropriateness of the instrument vector. Failure to reject the null hypothesis of the test
would indicate that the instruments used in estimation are valid and the model has been well
specified. The appropriate check of the Arellano and Bond (1991) test for serial correlation
(AR) relates only to the absence of second-order serial correlation (AR2) since the first
differencing induces first serial correlation in the transformed errors.
4.3. Data
The econometric analyses are based on annual country-specific observations from 47 SSA
countries over the period 2002-2013. Our selection of countries and time period are largely
determined by data availability. Moreover, since the main aim of paper relates to the
influence of IRAs and privatization on corruption, the little reforms implemented so far in the
region would not permit us to assess the impacts of ESR and corruption prior 2002. Similarly,
the final year 2013, represents the last year for which data are available on electricity
consumption per capita and T&D losses at the time we conducted the analyses. Also, we do
not have complete data for all years on the 47 countries especially as we change the
performance indicators and the sample size changes depending on the performance indicator
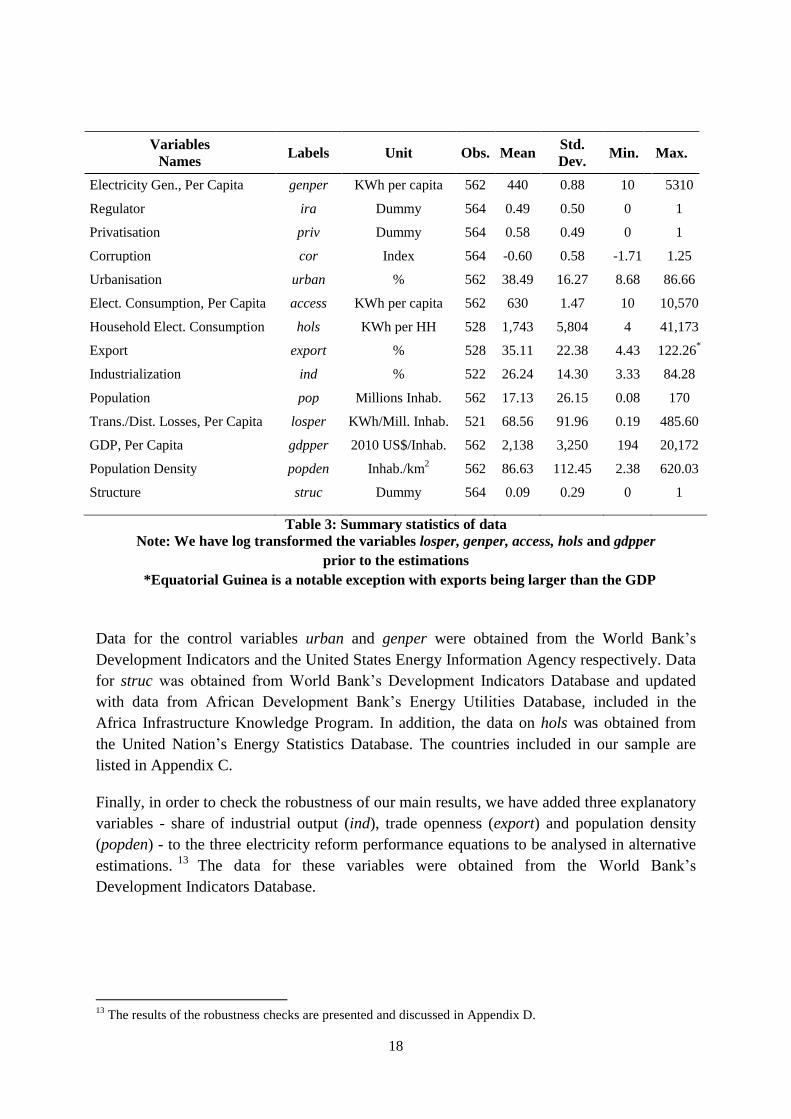
being analysed.9 Table 3 summarises summary statistics of the variables used.
As noted, the three performance indicators (technical, welfare and economic impacts) are
measured by per capita T&D losses (losper)10
, per capita electricity consumption (access)11
,
GDP per capita (gdpper). Data on losper and access (relabelled as comper) and used as a
control variable in the economic impact regression) are obtained from the United States
Energy Information Agency database, while data on gdpper is from the World Bank
Development Indicator Database. Data on corruption is from Kaufmann et al. (2010) included
in World Bank’s Governance Indicator Database, which includes annual country-level data.
The corruption index, which measures corruption in both public and private sectors, ranges
from -2.5 (highly corrupt) to 2.5 (highly clean). Data on ira was obtained from Eberhard et al.
(2016) and updated with data from Burundi, Cape Verde, Madagascar, Seychelles and São
Tomé and Príncipe electricity regulatory agencies’ websites.12
Data on priv was obtained
from the World Bank Infrastructure Database.
9 The different sample sizes were reported at the bottom of three estimation results tables in the next section.
10 The losses and access variables have been averaged by total population data from the World Bank’s
development indicators database to obtain a per capita measure before estimations. 11
See Appendix B for using this measure as a proxy for access to electricity relative to alternative indicators. 12
See Burundi’s Drinking Water and Electricity Sector Control and Regulation Agency (ACR):
https://www.ppbdi.com/index.php/extras/economie-sciences-education-formation/3397-ministere-de-l-energie-
et-des-mines-regulation-du-secteur-de-l-eau-potable-et-de-l-electricite, Cape Verde Agência de Regulação
Económica: http://www.are.cv/index.php, Madagascar office de régulation de l'electricité: http://www.ore.mg/,
The Seychelles Energy Commission (SEC): http://www.sec.sc/, São Tomé and Príncipe Autoridade Geral de
Regulação: http://www.ager-stp.org/index.php/pt/.
18
Variables
Names Labels Unit Obs. Mean
Std.
Dev. Min. Max.
Electricity Gen., Per Capita genper KWh per capita 562 440 0.88 10 5310
Regulator ira Dummy 564 0.49 0.50 0 1
Privatisation priv Dummy 564 0.58 0.49 0 1
Corruption cor Index 564 -0.60 0.58 -1.71 1.25
Urbanisation urban % 562 38.49 16.27 8.68 86.66
Elect. Consumption, Per Capita access KWh per capita 562 630 1.47 10 10,570
Household Elect. Consumption hols KWh per HH 528 1,743 5,804 4 41,173
Export export % 528 35.11 22.38 4.43 122.26*
Industrialization ind % 522 26.24 14.30 3.33 84.28
Population pop Millions Inhab. 562 17.13 26.15 0.08 170
Trans./Dist. Losses, Per Capita losper KWh/Mill. Inhab. 521 68.56 91.96 0.19 485.60
GDP, Per Capita gdpper 2010 US$/Inhab. 562 2,138 3,250 194 20,172
Population Density popden Inhab./km2 562 86.63 112.45 2.38 620.03
Structure struc Dummy 564 0.09 0.29 0 1
Table 3: Summary statistics of data
Note: We have log transformed the variables losper, genper, access, hols and gdpper
prior to the estimations
*Equatorial Guinea is a notable exception with exports being larger than the GDP
Data for the control variables urban and genper were obtained from the World Bank’s
Development Indicators and the United States Energy Information Agency respectively. Data
for struc was obtained from World Bank’s Development Indicators Database and updated
with data from African Development Bank’s Energy Utilities Database, included in the
Africa Infrastructure Knowledge Program. In addition, the data on hols was obtained from
the United Nation’s Energy Statistics Database. The countries included in our sample are
listed in Appendix C.
Finally, in order to check the robustness of our main results, we have added three explanatory
variables - share of industrial output (ind), trade openness (export) and population density
(popden) - to the three electricity reform performance equations to be analysed in alternative
estimations.13
The data for these variables were obtained from the World Bank’s
Development Indicators Database.
13
The results of the robustness checks are presented and discussed in Appendix D.

19
5. Results
In this section, we present and discuss the estimation results of the performance equations
along the three dimensions of performance (technical, welfare and economic impacts) using
dynamic panel Sys-GMM estimator.14
The first subsection discusses the estimates of the
T&D energy losses equation, the second subsection estimates energy consumption per capita
access, whilst the third subsection discuss the estimates of GDP per capita equation.
Regression statistics of the three estimations (Tables 4-6) indicate that all models fit the data
well. The test statistics indicates that there is first order serial correlation AR (1) but not at the
second order AR (2), while the Hansen test of model specification and over-identifying
restrictions indicates that all three models are correctly specified with appropriate
instruments. Our estimation strategy differs from earlier studies who use static models to
analyse the impacts of ESR on performance (Zhang et al., 2008; Estache et al., 2009; Wren-
Lewis, 2015).
5.1. Technical Impact – T&D losses
The immediate impacts of ESR are the technical improvements on the sector. The estimates
of the Sys-GMM estimation in Table 4 shows that, the coefficient of cor is positive and
highly significant, suggesting that an increase in the corruption index is associated with
reductions in efficiency particularly in countries without private sector participation. Thus,
corruption can be considered here as a major source of inefficiency in SSA countries and
therefore, decreasing it could have enormous positive impact on technical efficiency. This
result is similar to the results obtained by other researchers who find a positive relationship
between corruption and inefficiency (Dal Bó, 2006; Estache and Trujillo, 2009; Dal Bó and
Rossi, 2007; and Wren-Lewis, 2015).
The coefficient of ira is not significant suggesting that, creation of IRAs has no statistical
effect on technical efficiency. The negative coefficient for priv indicates that, countries with
private sector participation are associated with a statistically significant improvement in
technical efficiency during the study period. Evidence of this cuts across the whole of SSA
where for example, introduction of private sector participation in countries such as Namibia,
Nigeria, Uganda and Mali, which have greatly improved efficiency (Clark et al., 2005).
Moreover, this result is consistent with earlier studies that find private sector participation in
electricity markets is associated with technical efficiency improvements (e.g., Andres et al.,
2008; Nagayama, 2007; Balza et al., 2013). However, Smith (2004) and Zhang et al. (2008)
find that certain electricity reform policies such as regulation and privatisation are associated
with the deterioration of efficiency.
Do implementations of ESR reduce the negative influence of corruption on technical
efficiency? The answer depends on the coefficient estimates of the two interaction terms
iraXcor and privXcor included in Equation (2). The coefficient of iraXcor is not significant
14
Although, we estimate our model with the Sys-GMM estimator, however for completeness, we present pooled
OLS regressions results in Appendix E.

20
suggesting that creations of IRAs have no any statistical influence on relation between
corruption and technical efficiency. Conversely, the coefficient estimate also suggests that
corruption has not interfered with regulatory activities. The coefficient of the privXcor
interaction term is negative and significant suggesting that, SSA countries that have opened
their electricity markets to private sector participation have greatly offset the negative
influence of corruption on efficiency. The coefficient of the interaction term iraXpriv is not
significant indicating that regulation of the privatised networks has had no effect on the
efficiency of the utilities and owners have not interfered with regulatory activities.
Regarding the control variables included in the estimation, the negative and significant
coefficients of struc and urban suggest that, countries that have unbundled sectors and
increased the size of their electricity markets have improved technical efficiency. On the
contrary, the coefficient of hols suggests that increased electricity consumption by
households have led to efficiency deterioration during the period covered by our study. The
coefficient of the time trend is not significant. It should be noted that this and the subsequent
results should be interpreted with some caution since the dummies used as proxies are
nominal values and thus will not capture the intensity of reform policies among countries in
the sample. Moreover, the measure of corruption used is at best the perception of corruption,
which could be different from reality.
Technical Impact (losper)
Variables Est. t-stat.
Ln losper(t-1) 0.857*** 19.02
cor 1.035*** 4.30
ira 0.174 0.96
priv -0.533*** -3.10
iraXcor 0.003 0.03
privXcor -0.955*** -4.51
iraXpriv -0.125 -0.86
Ln hols 0.065** 2.26
struc -0.551*** -3.76
urban 0.004* 1.87
time 0.003 1.16
No of obs. 444
Countries 41
Instruments 36
AR(1) test (p value) -2.28 (0.023)
AR(2) test (p value) 0.09 (0.925)
Hansen test (p value) 23.59 (0.485)
Significance code: *** p<0.01, ** p<0.05, * p<0.1
Table 4: Two-Step GMM Estimates of T&D Losses Equation

21
5.2. Welfare Impact (access) - Per Capita Electricity Consumption
The main and ultimate aim of electricity reforms in developing countries has been to improve
the socio-economic welfare of the population. The parameter estimates of the performance
equation (access) are presented in Table 5. The estimated coefficient of cor is negative and
significant, suggesting that, an increase in corruption decreases access to electricity services.
This is consistent with similar findings obtained by other researchers on how corruption
reduces the quality and quantity of publicly consumed services (e.g., Fredriksson et al., 2004;
Estache et al., 2009).
The coefficient of the IRA dummy is positive and significant, indicating that for the period
covered by our study, countries that have created IRAs have boosted access to electricity
services. This result contrasts with the result obtained by Estache et al. (2009) who associated
the creations of an IRAs with a statistically significant reduction in access rates. The
coefficient of priv is not significant indicating that the privatisation policies have no
significant effect on the access rates. The estimate also contrasts with the findings of earlier
studies such as Sihag et al. (2007) and Bhattacharyya (2006) who find that reforms policies
(e.g., privatization) have led to a decline in access the rates in the State of Orissa in India.
The coefficient of the interaction term iraXcor is positive and significant indicating that,
creations of IRAs have offset the negative influence of corruption on access rates. The
coefficient estimate of the interaction privXcor, is not significant suggesting that private
sector participation has not been effective in addressing the negative influence of corruption.
It may also suggest that corruption has not constrained the efforts of privatised utilities to
increase access to electricity services.
Regardless of the impacts of individual reform policies, the coefficient of the interaction term
iraXpriv suggests that together they exert a statistically significant decreasing effect on access
to electricity. In other words, although the creation of IRAs have led to increase in access
rates while privatisation has no effect, their interaction have led to reductions in access rates
in SSA countries. This may be attributed to the conflicting objectives between independent
regulators and private utilities. For example, independent regulation may be keen to extend
electricity services to the mostly un-electrified poor areas, while private firms may be
motivated by profit motive and thus have no incentives to extend the electricity service to
new low-income and low-usage consumers.
The coefficients of gdpper, urban and struc are all not significant suggesting that income
level, the size of/and structure electricity markets have no impacts on electrification rates.
The electricity generation per capita variable (genper) is positive and highly significant
indicating that further increases in electricity generation leads to increase in access rates. The
time trend is not significant.

22
Welfare Impact (access)
Variables Est. t-stat.
Ln access(t-1) 0.846*** 23.13
cor -0.147* -1.91
ira 0.281*** 4.04
priv 0.124 1.37
iraXcor 0.231*** 4.63
privXcor 0.042 0.50
iraXpriv -0.146*** -2.63
Ln genper 0.178*** 5.03
Ln gdpper -0.058 -1.45
struc 0.003 0.16
urban 0.001 1.20
time 0.002 1.48
No of obs. 515
Countries 47
Instruments 41
AR(1) test (p value) -4.17 (0.000)
AR(2) test (p value) -1.62 (0.106)
Hansen test (p value) 26.69 (0.535)
Significance code: *** p<0.01, ** p<0.05, * p<0.1
Table 5: Two-step GMM Estimates of Per Capita Energy Consumption
5.3. Economic Impact - GDP Per Capita
The results indicate that the implementation of electricity reforms in SSA countries have the
potential to reduce the negative influence of corruption on electricity sector performance. The
implementations of reforms in developing countries are noted to have anticorruption
potentials to reduce the effects of corruption on economic development (World Bank, 2000).
Therefore, we expect the implementation of reforms in SSA to enhance economic
performance through two channels. First, by enhancing the overall performance of the sector
(i.e., by improving technical efficiency and extending services to those without access).
Second, as part of wider economic reforms, often underpinned by an anticorruption strategy,
the reforms can also reduce the effects of corruption on economic performance. The
coefficient estimates of privXcor and iraXcor are shown in Tables 4 and 5.
In Table 6, where gdpper is a dependent variable in the performance equation, the coefficient
of cor is negative and significant. This is consistent with other well established findings on
the relationship between these two variables (e.g., Barreto, 2000; Rose-Ackerman 1999;
Shleifer and Vishny 1993). Thus, an increase in the control of corruption index in a country is
associated with a decrease in per capita GDP. The coefficient of ira is positive and not
significant, suggesting that creation of IRAs hass not had impact on the level of income.

23
The coefficient of priv is also positive and significant indicating that private sector
investments have boosted economic performance of SSA reforming countries. A similar
result was also obtain by Chisari et al. (1999) who find privatization of electricity generation
and distribution assets led to positive economic performance in Argentina. Similarly, the
estimate of priv confirms the argument by the IMF that ESR policies such as privatization has
the potential to free up government energy subsidies and thereby boost economic
performance over the long run (IMF, 2013).
Do implementations reform policies reduce the negative association between corruption and
economic growth? The coefficient of iraXcor is not significant suggesting, that, for the period
of this study, countries that established IRAs have not exerted beneficial effects on the
negative association between corruption and per capita GDP nor has corruption affected the
relation between regulation and economic performance. This is inconsistent with Jalilian et
al. (2007) who stressed the importance of credible and independent regulation on economic
growth. The coefficient of privXcor is positive and significant indicating that, countries that
open their doors to private sector investments have reduce the negative association between
corruption and per capita GDP and thus they have succeeded in boosting their income levels.
The coefficient of iraXpriv is not significant suggesting that the interaction of the regulator
and privatisation does not exert an influence on the economic performance.
Economic Impact (gdpper)
Variables Est. t-stat.
Ln gdpper(t-1) 0.984** 64.15
cor -0.092*** -2.60
ira 0.016 0.57
priv 0.107*** 2.86
iraXcor 0.026 0.92
privXcor 0.071* 1.68
iraXpriv -0.032 -1.18
Ln comper 0.014* 1.72
struc -0.004 -1.41
urban -0.000 -0.79
time -0.001** -2.53
No of obs. 515
Countries 47
Instruments 36
AR(1) test (p value) -2.90 (0.004)
AR(2) test (p value) -1.29 (0.196)
Hansen test (p value) 22.46 (0.552)
Significance code: *** p<0.01, ** p<0.05, * p<0.1
Table 6: Two-step GMM Estimates of Income Growth Equation
24
Of the three control variables included in the model, only the coefficient of per capita
electricity consumption (comper) is positive and significant. This suggests that an increase in
energy consumption impacts positively on per capita GDP, while the structure (struc) and
size (urban) of electricity markets have no effects on level of income after controlling for the
effect of corruption. However, the time trend is significant and negative, which may indicate
the adverse effect of decreasing technical progress on the region’s economic performance
over the period covered by our study.
6. Conclusions
Sub-Saharan African countries are noted to be among the most corrupt countries of the world.
As a result, various studies have investigated how corruption have continued to constrain the
economic development of these countries through some transmission channels. However, one
important transmission channel not yet investigated is the operation and regulation of
electricity networks. Studies that investigated this channel using data on other developing
regions find evidence that corruption can increase system losses, restrict electricity services
to urban areas and reduce income levels.
In order to reduce the influence of corruption in the electricity sector, reformers advocated for
unbundling of state-owned electric utilities vertically (generation, transmission, distribution
and retailing) and horizontally (generation and retailing). The unbundled parts that are
amenable to competition would be sold to the private sector and an independent regulatory
agency created by the state would then supervise and regulate the natural monopoly-prone
parts of the sector.
After more than two decades of reforms in SSA countries, we investigate whether these
reforms have reduced the influence of corruption on technical efficiency of utilities and if
efficiency gains have been translated into increase in access rates and income growth. The
paper uses panel data and a dynamic panel estimator to investigate the effects of corruption
on electricity sector performance. Using World Bank’s control of corruption perception
index, the paper shows that corruption has an adverse and statistically significant effect on
the three indicators of electricity sector performance - technical efficiency, access rates and
economic performance. This finding adds to the body of evidence that stress the detrimental
impacts of corruption on economic development and electricity sector performance.
We find that creation of independent regulation and private sector participation, not only have
the potential to enhance the utilities’ performance but have also wider economic benefits.
Specifically, we find that independent regulation has the potential to increase social welfare
directly and indirectly by reducing the association between corruption and electricity access
rates. We also show that private sector participation is associated with improved technical
efficiency and increased economic performance, while we find privatization policies have no
statistically significant impact on access rates.
25
More importantly, we analyse the way corruption interacts with the two reform policies and
how these interactions impact on the three indicators of performance. The creations of
independent regulators has substantially reduced the adverse association between corruption
and access rates, while they have not mitigated the often-cited negative association between
corruption and income level and nor the association between corruption and technical
efficiency. However, private sector participation has offset the adverse effects of corruption
on technical efficiency and income, while they have no impact on the association between
corruption and access rates.
These results are robust after controlling for other variables that also have impacts on the
performance of the electricity sector. Thus, our results suggest that implementation of well-
designed micro level electricity reforms have the potential not only to boost the firms’
economic performance directly, they would also indirectly reduce the negative effects of
macro-level institutional deficiencies such as corruption on micro and macro levels indicators
of performance. Therefore, implementation of electricity reforms in developing countries can
not only enhance the performance of the electricity sector, but would also boost economic
performance, since improvements in technical efficiency can be translated into increased
access rates and income growth.
26
References
ADB (2010). Financing of sustainable energy solutions, Committee of Ten Policy Brief, No. 3.
https://www.afdb.org/fileadmin/uploads/afdb/Documents/Publications/C-
10%20Note%203%20English%20%28final%29_for%20posting.pdf.
Ahlborg, H., Borang, F., Jagersb, S.C. and Soderholm, P. (2015). Provision of electricity to African
households: The importance of democracy and institutional quality, Energy Policy 87, 125-135.
Andres, L., Azumendi, S., L., and Guasch, J., L. (2008). Regulatory governance and sector
performance; methodology and evaluation for electricity distribution in Latin America. World
Bank Policy Research Working Paper 4494, The World Bank, Washington, DC.
Arellano, M., and Bond, S. (1991). Some tests of specification for panel data; Monte Carlo evidence
and an application to employment equations, Review of Economic Studies 58, 277-297.
Arellano, M., and Bover, O. (1995). Another look at the instrumental variable estimation of error-
component models, Journal of Econometrics 68, 29-51.
Auriol, E., and Blanc, A. (2009). Capture and corruption in public utilities: The cases of water and
electricity in Sub-Saharan Africa, Utilities Policy 17(2), 203-216.
Auriol, E., and Picard, P. (2006). Privatization in developing countries and the government budget
constraint, World Bank Discussion; 3950, 42 pages.
Balza, L., Jimenez, R. and Mercado, J. (2013). Privatization, institutional reform, and performance in
the Latin American electricity sector, Inter-American Development Bank, Technical Note, No.
IDB-TN-599.
Barreto, R.A. (2000). Endogenous corruption in a neoclassical growth model, European Economic
Review 44, 35-60.
Bergara, M., Henisz, W., J. and Spiller, P., T. (1998). Political institutional and electric utility
investment: A cross-nation analysis, Program on Workable Energy Regulation (POWER), California Management Review 40, pp.18-35.
Bhattacharyya, S.C. (2006). Energy access problem of the poor in India: Is rural electrification a
remedy? Energy Policy 34(10), 3387-3397.
Blundell, R. and Bond, S. (1998). Initial conditions and moment restrictions in dynamic panel data
models, Journal of Econometrics 87, 115-143.
Bosshard, P. (2005). The environment at risk form monuments of corruption in Transparency
International (ed.) Global Corruption Report, 2005; Gulati, M. and M. Rao (2006), checking
Corruption in the Electricity Sector, mimeo, World Bank, Washington, DC.
Boycko, M., Shleifer, A. and Vishny, R.W. (1996). A theory of privatisation, The Economic Journal
106, 309-319.
Byrne, J. and Mun, Y-M. (2003). Rethinking reform in the electricity sector: Power liberalisation or
energy transformation? In Wamukonya, N. (ed.) Electricity Reform; Social and Environmental
Challenges Roskilde, Denmark: UNEP-RISØ Centre.
Chang, C.P. and Berdiev, A.N. (2011). The political economy of energy regulation in OECD
countries, Energy Economics 33(5), 816-825.
27
Chisari, O., Estache, A. and Romero, C. (1999). Winners and losers from the privatisation and
regulation of utilities: Lessons from a general equilibrium model of Argentina, World Bank
Economic Review 13(2), 357-378.
Clark, A., Davis, M., Eberhard, A., Gratwick, K. and Wamukonya, N. (2005). Power sector reform in
Africa: Assessing the impact on poor people, a study managed by the Graduate School of Business,
March, University of Cape Town for ESMAP/World Bank.
Cornwall, J. (1977). Modern capitalism, its growth and transformation, London, Martin Robertson.
Cubbin, J. and Stern, J. (2006). The Impact of regulatory governance and privatization on electricity
industry generation capacity in developing economies, World Bank Economic Review 20(1), 115-
141.
Dal Bó, E. (2006). Regulatory capture: A review. Oxford Review of Economic Policy 22(2), 203-25.
Dal Bó, E. and Di Tella, R. (2003). Capture by threat, Journal of Political Economy 111(5), 1123-54.
Dal Bó, E. and Rossi, M.A. (2007). Corruption and inefficiency: Theory and evidence from electric
utilities, Journal of Public Economics 19, 939-962.
Doll, C. and Pachauri, S. (2010). Estimating rural populations without access to electricity in
developing countries through night-time light satellite imagery, Energy policy 38, 5661-5670.
Dorman, M. (2014). Reform despite politics? The political economy of power sector reform in Fiji,
1996-2013, Energy Policy 67, 703-712.
Downing, J., Snodgrass, D., Northrip, D. and Woller, G. (2006). The new generation of private sector
development programming: The emerging path to economic growth with poverty reduction, Micro
report #44, Washington, DC; USAID.
Eberhard, A. (2007). Infrastructure regulation in developing countries; an exploration of hybrid and
transitional models, Public-Private Infrastructure Advisory Facility (PPIAF), World Bank,
Working Paper 4.
Eberhard, A. and Gratwick, K. (2011). IPPs in Sub-Saharan Africa; determinants of success, Energy
Policy 39, 5541-49.
Eberhard, A., Foster, V., Briceno-Garmendia, C., Ouedraogo, F., Camos, D. and Shkaratan, M. (2008).
Underpowered; The state of the power sector in Sub-Saharan Africa, World Bank Report Paper 6.
Washington, DC
Eberhard, A., Gratwick, K., Morella, E. and Antmann, P. (2016). Independent power projects in Sub-
Saharan Africa: Lessons from five key countries. Directions in Development. Washington, DC:
World Bank. doi:10.1596/978-1-4648-0800-5.
Erdogdu, E. (2013). Implications of liberalization policies on government support to R&D: Lessons
for electricity markets, Renewable and Sustainable Energy Reviews 17, 110-118.
Estache, A. and Trujillo, L. (2009). Corruption and infrastructure services: An overview, Utilities
Policy 17(2):153-55.
Estache, A. and Wren-Lewis, L. (2009). Toward a theory of regulation for developing countries;
following Jean-Jacques Laffont’s lead, Journal of Economic Literature 47(3), 729-70.
28
Estache, A. and Wren-Lewis, L. (2010). What anti-corruption policy can learn from theories of sector
regulation, ECARES Working Paper 2010-033.
Estache, A., Goicoechea, A. and Trujillo, L. (2009). Utilities reforms and corruption in developing
countries, Utilities Policy 17(2), 191-202.
Fredriksson, P.G., Vollebergh, H.R.J. and Dijkgraaf, E. (2004). Corruption and energy efficiency in
OECD countries; theory and evidence, Journal of Environmental Economics and Management
47(2), 207-231.
Ghanadan, R. and Eberhard, A. (2007). Electricity utility management contracts in Africa: Lessons
and Experience from the TANESCO-NET Group Solutions Management Contract in Tanzania,
2002-2006, MIR Working Paper, Management Programme for Infrastructure Reform and
Regulation, Cape Town.
Gilbert, R.J., Kahn, E.P. and Newbery, D.M. (1996). Introduction; international comparisons of
electricity regulation. In Gilbert, R.J. and Kahn, E.P. (eds.) Introduction; International
comparisons of electricity regulation, Cambridge; Cambridge University Press: 1-24.
Gratwick, K., Ghanadan, A. and Eberhard, A. (2006). Generating power and controversy
understanding Tanzania’s Independent Power Projects, Journal of Energy in Southern Africa 17(4).
Cape Town: Energy Research Centre.
Griliches, Z. and Hausman, J.A. (1986). Errors in variables in panel data, Journal of Econometrics 31,
93-118.
Gyimah-Brempong, K. and de Camacho, S.M. (2006). Corruption, growth, and income distribution;
are there regional differences? Economics of Governance 7, 245-269.
IEA (2014). A focus one energy prospects in sub-Saharan Africa, Africa Energy Outlook,
International Energy Agency; Paris.
IEA (2016). Boosting the power sector in Sub-Saharan Africa: China’s Involvement, International
energy Agency.
https://www.iea.org/publications/freepublications/publication/Partner_Country_SeriesChinaBoosti
ng_the_Power_Sector_in_SubSaharan_Africa_Chinas_Involvement.pdf.
IMF (2013). Energy subsidy reform: Lessons and implications, International Monetary Fund,
Washington, D.C.
Jalilian, H., Kirkpatrick, C. and Parker, D. (2007). The Impact of regulation on economic growth in
developing countries: A cross-country analysis, World Development 35(1), 87-103.
Jamasb, T. (2006). Between the state and market: Electricity sector reform in developing countries,
Utilities Policy 14(1), 14-30.
Jamasb, T., Mota, R., Newbery, D. and Pollitt, M.G. (2005). Electricity sector reform in developing
countries: A survey of empirical evidence on determinants and performance, World Bank Policy
Research Working Paper 3549, World Bank, Washington, DC.
Jamasb, T., Nepal, R., Timilsina, G. and Toman, M. (2014). Energy sector reforms, economic
efficiency and poverty reduction, Discussion Papers Series 522, School of Economics, University
of Queensland, Australia.
29
Jamasb, T., Nepal, R. and Timilsina, G.R. (2016). A quarter century effort yet to come of age: A
survey of electricity sector reforms in developing countries, The Energy Journal 38(3), 195-234.
Joskow, P.L. (2006). Introduction to electricity sector liberalization: Lessons learned from cross-
country studies, in Sioshansi, F. and Pffanberger, W.; Electricity Market Reform: An International
Perspective, 1-32.
Kaldor, N. (1970). The case for regional policies, Scottish Journal of Political Economy XVII, 337-
348.
Kapika, J. and Eberhard, A. (2013). Power sector reform and regulation in Africa: Lessons from
Kenya, Tanzania, Uganda, Zambia, Namibia and Ghana, Cape Town; Human Sciences Research
Council Press.
Kaufmann, D., Kraay, A. and Mastruzzi, M. (2010). The Worldwide Governance Indicators;
methodology and analytical issues, World Bank Policy Research Working Paper No. 5430.
Available at SSRN: https://ssrn.com/abstract=1682130.
Kaufmann, D. and Siegelbaum, P. (1997). Privatization and corruption in transition economies;
Journal of International Affairs, 50: 419-458.
Laffont, J.J. and Tirole, J. (1986). Using cost observation to regulate firms, Journal of Political
Economy 94(3), 614-41.
Leaver, C. (2009). Bureaucratic minimal squawk behaviour: Theory and evidence from regulatory
agencies, American Economic Review 99(3), 572-607.
Levy, B. and Spiller, P.T. (1994). The institutional foundations of regulatory commitment: A
comparative analysis of telecommunications regulation, Journal of Law, Economics and
Organization 10(2), 201-246.
Lewis, M. (2014). The government’s energy changes mean fewer people will switch. The Telegraph,
March 17: http://www.telegraph.co.uk/finance/personalfinance/household-bills/10726842/Martin-
Lewis-The-governments-energy-changes-mean-fewer-people-will-switch.html.
Mauro, P. (1995). Corruption and growth, Quarterly Journal of Economics 110, 681-712.
Min, B. (2010). Democracy and light: Electoral accountability and the provision of public goods.
Ph.D. Dissertation in Political Science, University of California, Los Angeles.
Murphy, K., Shleifer, A. and Vishny, A. (1991). The allocation of talent: implication for growth,
Quarterly Journal of Economics 105, 503-30.
Nagayama, H. (2007). Effects of regulatory reforms in the electricity supply industry on electricity
prices in developing countries, Energy Policy 35(6), 3440-3462.
Nellis, J. (2005). The evolution of enterprise reform in Africa; from state-owned enterprises to private
participation in infrastructure and Back, Fondazione Eni Enrico Mattei, Nota di Lavoro Series.
Nepal, R. (2013). From state to market: Essays on electricity sector reforms, PhD Thesis, Heriot-Watt
University, Edinburgh.
Nepal, R. and Jamasb, T. (2012a). Reforming the power sector in transition: Do institutions matter?
Energy Economics 34(5), 1675-1682.

30
Nepal, R. and Jamasb, T. (2012b). Reforming small electricity systems under political instability; the
case of Nepal, Energy Policy 40, 242-251.
Nickell, S. (1981). Biases in dynamic models with fixed effects, Econometrica 49(6), 1417.
Olson, M. (2002). Power and prosperity; outgrowing communist and capitalist editorship, Basic
Books, New York.
Olson, M. (1965). The logic of collective action, Cambridge, MA, Harvard University Press.
Patterson, W. (1999). Transforming electricity; the coming generation of change. London: Earthscan.
Pitlik, H. (2007). A race to liberalization? Diffusion of economic policy reform among OECD-
economies, Public Choice 132, 159-178.
Potrafke, N. (2010). Does government ideology influence deregulation of product markets? Empirical
evidence from OECD countries, Public Choice 143(1-2), 135-155.
Reinikka, R. and Svensson, J. (2005). Fighting corruption to improve schooling: Evidence from a
newspaper campaign in Uganda, Journal of the European Economic Association 3(2/3), 259-267.
Roodman, D. (2008). Through the looking glass, and what OLS found there: On growth, foreign aid,
and reverse causality. Unpublished working paper No. 137, Center for Global Development.
Roodman, D.M. (2009). How to do xtabond2: An introduction to Difference and System GMM in
Stata, The Stata Journal 9, 86-136.
Rose-Ackerman, S. (1999). Corruption and government: Causes, consequences, and reform,
Cambridge University, Press, Cambridge.
Scott, A. and Seth, P. (2013). The political economy of electricity distribution in developing countries:
A review of the literature, an Overseas Development Institute publication
https://www.odi.org/sites/odi.org.uk/files/odi-assets/publications-opinion-files/8332.pdf.
Sen, A., Nepal, R. and Jamasb, T. (2016). Reforming electricity reforms? Empirical evidence from
non-OECD Asian Economies, Oxford Institute for Energy studies OIES PAPER: EL 18.
Shapiro, C. and Willig, R. (1990). Economic rationale for the scope for privatization. In; Suleiman,
E.N., Waterbury, J. (Eds.), The political economy of public sector reform, Westview Press.
Shleifer, A. and Vishny, R. (1993). Corruption. Quarterly Journal of Economics 108(3), 599-617.
Sihag, A., Mishra, R. and V. Sharma, N.V. (2007). Impact of power sector reform on poor: A case
Study of South and South East Asia, Tata Energy Research Institute.
Smith, T.B. (2004). Electricity theft: A comparative analysis, Energy Policy 32(18), 2067-2076.
Spiller, P.T. (1990). Politicians, interest groups, and regulators: A multiple-principals agency theory
of regulation, or ”let them be bribed”, Journal of Law and Economics 33 (1), 65-101.
Stiglitz, J. (1998). Distinguished lecture on economics in government: The private uses of public
interests; incentives and institutions, Journal of Economic Perspectives 12(2), 3-22.
Transnational Institute (2002). Lights off! Debunking the myths of power liberalisation, Monograph.
TNI, Amsterdam.

31
Transparency International. (2013). The Corruption perception index; assessed at
https://www.transparency.org/whatwedo/publication/cpi_2013.
UNDP and World Bank (2005). Power Sector Reform in Africa: Assessing impact on poor people,
Energy Sector Management Assistance Programme (ESMAP), United Nations Development
Programme and The World Bank, Washington, DC.
USAID (2005). The nexus between energy sector reform and democracy, Paper prepared PA
consulting and advanced engineering associates international (AEAI) for United States Agency for
International Development. http://pdf.usaid.gov/pdf_docs/Pnadd050.pdf.
Vernon, R. (1971). Sovereignty at bay: The transnational spread of U.S. enterprises, Longman Press,
London.
Victor, D. and Heller, T.C. (2007). The political economy of power sector reforms: The experiences of
five major developing countries, Cambridge Press.
Victor, D.G. (2005). The effects of power sector reform on energy services for the poor, Department
of Economic and Social Affairs, Division for Sustainable Development, The United Nations, New
York.
Wei, S. (2000). How taxing is corruption on international investors? Review of Economics and
Statistics 82(1), 1-11.
Williams, J.H. and Ghanadan, R. (2006). Electricity Reforms in Developing and Transitional
countries; A reappraisal, Energy, 31, 815-844.
World Bank (1993). The World Bank’s role in the electric power sector: Policies for effective
institutional, regulatory, and financial reform, World Bank, Washington.
World Bank (2000). The anti-corruption in transition: A contribution to the policy debate. Washington
D. C; World Bank.
World Bank (2009). Honduras; Public expenditure management for poverty reduction and fiscal
sustainability, Report No. 22070. Poverty Reduction and Economic Sector Management Unit,
Latin America and the Caribbean Region, Washington, DC.
World Bank and IEA (2015). Sustainable energy for all 2015: Progress toward sustainable energy,
World Bank, Washington, DC.
Wren-Lewis, L. (2015). Do infrastructure reforms reduce the effect of corruption? Theory and
evidence from Latin America and the Caribbean, Oxford University Press on behalf of the World
Bank; https://openknowledge.worldbank.org/handle/10986/25845.
Zhang, Y., Parker, D. and Kirkpatrick, C. (2008). Electricity sector reforms in developing countries:
An econometric assessment of the effects of privatisation, competition and regulation, Journal of
Regulatory Economics 33(2), 159-178.
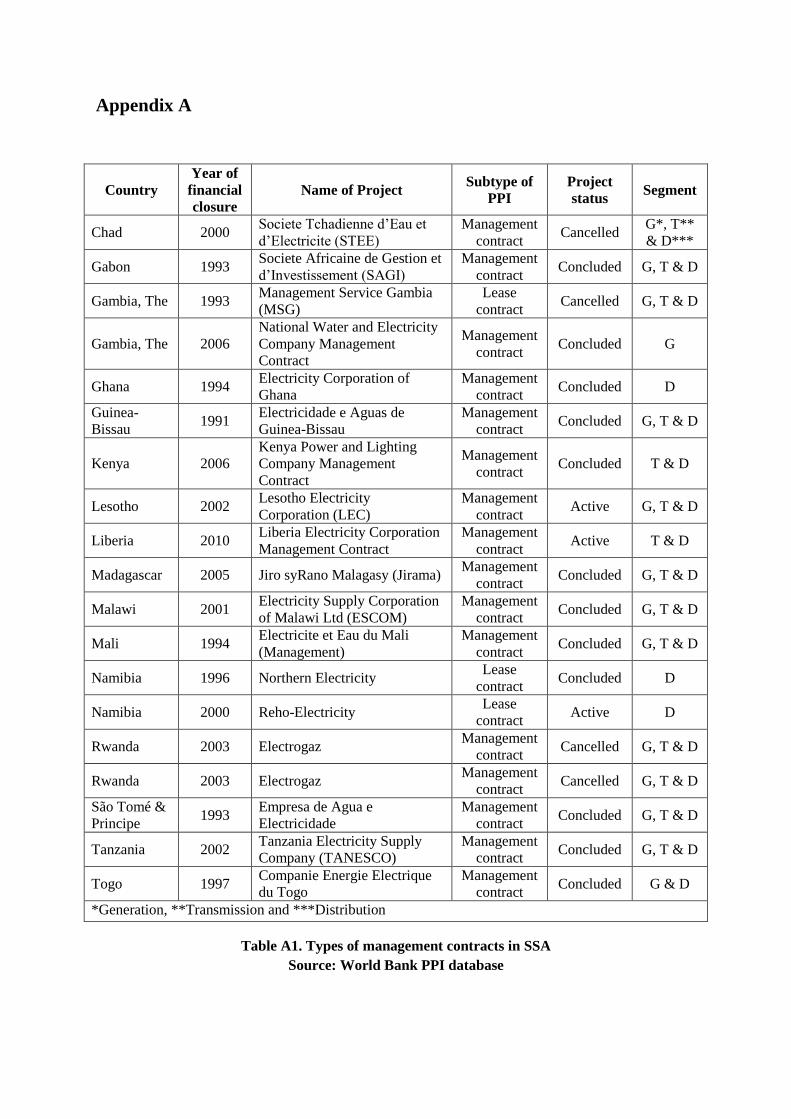
Appendix A
Country
Year of
financial
closure
Name of Project Subtype of
PPI
Project
status Segment
Chad 2000 Societe Tchadienne d’Eau et
d’Electricite (STEE)
Management
contract Cancelled
G*, T**
& D***
Gabon 1993 Societe Africaine de Gestion et
d’Investissement (SAGI)
Management
contract Concluded G, T & D
Gambia, The 1993 Management Service Gambia
(MSG)
Lease
contract Cancelled G, T & D
Gambia, The 2006
National Water and Electricity
Company Management
Contract
Management
contract Concluded G
Ghana 1994 Electricity Corporation of
Ghana
Management
contract Concluded D
Guinea-
Bissau 1991
Electricidade e Aguas de
Guinea-Bissau
Management
contract Concluded G, T & D
Kenya 2006
Kenya Power and Lighting
Company Management
Contract
Management
contract Concluded T & D
Lesotho 2002 Lesotho Electricity
Corporation (LEC)
Management
contract Active G, T & D
Liberia 2010 Liberia Electricity Corporation
Management Contract
Management
contract Active T & D
Madagascar 2005 Jiro syRano Malagasy (Jirama) Management
contract Concluded G, T & D
Malawi 2001 Electricity Supply Corporation
of Malawi Ltd (ESCOM)
Management
contract Concluded G, T & D
Mali 1994 Electricite et Eau du Mali
(Management)
Management
contract Concluded G, T & D
Namibia 1996 Northern Electricity Lease
contract Concluded D
Namibia 2000 Reho-Electricity Lease
contract Active D
Rwanda 2003 Electrogaz Management
contract Cancelled G, T & D
Rwanda 2003 Electrogaz Management
contract Cancelled G, T & D
São Tomé &
Principe 1993
Empresa de Agua e
Electricidade
Management
contract Concluded G, T & D
Tanzania 2002 Tanzania Electricity Supply
Company (TANESCO)
Management
contract Concluded G, T & D
Togo 1997 Companie Energie Electrique
du Togo
Management
contract Concluded G & D
*Generation, **Transmission and ***Distribution
Table A1. Types of management contracts in SSA
Source: World Bank PPI database
Appendix B: Electricity Consumption Per Capita as a Proxy for Access
Rates
To assess the impacts of corruption and ESR on access rates, we use per capita electricity
consumption as dependent variable in Equation (1). Although this choice of dependent
variable may have some limitations, there are several reasons why it is a better proxy than
other two alternative measures commonly used by other scholars: IEA data on electricity
access rates and night-time satellite imagery data captured by the US Defence Meteorological
Satellite Program’s Operational Linescan System (DMSP-OLS).a
The IEA data, which was first compiled in the “World Energy Outlook, 2002”, was based on
various sources such as countries’ self-assessed reports (World Bank and IEA, 2015), which
magnifies the sources of errors and thus leads to overestimation of access rates (Min, 2010).
Another drawback of the IEA data is that, it only indicates the extent of electricity
infrastructure provision, and therefore is silent on quality, reliability and whether services has
been consumed or not (World Bank and IEA, 2015; Ahlborg et al., 2015).b
Similarly, night-time satellite imagery has some serious drawbacks. For example, the
measure includes people without access to electricity services residing in electrified towns
(Doll and Pachauri, 2010). As a result, its reliability as an indicator of access rate is weak
since it only measures stable outdoor lights, which can be a major problem in SSA countries
where there are high incidences of load shedding (World Bank, 2009).c
Therefore, using consumption per capita other than connection rates or satellite imagery as
dependent variable has the advantage of assessing how consumers were able to translate
access to real use, rather than just the physical extension of electricity infrastructures. As
result, if there are significant changes in service reliability, we expect that consumption to be
adversely affected. Moreover, as Ahlborg et al. (2015) have noted, using a per capita measure
rather measuring average consumption among the electrified minority has the advantage of
comparing development patterns across SSA countries of different population sizes.
Furthermore, the per capita measure allows for the assessment of whether consumption levels
have kept pace with population growth in each country. Thus, the proxy is a good indicator of
whether ESR policies have improved quality, increase access to hitherto derived areas, and/or
whether the population of those already connected have increased over time.
a
The data is being archived and provided to researchers by the National Oceanic and Atmospheric
Administration (NOAA) at its National Geophysical Data Centre. b For further discussion, see Ahlborg et al. (2015).
c For further shortcomings of this data, see Doll and Pachauri (2010).
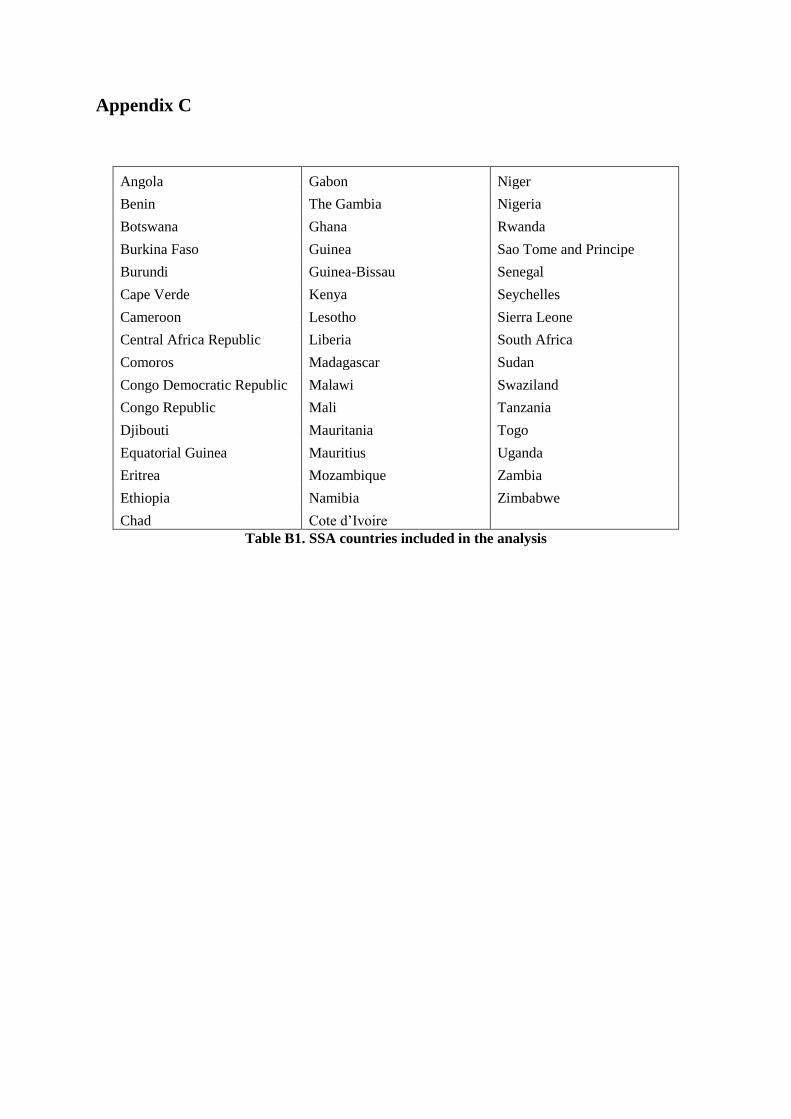
Appendix C
Angola Gabon Niger
Benin The Gambia Nigeria
Botswana Ghana Rwanda
Burkina Faso Guinea Sao Tome and Principe
Burundi Guinea-Bissau Senegal
Cape Verde Kenya Seychelles
Cameroon Lesotho Sierra Leone
Central Africa Republic Liberia South Africa
Comoros Madagascar Sudan
Congo Democratic Republic Malawi Swaziland
Congo Republic Mali Tanzania
Djibouti Mauritania Togo
Equatorial Guinea Mauritius Uganda
Eritrea Mozambique Zambia
Ethiopia Namibia Zimbabwe
Chad Cote d’Ivoire
Table B1. SSA countries included in the analysis

Appendix D: Robustness Analyses
It is possible that the coefficient estimates in Tables 4, 5 and 6 may suffer from omitted-
variable bias. Here we check the robustness of our results by adding additional explanatory
variables in the model, one at a time to both the performance and growth equations to see if
this would significantly affect the results.
Cubbin and Stern (2006) argue that a rapid growing share of industrial output (e.g., in heavy
industry such as petrochemicals, aluminium, manufacturing) is expected to increase the
demand for electricity. Similarly, Kaldor (1970) and Cornwall (1977) argue that expansion of
the industrial sector is a driving force for economic development. Thus, excluding this
variable (ind) from both the performance and growth equations could, potentially, lead to
biased estimates of the effects of ESR and corruption on the three indicators of performance.
We therefore include the share of industrial value added as a percentage of GDP as an
additional regressor in three equations. Several authors also find the degree of openness of an
economy to influence electricity sector performance (e.g., Zhang et al., 2008). We also
include exports (export) as percentage of GDP as an additional regressor in the performance
equation. The data for export is obtained from the World Bank governance indicators
database.
Furthermore, several studies include a variable measuring population density to assess the
ability of both public and private utilities to extend cheap and affordable electricity to
populations spread over vast areas (e.g., Ahlborg et al., 2015; Estache et al., 2009; Min,
2010). The data is from the World Bank development indicators database.
Results of this exercise are presented in Tables D1, D2 and D3. Columns 1, 3 and 5 of each
table presents the parameter estimates of the models when ind, export and popden are added,
one at time, as an additional regressors to the three performance regressions. The coefficients
of cor, ira, priv remained significant/not significant depending on the performance indicator
with the expected signs regardless of the additional regressors added to the three equations.
Similarly, the two interactions of interest (iraXcor and priXcor) remain significant/not
significant regardless of extra additions to the three regressions.
Therefore, the additional inclusions do not significantly alter the estimates of the coefficients
for cor, ira and priv. More importantly, the structure of the two interaction terms (iraXcor
and privXcor) estimates remain remarkably stable regardless of which of the variables is
added to the performance estimations. These results seem to indicate that the estimates
presented in Tables 4, 5 and 6 are not suffering from omitted-variable bias.
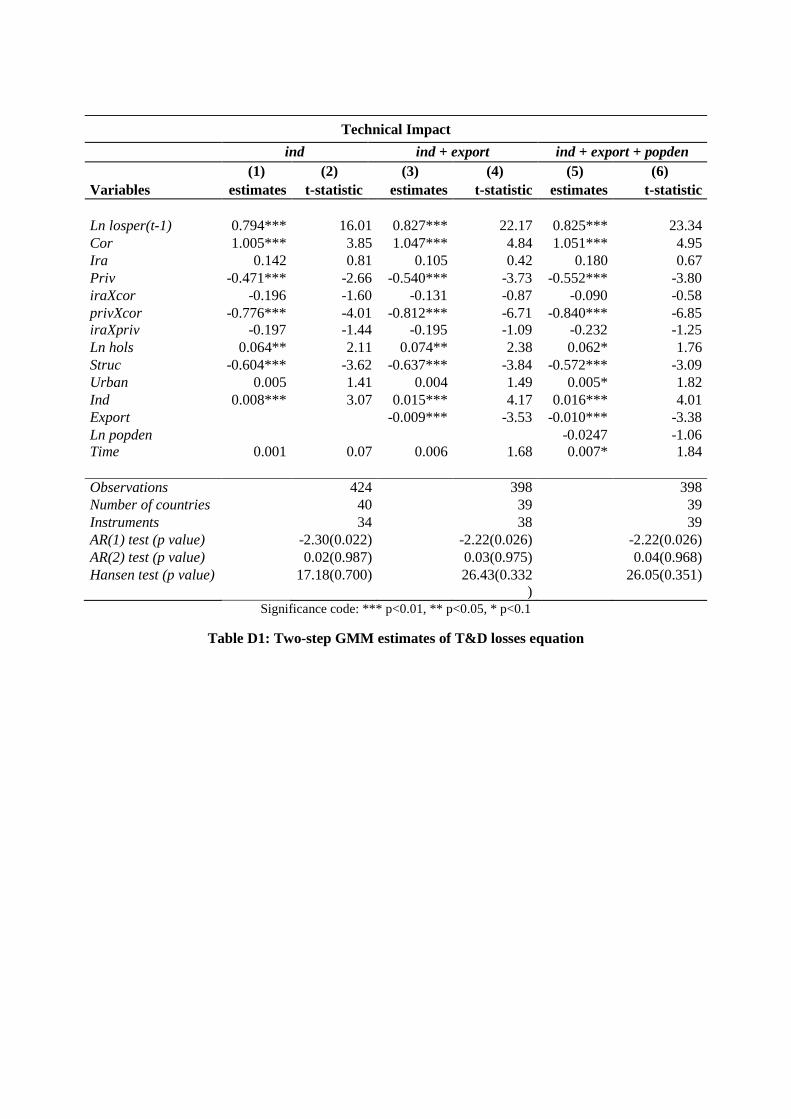
Technical Impact
ind ind + export ind + export + popden
(1) (2) (3) (4) (5) (6)
Variables estimates t-statistic estimates t-statistic estimates t-statistic
Ln losper(t-1) 0.794*** 16.01 0.827*** 22.17 0.825*** 23.34
Cor 1.005*** 3.85 1.047*** 4.84 1.051*** 4.95
Ira 0.142 0.81 0.105 0.42 0.180 0.67
Priv -0.471*** -2.66 -0.540*** -3.73 -0.552*** -3.80
iraXcor -0.196 -1.60 -0.131 -0.87 -0.090 -0.58
privXcor -0.776*** -4.01 -0.812*** -6.71 -0.840*** -6.85
iraXpriv -0.197 -1.44 -0.195 -1.09 -0.232 -1.25
Ln hols 0.064** 2.11 0.074** 2.38 0.062* 1.76
Struc -0.604*** -3.62 -0.637*** -3.84 -0.572*** -3.09
Urban 0.005 1.41 0.004 1.49 0.005* 1.82
Ind 0.008*** 3.07 0.015*** 4.17 0.016*** 4.01
Export -0.009*** -3.53 -0.010*** -3.38
Ln popden -0.0247 -1.06
Time 0.001 0.07 0.006 1.68 0.007* 1.84
Observations 424 398 398
Number of countries 40 39 39
Instruments 34 38 39
AR(1) test (p value) -2.30(0.022) -2.22(0.026) -2.22(0.026)
AR(2) test (p value) 0.02(0.987) 0.03(0.975) 0.04(0.968)
Hansen test (p value) 17.18(0.700) 26.43(0.332
)
26.05(0.351)
Significance code: *** p<0.01, ** p<0.05, * p<0.1
Table D1: Two-step GMM estimates of T&D losses equation

Welfare Impact
ind ind + export ind + export + popden
(1) (2) (3) (4) (5) (6)
Variables Est. t-stat. Est. t-stat. Est. t-stat.
Ln access(t-1) 0.912*** 30.64 0.936*** 33.68 0.854*** 13.52
cor -0.300*** -4.16 -0.208*** -2.83 -0.195** -2.01
1ra 0182*** 3.40 0.130** 2.19 0.299*** 3.51
Priv 0.109 1.28 -0.006 -0.15 0.188 1.40
iraXcor 0.210*** 3.18 0.222*** 3.86 0.198** 2.42
privXcor 0.128 1.41 0.020 0.59 0.126 1.07
iraXpriv -0.022 -0.27 0.047 0.78 -0.142 -1.40
Ln genper 0.123*** 3.93 0.050*** 2.33 0.173*** 6.04
Ln gdpper 0.001 0.03 0.071* 1.91 0.034 0.50
struc -0441 -1.21 -0.053 -0.70 -0.005 -0.03
urban 0.001 0.38 -0.001 -1.30 0.001 0.43
ind -0.013*** -4.28 -0.004** -2.47 -0.006*** -2.89
export 0.002** 2.22 0.002** 2.49
Ln popden 0.029 0.41
time -0.000 -0.27 0.000 0.41 -0.002 -0.56
Observations 480 454 452
Number of countries 45 44 44
Instruments 62 63 72
AR(1) test (p value) -4.12(0.000) -4.12(0.000) -3.91(0.000)
AR(2) test (p value) -1.49(0.137) --1.43(0.153) -1.36(0.174)
Hansen test (p value) 32.96(0.952) 31.45(0.969) 31.37(0.997)
Significance code: *** p<0.01, ** p<0.05, * p<0.1
Table D2: Two-step GMM estimates of per capita energy consumption equation

Economic impact
Ind ind + export ind + export + popden
(1) (2) (3) (4) (5) (6)
Variables Est. t-stat. Est. t-stat. Est. t-stat.
Ln gdpper(t-1) 0.947*** 71.26 0.860*** 25.70 0.934*** 30.57
cor -0.087** -2.20 -0.086** -2.17 -0.137*** -3.57
ira 0.018 0.84 0.030 1.02 0.054 1.32
priv 0.158*** 4.50 0.213*** 6.35 0.169*** 5.65
iraXcor -0.041 -1.38 -0.059 -1.08 -0.007 -0.24
privXcor 0.167*** 4.64 0.223*** 7.48 0.155*** 3.69
iraXpriv -0.050*** -2.62 -0.046 -1.31 -0.035 -1.14
Ln comper 0.014* 1.93 0.009 1.02 0.007 0.56
struc 0.015 1.49 0.063*** 3.29 0.020 0.69
urban 0.000 0.50 0.003*** 3.23 0.000 0.03
ind 0.001 1.27 -0.001** -2.21 -0.001* -1.80
export 0.004*** 8.80 0.004*** 10.11
Ln popden -0.014 -0.76
time -0.001*** -3.42 -0.002*** -3.07 -0.003*** -5.57
Observations 480 458 452
Number of countries 45 44 44
Instruments 41 62 71
AR(1) test (p value) -3.09(0.002) -2.97(0.003) -3.04(0.002)
AR(2) test (p value) -1.58(0.113) -1.55(0.121) -1.44(0.149)
Hansen test (p value) 21.72(0.794) 28.60(0.988) 33.73(0.992)
Significance code: *** p<0.01, ** p<0.05, * p<0.1
Table D3. Two-step GMM Estimates of Income Growth Equation
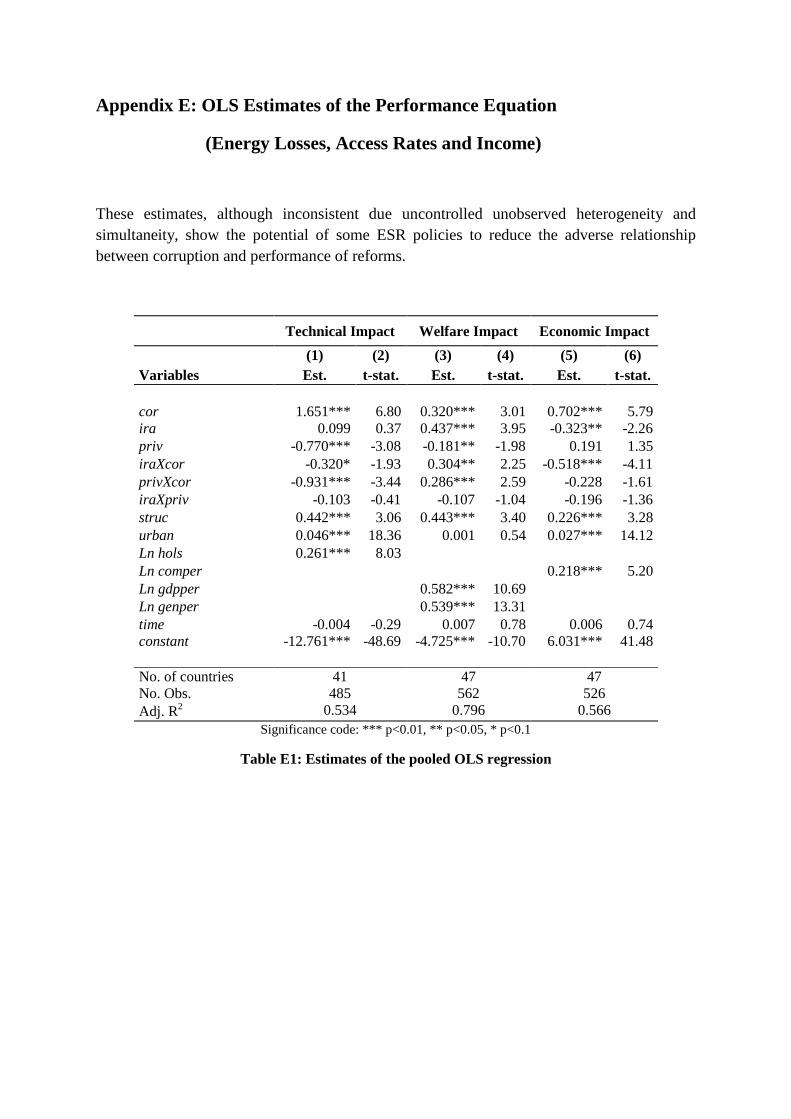
Appendix E: OLS Estimates of the Performance Equation
(Energy Losses, Access Rates and Income)
These estimates, although inconsistent due uncontrolled unobserved heterogeneity and
simultaneity, show the potential of some ESR policies to reduce the adverse relationship
between corruption and performance of reforms.
Technical Impact Welfare Impact Economic Impact
(1) (2) (3) (4) (5) (6)
Variables Est. t-stat. Est. t-stat. Est. t-stat.
cor 1.651*** 6.80 0.320*** 3.01 0.702*** 5.79
ira 0.099 0.37 0.437*** 3.95 -0.323** -2.26
priv -0.770*** -3.08 -0.181** -1.98 0.191 1.35
iraXcor -0.320* -1.93 0.304** 2.25 -0.518*** -4.11
privXcor -0.931*** -3.44 0.286*** 2.59 -0.228 -1.61
iraXpriv -0.103 -0.41 -0.107 -1.04 -0.196 -1.36
struc 0.442*** 3.06 0.443*** 3.40 0.226*** 3.28
urban 0.046*** 18.36 0.001 0.54 0.027*** 14.12
Ln hols 0.261*** 8.03
Ln comper 0.218*** 5.20
Ln gdpper 0.582*** 10.69
Ln genper 0.539*** 13.31
time -0.004 -0.29 0.007 0.78 0.006 0.74
constant -12.761*** -48.69 -4.725*** -10.70 6.031*** 41.48
No. of countries 41
485
0.534
47
562
0.796
47
526
0.566
No. Obs.
Adj. R2
Significance code: *** p<0.01, ** p<0.05, * p<0.1
Table E1: Estimates of the pooled OLS regression