power system engineering - rowan...
TRANSCRIPT

Power System Engineering
Robert R. KrchnavekRowan University
Glassboro, New Jersey

IntroductionRobert R. Krchnavek
Rowan UniversityGlassboro, New Jersey

Objectives
• Gain an understanding of how the electric grid originated – brief history of power.
• Understand some of the challenges facing the U.S. with respect to power generation, transmission, distribution, and reliability.

Electricity Generation, Transmission,
Distribution
Source: http://www.eia.gov/energyexplained/index.cfm?page=electricity_delivery

A Brief History• Numerous references on the subject including
video documentaries.
• We will consider the following: http://inventors.about.com/od/timelines/a/electricity_timeline.htm
• Earliest systems were DC, not AC.
• Common problem: different electrical applications required different voltages.
• Edison vs Westinghouse – “War of Currents” http://en.wikipedia.org/wiki/War_of_Currents

DC Systems
• Because different devices required different voltages, several different generating facilities were required.
• Power loss along the transmission lines was significant so generating facilities needed to be close by.
• What is the problem with DC?
• Is there anything better with DC vs AC?

AC Systems
• The ability for an AC system to easily change voltages (transformers) made AC the system of choice.
• Why does a higher voltage produce less power loss?
• Is this equally important today?

What has happened since the early days?
• Early 1900s, over 4000 isolated electric utilities.
• Post WWII, utilities started to interconnect.
• Eventually, there were 3 large interconnected systems.
• The 3 interconnected systems have over 3200 distribution utilities, 10,000 generating facilities, and tens of thousands of transmission and distribution lines.
• The North American Electric Reliability Corporation (NERC) sets standards, mandatory procedures, guarantees supply, and maintains security under the oversight of U.S. DOE and Federal Energy Regulatory Commission.

Source: http://www.eia.gov/energy_in_brief/power_grid.cfm
The “National” Power Grid

Major Challenges
• New transmission lines – NIMBY !
• Economic recovery for transmission lines crossing one area to serve another.
• Interconnecting remote but large renewable generation facilities.
• Addressing uncertainty in the Federal regulatory process for cost of upgrading the grid.

Regulation and Infrastructure
• The terminology and abbreviations related to the grid are confusing.
• This must be understood from a business and policy perspective.
• We will concentrate on the technical aspects.
Source: Energy Information Adminsitration. Map shows NERC (North American Electric Reliability Corporation) regions.
Source: http://www.ferc.gov/industries/electric/indus-act/rto.asp

Some interesting information ....

Energy Use

Energy Consumption/Source

Power Flow in North America
Source: http://www.eia.gov/todayinenergy/detail.cfm?id=4270

Sources of Electric Energy

Renewables

Electricity in Homes

Cost of Electricity

Future Demand Growth
Source: http://www.eia.gov/forecasts/archive/aeo11/MT_electric.cfm
A 1% demand growth from 2009-2035 results
in a 31% increase in demand for electricity.

Fuel for Electricity Generation Projections
Source: http://www.eia.gov/forecasts/archive/aeo11/MT_electric.cfm

Residential Use and Commercial Growth Projections
Source: http://www.eia.gov/forecasts/archive/aeo11/MT_electric.cfm

Summary• Electrical energy use continues to grow in the U.S. and
an annual rate of ≈1%. (International growth is larger.)
• Even at this modest growth rate, the demand will increase by ≈30% by 2035.
• The national grid will require significant upgrades to meet this additional demand.
• New generating facilities, higher transmission voltages, distributed generation, smart grid, and increased security will all be required in the future.

FundamentalsRobert R. Krchnavek
Rowan UniversityGlassboro, New Jersey

Objectives
• Relearn/understand the use of phasors to analyze AC voltages and currents.
• Understand real, reactive, and complex powers and the significance of power factor.
• Develop a working knowledge of 3-phase systems including their fundamental advantages over single-phase systems.

Phasorsv(t) = Vm cos(!t+ �)
i(t) = Im cos(!t+ �)
For sinusoids, the root-mean-square value,sometimes called the effective value, is given by
Vrms = V =Vmp2
Irms = I =Imp2

Phasorsv(t) = <
hVme|(!t+�)
i= v(t) = Vm cos(!t+ �)
The phasor is a complex number that represents the magnitude and phase of the sinusoid.
To get back to the time domain, multiply by and take the real part:e|!t
v(t) = <⇥Ve|!t
⇤
V = Vme|� = Vm �

Instantaneous Power Resistor
p(t) = VmIm cos
2(!t+ �)
p(t) =1
2
VmIm {1 + cos [2(!t+ �)]}
p(t) = V I {1 + cos [2(!t+ �)]}
And the average power is simply
Note:
p(t) = v(t) i(t) = Vm cos(!t+ �) Im cos(!t+ �)
pavr = V I
IR =VR
R

Instantaneous Power Inductor
p(t) = v(t) i(t) = Vm cos(!t+ �) Im cos(!t+ � � 90
�)
p(t) =1
2
VmIm cos [2(!t+ �)� 90
�]
p(t) = V I sin [2(!t+ �)]
And the average power is simplypavr = 0
Note: IL =VL
|!L

Instantaneous Power Capacitor
p(t) = v(t) i(t) = Vm cos(!t+ �) Im cos(!t+ � + 90
�)
p(t) =1
2
VmIm cos [2(!t+ �) + 90
�]
p(t) = �V I sin [2(!t+ �)]
And the average power is simply
pavr = 0
Note: IC =VC1
|!C

Instantaneous Power General RLC Load
v(t)
i(t)
RLCcircuit
+–
v(t) = Vm cos(!t+ �)
i(t) = Im cos(!t+ �)
i(t) =v(t)
Z Z
p(t) = v(t)i(t) = Vm cos(!t+ �)Im cos(!t+ �)
p(t) = V IR {1 + cos [2(!t+ �)]}+ V IX sin [2(!t+ �)]
after some algebra . . . .
pR(t) pX(t)
where IR = I cos(� � �) and IX = I sin(� � �)

Real Poweris power dissipated in the resistance in the circuit.pR(t)
The average power, also called the real power or active power,
is given by
pavr = P = V IR = V I cos(� � �)

Power Factorcos(� � �)The term is the power factor.
� � � is the power factor angle.
Recall: v(t) = Vm cos(!t+ �)
i(t) = Im cos(!t+ �)
� � � is the angle between the voltage and current.
Inductive loads: voltage ( ) leads current ( ). Lagging power factor.
Capacitive loads: current ( ) leads voltage ( ). Leading power factor.
� �
� �
Note: By convention, the power factor is positive.

Reactive Poweris power absorbed in the reactive part of the circuit.pX(t)
Q = V IX = V I sin(� � �)
The average power is 0.
The magnitude of the reactive power is given by
Units: var which stands for volt-amperes-reactive.
Q is the reactive power.

Complex PowerInstead of working in the time domain with instantaneous power, we now switch to phasors and define Complex Power, S, for sinusoidal, steady-state circuits.
P = V I cos(� � �)
Q = V I sin(� � �)
S = P + |Q
S = V � I �� = V I � � � = VI⇤
S = V Ie|(���) = V e|�Ie�|�
S = V I cos(� � �) + |V I sin(� � �) =
V I [cos(� � �) + | sin(� � �)]

Complex Power
|S| = |VI⇤| = V I
Apparent power is given by
and has units of voltamperes or VA.
P = V I cos(� � �) W
Q = V I sin(� � �) var
S = V I VA
(� � �)
S =p
P 2 +Q2
(� � �) = tan�1(Q/P )
Q = P tan(� � �)
power factor = p.f. = cos(� � �) =P
S=
PpP 2
+Q2

Balanced 3-Phase Circuits
• Assuming ideal sources.
• Assuming ideal lines.
• Assuming loads are all equal.

Balanced 3-Phase Circuits Line-to-Neutral Voltages
• Ean, Ebn, and Ecn are line-to-neutral voltages.
• 120˚ out of phase.
• abc or positive sequence is when Ean leads Ebn by 120˚ and Ebn leads Ecn by 120˚.
• Could have a negative or acb sequence.
� �
�
Ean
Ebn
Ecnn
a
b
c
Ean = 480 0
Ebn = 480 �120
Ecn = 480 120
Ean
Ecn
Ebn
120˚
Phasor Diagram

Balanced 3-Phase Circuits Line-to-Line Voltages
� �
�
Ean
Ebn
Ecnn
a
b
c
Ean � Eab � Ebn = 0
Eab = Ean � Ebn
Eab = 480 0� 480 �120 =p3 480 30
Similarly,
Ebc =p3 480 �90
Eca =p3 480 150
The line-to-line voltages in a balanced, 3Φ, Y-connected positive sequence are times the line-to-neutral voltages and 30˚ ahead.p
3

Balanced 3-Phase Circuits Phasor Representation
Ean
EabEca
Ebc
Ecn
Ebn
� �
�
Ean EabEbc
Eca
Ebn
Ecnn
a
b
c

Balanced 3-Phase Circuits Balanced Line Currents
Since we are neglecting line impedances, EnN = 0.
� �
�
EanZY
ZY
ZYEbn
Ecnn N
a
b
c C
A
B
Ic
Ia
In
Ib
Ia =Ean
ZY
Ib =Ebn
ZY
Ic =Ecn
ZY
In a balanced 3Φ circuit, the line currents are equal and the neutral current is 0.

Balanced 3-Phase Circuits Balanced ∆ Loads
� �
�
EanZ∆Z∆
Z∆Ebn
Ecnn
a
b
c
C A
B
Ic
ICA
IBC IAB
Ia
Ib
IAB =Eab
Z�Ia + ICA � IAB = 0
Ia = IAB � ICA
with similar expressions for the other currents ....
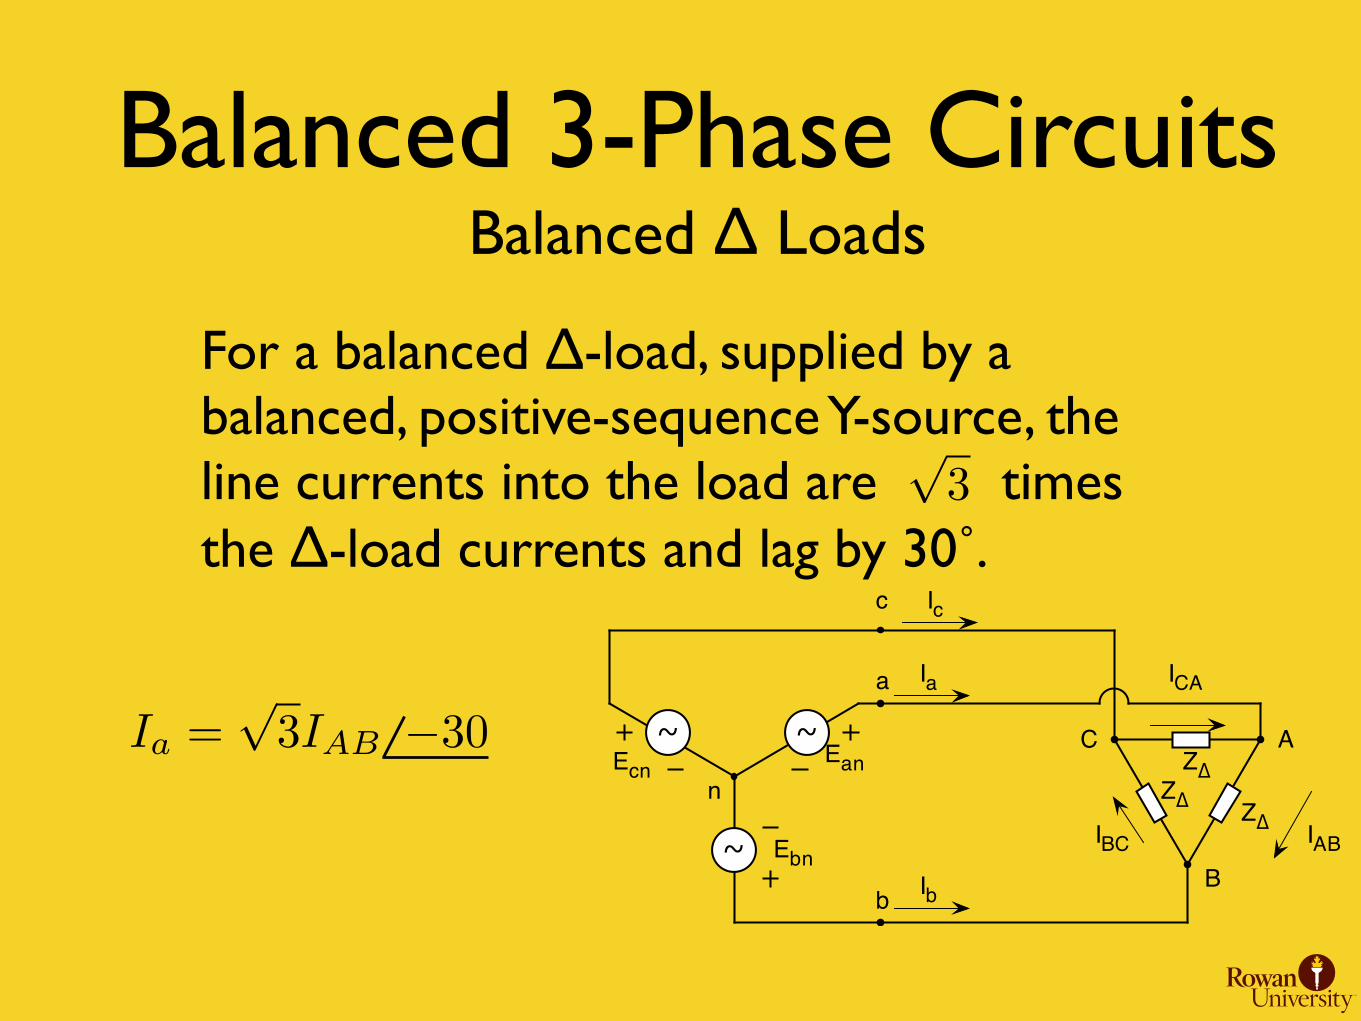
Balanced 3-Phase Circuits Balanced ∆ Loads
For a balanced ∆-load, supplied by a balanced, positive-sequence Y-source, the line currents into the load are times the ∆-load currents and lag by 30˚.
p3
Ia =p3IAB �30 � �
�
EanZ∆Z∆
Z∆Ebn
Ecnn
a
b
c
C A
B
Ic
ICA
IBC IAB
Ia
Ib

Δ-Y Conversion Balanced Loads
ZYZY
ZY
N
a
b
c C
A
B
Ic
Ia
Ib
Z∆Z∆
Z∆
a
b
c
C A
B
Ic
ICA
IBC IAB
Ia
Ib
For the loads to look equivalent from the source perspective, for equal applied line voltages, the line currents must be equal.
IA =EAN
ZY=
EAB �30p3ZY
IA =p3IAB �30 =
p3Eab �30
Z�
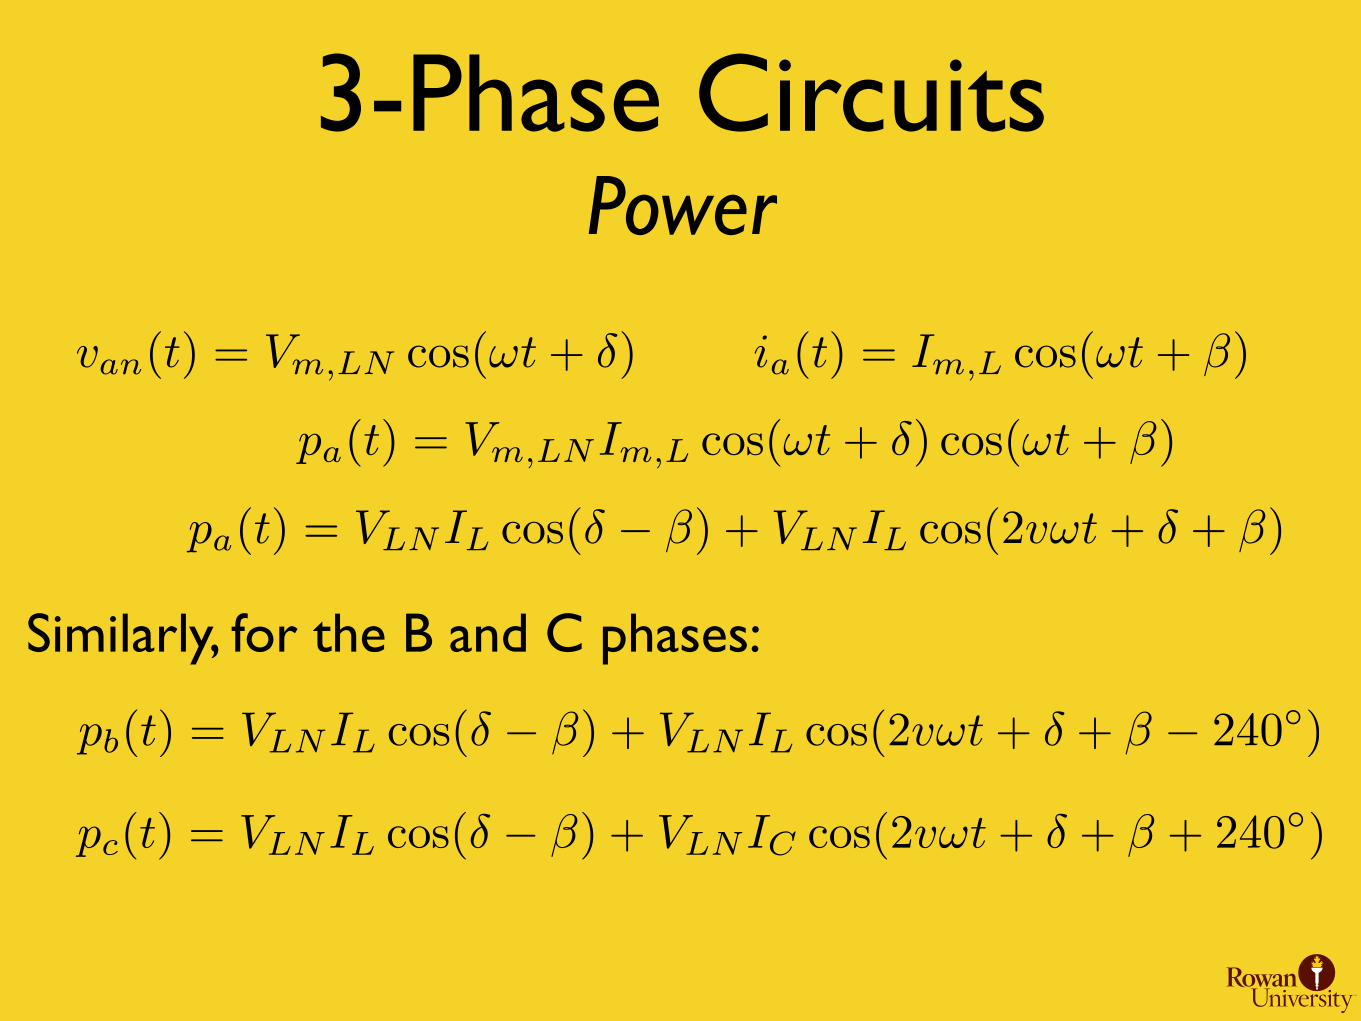
3-Phase Circuits Power
van(t) = Vm,LN cos(!t+ �) ia(t) = Im,L cos(!t+ �)
pa(t) = Vm,LNIm,L cos(!t+ �) cos(!t+ �)
pa(t) = VLNIL cos(� � �) + VLNIL cos(2v!t+ � + �)
Similarly, for the B and C phases:
pb(t) = VLNIL cos(� � �) + VLNIL cos(2v!t+ � + � � 240
�)
pc(t) = VLNIL cos(� � �) + VLNIC cos(2v!t+ � + � + 240
�)

3-Phase Circuits Power
The total power delivered by the source, as a function of time, is
ptotal
(t) = pa
(t) + pb
(t) + pc
(t) =
3VLNIL cos(� � �)+ VLNIL cos(2v!t+ � + �)+
VLNIL cos(2v!t+ � + � � 240
�)+
VLNIC cos(2v!t+ � + � + 240
�)
ptotal
(t) = 3VLN
IL
cos(� � �)
Constant power delivered as a function of time !

3-Phase Circuits Power
ptotal
(t) = 3VLN
IL
cos(� � �)
VLL =p3VLNRecall
ptotal
(t) =p3V
LL
IL
cos(� � �)
Note: Line-to-Line voltages are more common than Line-to-Neutral voltages.
Note: Refer to a textbook for a complex power analysis for generators and balanced Y and loads.�
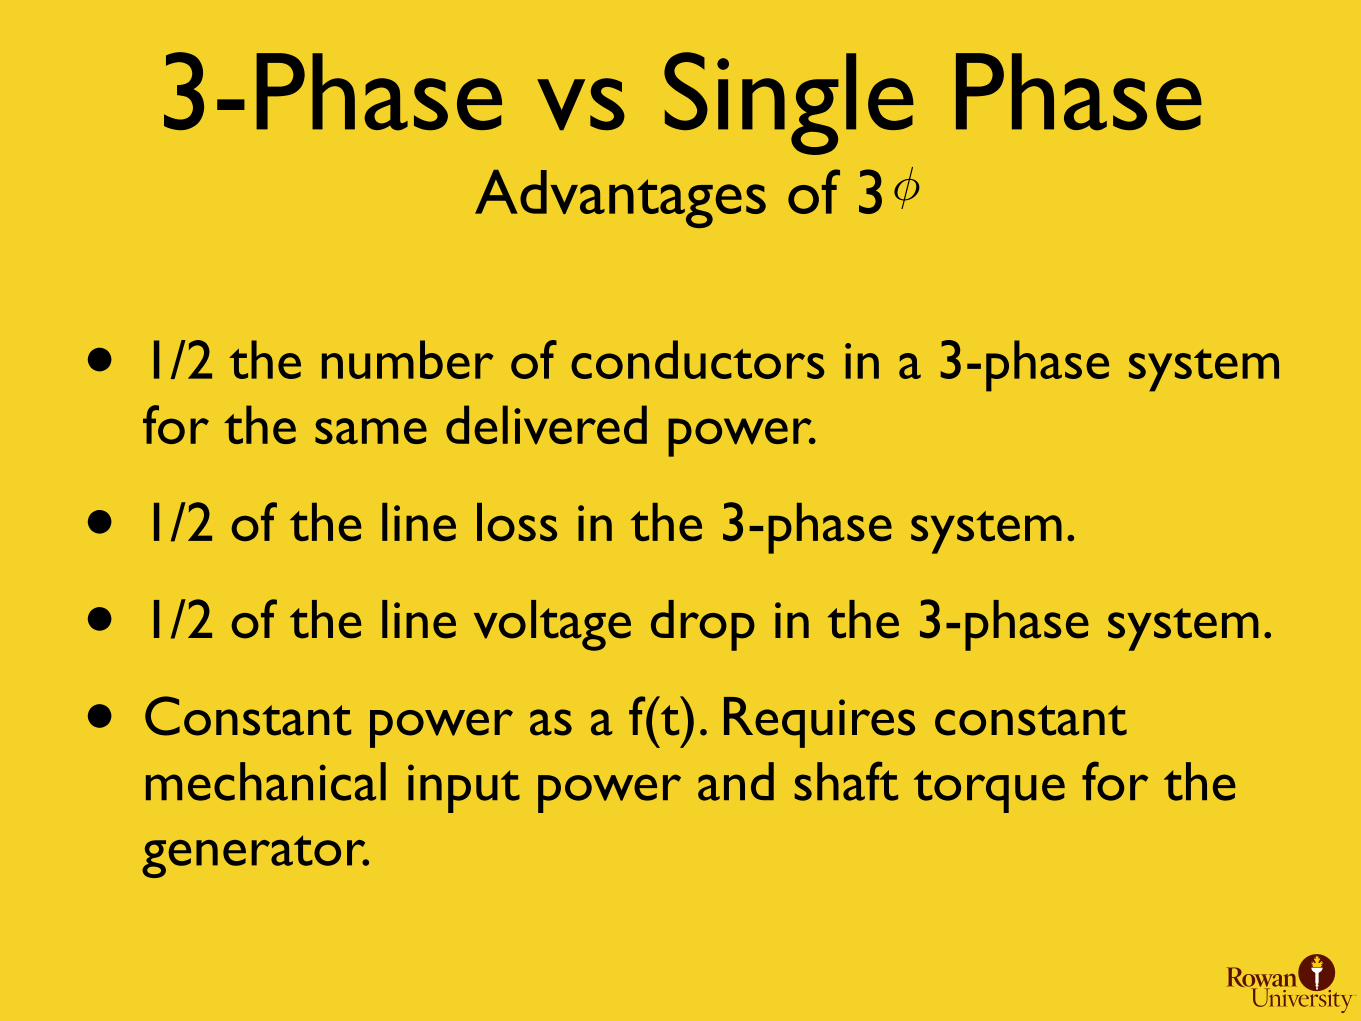
3-Phase vs Single Phase Advantages of 3
• 1/2 the number of conductors in a 3-phase system for the same delivered power.
• 1/2 of the line loss in the 3-phase system.
• 1/2 of the line voltage drop in the 3-phase system.
• Constant power as a f(t). Requires constant mechanical input power and shaft torque for the generator.
�

Summary• Phasors are the preferred method of
mathematically describing (linear) AC circuits.
• Real, reactive, and complex powers are useful concepts for describing an AC power system.
• The power factor is a measure of the phase relationship between voltage and current and therefore real and reactive power.
• Balanced 3-phase systems are common in AC power systems. There are numerous advantages over single-phase systems.