power transmission & distribution
TRANSCRIPT

POWER TRANSMISSION & DISTRIBUTION
An Overview
January 2021© The Pakistan Credit Rating Agency Limited.

TABLE OF CONTENTS
Contents Page No.
Energy Mix | A Comparison 1
Power | An Overview 2
Transmission - Structure 3
Transmission | NTDC & KE Network 4
Transmission | An Overview of Assets 5
Transmission | Issues | NTDC & KE 6
Transmission | Losses 7
Distribution | An Overview 8
Distribution | Industry Snapshot 9
Distribution | Assets 10
Contents Page No.
Electricity Consumption Trend 11
Electricity Distribution | DISCO Wise 12
DISCOs Performance Parameters 13
T&D Losses 14
DISCOs Average Recoveries 16
Build Up of End Tariffs 18
Circular Debt 19
Investment Plan for Transmission Lines 22
Business Risk 23
Financial Risk 24
Rating Curve 25
SWOT Analysis 26
Outlook 27
Source: BP Statistical Review of World Energy - 2020 1
POWER TRANSMISSION & DISTRIBUTION
ENERGY MIX | A Comparison
41% 38% 35% 35%
34% 34%31% 26%
7% 8%13% 15%
3% 6% 9% 11%11% 10% 8% 8%0% 0% 0% 0%
0%
10%
20%
30%
40%
50%
60%
70%
80%
90%
100%
FY16 FY17 FY18 FY19
Pakistan Fuel Mix
Gas Oil Coal LNG Import Hydro Nuclear Renewable LPG Imported Electricity
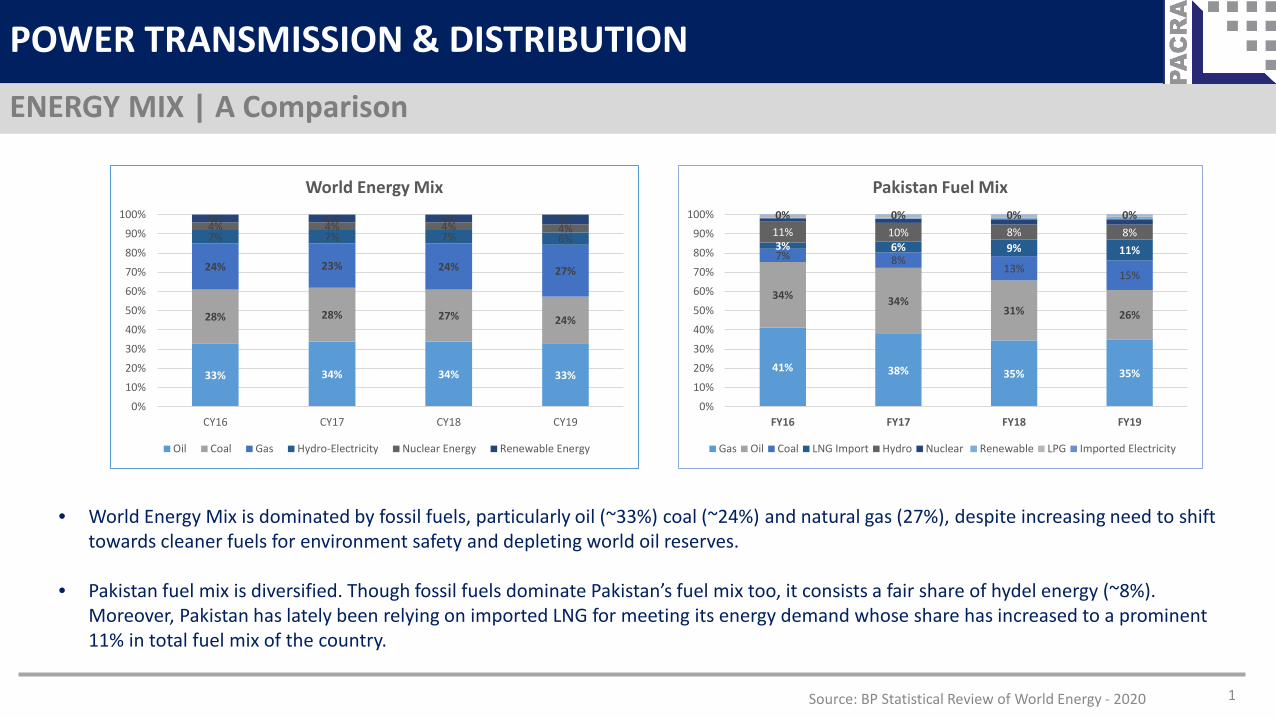
• World Energy Mix is dominated by fossil fuels, particularly oil (~33%) coal (~24%) and natural gas (27%), despite increasing need to shift towards cleaner fuels for environment safety and depleting world oil reserves.
• Pakistan fuel mix is diversified. Though fossil fuels dominate Pakistan’s fuel mix too, it consists a fair share of hydel energy (~8%). Moreover, Pakistan has lately been relying on imported LNG for meeting its energy demand whose share has increased to a prominent 11% in total fuel mix of the country.
33% 34% 34% 33%
28% 28% 27% 24%
24% 23% 24% 27%
7% 7% 7% 6%4% 4% 4% 4%4% 4% 4% 5%
0%
10%
20%
30%
40%
50%
60%
70%
80%
90%
100%
CY16 CY17 CY18 CY19
World Energy Mix
Oil Coal Gas Hydro-Electricity Nuclear Energy Renewable Energy
Source: Pakistan Energy Year Book and Pakistan Economic Survey 2
POWER TRANSMISSION & DISTRIBUTION
Overview
• Energy is the engine of all Sectors of the economy. Energy consumption needs are directly related to the GDP growth of a country. Pakistan’s GDP contracted by ~0.4% in FY20, owing to the unprecedented outbreak of Covid-19 pandemic (~1.2% growth in FY19).
• Pakistan’s primary energy supplies (forms of energy converted to final energy) comprise of oil, gas, coal, nuclear electricity and hydro-electricity net generation, while final energy products (converted from primary energy supplies) consist of gasoline, diesel, purified coal, purified gas, electricity and mechanical energy.
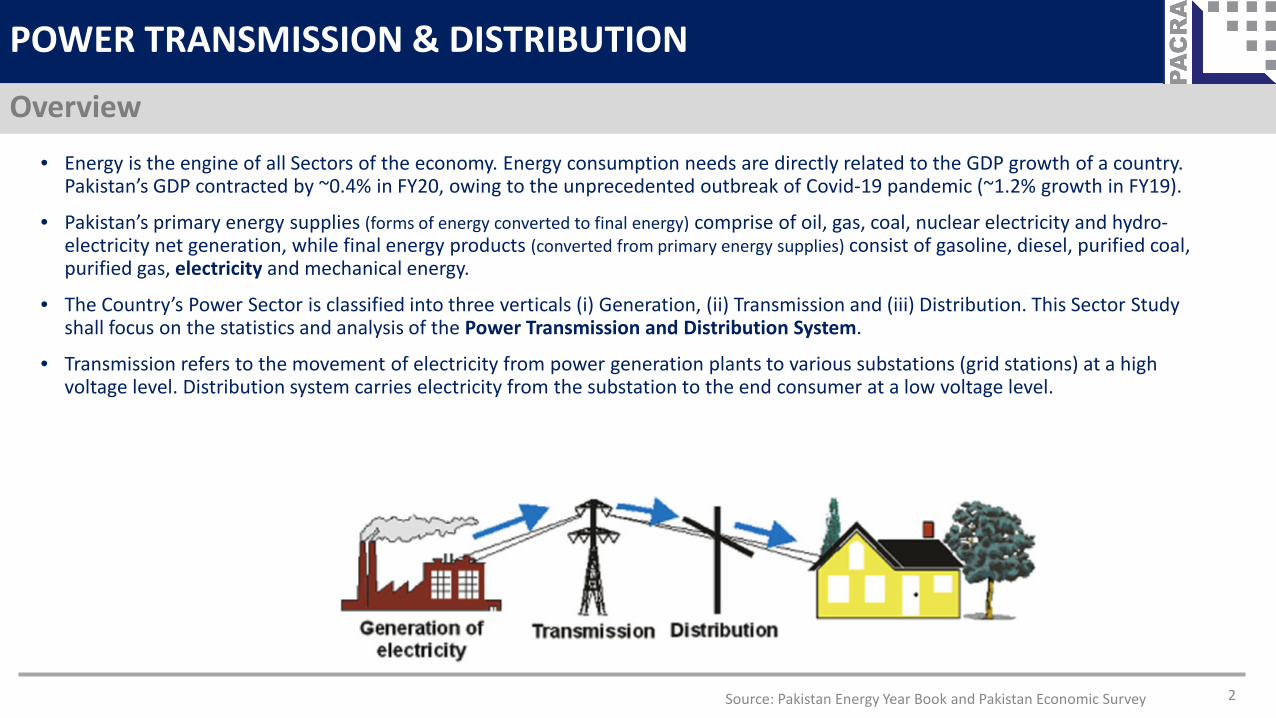
• The Country’s Power Sector is classified into three verticals (i) Generation, (ii) Transmission and (iii) Distribution. This Sector Study shall focus on the statistics and analysis of the Power Transmission and Distribution System.
• Transmission refers to the movement of electricity from power generation plants to various substations (grid stations) at a highvoltage level. Distribution system carries electricity from the substation to the end consumer at a low voltage level.
Source: NEPRA, NTDC 3
POWER TRANSMISSION & DISTRIBUTION
Transmission - Structure• A transmission grid is a network of power stations, transmission lines and substations. The transmission network ensures evacuation of power from the
generation plants to the load centers across the country.
• As per NEPRA Act, there can be only one National Grid Company (NGC) at national level at a particular time. National Transmission & Dispatch Company Limited (NTDC) is acting as NGC under license by NEPRA. NEPRA Act also allows setting up Special Purpose Transmission Lines, for which licenses are granted to private sector entities too. Alongside NTDC, K-Electric (KE) also operates under the license issued by NEPRA to carry out electricity transmission business within its service area.
• On Provincial Scale, the NEPRA (Amendment) Act, 2018, provides Provincial Governments the right to establish Provincial Grid Companies (PGCs). There can be only one PGC in a respective province at one time. So far, only Sindh Province has established a PGC – Sindh Transmission & Dispatch Company (STDC) which secured license from NEPRA in Nov, 2019.
NTDC – An Overview:• NTDC was incorporated as a Public Limited Company in Nov, 1998, after unbundling of WAPDA. It commenced its commercial operations in March,1999,
and was granted Transmission License by NEPRA in December, 2002 to engage in the exclusive transmission business for a period of thirty years. NTDC is responsible for evacuation of power from all types of power plants including hydro-electric power plants (mainly in the North), Thermal Public GENCOs and Private IPPs (mainly in the South) and supply to the Power Distribution Companies through primary (EHV) Network.
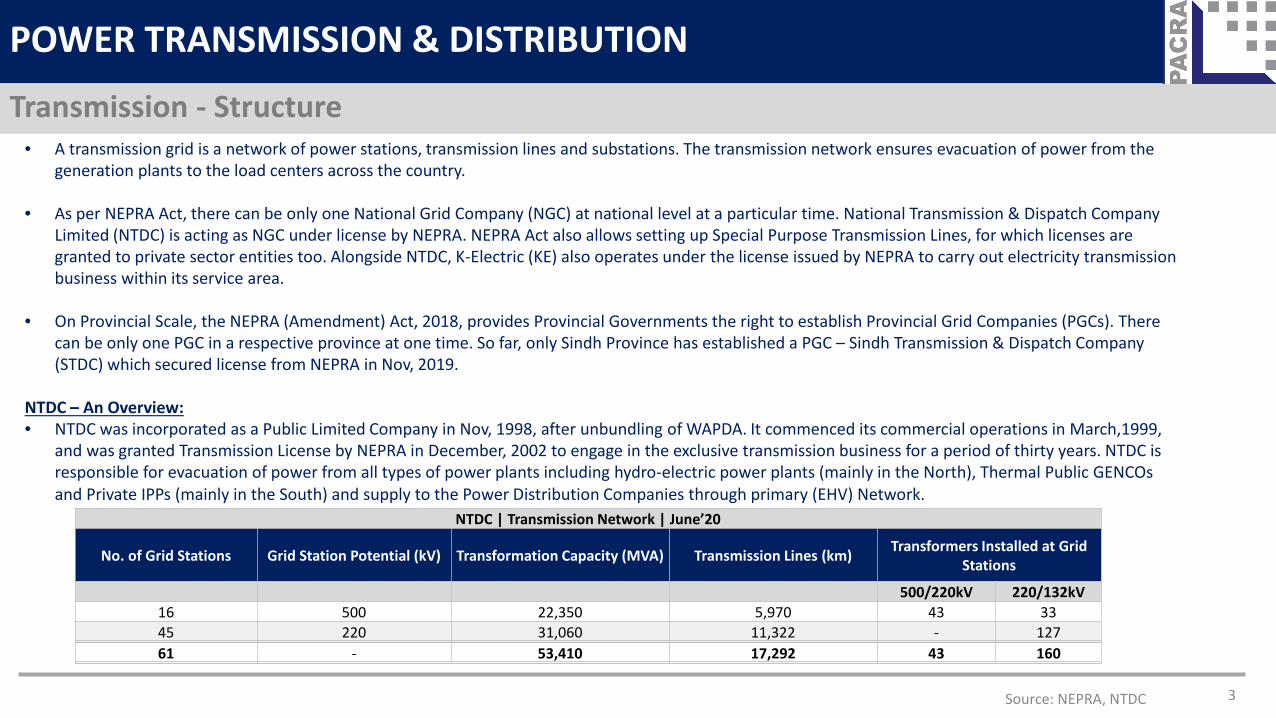
NTDC | Transmission Network | June’20
No. of Grid Stations Grid Station Potential (kV) Transformation Capacity (MVA) Transmission Lines (km) Transformers Installed at Grid Stations
500/220kV 220/132kV16 500 22,350 5,970 43 3345 220 31,060 11,322 - 12761 - 53,410 17,292 43 160

Source : NEPRA ‘State of the Industry Report’ 2020 4
POWER TRANSMISSION & DISTRIBUTION
Transmission | NTDC & KE
NTDC
Year Generation capability (MW)
Demand during peak hours (MW)
Surplus / (Deficit) (MW)
ActualFY16 17,261 22,559 -5,298FY17 19,020 25,117 -6,097FY18 23,766 26,741 -2,975FY19 24,565* 25,627* -1,062FY20 27,780* 26,252* 1,528
Projected
FY21 30,582 29,325 1,257FY22 32,989 30,921 2,068FY23 35,896 31,953 3,943FY24 37,918 33,696 4,222FY25 39,157 35,422 3,735
KE
Year Generation capability (MW)
Demand during peak hours (MW)
Surplus / (Deficit) (MW)
ActualFY16 2,860 3,195 -335FY17 2,920 3,270 -350FY18 3,008 3,527 -519FY19 3,196 3,530 -334FY20 3,202 3,604 -402
Projected
FY21 3,682 3,856 -174FY22 4,086 4,049 37FY23 4,511 4,252 259FY24 4,511 4,464 47FY25 4,830 4,687 143
• Up till recently, Pakistan’s installed capacity was not sufficient to fully meet the maximum demand of the country for a particular point in time. It was due to reasons such as auxiliary consumption, impact of site reference conditions and seasonality effects on the renewable and large hydropower plants. After accounting for these factors, the capacity known as ‘generation capability’ is effectively used for meeting the electricity demand. The generation capability on NTDC network has surpassed demand needs during peak hours in FY20, while KE projects are expected to achieve generation capability surplus in FY22.
*‘Generation capability’ is the maximum generation capability of any day recorded during the year and ‘Demand’ is the maximum demand of any day recorded during the year.

5
POWER TRANSMISSION & DISTRIBUTION
Transmission | An Overview of Assets
Source : NEPRA State of the Industry Report
0.3%
3%
6%
10%
5%
0.0%
2.0%
4.0%
6.0%
8.0%
10.0%
12.0%
-
5,000
10,000
15,000
20,000
FY16 FY17 FY18 FY19 FY20
NTDC Transmission Lines
Transmission Lines (km) | RHS Growth (RHS)
0.1%0.3%
0.1%
2%
3%
0.0%
0.5%
1.0%
1.5%
2.0%
2.5%
3.0%
1,200
1,220
1,240
1,260
1,280
1,300
1,320
1,340
FY16 FY17 FY18 FY19 FY20
KE Transmission Lines
Transmission Lines | (km) Growth
Grid Stations FY16 FY17 FY18 FY19 FY20
NTDC 50 52 58 61 61
KE 74 74 74 79 82
TOTAL 124 126 132 140 143
Grid Station Capacity (MVA) FY16 FY17 FY18 FY19 FY20
NTDC 42,190 43,760 43,350 53,920 55,300KE 8,732 8,797 9,211 10,296 11,610
TOTAL 50,922 52,557 52,561 64,216 66,910

6
POWER TRANSMISSION & DISTRIBUTION
Transmission | Issues | NTDC and KE
Source : NEPRA ‘State of the Industry Report’ 2020
Overloading of Power Transformers at Grid Stations:
• One of the key issues of Power Transmission System is the overloading of transformers against their rated capacity. This leads to forced outages on transmission lines. During FY20, the NTDC Network reflected overloading (~above 80% load) of around ~49% of 500/220kVtransformers and ~57% of 220/132kV transformers.
Outages on Transmission Lines:
• Another issue pertaining to the transmission system is the outage or suspension of electricity transmission. Outages can be planned (due to maintenance, inspection, load management) or forced (emergency reasons or unanticipated disruptions). A summary of outages intransmission networks for NTDC and KE (FY19 and FY20) is given below.
Year Description
NTDC K-Electric
Planned Outages Forced Outages Planned Outages Forced Outages
500kV 220kV 500kV 220kV 220kV 132kV 220kV 132kV
FY19No. of Outages 723 2,082 203 556 - 10 0 46Total duration in minutes 347,040 999,360 102,967 282,906 - 13,049 0 4,997Maximum duration of any single outage (Minutes) 14,400 156,960 17,308 18,228 - 3,723 0 469
FY20No. of Outages 547 1,774 131 360 - 5 2 35Total duration in minutes 262,560 851,520 74,446 183,176 - 3,417 673 3,823Maximum duration of any single outage (Minutes) 18,720 23,040 24,038 20,160 - 1,279 558 666
Overloading: >80%, Underutilization: <30%

7
POWER TRANSMISSION & DISTRIBUTION
Transmission Losses
Source : NEPRA State of the Industry Report
Transmission Losses (500/220kV) (GWh) FY16 FY17 FY18 FY19 FY20
Units Received 101,150 106,798 120,062 122,302 125,941Units Delivered 98,550 104,331 117,139 118,838 122,471Units Loss (R - D) 2,600 2,467 2,923 3,464 3,470% Loss in Transmission 2.57% 2.31% 2.43% 2.83% 2.76%
*This table refers to NTDC Losses only
• Transmission Loss refers to the loss of electricity during movement from a powerplant or power station to different substations.
• Transmission refers to the movement of electricity at high voltage. Losses during transmission are generally lower than those during distribution which carries electricity at lower voltage and larger distances to the end consumers.
• During FY20, transmission loss in NTDC Network of 500/220kV Grid Power was recorded at 3,470 GWh (~2.8% of the Units received by the System).
8
POWER TRANSMISSION & DISTRIBUTION
Distribution – An Overview• Distribution is one of the key functions for provision of electricity to the end consumers. As at End-June’20, there were ten State Owned
Distribution Companies (DISCOs) exclusively responsible for supply of electricity in their respective areas. These DISCOs are licensed by NEPRA. In addition, KE is also licensed to supply electricity in its designated areas. Following amendments in NEPRA Act in April 2018, separate licenses are required to be obtained for the supply of electricity and sale of electricity.
• Besides DISCOs and KE, some other local authorities such as DHA, Bahria Town and Industrial Estates Development Authority have also been granted the license to supply electricity in the territory specified in their respective distribution licenses.
A Brief Background:
• DISCOs and GENCOs were created in Pakistan as a result of WAPDA unbundling in order to restructure the power sector to improve efficiency and transform gradually into a competitive market. For this process to occur smoothly, the Pakistan Electric Company Pvt. Ltd. (PEPCO) was created in 1998 and assigned with the task to unbundle WAPDA into 8 DISCOs then, 4 GENCOs and NTDC. PEPCO is responsible for the management of all the affairs of Corporatized DISCOs, GENCOs and NTDC.
• From 2007 onwards, the Ministry of Water & Power notified NEPRA approved tariff for all DISCOs replacing unified WAPDA tariff.
Source : NEPRA State of the Industry Report, WAPDA
*Others include import from Iran and mixed fuels 9
POWER TRANSMISSION & DISTRIBUTION
Distribution – Industry Snapshot
Source : NEPRA ‘State of the Industry Report
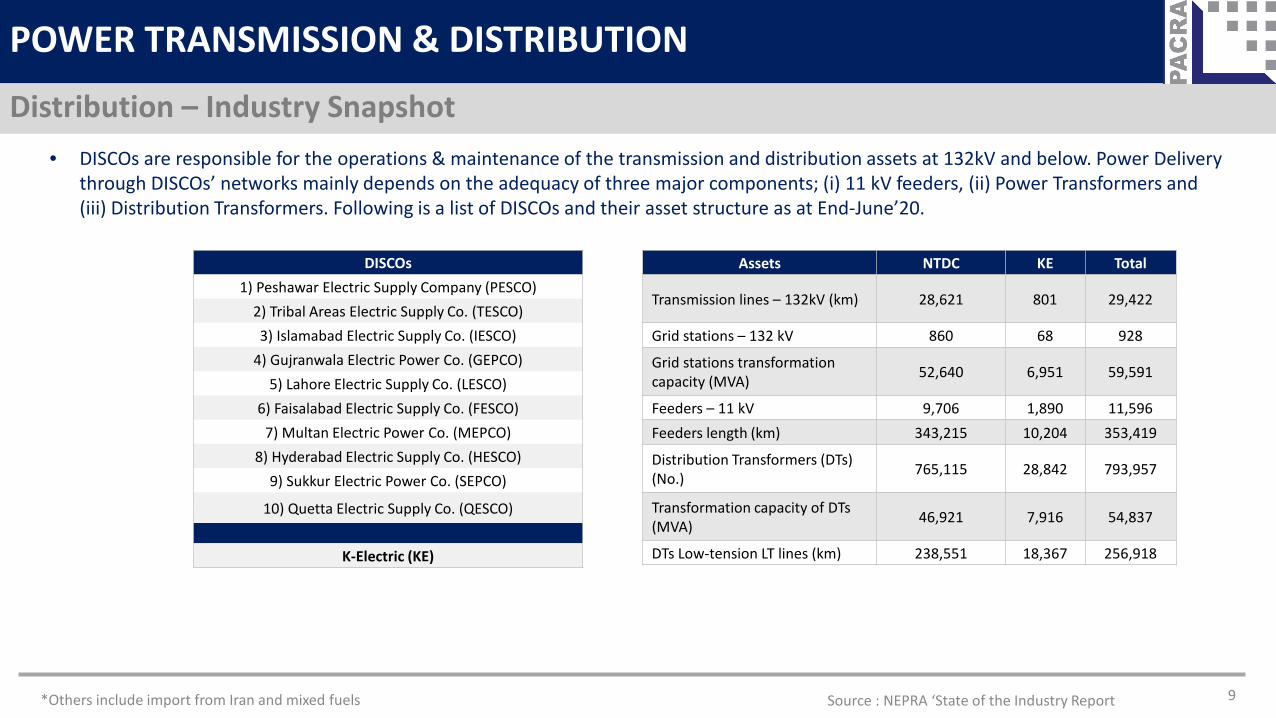
• DISCOs are responsible for the operations & maintenance of the transmission and distribution assets at 132kV and below. Power Delivery through DISCOs’ networks mainly depends on the adequacy of three major components; (i) 11 kV feeders, (ii) Power Transformers and (iii) Distribution Transformers. Following is a list of DISCOs and their asset structure as at End-June’20.
Assets NTDC KE Total
Transmission lines – 132kV (km) 28,621 801 29,422
Grid stations – 132 kV 860 68 928
Grid stations transformation capacity (MVA) 52,640 6,951 59,591
Feeders – 11 kV 9,706 1,890 11,596Feeders length (km) 343,215 10,204 353,419
Distribution Transformers (DTs) (No.) 765,115 28,842 793,957
Transformation capacity of DTs (MVA) 46,921 7,916 54,837
DTs Low-tension LT lines (km) 238,551 18,367 256,918
DISCOs1) Peshawar Electric Supply Company (PESCO)
2) Tribal Areas Electric Supply Co. (TESCO)3) Islamabad Electric Supply Co. (IESCO)
4) Gujranwala Electric Power Co. (GEPCO)5) Lahore Electric Supply Co. (LESCO)
6) Faisalabad Electric Supply Co. (FESCO)7) Multan Electric Power Co. (MEPCO)
8) Hyderabad Electric Supply Co. (HESCO)9) Sukkur Electric Power Co. (SEPCO)
10) Quetta Electric Supply Co. (QESCO)
K-Electric (KE)
Source: NEPRA State of the Industry Report 10
POWER TRANSMISSION & DISTRIBUTION
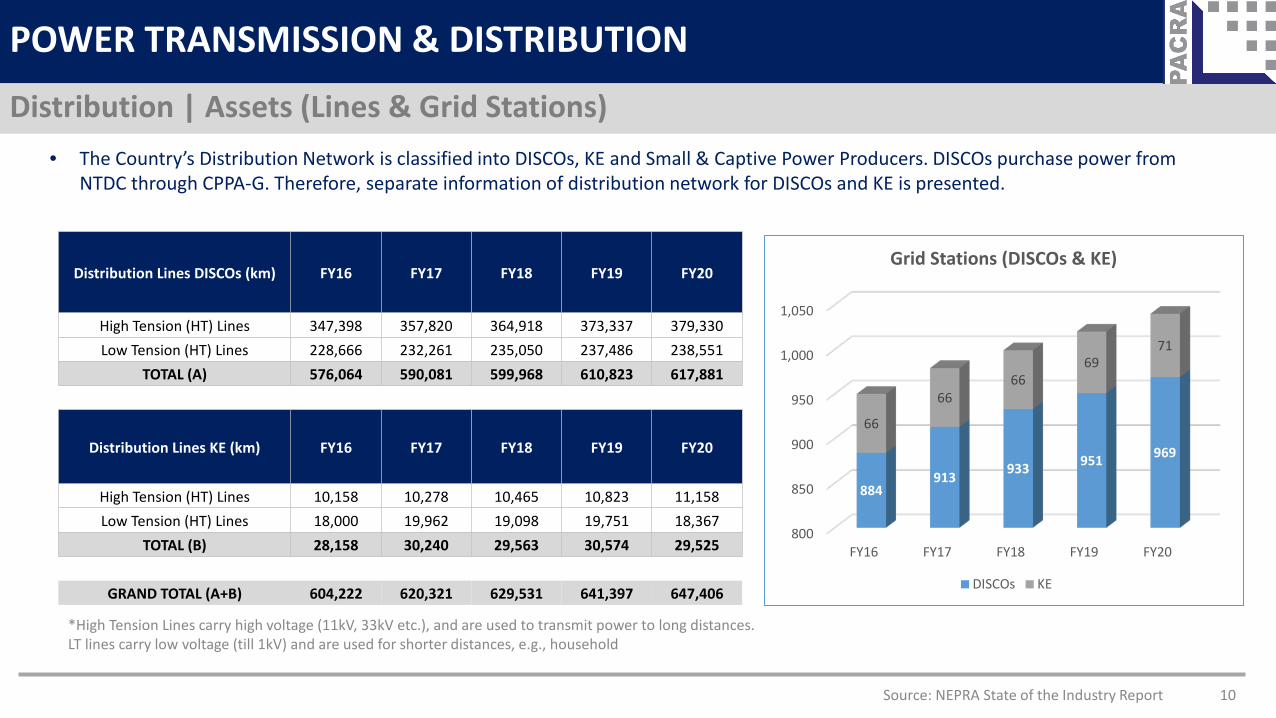
Distribution | Assets (Lines & Grid Stations)• The Country’s Distribution Network is classified into DISCOs, KE and Small & Captive Power Producers. DISCOs purchase power from
NTDC through CPPA-G. Therefore, separate information of distribution network for DISCOs and KE is presented.
Distribution Lines DISCOs (km) FY16 FY17 FY18 FY19 FY20
High Tension (HT) Lines 347,398 357,820 364,918 373,337 379,330 Low Tension (HT) Lines 228,666 232,261 235,050 237,486 238,551
TOTAL (A) 576,064 590,081 599,968 610,823 617,881
Distribution Lines KE (km) FY16 FY17 FY18 FY19 FY20
High Tension (HT) Lines 10,158 10,278 10,465 10,823 11,158 Low Tension (HT) Lines 18,000 19,962 19,098 19,751 18,367
TOTAL (B) 28,158 30,240 29,563 30,574 29,525
GRAND TOTAL (A+B) 604,222 620,321 629,531 641,397 647,406
*High Tension Lines carry high voltage (11kV, 33kV etc.), and are used to transmit power to long distances. LT lines carry low voltage (till 1kV) and are used for shorter distances, e.g., household
800
850
900
950
1,000
1,050
FY16 FY17 FY18 FY19 FY20
884913 933 951 969
66
6666
6971
Grid Stations (DISCOs & KE)
DISCOs KE

11
POWER TRANSMISSION & DISTRIBUTION
Electricity Consumption Trend
Source : NEPRA State of the Industry Report
-
5.00
10.00
15.00
20.00
25.00
30.00
35.00
FY16 FY17 FY18 FY19 FY20
22.80 23.94 25.30 26.76 28.25
3.26 3.36 3.49
3.62 3.72
0.02 0.02 0.11
0.21 0.23
Electricity consumers | No. in million
Household Commercial Industrial Agriculture Others
• Pakistan’s electricity consumption was recorded at ~112,070GWh in FY20 (down ~0.9% YoY).• Household/domestic consumers make up ~86% of the market share followed by commercial and Industrial connections (in Nos).
Electricity consumers refers to the number of electricity ‘connections’ and not individuals.
4.9%5.6%
11.3%
2.0%
-0.9%-2.0%
0.0%
2.0%
4.0%
6.0%
8.0%
10.0%
12.0%
80,000
85,000
90,000
95,000
100,000
105,000
110,000
115,000
FY16 FY17 FY18 FY19 FY20
Electricity Consumption Trend
GWh (LHS) Growth Rate (RHS)

12
POWER TRANSMISSION & DISTRIBUTION
Electricity Distribution – DISCO Wise
• Total number of electricity consumers as at End-June’20 was recorded at ~33mln. The largest consumer base is served by MEPCO, followed by LESCO, FESCO and GEPCO.
Source : NEPRA State of the Industry Report
0.00
1.00
2.00
3.00
4.00
5.00
6.00
7.00
MEPCO LESCO FESCO GEPCO PESCO IESCO KE HESCO SEPCO QESCO TESCO
6.86
5.194.40
3.72 3.653.12 2.96
1.14 0.79 0.64 0.44
DISCO Wise Electricity Consumers (in millions) - June'20
13
POWER TRANSMISSION & DISTRIBUTION
DISCOs Performance Parameters
Source : NEPRA State of the Industry Report, NEPRA Performance Evaluation Report for DISCOs
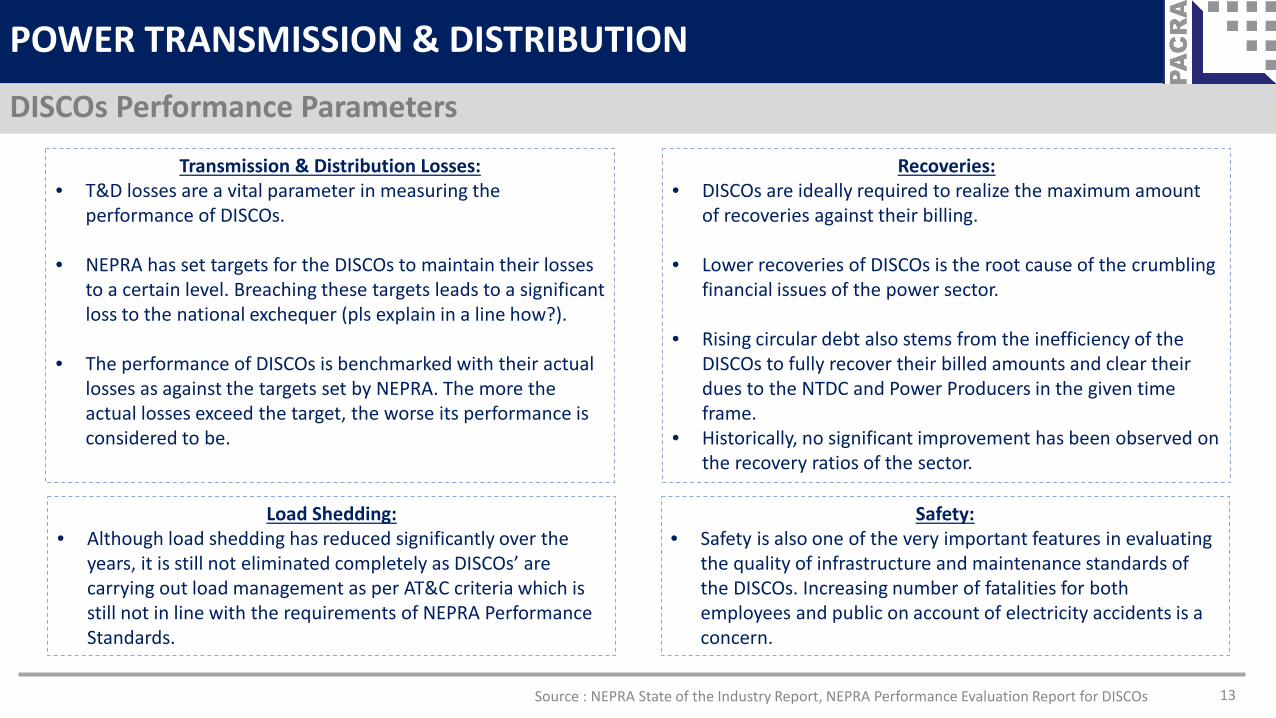
Transmission & Distribution Losses:• T&D losses are a vital parameter in measuring the
performance of DISCOs.
• NEPRA has set targets for the DISCOs to maintain their losses to a certain level. Breaching these targets leads to a significant loss to the national exchequer (pls explain in a line how?).
• The performance of DISCOs is benchmarked with their actual losses as against the targets set by NEPRA. The more the actual losses exceed the target, the worse its performance is considered to be.
Recoveries:• DISCOs are ideally required to realize the maximum amount
of recoveries against their billing.
• Lower recoveries of DISCOs is the root cause of the crumbling financial issues of the power sector.
• Rising circular debt also stems from the inefficiency of the DISCOs to fully recover their billed amounts and clear their dues to the NTDC and Power Producers in the given time frame.
• Historically, no significant improvement has been observed on the recovery ratios of the sector.
Load Shedding:• Although load shedding has reduced significantly over the
years, it is still not eliminated completely as DISCOs’ are carrying out load management as per AT&C criteria which is still not in line with the requirements of NEPRA Performance Standards.
Safety:• Safety is also one of the very important features in evaluating
the quality of infrastructure and maintenance standards of the DISCOs. Increasing number of fatalities for both employees and public on account of electricity accidents is a concern.
14
POWER TRANSMISSION & DISTRIBUTION
T&D Losses
Source : NEPRA State of the Industry Report
20.7%20.5%
20.9%
20.2%20.5%
22.2%
21.7%
20.3%
19.2%
19.8%
17.5%
18.0%
18.5%
19.0%
19.5%
20.0%
20.5%
21.0%
21.5%
22.0%
22.5%
FY16 FY17 FY18 FY19 FY20
Average T&D Losses (%)
DISCOs KE
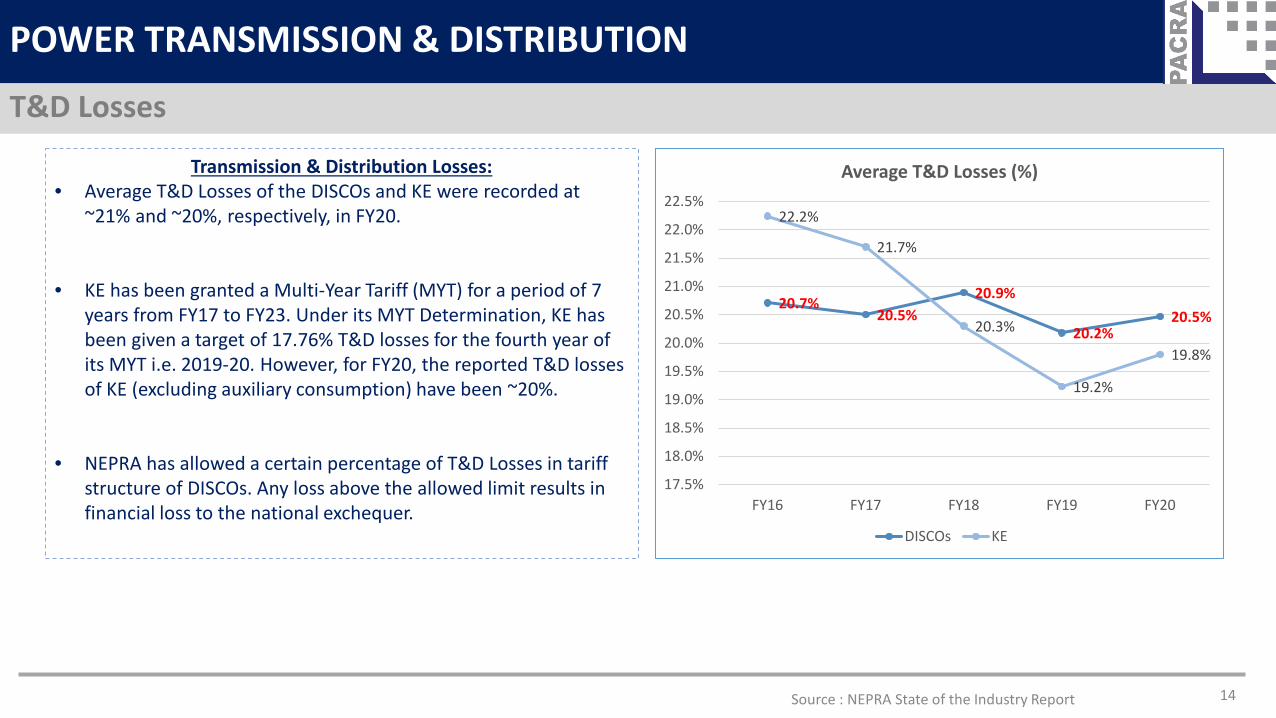
Transmission & Distribution Losses:• Average T&D Losses of the DISCOs and KE were recorded at
~21% and ~20%, respectively, in FY20.
• KE has been granted a Multi-Year Tariff (MYT) for a period of 7 years from FY17 to FY23. Under its MYT Determination, KE has been given a target of 17.76% T&D losses for the fourth year of its MYT i.e. 2019-20. However, for FY20, the reported T&D losses of KE (excluding auxiliary consumption) have been ~20%.
• NEPRA has allowed a certain percentage of T&D Losses in tariff structure of DISCOs. Any loss above the allowed limit results in financial loss to the national exchequer.
15
POWER TRANSMISSION & DISTRIBUTION
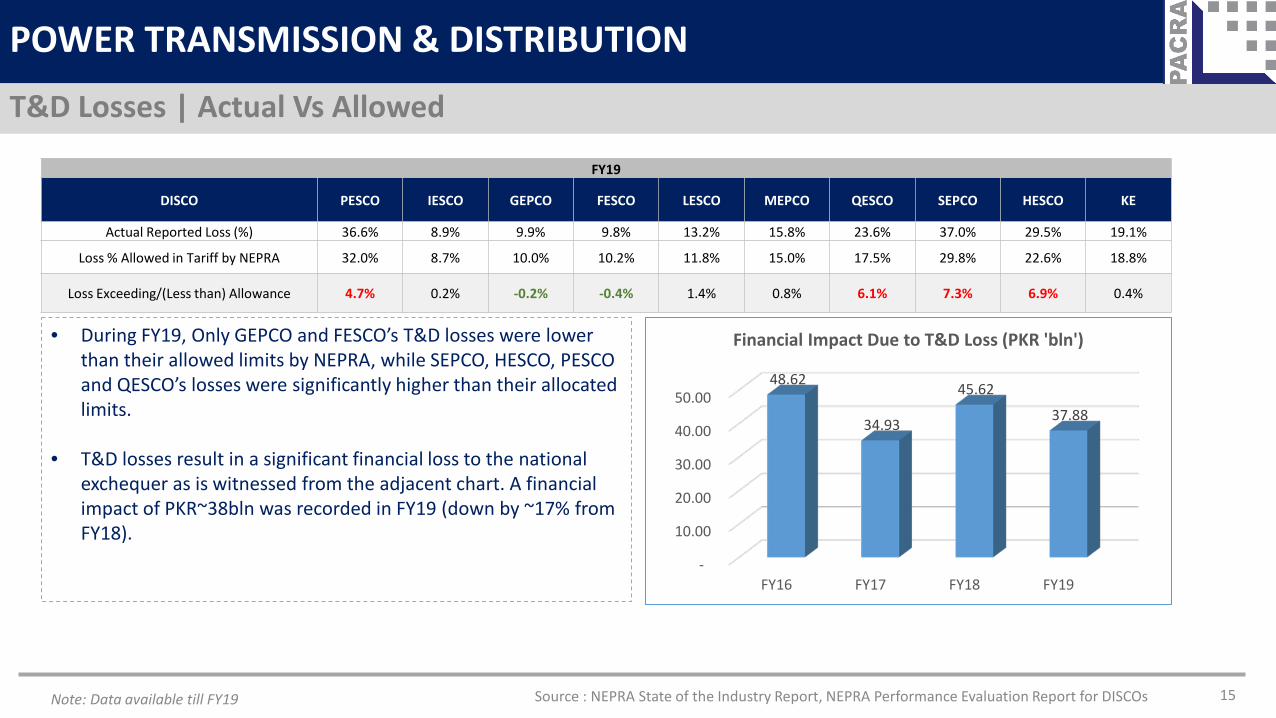
T&D Losses | Actual Vs Allowed
FY19
DISCO PESCO IESCO GEPCO FESCO LESCO MEPCO QESCO SEPCO HESCO KE
Actual Reported Loss (%) 36.6% 8.9% 9.9% 9.8% 13.2% 15.8% 23.6% 37.0% 29.5% 19.1%
Loss % Allowed in Tariff by NEPRA 32.0% 8.7% 10.0% 10.2% 11.8% 15.0% 17.5% 29.8% 22.6% 18.8%
Loss Exceeding/(Less than) Allowance 4.7% 0.2% -0.2% -0.4% 1.4% 0.8% 6.1% 7.3% 6.9% 0.4%
-
10.00
20.00
30.00
40.00
50.00
FY16 FY17 FY18 FY19
48.62
34.93
45.62
37.88
Financial Impact Due to T&D Loss (PKR 'bln')• During FY19, Only GEPCO and FESCO’s T&D losses were lower than their allowed limits by NEPRA, while SEPCO, HESCO, PESCO and QESCO’s losses were significantly higher than their allocated limits.
• T&D losses result in a significant financial loss to the national exchequer as is witnessed from the adjacent chart. A financial impact of PKR~38bln was recorded in FY19 (down by ~17% from FY18).
Source : NEPRA State of the Industry Report, NEPRA Performance Evaluation Report for DISCOsNote: Data available till FY19
16
POWER TRANSMISSION & DISTRIBUTION
DISCOs Average Recoveries
Source: NEPRA State of the Industry Report
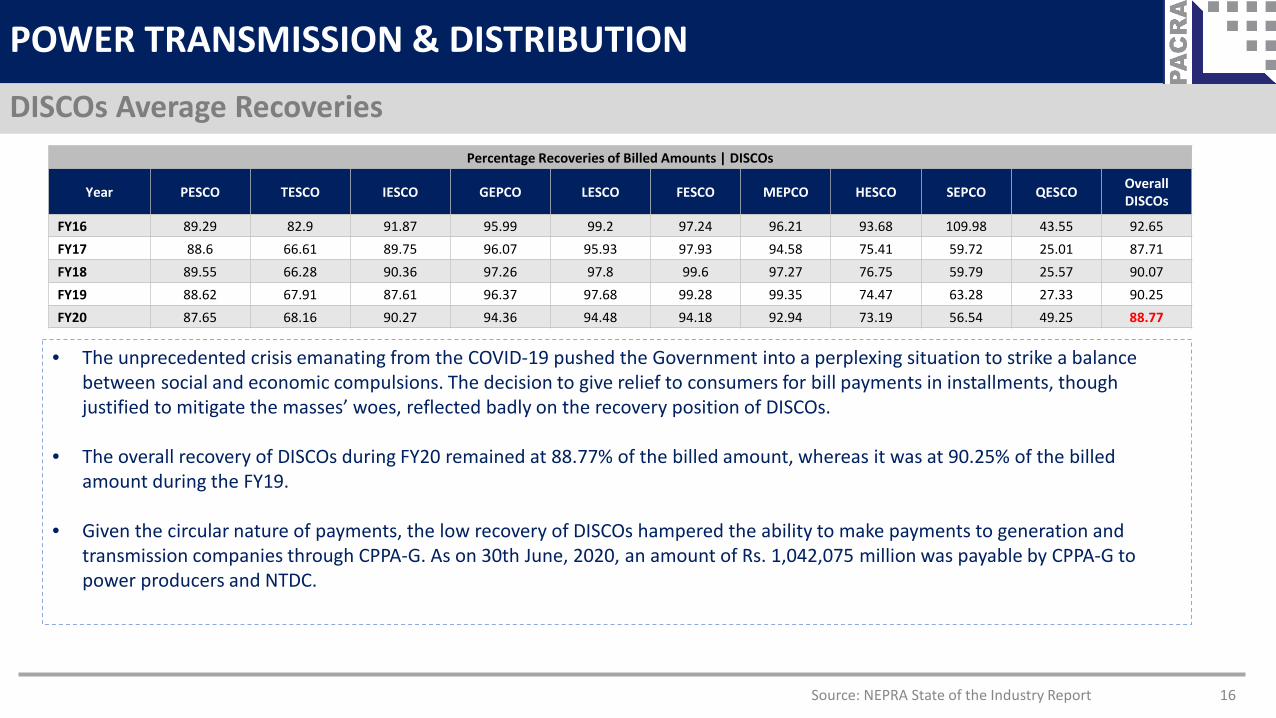
• The unprecedented crisis emanating from the COVID-19 pushed the Government into a perplexing situation to strike a balance between social and economic compulsions. The decision to give relief to consumers for bill payments in installments, though justified to mitigate the masses’ woes, reflected badly on the recovery position of DISCOs.
• The overall recovery of DISCOs during FY20 remained at 88.77% of the billed amount, whereas it was at 90.25% of the billed amount during the FY19.
• Given the circular nature of payments, the low recovery of DISCOs hampered the ability to make payments to generation and transmission companies through CPPA-G. As on 30th June, 2020, an amount of Rs. 1,042,075 million was payable by CPPA-G to power producers and NTDC.
Percentage Recoveries of Billed Amounts | DISCOs
Year PESCO TESCO IESCO GEPCO LESCO FESCO MEPCO HESCO SEPCO QESCO Overall DISCOs
FY16 89.29 82.9 91.87 95.99 99.2 97.24 96.21 93.68 109.98 43.55 92.65FY17 88.6 66.61 89.75 96.07 95.93 97.93 94.58 75.41 59.72 25.01 87.71FY18 89.55 66.28 90.36 97.26 97.8 99.6 97.27 76.75 59.79 25.57 90.07FY19 88.62 67.91 87.61 96.37 97.68 99.28 99.35 74.47 63.28 27.33 90.25FY20 87.65 68.16 90.27 94.36 94.48 94.18 92.94 73.19 56.54 49.25 88.77

17
POWER TRANSMISSION & DISTRIBUTION
Segment Wise Electricity Recoveries
86%
100% 97%
64%
81%
86%
11%
1% 1% 1% 0%
10%
20%
30%
40%
50%
60%
70%
80%
90%
100%
0%
20%
40%
60%
80%
100%
120%
Household Commercial Industrial Agriculture Others
Segment Wise Recoveries FY20 (%)
Percentage (%) Recoveries | RHS Share (%) in Electricity Consumption | LHS
• Average Recovery rate for FY20 was recorded at ~89% down by ~1.5% YoY. The decline was majorly witnessed due to the unprecedented Covid-19 crisis, due to which household consumers were given relief to defer their bill payments.
• Lowest recovery rate was, therefore, witnessed in agricultural recoveries (~64%) and recoveries from the household segment (~86%).
• Highest recovery ratio was recorded from commercial and industrial consumers (100% and 97%, respectively).
Source: NEPRA State of the Industry Report

18
POWER TRANSMISSION & DISTRIBUTION
The Build Up of End User Tariffs
Source : https://www.sbp.org.pk/reports/quarterly/fy19/Third/Special-Section-1.pdf
Components of End User Tariff• Power purchase price constitutes on average 65 percent of the end-
user tariff determined by NEPRA. The highest contribution to power purchase price comes from the capacity charge. Rising capacity payments recently have been the major contributing factor to the consistently high end-user tariffs.
• It is important to note that the tariff notified by the government to subsidize households consuming up to 200 units, is even lower than the price at which DISCOs procure electricity from the CPPA.
• T&D losses average around ~20% of the power tariff component, a significant share. The rest of the tariff component is majorly reflected by Distribution Margins of DISCOs and prior period adjustments.
60%20%
15%
5%
End User Tariff Break-up
Power Purchase Price T&D Losses
Distribution Margin Prior Year Adjustments
Note: Percentages are estimates and can vary according to DISCOs
Source: NEPRA State of the Industry Report 19
POWER GENERATION
CIRCULAR DEBT | THE UNFORTUNATE MENACE
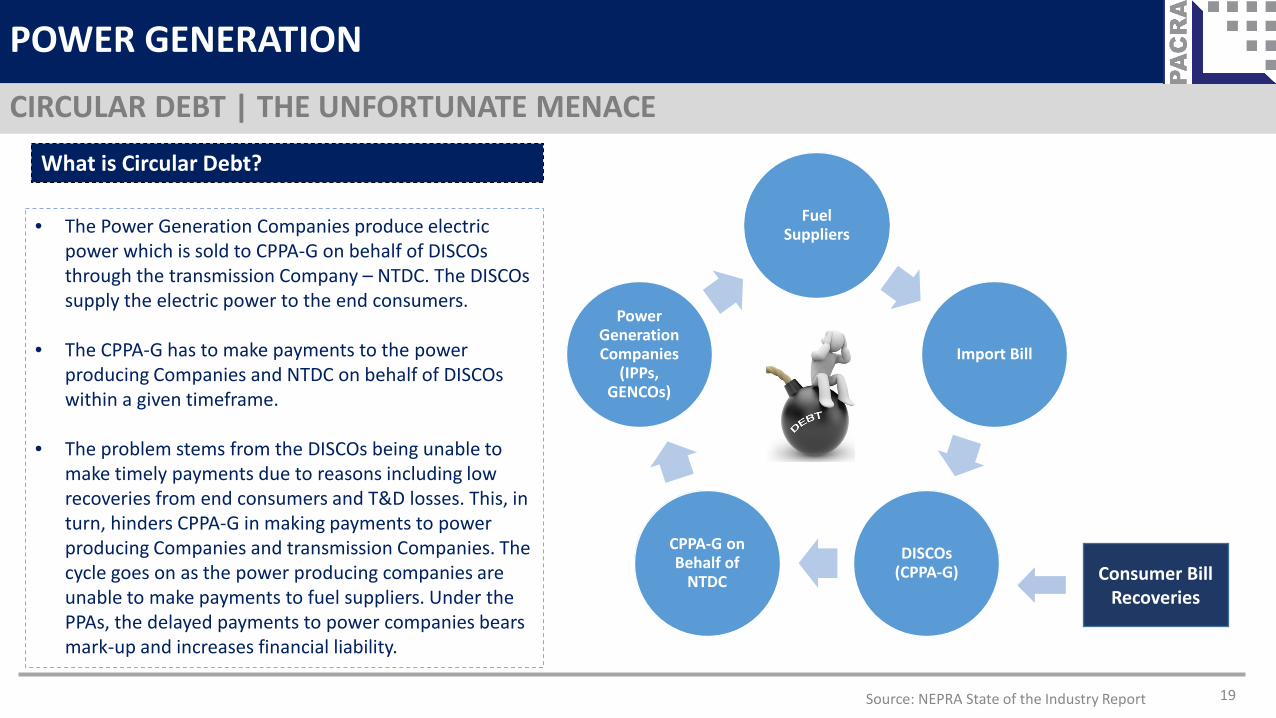
What is Circular Debt?
Fuel Suppliers
Import Bill
DISCOs (CPPA-G)
CPPA-G on Behalf of
NTDC
Power Generation Companies
(IPPs, GENCOs)
• The Power Generation Companies produce electric power which is sold to CPPA-G on behalf of DISCOs through the transmission Company – NTDC. The DISCOs supply the electric power to the end consumers.
• The CPPA-G has to make payments to the power producing Companies and NTDC on behalf of DISCOs within a given timeframe.
• The problem stems from the DISCOs being unable to make timely payments due to reasons including low recoveries from end consumers and T&D losses. This, in turn, hinders CPPA-G in making payments to power producing Companies and transmission Companies. The cycle goes on as the power producing companies are unable to make payments to fuel suppliers. Under the PPAs, the delayed payments to power companies bears mark-up and increases financial liability.
Consumer Bill Recoveries

20
POWER GENERATION
Accumulation of Circular Debt
688,996 817,989
1,126,761
1,618,189
2,150,425
9%
19%
38%
44%
33%
0%
5%
10%
15%
20%
25%
30%
35%
40%
45%
50%
-
500,000
1,000,000
1,500,000
2,000,000
2,500,000
FY16 FY17 FY18 FY19 FY20
Circular Debt YoY Growth
TOTAL CIRCULAR DEBT (PKR mln) | LHS YoY Increase (%) | RHS
0%10%20%30%40%50%60%70%80%90%
100%
FY16 FY17 FY18 FY19 FY20
32% 35% 39% 43% 46%0% 0%
1% 1% 2%14% 11% 8% 6% 5%
53% 54% 52% 50% 47%
Components of Circular Debt | YoY
Payable to IPPs Payable to GENCOs
Payable to Fuel Suppliers by GENCOs PHPL Payables
• The total amount of circular debt is estimated at PKR~2.3trn as at End-Nov’20, representing an increase of PKR~156bln in 5MFY21, a monthly run rate of PKR~32bln.
Source: NEPRA State of the Industry Report
21
POWER TRANSMISSION & DISTRIBUTION
Circular Debt – Initiatives to stop accumulation
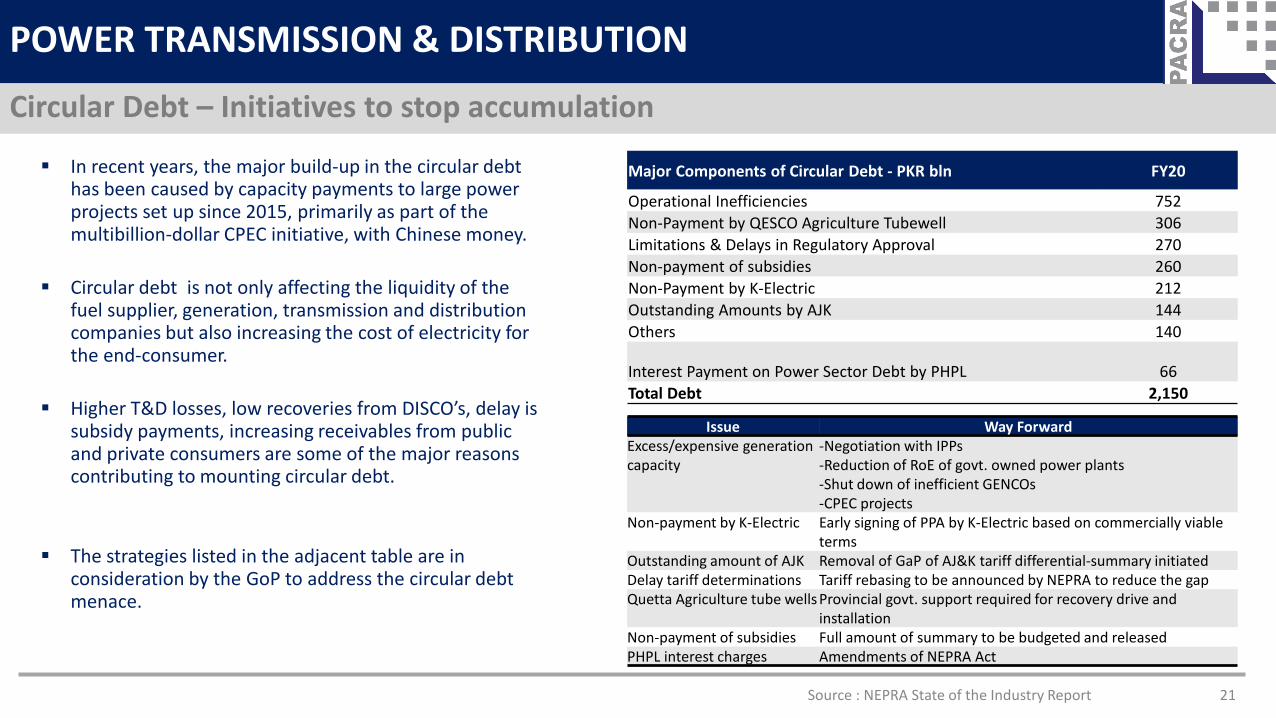
Major Components of Circular Debt - PKR bln FY20
Operational Inefficiencies 752Non-Payment by QESCO Agriculture Tubewell 306Limitations & Delays in Regulatory Approval 270Non-payment of subsidies 260Non-Payment by K-Electric 212Outstanding Amounts by AJK 144Others 140
Interest Payment on Power Sector Debt by PHPL 66Total Debt 2,150
In recent years, the major build-up in the circular debt has been caused by capacity payments to large power projects set up since 2015, primarily as part of the multibillion-dollar CPEC initiative, with Chinese money.
Circular debt is not only affecting the liquidity of the fuel supplier, generation, transmission and distribution companies but also increasing the cost of electricity for the end-consumer.
Higher T&D losses, low recoveries from DISCO’s, delay is subsidy payments, increasing receivables from public and private consumers are some of the major reasons contributing to mounting circular debt.
The strategies listed in the adjacent table are in consideration by the GoP to address the circular debt menace.
Issue Way ForwardExcess/expensive generationcapacity
-Negotiation with IPPs-Reduction of RoE of govt. owned power plants-Shut down of inefficient GENCOs-CPEC projects
Non-payment by K-Electric Early signing of PPA by K-Electric based on commercially viableterms
Outstanding amount of AJK Removal of GaP of AJ&K tariff differential-summary initiatedDelay tariff determinations Tariff rebasing to be announced by NEPRA to reduce the gapQuetta Agriculture tube wells Provincial govt. support required for recovery drive and
installationNon-payment of subsidies Full amount of summary to be budgeted and releasedPHPL interest charges Amendments of NEPRA Act
Source : NEPRA State of the Industry Report

22
POWER TRANSMISSION & DISTRIBUTION
Investment plan for Transmission Lines of NTDC
Source : NEPRA, NTDC
S.No Name of ProjectTransmission Lines
Expected Completion Date
Estimated Cost Voltage
Level (kV)Line Length (km) (In PKRMln)
500 kV 200 kV HVDC
1 Interconnection of HVDC Converter Stations at Lahore and Matiari with HVAC System 500 60 - - 2020-21 4,806.00
2 Lalian with associated T/Line 220 - 8 - 2021-22 1,581.003 Gharo with associated T/Line 220 - 85 - 2022-23 3,317.004 Faisalabad West with associated T/Line 500/220 32 125 - 2022-23 9,380.005 Lahore North with associated T/Line 500/220 150 44 - 2022-23 20,732.006 Zhob with associated T/Line 220 - 220 - 2022-23 6,878.007 Mirpurkhas with associated T/Line 220 - 80 - 2022-23 3,857.008 Guddu-Uch-Sibbi Transmission Line 220 - 360 - 2022-23 8,624.00
9 CASA-1000 500/220 HVDC 17 2 110 2022-23 41,146.00
10 Haripur with associated T/Line 220 - 2 - 2022-23 3,424.0011 Swabi Sub-Station with associated T/Line 220 - 55 - 2022-23 6,399.0012 Islamabad West with associated T/Line 500/220 27 35 - 2023-24 8,288.0013 Zero Point G/Station with associated T/Line 220 - 24 - 2023-24 2,542.0014 Punjab University with associated T/Line 220 - 4 - 2023-24 2,948.0015 Mastung Grid Station with associated T/Line 220 - 120 - 2023-24 14,155.0016 Chakwal with associated T/Line 220 33 - - 2023-24 6,710.0017 Joharabad with associated T/Line 220 - 12 - 2023-24 2,961.0018 Nawabshah with associated T/Line 220 - 65 - 2023-24 6,292.0019 Larkana with associated T/Line 220 - 65 - 2023-24 6,449.0020 Head Faqiran with associated T/Line 220 - 88 - 2023-24 6,055.0021 Daharki-RYK-Bhawalpur with associated Transmission Line 220 - 335 - 2023-24 15,796.0022 Jamrud with associated T/Line 220 - 20 - 2023-24 2,398.00
23
POWER TRANSMISSION & DISTRIBUTION
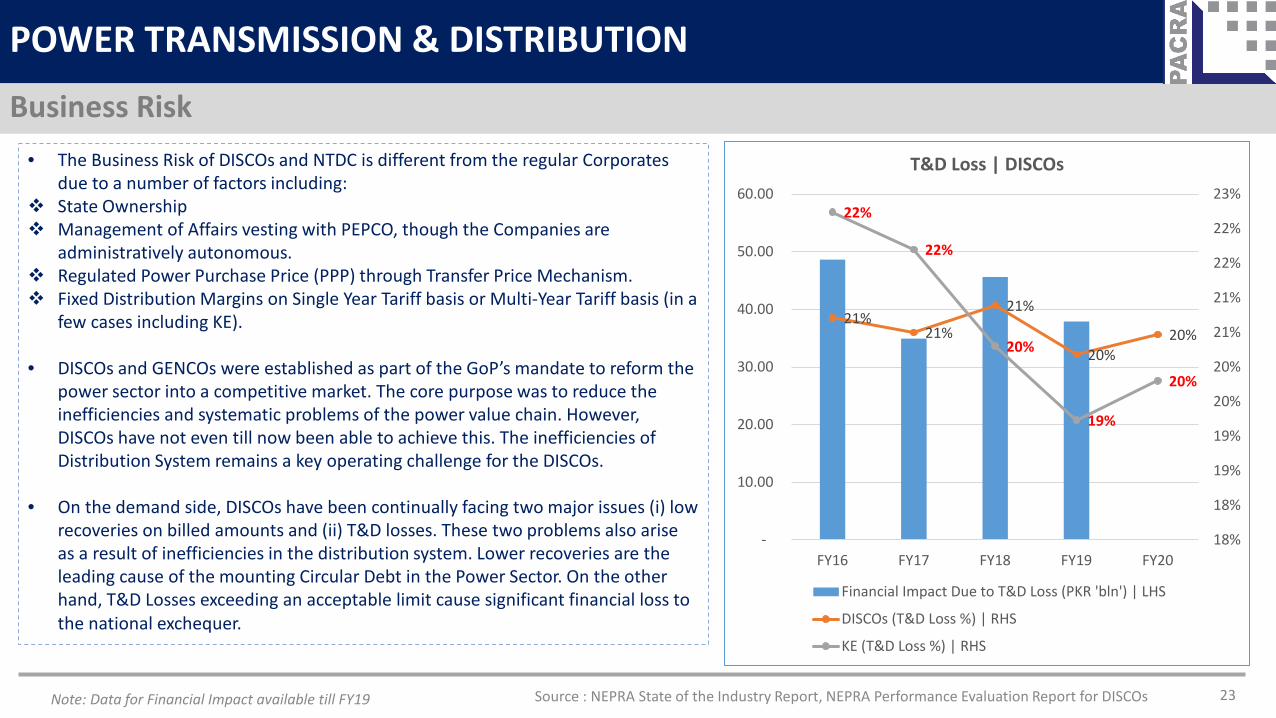
Business Risk• The Business Risk of DISCOs and NTDC is different from the regular Corporates
due to a number of factors including: State Ownership Management of Affairs vesting with PEPCO, though the Companies are
administratively autonomous. Regulated Power Purchase Price (PPP) through Transfer Price Mechanism. Fixed Distribution Margins on Single Year Tariff basis or Multi-Year Tariff basis (in a
few cases including KE).
• DISCOs and GENCOs were established as part of the GoP’s mandate to reform the power sector into a competitive market. The core purpose was to reduce the inefficiencies and systematic problems of the power value chain. However, DISCOs have not even till now been able to achieve this. The inefficiencies of Distribution System remains a key operating challenge for the DISCOs.
• On the demand side, DISCOs have been continually facing two major issues (i) low recoveries on billed amounts and (ii) T&D losses. These two problems also arise as a result of inefficiencies in the distribution system. Lower recoveries are the leading cause of the mounting Circular Debt in the Power Sector. On the other hand, T&D Losses exceeding an acceptable limit cause significant financial loss to the national exchequer.
21%21%
21%
20%20%
22%
22%
20%
19%
20%
18%
18%
19%
19%
20%
20%
21%
21%
22%
22%
23%
-
10.00
20.00
30.00
40.00
50.00
60.00
FY16 FY17 FY18 FY19 FY20
T&D Loss | DISCOs
Financial Impact Due to T&D Loss (PKR 'bln') | LHS
DISCOs (T&D Loss %) | RHS
KE (T&D Loss %) | RHS
Source : NEPRA State of the Industry Report, NEPRA Performance Evaluation Report for DISCOsNote: Data for Financial Impact available till FY19

Source: PACRA Database 24
POWER TRANSMISSION & DISTRIBUTION
Financial Risk
0.9 1 0.7 1.3 1
13.2 14.1
4.5 4.1 3.2
0
5
10
15
FY16 FY17 FY18 FY19 FY20
Covergae Ratio
Debt service coverage Interest coverage
380 372 392
142189
050
100150200250300350400450
FY16 FY17 FY18 FY19 FY20
Net cash cycle | Days
The Distribution Sector is equally financed through debt and equity, with capital structure ratio fluctuating in the range between48 percent to 52 percent over the past five years.
Interest coverage ratio has declined significantly over the last five years, inline with the immensely increasing circular debt.
Net cash cycle improved slightly over the last year, however it is still higher as compared to the industry norms and currentlystands at approx. 189 days

Rating Curve
POWER TRANSMISSION & DISTRIBUTION
25
0
1
2
AAA AA+ AA AA- A+ A A- BBB+ BBB BBB- BB+ BB
Rating Curve
PACRA VIS
− Ratings stand between AA+ and AA due to stateownership and very strong prospects of support
− PACRA rates 2 entities in the Power Transmission &Distribution namely NTDC and K-Electric
26
POWER TRANSMISSION & DISTRIBUTION
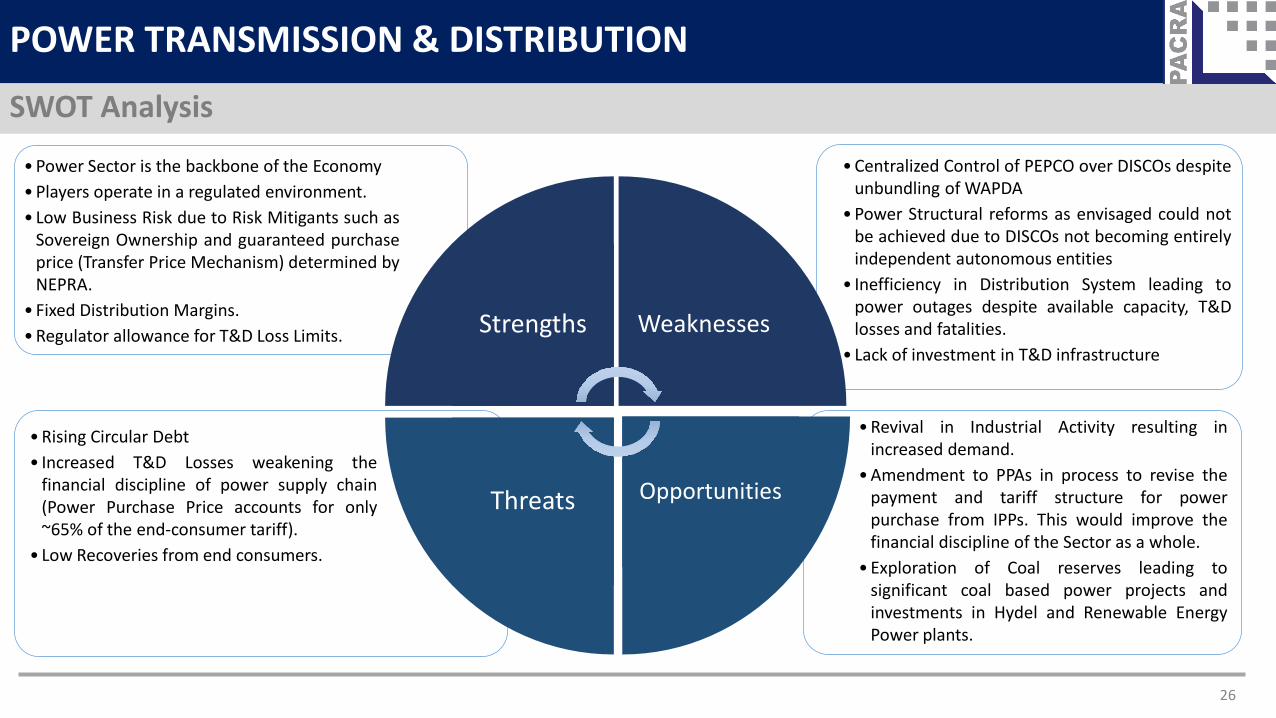
SWOT Analysis
•Centralized Control of PEPCO over DISCOs despiteunbundling of WAPDA
•Power Structural reforms as envisaged could notbe achieved due to DISCOs not becoming entirelyindependent autonomous entities
• Inefficiency in Distribution System leading topower outages despite available capacity, T&Dlosses and fatalities.
• Lack of investment in T&D infrastructure
•Power Sector is the backbone of the Economy•Players operate in a regulated environment.• Low Business Risk due to Risk Mitigants such as
Sovereign Ownership and guaranteed purchaseprice (Transfer Price Mechanism) determined byNEPRA.
• Fixed Distribution Margins.•Regulator allowance for T&D Loss Limits. Strengths
Threats Opportunities
Weaknesses
•Rising Circular Debt• Increased T&D Losses weakening the
financial discipline of power supply chain(Power Purchase Price accounts for only~65% of the end-consumer tariff).
• Low Recoveries from end consumers.
•Revival in Industrial Activity resulting inincreased demand.
•Amendment to PPAs in process to revise thepayment and tariff structure for powerpurchase from IPPs. This would improve thefinancial discipline of the Sector as a whole.
•Exploration of Coal reserves leading tosignificant coal based power projects andinvestments in Hydel and Renewable EnergyPower plants.
• Pakistan’s Power Sector is confronting deep-routed issues since long. The key risks being weak financial discipline and inefficiencies in all three verticals of the System. The Sector remains the backbone of economy and the GoP is keen on developing long term sustainable solutions to the ingrained power issues. Apart from the rising circular debt, some positive developments have surfaced on the economic and power sector level in the recent times.
• Industrial activity has picked up in various sectors with the Large Scale Manufacturing Industries output increasing ~5.46% YoY during the first four months of FY21. The sectors which have contributed to this growth are textiles, food & beverages, pharmaceuticals and chemicals.
• 19 IPPs out of the 47 who signed the MoUs in Aug’20 have agreed to enter into the legally binding contracts with the GoP, the first of which were Solar and Bagasse IPPs. The development may still take time to become fully effective in shape of new agreements. Meanwhile, payment of circular debt related dues under this agreement will improve liquidity position of IPPs.
• The tariff increase sought by DISCOs in FY20 was approved by NEPRA on Dec 31, 2020 (an increase of PKR~3.30/unit). The total impact of such an increase would have landed to PKR~280bln. The GoP considering the current financial scenario of the consumers has, therefore, decided to increase the base tariff in phases. In the first phase, the base price will go up from PKR~13.35/unit to PKR~15.25/unit. The total impact of such an increase would amount to PKR~177bln.
• The decision taken by the State Bank of Pakistan (SBP) to lower the policy rate by 625bps to 7% in the last quarter of FY20 has lowered the finance costs incurred by power distributors for financing availed to bridge liquidity gap.
• The inflation level in the country has also declined. The average inflation rate during the 1HFY21 stood at ~8.74% as compared to an average inflation rate of ~10.7% during FY20. Moreover, the exchange rate is also expected to remain stable in the near future.
• Although Pakistan’s generation capability is now sufficient to meet its demand, it is equally essential to strengthen and expand the T&D network of the country in order to achieve optimal utilization of the generation capacity. Immediate measures are required for an Integrated planning and investment in the National Grid System to remove the T&D constraints and ensure smooth transmission of cheaper electricity to the end consumers.
27
POWER TRANSMISSION & DISTRIBUTION
Outlook: Stable
• BP Statistical Review of World Energy 2020• NEPRA State of the Industry Reports & Performance
Evaluation Reports• State Bank of Pakistan (SBP)• Water & Power Development Authority (WAPDA)• Private Power and Infrastructure Board (PPIB)• Alternative Energy Development Board (AEDB)• Pakistan Energy Year Book• Pakistan Economic Survey• PACRA Database• Dawn News
BIBLIOGRAPHY
Research Team Saniya TauseefTeam Lead Research & Publishing (R&P)
Contact Number: +92 42 35869504
DISCLAIMERPACRA has used due care in preparation of this document. Our information has been obtained from sources we consider to be reliable but its accuracy or completeness is not guaranteed.The information in this document may be copied or otherwise reproduced, in whole or in part, provided the source is duly acknowledged. The presentation should not be relied upon asprofessional advice.
28