powering countries, states and the world with wind, water and sunlight
TRANSCRIPT
8/12/2019 Powering Countries, States and the World With Wind, Water and Sunlight
http://slidepdf.com/reader/full/powering-countries-states-and-the-world-with-wind-water-and-sunlight 1/30
Powering Countries, States, and
the World With Wind, Water, andSunlight
J. G. Swanepoel/Dreamstime.com Wind farm near Middelgrunden, Denmark
Mark Z. Jacobson AAAS Annual Meeting
Atmosphere/Energy Program Chicago, IllinoisStanford University February 15, 2014
8/12/2019 Powering Countries, States and the World With Wind, Water and Sunlight
http://slidepdf.com/reader/full/powering-countries-states-and-the-world-with-wind-water-and-sunlight 2/30
What’s the Problem? Why act Quickly?
Air pollution kills 2.5-4 million people worldwide each year.
Arctic sea ice may disappear in 10-30 years. Global temperatures are
rising at a faster rate than any time in recorded history.
Increasing energy demand is increasing pollution, global warming, andenergy prices.
Higher energy prices lead to economic, social, political instability
Drastic problems require immediate and definite solutions
8/12/2019 Powering Countries, States and the World With Wind, Water and Sunlight
http://slidepdf.com/reader/full/powering-countries-states-and-the-world-with-wind-water-and-sunlight 3/30
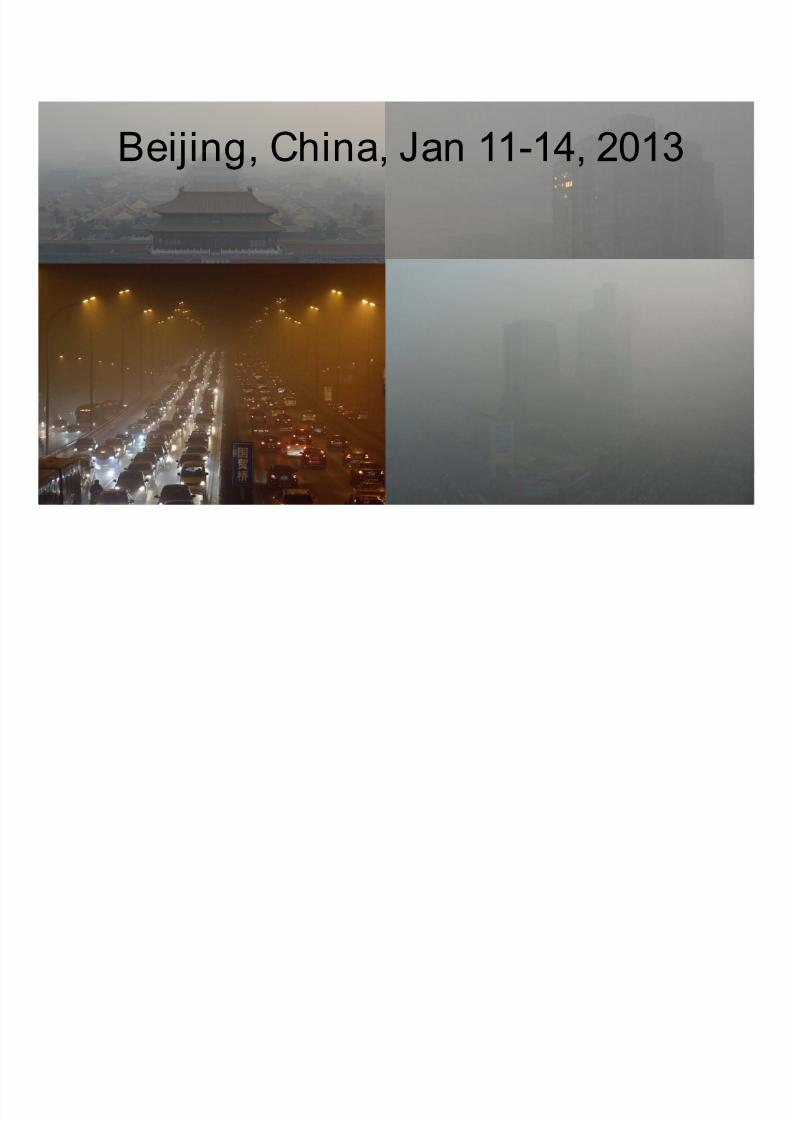
Beijing, China, Jan 11-14, 2013
8/12/2019 Powering Countries, States and the World With Wind, Water and Sunlight
http://slidepdf.com/reader/full/powering-countries-states-and-the-world-with-wind-water-and-sunlight 4/30
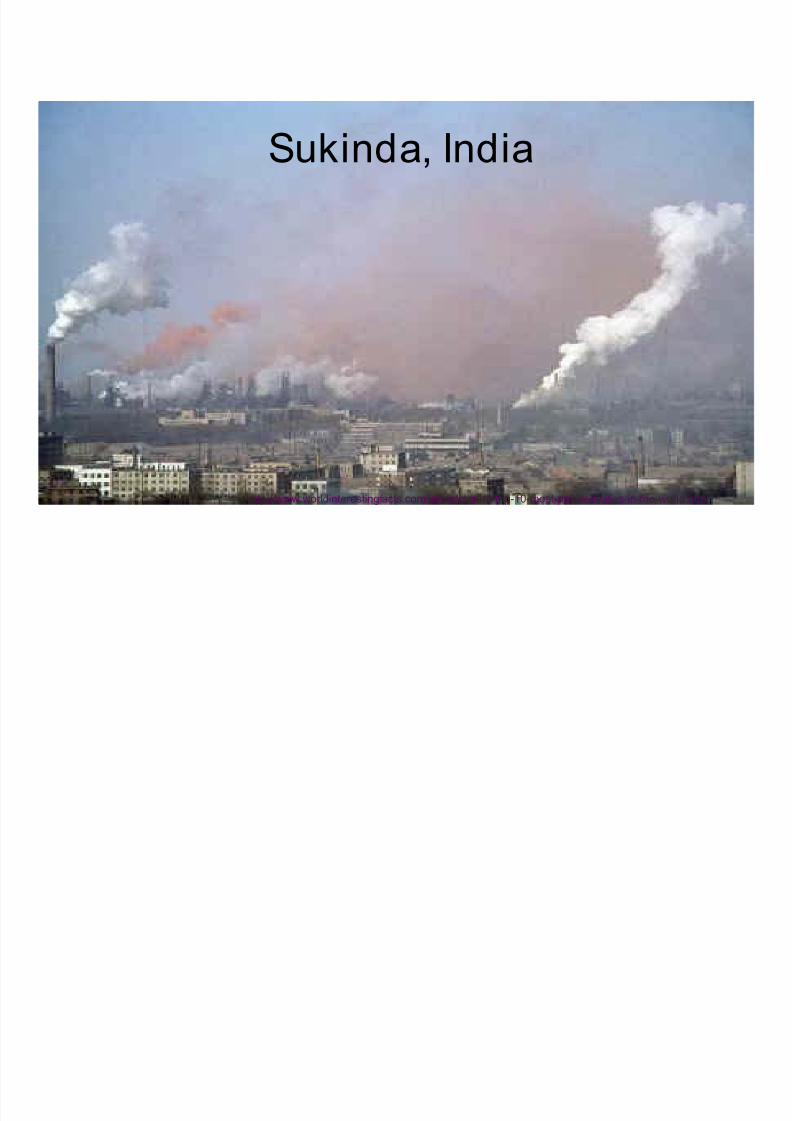
http://www.worldinterestingfacts.com/infrastructure/top-10-most-polluted-cities-in-the-world.html
Sukinda, India
8/12/2019 Powering Countries, States and the World With Wind, Water and Sunlight
http://slidepdf.com/reader/full/powering-countries-states-and-the-world-with-wind-water-and-sunlight 5/30
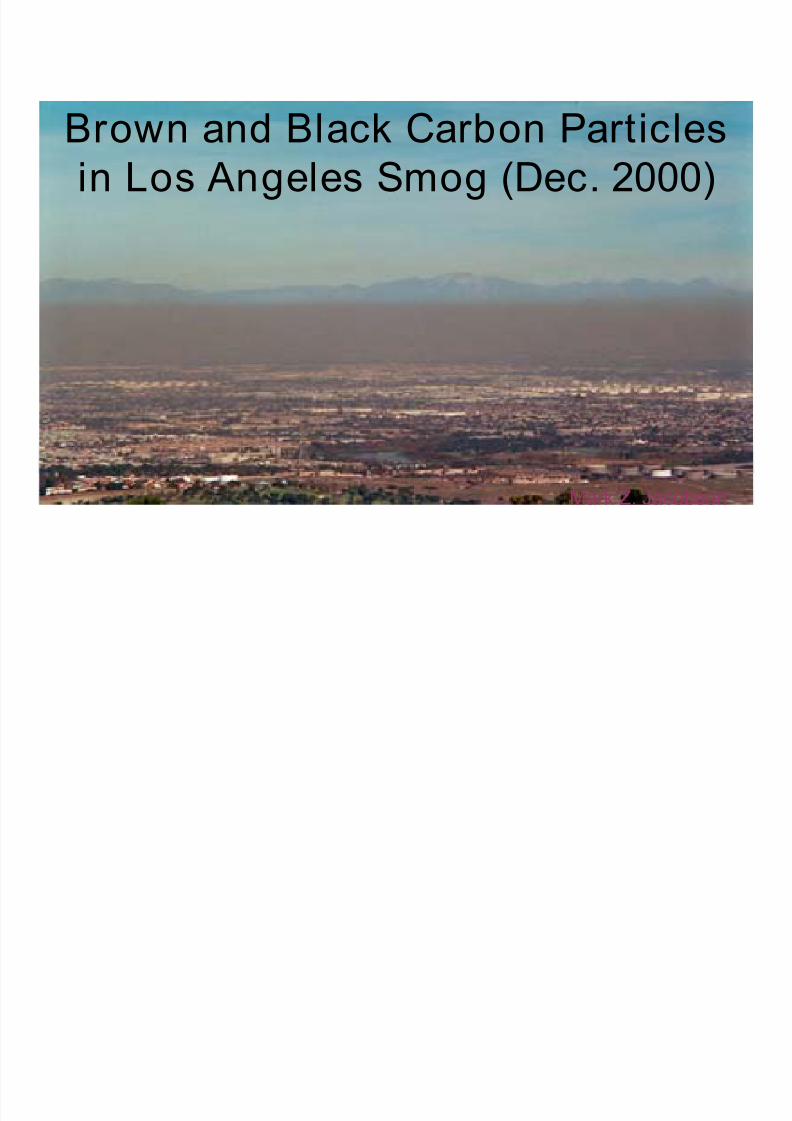
Brown and Black Carbon Particlesin Los Angeles Smog (Dec. 2000)
Mark Z. Jacobson

8/12/2019 Powering Countries, States and the World With Wind, Water and Sunlight
http://slidepdf.com/reader/full/powering-countries-states-and-the-world-with-wind-water-and-sunlight 6/30
Lung of LA TeenageNonsmoker in 1970s;
SCAQMD/CARB
8/12/2019 Powering Countries, States and the World With Wind, Water and Sunlight
http://slidepdf.com/reader/full/powering-countries-states-and-the-world-with-wind-water-and-sunlight 7/30
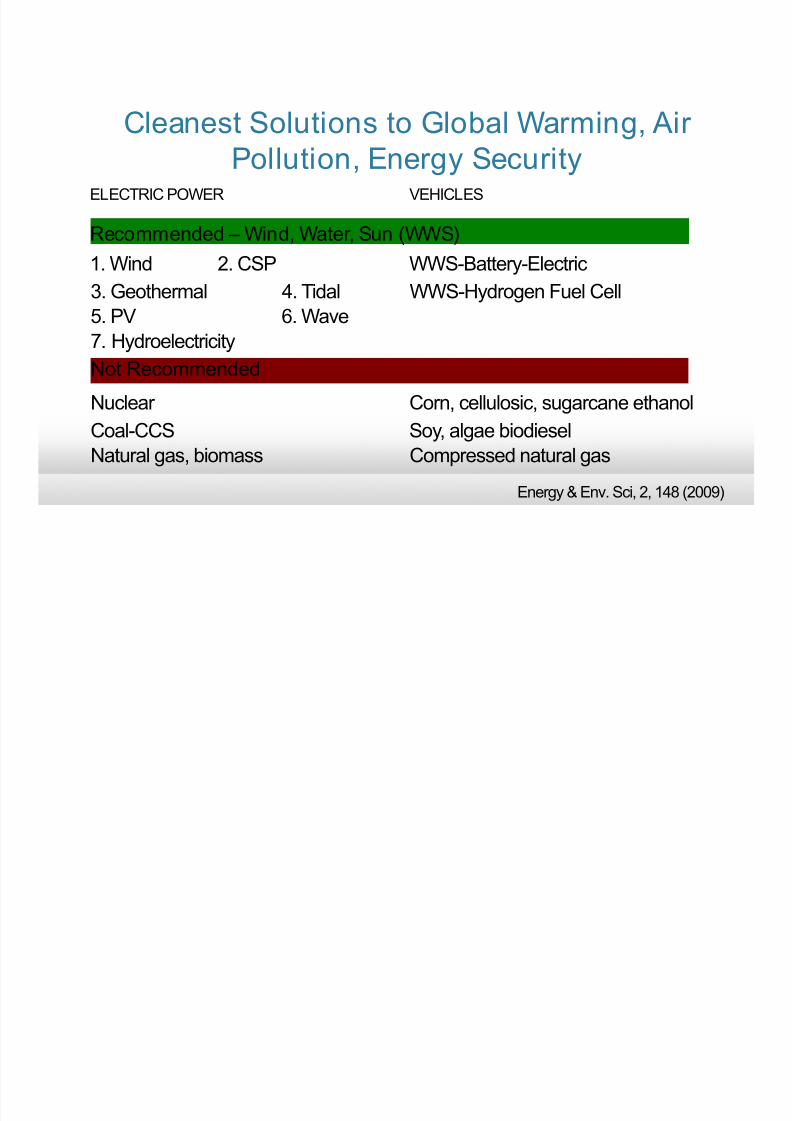
ELECTRIC POWER VEHICLES
Recommended – Wind, Water, Sun (WWS)
1. Wind 2. CSP WWS-Battery-Electric
3. Geothermal 4. Tidal WWS-Hydrogen Fuel Cell
5. PV 6. Wave7. Hydroelectricity
Not Recommended
Nuclear Corn, cellulosic, sugarcane ethanol
Coal-CCS Soy, algae biodieselNatural gas, biomass Compressed natural gas
Cleanest Solutions to Global Warming, AirPollution, Energy Security
Energy & Env. Sci, 2, 148 (2009)
8/12/2019 Powering Countries, States and the World With Wind, Water and Sunlight
http://slidepdf.com/reader/full/powering-countries-states-and-the-world-with-wind-water-and-sunlight 8/30
8/12/2019 Powering Countries, States and the World With Wind, Water and Sunlight
http://slidepdf.com/reader/full/powering-countries-states-and-the-world-with-wind-water-and-sunlight 9/30
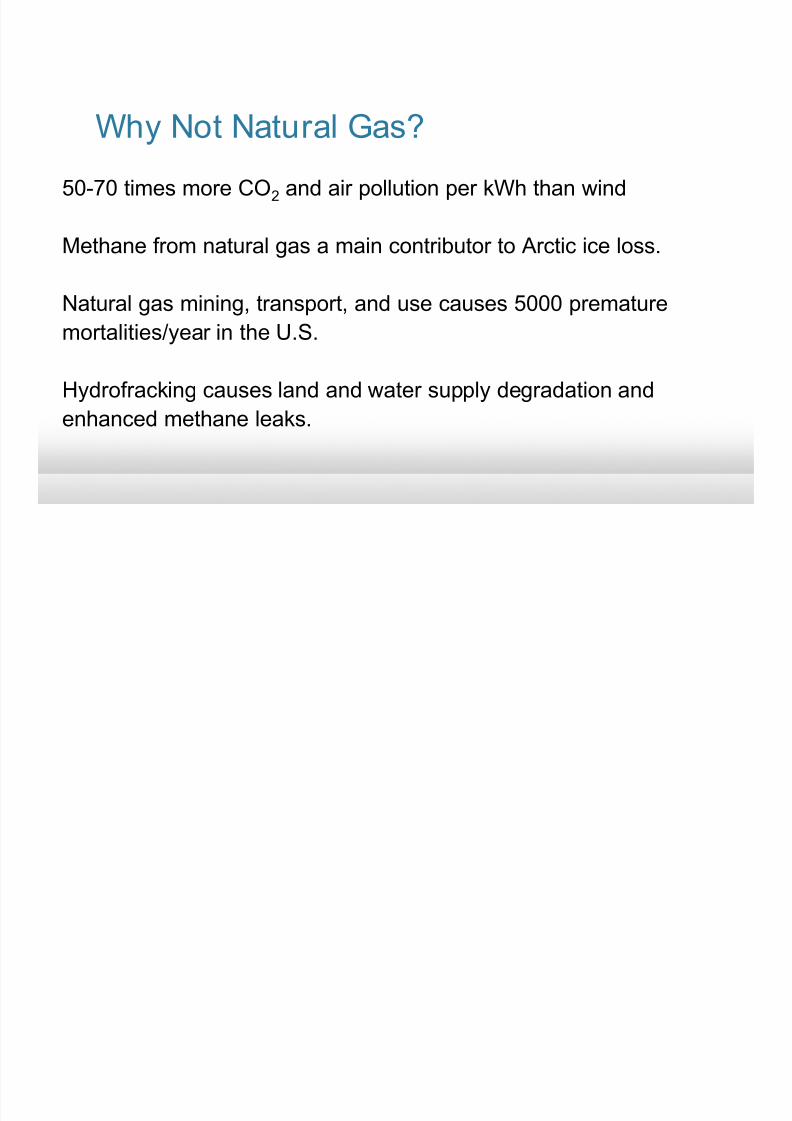
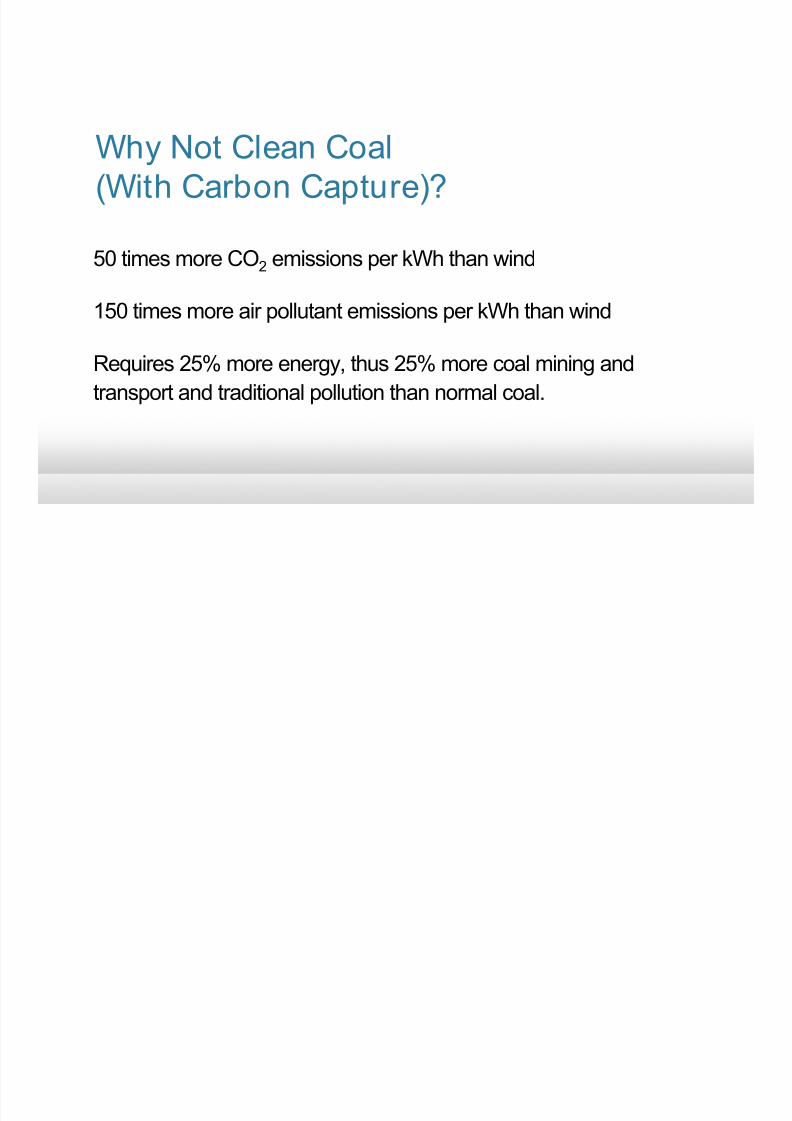
50 times more CO2 emissions per kWh than wind
150 times more air pollutant emissions per kWh than wind
Requires 25% more energy, thus 25% more coal mining and
transport and traditional pollution than normal coal.
Why Not Clean Coal(With Carbon Capture)?
8/12/2019 Powering Countries, States and the World With Wind, Water and Sunlight
http://slidepdf.com/reader/full/powering-countries-states-and-the-world-with-wind-water-and-sunlight 10/30
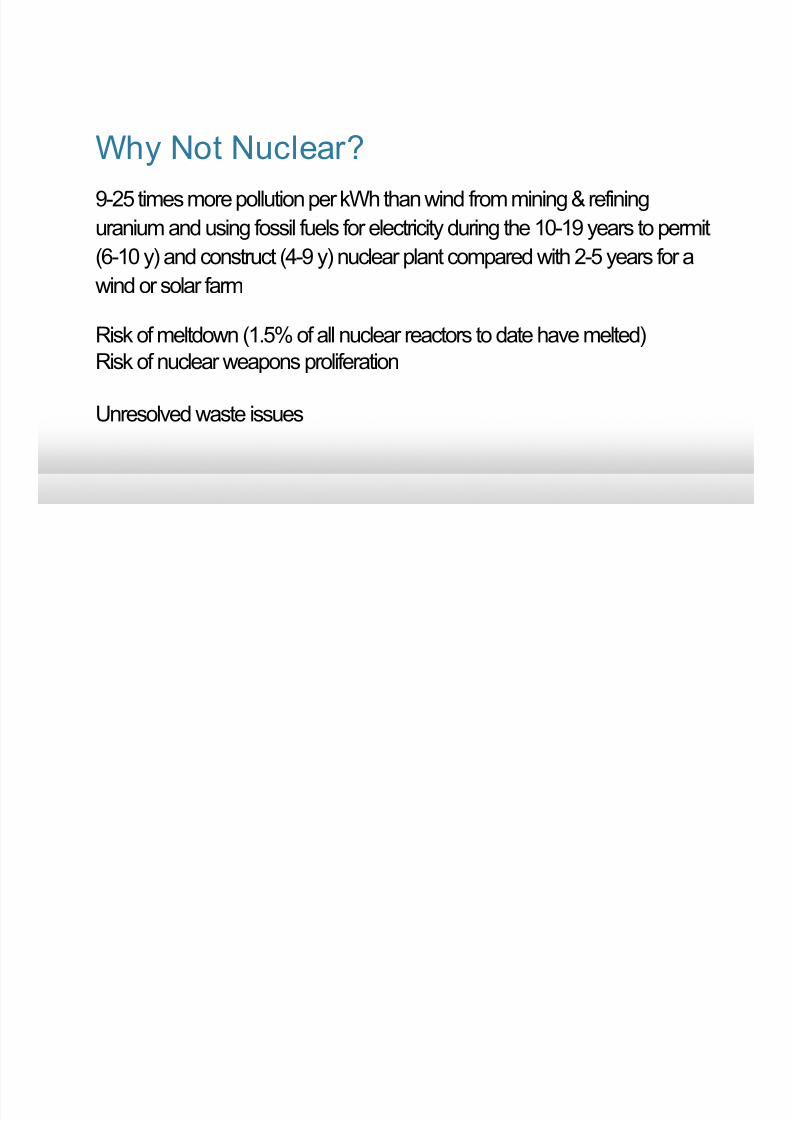
9-25 times more pollution per kWh than wind from mining & refining
uranium and using fossil fuels for electricity during the 10-19 years to permit
(6-10 y) and construct (4-9 y) nuclear plant compared with 2-5 years for a
wind or solar farm
Risk of meltdown (1.5% of all nuclear reactors to date have melted)Risk of nuclear weapons proliferation
Unresolved waste issues
Why Not Nuclear?
8/12/2019 Powering Countries, States and the World With Wind, Water and Sunlight
http://slidepdf.com/reader/full/powering-countries-states-and-the-world-with-wind-water-and-sunlight 11/30
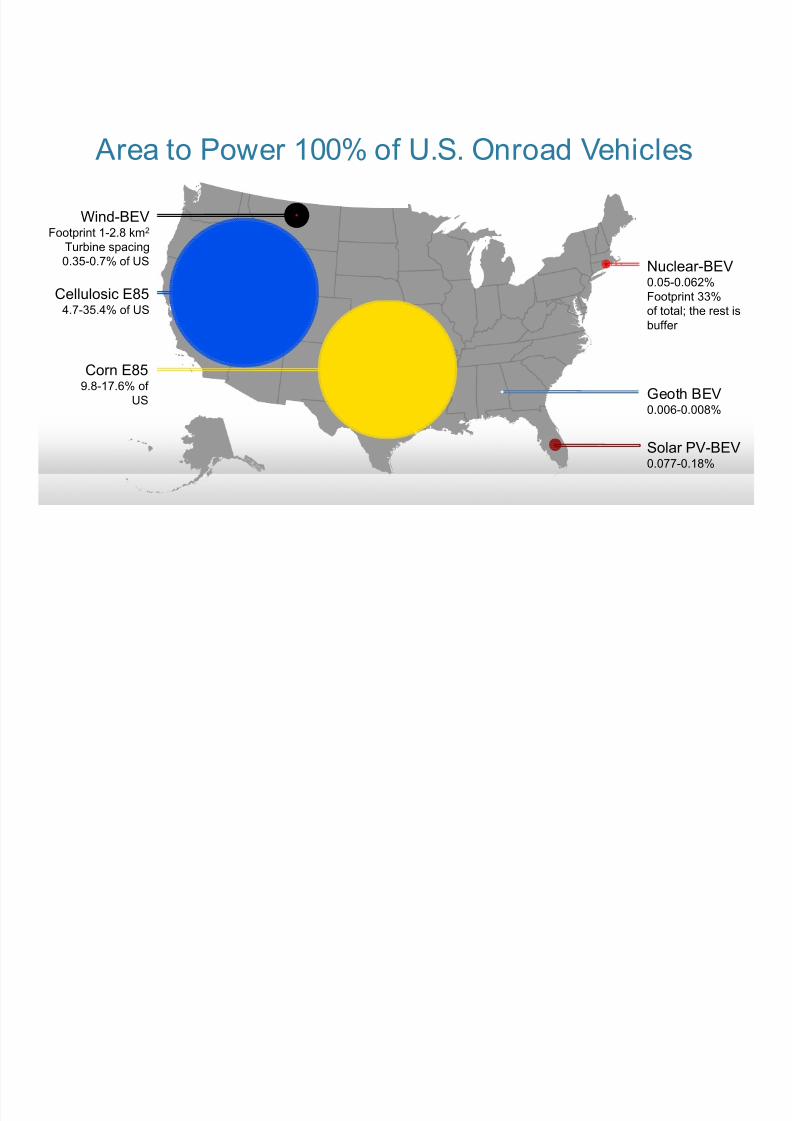
Cellulosic E854.7-35.4% of US
Solar PV-BEV0.077-0.18%
Corn E859.8-17.6% of
US
Wind-BEVFootprint 1-2.8 km2
Turbine spacing0.35-0.7% of US
Geoth BEV0.006-0.008%
Nuclear-BEV0.05-0.062%Footprint 33%of total; the rest is
buffer
Area to Power 100% of U.S. Onroad Vehicles
8/12/2019 Powering Countries, States and the World With Wind, Water and Sunlight
http://slidepdf.com/reader/full/powering-countries-states-and-the-world-with-wind-water-and-sunlight 12/30
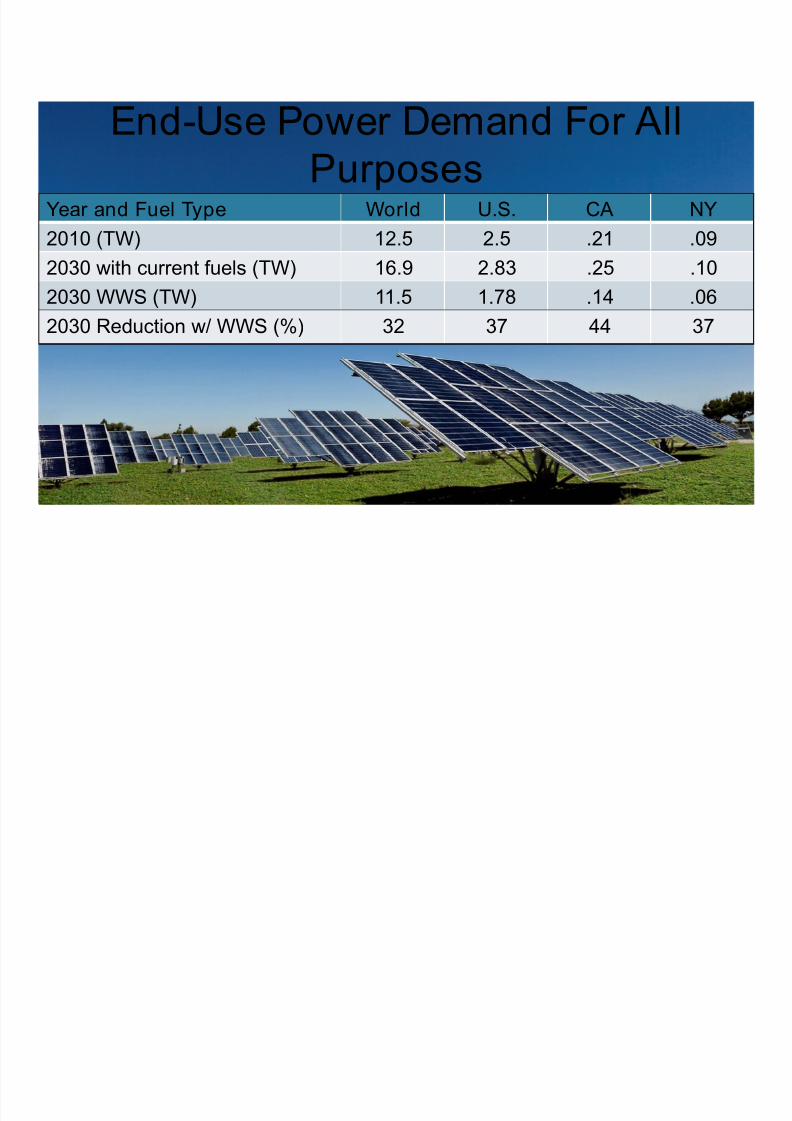
End-Use Power Demand For AllPurposes
Year and Fuel Type World U.S. CA NY2010 (TW) 12.5 2.5 .21 .09
2030 with current fuels (TW) 16.9 2.83 .25 .10
2030 WWS (TW) 11.5 1.78 .14 .06
2030 Reduction w/ WWS (%) 32 37 44 37

8/12/2019 Powering Countries, States and the World With Wind, Water and Sunlight
http://slidepdf.com/reader/full/powering-countries-states-and-the-world-with-wind-water-and-sunlight 13/30
TECHNOLOGY PCT SUPPLY 2030 NUMBER
5-MW wind turbines 50% 3.8 mill. (0.8% in place)0.75-MW wave devices 1 720,000
100-MW geothermal plants 4 5350 (1.7% in place)
1300-MW hydro plants 4 900 (70% in place)
1-MW tidal turbines 1 490,0003-kW Roof PV systems 6 1.7 billion
300-MW Solar PV plants 14 40,000
300-MW CSP plants 20 49,000
100%
Number of Plants or Devices to Power World
8/12/2019 Powering Countries, States and the World With Wind, Water and Sunlight
http://slidepdf.com/reader/full/powering-countries-states-and-the-world-with-wind-water-and-sunlight 14/30
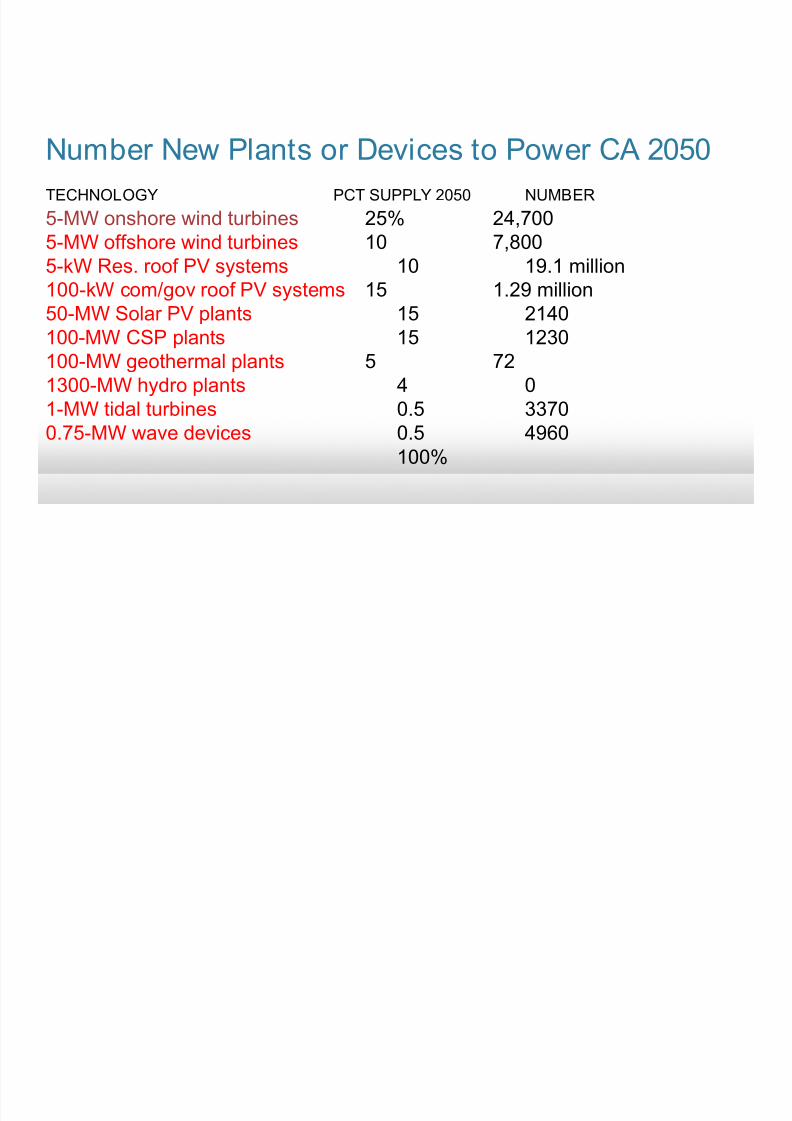
TECHNOLOGY PCT SUPPLY 2050 NUMBER
5-MW onshore wind turbines 25% 24,7005-MW offshore wind turbines 10 7,8005-kW Res. roof PV systems 10 19.1 million100-kW com/gov roof PV systems 15 1.29 million
50-MW Solar PV plants 15 2140100-MW CSP plants 15 1230100-MW geothermal plants 5 721300-MW hydro plants 4 01-MW tidal turbines 0.5 3370
0.75-MW wave devices 0.5 4960100%
Number New Plants or Devices to Power CA 2050
8/12/2019 Powering Countries, States and the World With Wind, Water and Sunlight
http://slidepdf.com/reader/full/powering-countries-states-and-the-world-with-wind-water-and-sunlight 15/30
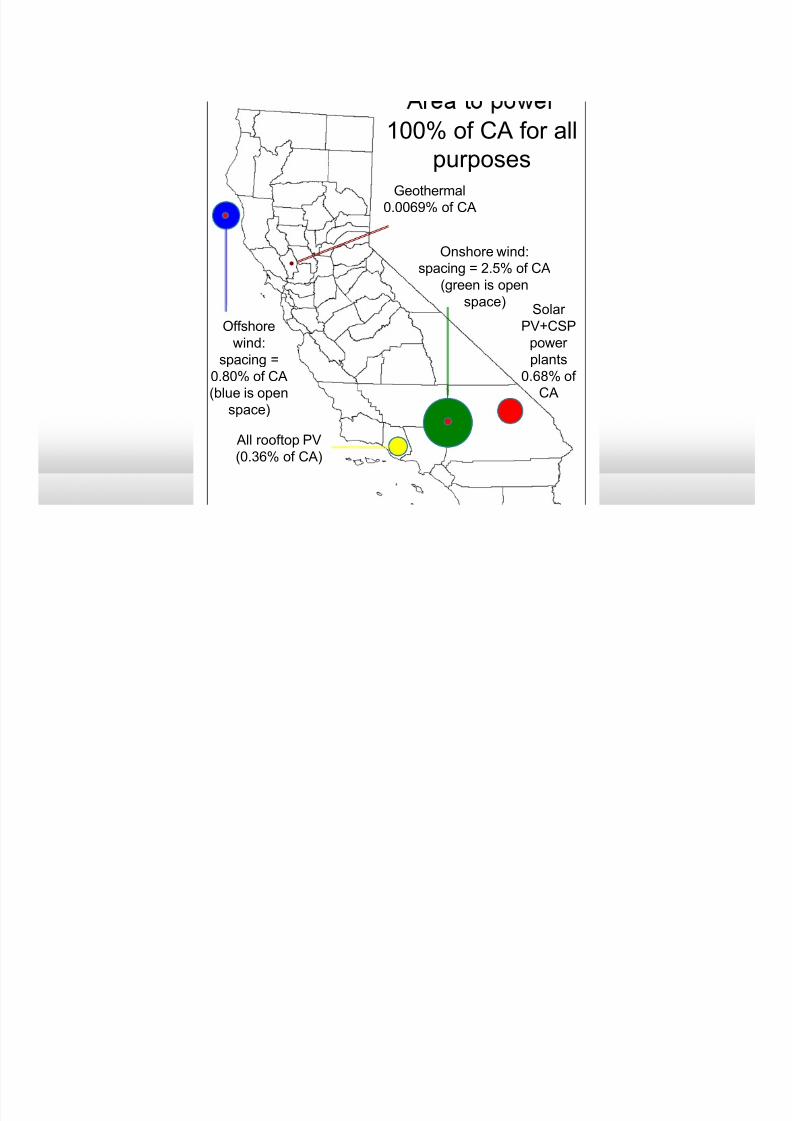
Onshore wind:spacing = 2.5% of CA
(green is openspace)
Solar
PV+CSPpowerplants
0.68% ofCA
All rooftop PV(0.36% of CA)
Offshorewind:
spacing =0.80% of CA(blue is open
space)
Geothermal0.0069% of CA
100% of CA for allpurposes
8/12/2019 Powering Countries, States and the World With Wind, Water and Sunlight
http://slidepdf.com/reader/full/powering-countries-states-and-the-world-with-wind-water-and-sunlight 16/30
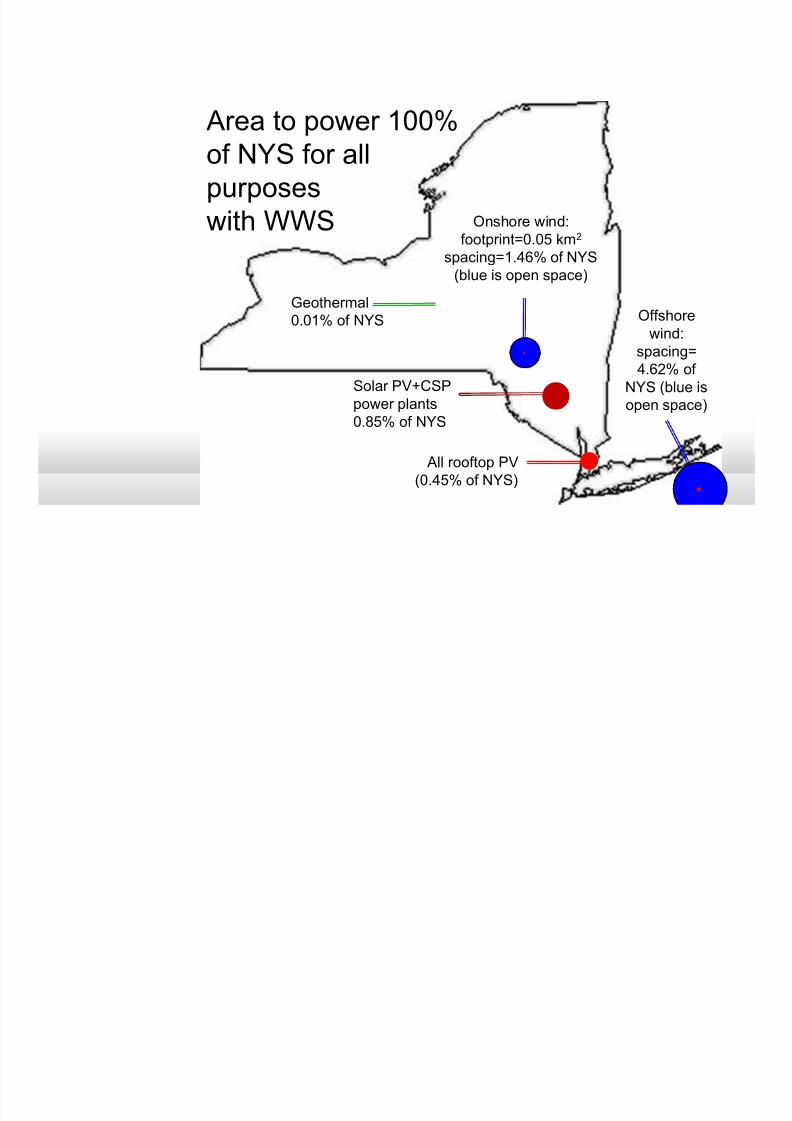
Area to power 100%of NYS for allpurposes
with WWS
Solar PV+CSPpower plants0.85% of NYS
All rooftop PV(0.45% of NYS)
Onshore wind:footprint=0.05 km2
spacing=1.46% of NYS(blue is open space)
Geothermal
0.01% of NYSOffshore
wind:spacing=4.62% of
NYS (blue isopen space)

8/12/2019 Powering Countries, States and the World With Wind, Water and Sunlight
http://slidepdf.com/reader/full/powering-countries-states-and-the-world-with-wind-water-and-sunlight 17/30
NYS: 4-4.5 kWh/m2/day)
8/12/2019 Powering Countries, States and the World With Wind, Water and Sunlight
http://slidepdf.com/reader/full/powering-countries-states-and-the-world-with-wind-water-and-sunlight 18/30
-180 -90 0 18090
0
-90
90
6
2
10
4
8
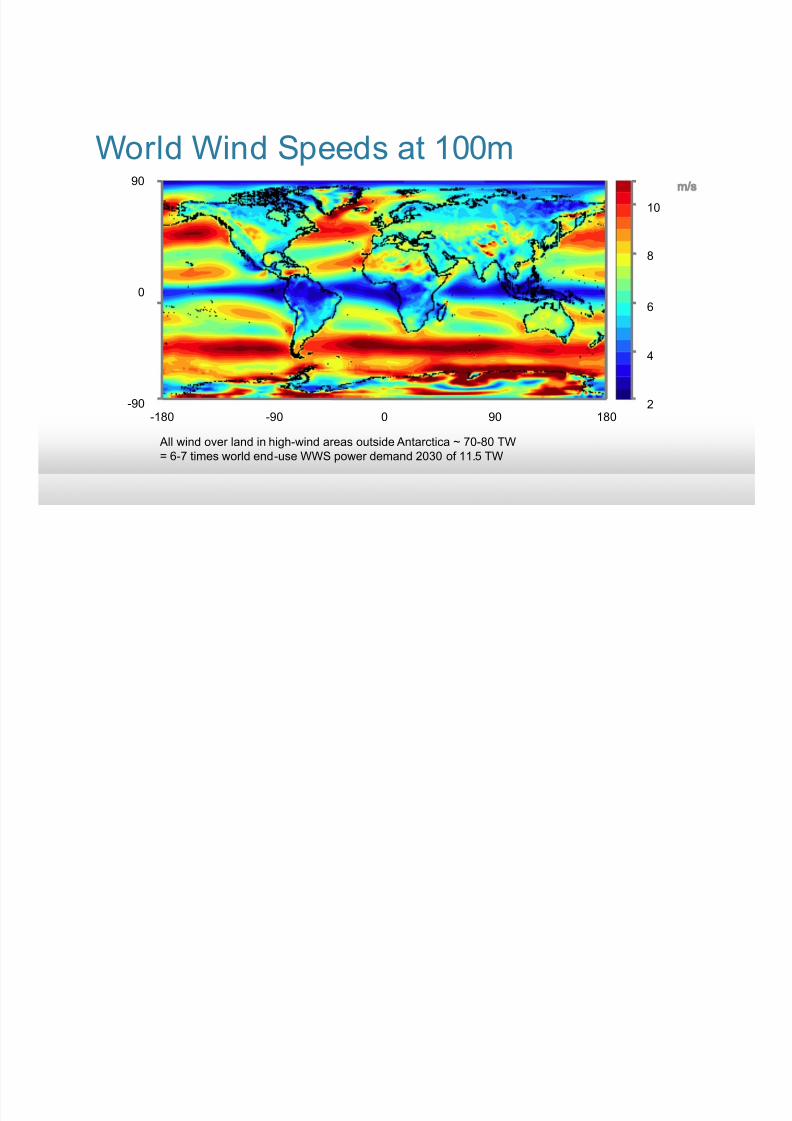
All wind over land in high-wind areas outside Antarctica ~ 70-80 TW= 6-7 times world end-use WWS power demand 2030 of 11.5 TW
World Wind Speeds at 100m
8/12/2019 Powering Countries, States and the World With Wind, Water and Sunlight
http://slidepdf.com/reader/full/powering-countries-states-and-the-world-with-wind-water-and-sunlight 19/30
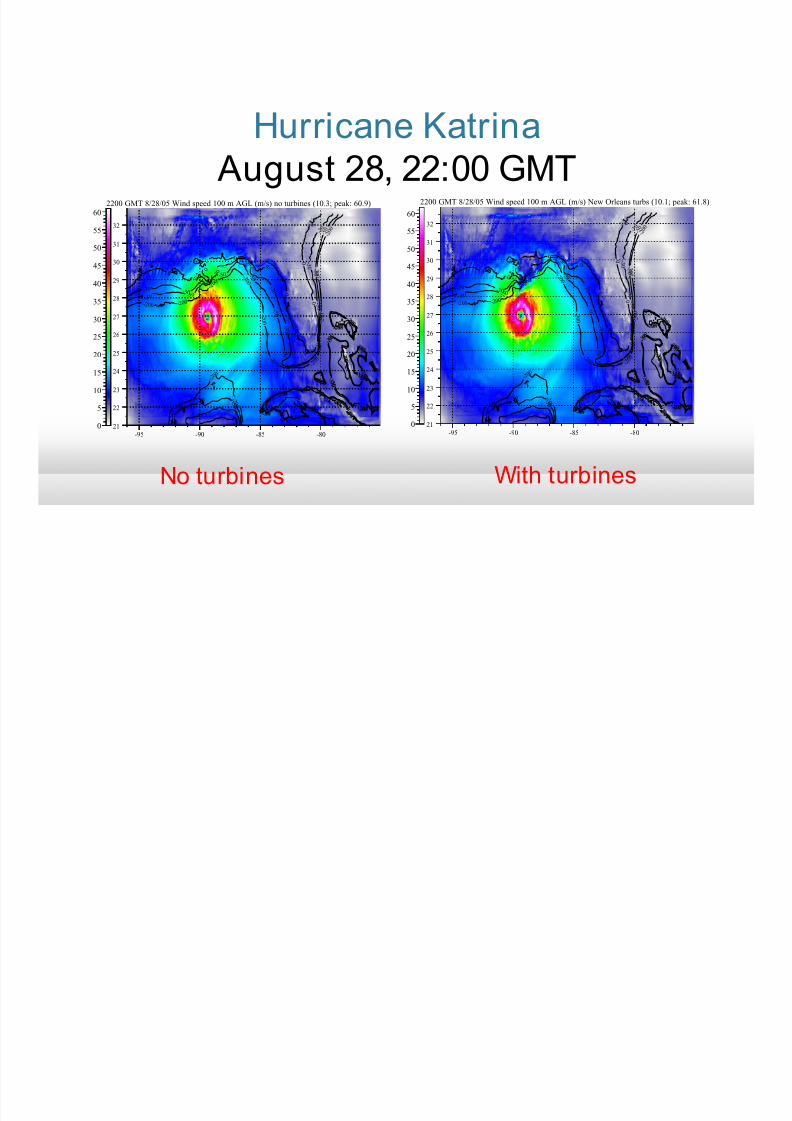
No turbines With turbines
Hurricane Katrina August 28, 22:00 GMT
-95 -90 -85 -80
21
22
23
24
25
26
27
28
29
30
31
32
2200 GMT 8/28/05 Wind speed 100 m AGL (m/s) no turbines (10.3; peak: 60.9)
0
5
10
15
20
25
30
35
40
45
50
55
60
0
0
0
0
0
0
0
0
0
0
0
0
0
0 0
0
0 0 0
- 3 0
- 3 0-30
- 3 0 - 3 0
- 3 0
-30
- 3 0
- 3 0
- 3 0
- 3 0
- 3 0
- 3 0
- 3 0
- 3
0
- 3 0
- 3 0
- 3 0
- 3 0
- 3 0
- 3 0
- 3 0
- 30 - 3 0
- 3 0
- 3 0
- 5 0
-5 0 - 5 0
- 5 0
-5 0-50
- 5 0 - 5 0
- 5 0
-50
- 5 0
- 5 0
- 5 0
- 5 0
- 5 0
- 5 0
- 5 0
- 5 0
- 5 0
- 5 0 -
5 0
- 5 0
- 5 0
- 5 0
-5 0 - 5 0
- 5 0
- 5
0
- 2 0 0
- 2 0 0
- 2 0 0
- 2 0 0
- 2 0 0
- 2 0 0
-200
- 2 0 0
-2 0 0
- 2 0 0
- 2 0 0
- 2 0 0
- 2 0 0
- 2 0 0
- 2 0 0
- 2 0 0
- 2 0 0
- 2
0 0
- 2 0 0
- 2 0 0
- 2 0 0
- 2 0 0
- 2 0 0
- 2 0 0-2 0 0
-200
- 2 0 0
-95 -90 -85 -80
21
22
23
24
25
26
27
28
29
30
31
32
2200 GMT 8/28/05 Wind speed 100 m AGL (m/s) New Orleans turbs (10.1; peak: 61.8)
0
5
10
15
20
25
30
35
40
45
50
55
60
0
0
0
0
0
0
0
0
0
0
0
0
0
0 0
0
0 0 0
- 3 0
- 3 0-30
- 3 0 - 3 0
- 3 0
-30
- 3 0
- 3 0
- 3 0
- 3 0
- 3 0
- 3 0
- 3 0
- 3
0
- 3 0
- 3 0
- 3 0
- 3 0
- 3 0
- 3 0
- 3 0
- 30 - 3 0
- 3 0
- 3 0
- 5 0
-5 0 - 5 0
- 5 0
-5 0-50
- 5 0 - 5 0
- 5 0
-50
- 5 0
- 5 0
- 5 0
- 5 0
- 5 0
- 5 0
- 5 0
- 5 0
- 5 0
- 5 0 -
5 0
- 5 0
- 5 0
- 5 0
-5 0 - 5 0
- 5 0
- 5 0
- 2 0 0
- 2 0 0
- 2 0 0
- 2 0 0
- 2 0 0
- 2 0 0
-200
- 2 0 0
-2 0 0
- 2 0 0
- 2 0 0
- 2 0 0
- 2 0 0
- 2 0 0
- 2 0 0
- 2 0 0
- 2 0 0
- 2
0 0
- 2 0 0
- 2 0 0
- 2 0 0
- 2 0 0
- 2 0 0
- 2 0 0-2 0 0
-200
- 2 0 0
8/12/2019 Powering Countries, States and the World With Wind, Water and Sunlight
http://slidepdf.com/reader/full/powering-countries-states-and-the-world-with-wind-water-and-sunlight 20/30
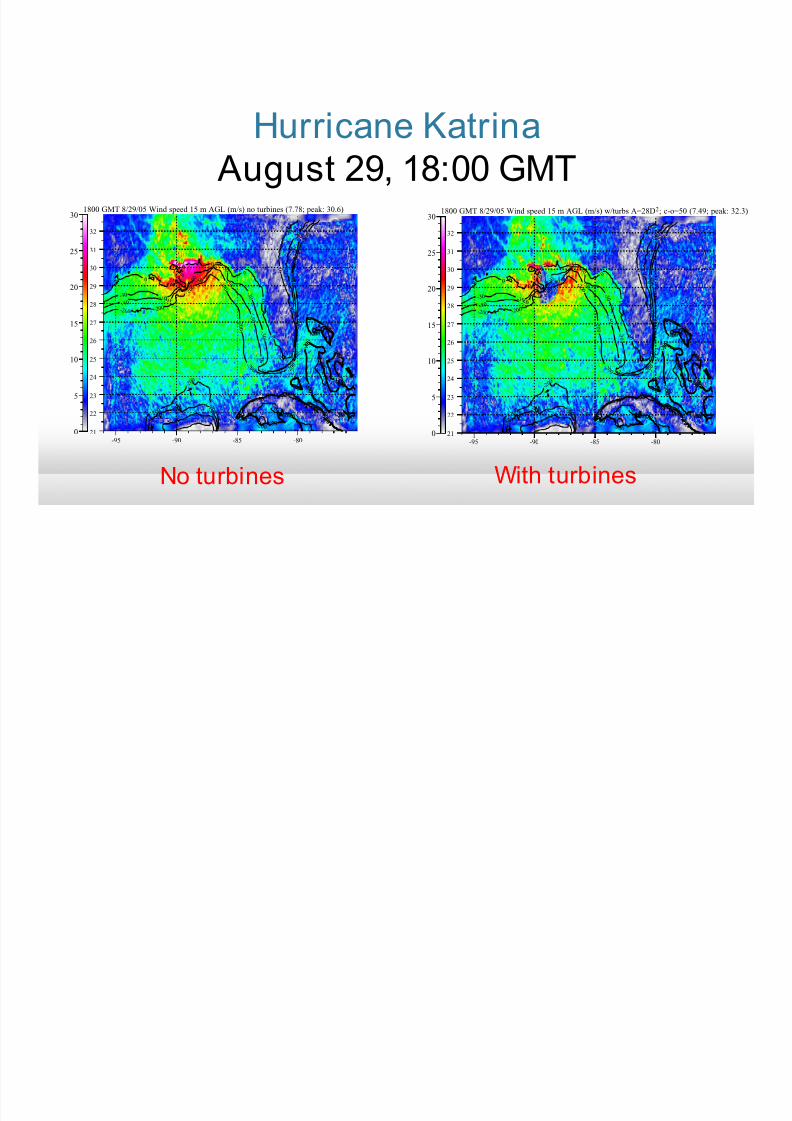
No turbines With turbines
Hurricane Katrina August 29, 18:00 GMT
-95 -90 -85 -8021
22
23
24
25
26
27
28
29
30
31
32
1800 GMT 8/29/05 Wind speed 15 m AGL (m/s) no turbines (7.78; peak: 30.6)
0
5
10
15
20
25
30
0
0
0
0
0
0
0
0
0
0
0
0
0
0 0
0
0 0 0
- 3 0
- 3 0-30
- 3 0 - 3 0
- 3 0
-30
- 3 0
- 3 0
- 3 0
- 3 0
- 3 0
- 3 0
- 3 0
- 3
0
- 3 0
- 3 0
- 3 0
- 3 0
- 3 0
- 3 0
- 3 0
- 30 - 3 0
- 3 0
- 3 0
- 5 0
-5 0 - 5 0
- 5 0
-5 0-50
- 5 0 - 5 0
- 5 0
-50
- 5 0
- 5 0
- 5 0
- 5 0
- 5 0
- 5 0
- 5 0
- 5 0
- 5
0
- 5 0 -
5 0
- 5 0
- 5 0
- 5 0
-5 0 - 5 0
- 5 0
- 5 0
- 2 0 0
- 2 0 0
- 2 0 0
- 2 0 0
- 2 0 0
- 2 0 0
-200
- 2 0 0
-2 0 0
- 2 0 0
- 2 0 0
- 2 0 0
- 2 0 0
- 2 0 0
- 2 0 0
- 2 0 0
- 2 0 0
- 2
0 0
- 2 0 0
- 2 0 0
- 2 0 0
- 2 0 0
- 2 0 0
- 2 0 0-2 0 0
-200
- 2 0 0
-95 -90 -85 -8021
22
23
24
25
26
27
28
29
30
31
32
1800 GMT 8/29/05 Wind speed 15 m AGL (m/s) w/turbs A=28D2; c-o=50 (7.49; peak: 32.3)
0
5
10
15
20
25
30
0
0
0
0
0
0
0
0
0
0
0
0
0
0 0
0
0 0 0
- 3 0
- 3 0-30
- 3 0 - 3 0
- 3 0
-30
- 3 0
- 3 0
- 3 0
- 3 0
- 3 0
- 3 0
- 3 0
- 3
0
- 3 0
- 3 0
- 3 0
- 3 0
- 3 0
- 3 0
- 3 0
- 30 - 3 0
- 3 0
- 3 0
- 5 0
-5 0 - 5 0
- 5 0
-5 0-50
- 5 0 - 5 0
- 5 0
-50
- 5 0
- 5 0
- 5 0
- 5 0
- 5 0
- 5 0
- 5 0
- 5 0
- 5
0
- 5 0 -
5 0
- 5 0
- 5 0
- 5 0
-5 0 - 5 0
- 5 0
- 5 0
- 2 0 0
- 2 0 0
- 2 0 0
- 2 0 0
- 2 0 0
- 2 0 0
-200
- 2 0 0
-2 0 0
- 2 0 0
- 2 0 0
- 2 0 0
- 2 0 0
- 2 0 0
- 2 0 0
- 2 0 0
- 2 0 0
- 2 0
0
- 2 0 0
- 2 0 0
- 2 0 0
- 2 0 0
- 2 0 0
- 2 0 0-2 0 0
-200
- 2 0 0

8/12/2019 Powering Countries, States and the World With Wind, Water and Sunlight
http://slidepdf.com/reader/full/powering-countries-states-and-the-world-with-wind-water-and-sunlight 21/30
Hart and Jacobson (2011); www.stanford.edu/~ehart/
Matching Power Demand With Solar, Wind, Geothermal, Hydro
California electricity was found to be obtainable from WWS for 99.8% of all hours in2005, 2006 without over-sizing WWS capacity, using demand-response, or usingmuch CSP storage.

8/12/2019 Powering Countries, States and the World With Wind, Water and Sunlight
http://slidepdf.com/reader/full/powering-countries-states-and-the-world-with-wind-water-and-sunlight 22/30
ENERGY TECHNOLOGY 2010-2013 2020-2030
Wind onshore 4-10.5 ≤4Wind offshore 11.3-16.5 7-10.9Wave >11 4-11Geothermal 9.9-15.2 5.5-8.8
Hydroelectric 4-6 4CSP 14.1-22.6 7-8Solar PV (utility scale) 11.1-15.9 5.5Tidal >>11 5-7Conventional (+Externalities) 9.2 (+5.3)=14.514-19 (+5.7)=20-25
Costs of Energy, Including Transmission (¢/kWh)
Jacobson et al. (2013)
8/12/2019 Powering Countries, States and the World With Wind, Water and Sunlight
http://slidepdf.com/reader/full/powering-countries-states-and-the-world-with-wind-water-and-sunlight 23/30
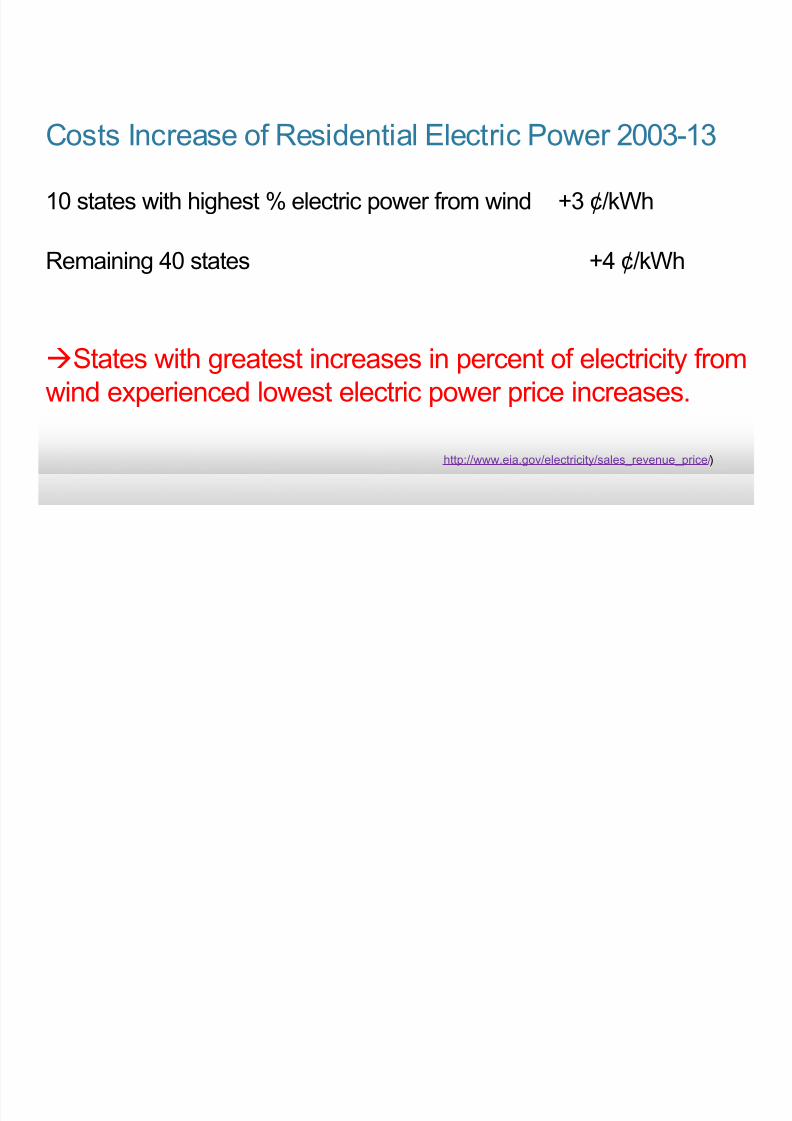
10 states with highest % electric power from wind +3 ¢/kWh
Remaining 40 states +4 ¢/kWh
States with greatest increases in percent of electricity fromwind experienced lowest electric power price increases.
Costs Increase of Residential Electric Power 2003-13
http://www.eia.gov/electricity/sales_revenue_price/)

8/12/2019 Powering Countries, States and the World With Wind, Water and Sunlight
http://slidepdf.com/reader/full/powering-countries-states-and-the-world-with-wind-water-and-sunlight 24/30
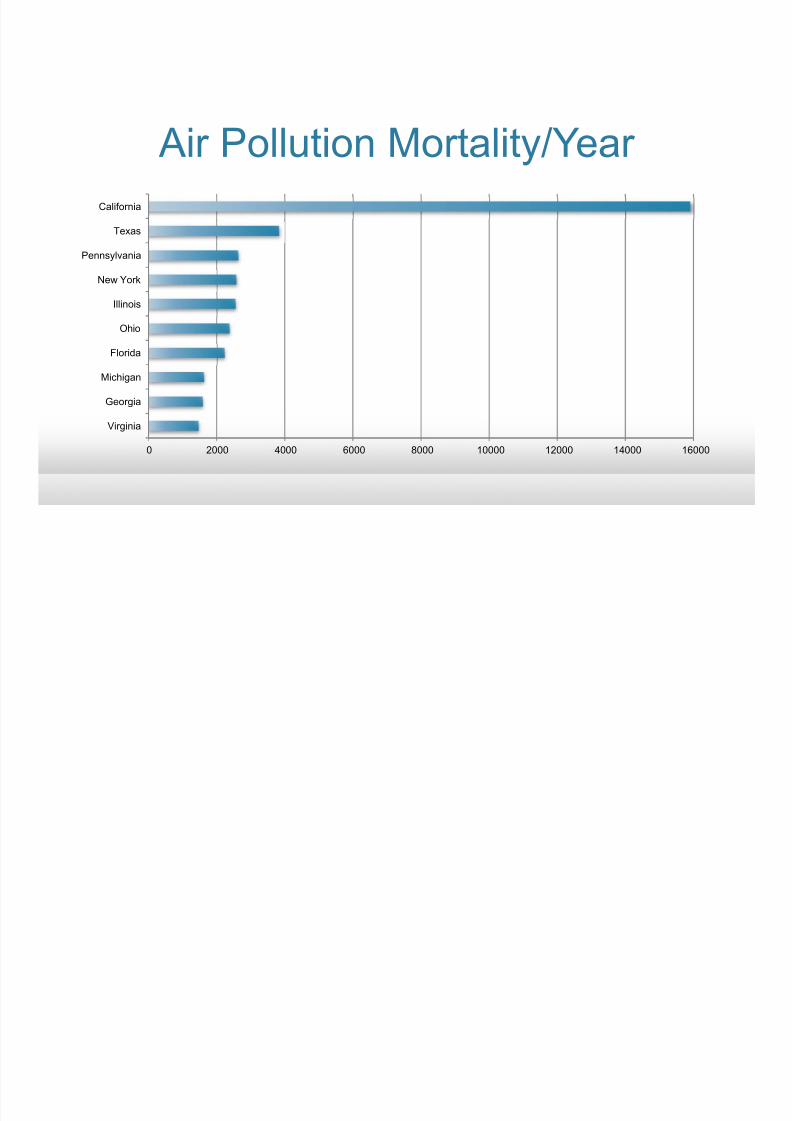
Health Cost Savings due to WWS in the U.S.
Air pollution kills 60,000 (18,000-109,000) people per year in
the U.S. prematurely, costing $534 (166-980) billion/year,or 3.3 (1-6.1) % of U.S. GDP.
July 15, 2012 by DS Jacobson
8/12/2019 Powering Countries, States and the World With Wind, Water and Sunlight
http://slidepdf.com/reader/full/powering-countries-states-and-the-world-with-wind-water-and-sunlight 25/30
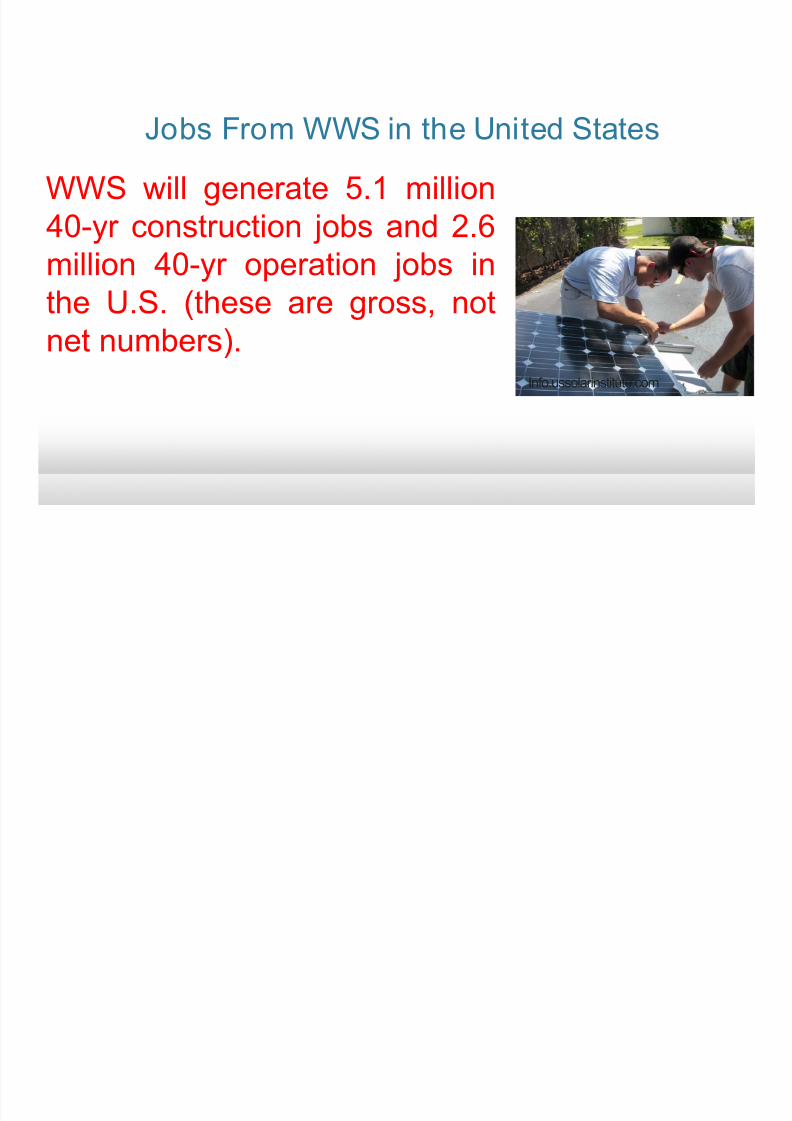
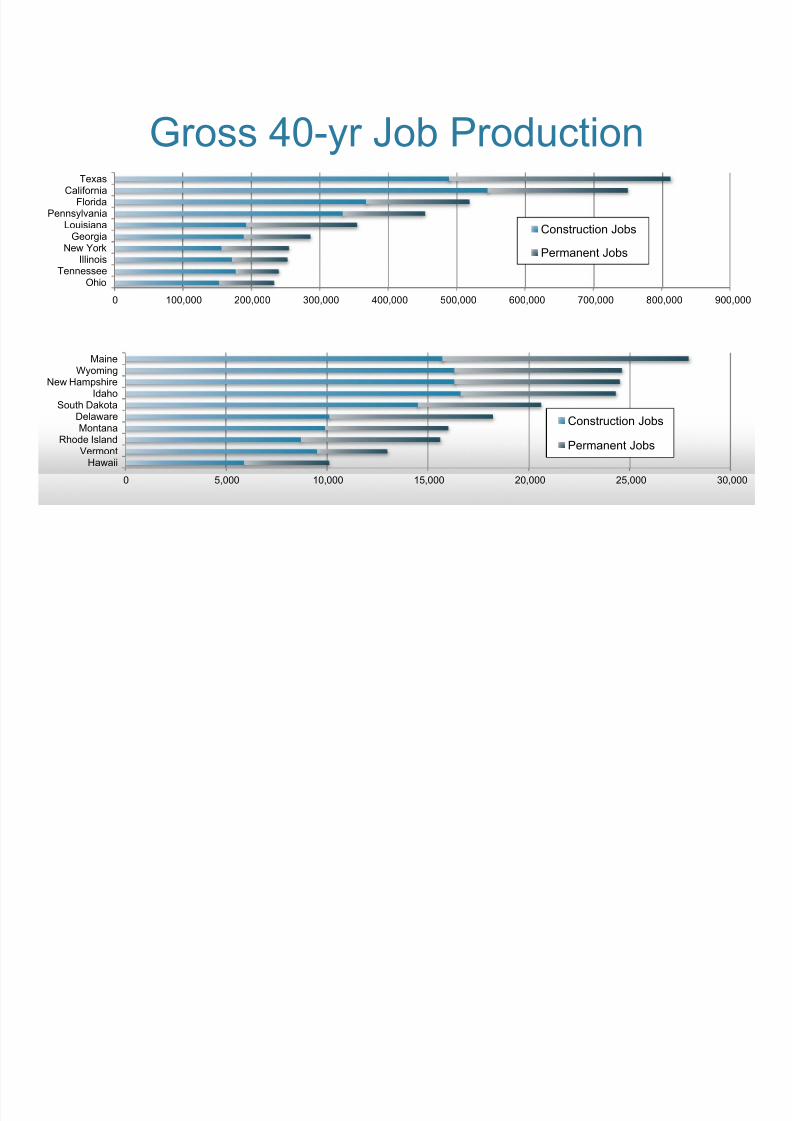
Jobs From WWS in the United States
WWS will generate 5.1 million
40-yr construction jobs and 2.6million 40-yr operation jobs inthe U.S. (these are gross, notnet numbers).
Info.ussolarinstitute.com
8/12/2019 Powering Countries, States and the World With Wind, Water and Sunlight
http://slidepdf.com/reader/full/powering-countries-states-and-the-world-with-wind-water-and-sunlight 26/30
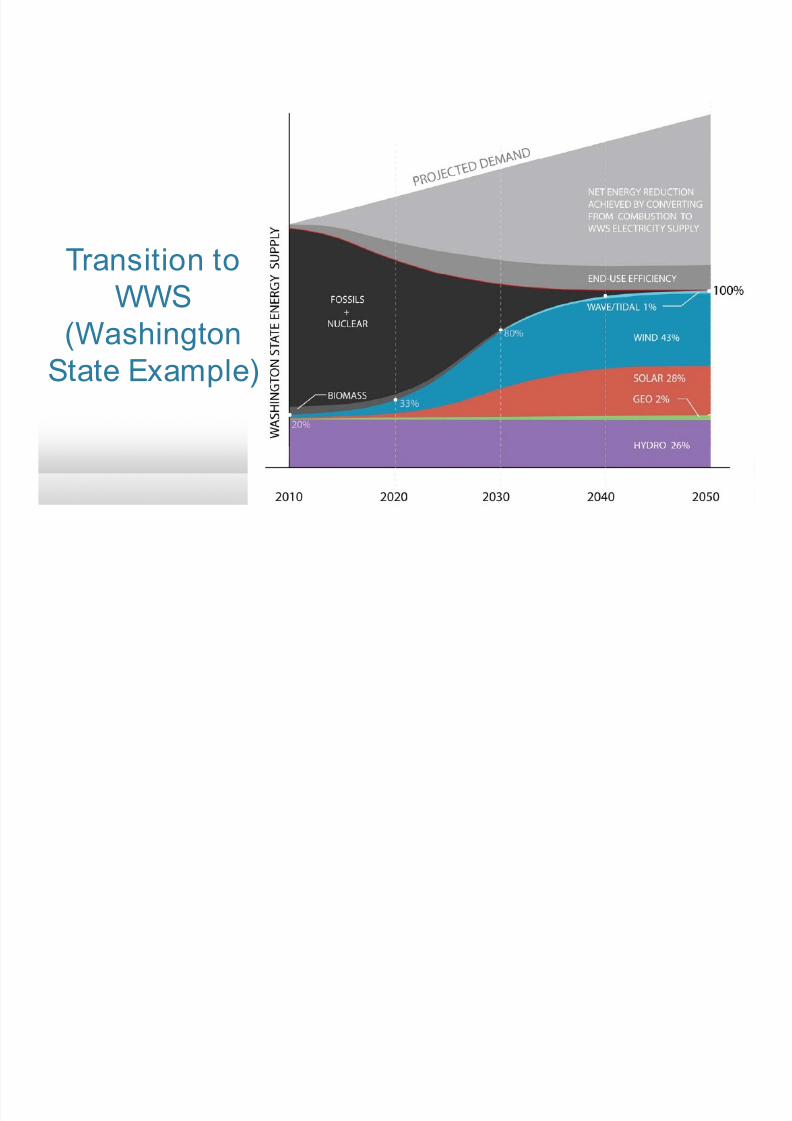
Transition toWWS
(WashingtonState Example)
8/12/2019 Powering Countries, States and the World With Wind, Water and Sunlight
http://slidepdf.com/reader/full/powering-countries-states-and-the-world-with-wind-water-and-sunlight 27/30
Gross 40-yr Job Production
0 100,000 200,000 300,000 400,000 500,000 600,000 700,000 800,000 900,000
OhioTennessee
IllinoisNew York
GeorgiaLouisiana
PennsylvaniaFlorida
CaliforniaTexas
Construction Jobs
Permanent Jobs
0 5,000 10,000 15,000 20,000 25,000 30,000
HawaiiVermont
Rhode IslandMontana
DelawareSouth Dakota
IdahoNew Hampshire
WyomingMaine
Construction Jobs
Permanent Jobs
8/12/2019 Powering Countries, States and the World With Wind, Water and Sunlight
http://slidepdf.com/reader/full/powering-countries-states-and-the-world-with-wind-water-and-sunlight 28/30
Air Pollution Mortality/Year
0 2000 4000 6000 8000 10000 12000 14000 16000
Virginia
Georgia
Michigan
Florida
Ohio
Illinois
New York
Pennsylvania
Texas
California
8/12/2019 Powering Countries, States and the World With Wind, Water and Sunlight
http://slidepdf.com/reader/full/powering-countries-states-and-the-world-with-wind-water-and-sunlight 29/30
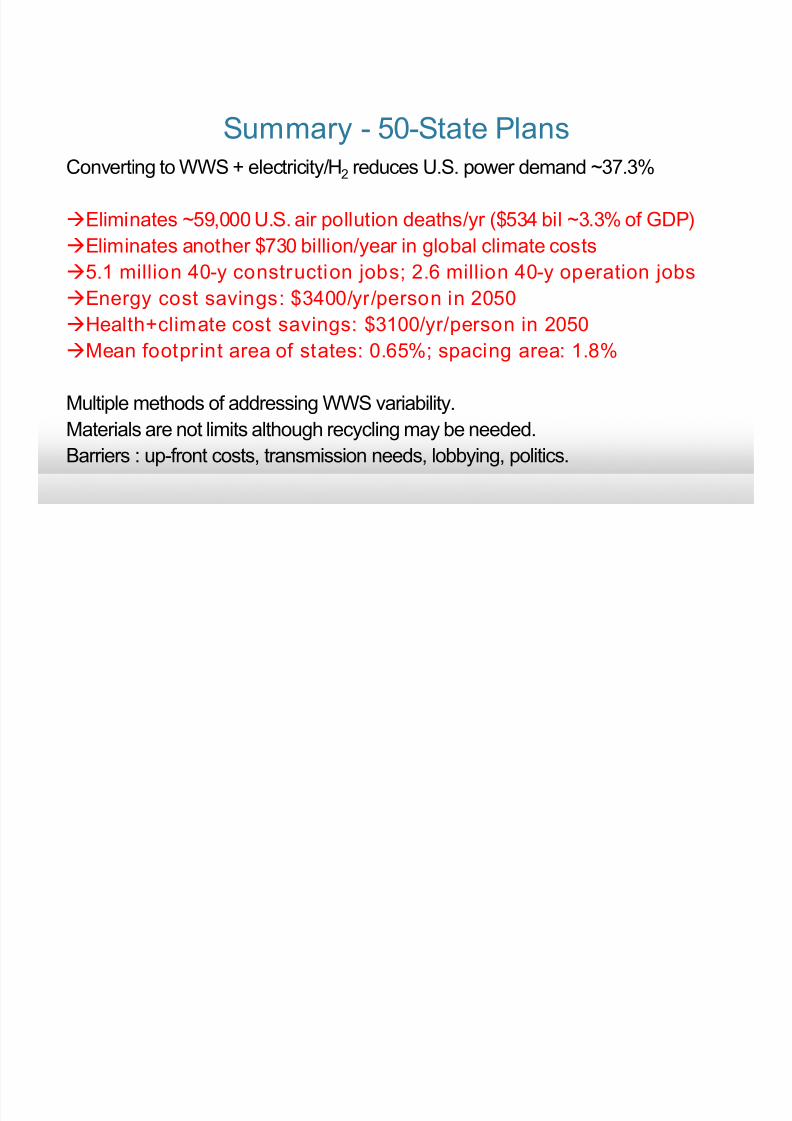
Converting to WWS + electricity/H2 reduces U.S. power demand ~37.3%
Eliminates ~59,000 U.S. air pollution deaths/yr ($534 bil ~3.3% of GDP)Eliminates another $730 billion/year in global climate costs
5.1 million 40-y construction jobs; 2.6 million 40-y operation jobs
Energy cost savings: $3400/yr/person in 2050
Health+climate cost savings: $3100/yr/person in 2050Mean footprint area of states: 0.65%; spacing area: 1.8%
Multiple methods of addressing WWS variability.
Materials are not limits although recycling may be needed.Barriers : up-front costs, transmission needs, lobbying, politics.
Summary - 50-State Plans
8/12/2019 Powering Countries, States and the World With Wind, Water and Sunlight
http://slidepdf.com/reader/full/powering-countries-states-and-the-world-with-wind-water-and-sunlight 30/30
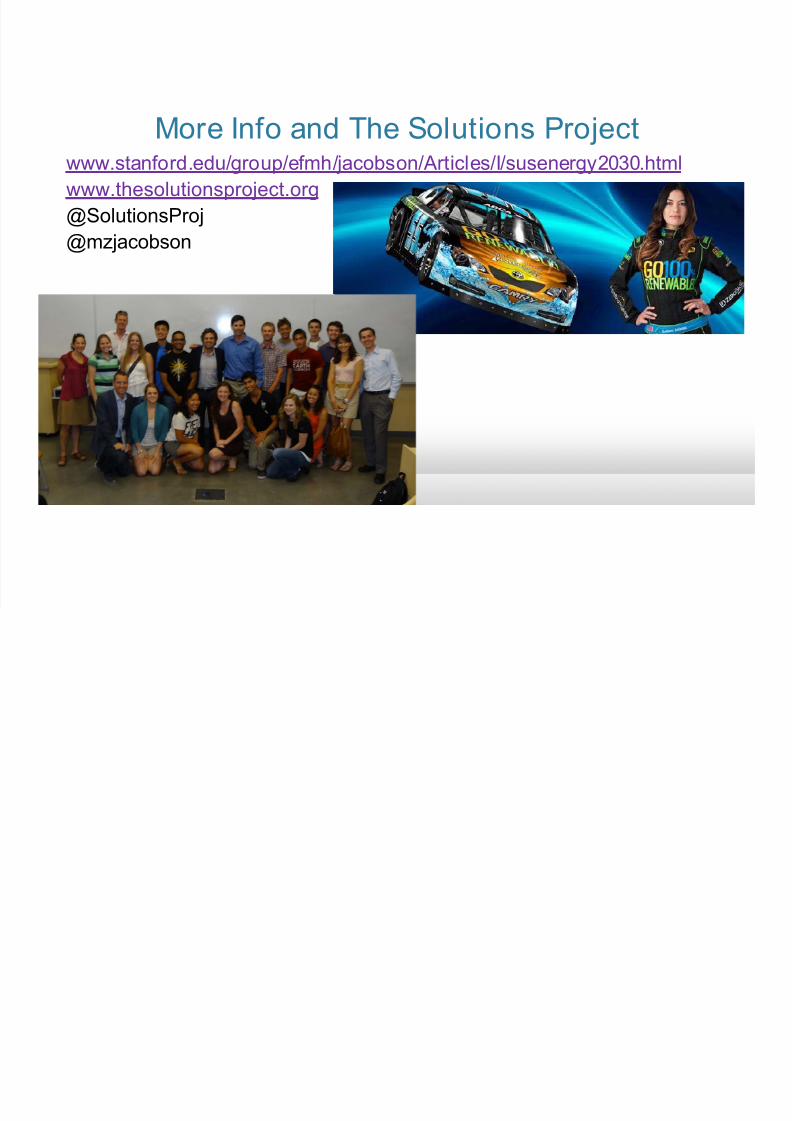
www.stanford.edu/group/efmh/jacobson/Articles/I/susenergy2030.html
www.thesolutionsproject.org
@SolutionsProj@mzjacobson
More Info and The Solutions Project