powerpoint-presentation€“ pipelines and epf in progress • successful exploration –...
TRANSCRIPT

Q1 20188 May 2018
Q1-18 Highlights
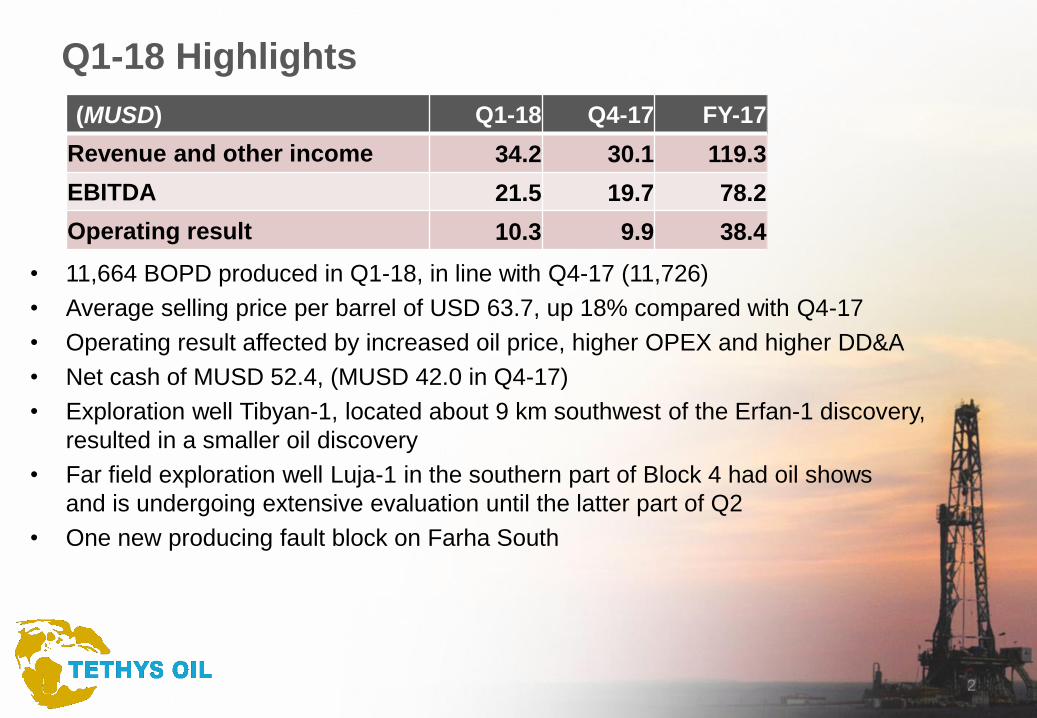
• 11,664 BOPD produced in Q1-18, in line with Q4-17 (11,726)
• Average selling price per barrel of USD 63.7, up 18% compared with Q4-17
• Operating result affected by increased oil price, higher OPEX and higher DD&A
• Net cash of MUSD 52.4, (MUSD 42.0 in Q4-17)
• Exploration well Tibyan-1, located about 9 km southwest of the Erfan-1 discovery,
resulted in a smaller oil discovery
• Far field exploration well Luja-1 in the southern part of Block 4 had oil shows
and is undergoing extensive evaluation until the latter part of Q2
• One new producing fault block on Farha South
2
(MUSD) Q1-18 Q4-17 FY-17
Revenue and other income 34.2 30.1 119.3
EBITDA 21.5 19.7 78.2
Operating result 10.3 9.9 38.4
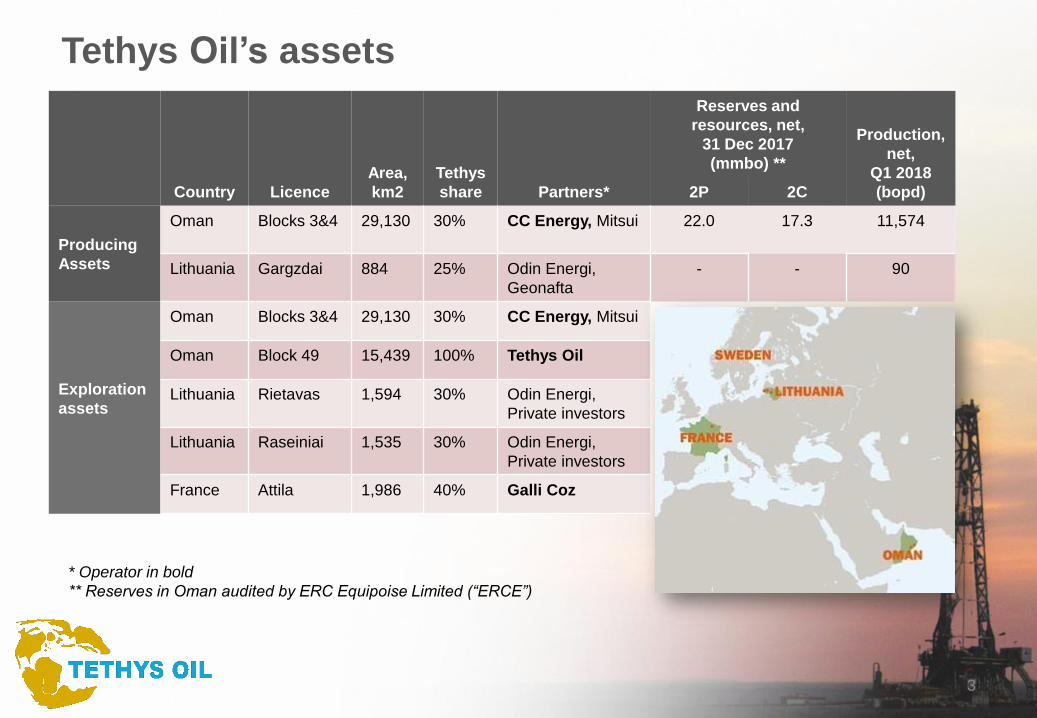
Tethys Oil’s assets
Country Licence
Area,
km2
Tethys
share Partners*
Reserves and
resources, net,
31 Dec 2017
(mmbo) **
Production,
net,
Q1 2018
(bopd)2P 2C
Producing
Assets
Oman Blocks 3&4 29,130 30% CC Energy, Mitsui 22.0 17.3 11,574
Lithuania Gargzdai 884 25% Odin Energi,
Geonafta
- - 90
Exploration
assets
Oman Blocks 3&4 29,130 30% CC Energy, Mitsui
Oman Block 49 15,439 100% Tethys Oil
Lithuania Rietavas 1,594 30% Odin Energi,
Private investors
Lithuania Raseiniai 1,535 30% Odin Energi,
Private investors
France Attila 1,986 40% Galli Coz
* Operator in bold
** Reserves in Oman audited by ERC Equipoise Limited (“ERCE”)
3
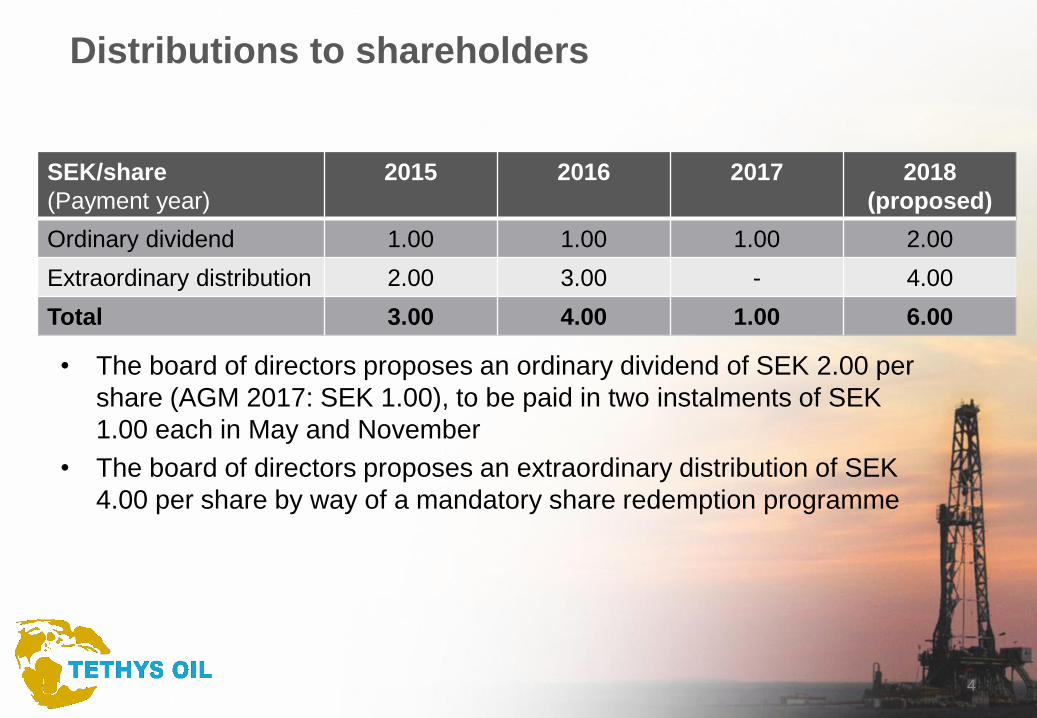
Distributions to shareholders
• The board of directors proposes an ordinary dividend of SEK 2.00 per
share (AGM 2017: SEK 1.00), to be paid in two instalments of SEK
1.00 each in May and November
• The board of directors proposes an extraordinary distribution of SEK
4.00 per share by way of a mandatory share redemption programme
4
SEK/share
(Payment year)
2015 2016 2017 2018
(proposed)
Ordinary dividend 1.00 1.00 1.00 2.00
Extraordinary distribution 2.00 3.00 - 4.00
Total 3.00 4.00 1.00 6.00

Reserves Blocks 3&4 Oman (audited)
mmbo 1P 2P 3P
Farha South 9.2 11.8 16.1
Shahd 3.4 5.6 8.9
Saiwan East 0.6 1.3 1.8
New areas 2.3 3.4 5.7
Total 15.6 22.0 32.4
5
Reserves and resources at Dec 31, 2017
2017 year-end reserves and resources report prepared by ERCE
• Internal reserve replacement ratio of 2P is
114%
Contingent Resources Blocks 3&4
Oman (audited)
mmbo 1C 2C 3C
Total 10.1 17.3 27.3
• Contingent resources relate to the
Erfan, Ulfa and Samah discoveries
made in 2017
• The resources are contingent on
the on-going appraisal programme
and a work programme and
budget to develop them

1,4
1,72,8
3,5
4,4
4,4
7,7
3,0
7,9
6,3
6,3
7,1
0
5
10
15
20
25
30
35
Field Development Plan for
Blocks 3 and 4 approved
Development of resources, Blocks 3&4mmbo
12,4
18,720,0
25,1
27,9
Reserve Replacement Ratio (“RRR”)
Tethys Oil’s accumulated net production, from 2010
until 31 Mar 2018, amounts to 19,7 mmbo
29,7
6
RRR 193%
RRR 113%RRR 171% 32,4
RRR 114%
27,3
RRR 154%

• Production on Blocks 3&4 in Q1-18 amounted to 1.04 mmbo (Q4-17:
1.07 mmbo)
• Production guidance for 2018 is a monthly average production of
between 11,000-13,000 bopd
Average daily production, Blocks 3&4
7
0
2 000
4 000
6 000
8 000
10 000
12 000
14 000
Ja
nu
ary
Fe
bru
ary
Ma
rch
Apri
l
Ma
y
Ju
ne
Ju
ly
Aug
ust
Sep
tem
be
r
Octo
ber
Novem
be
r
Decem
be
r
Ja
nu
ary
Fe
bru
ary
Ma
rch
Q1-17 Q2-17 Q3-17 Q4-17 Q1-18
BOPD

8
• Average daily production in Q1-18 amounted to 11,574 bopd
(Q4-17: 11,637 bopd)
Production, Blocks 3&4
3,54
4,44 4,44
0
2 000
4 000
6 000
8 000
10 000
12 000
14 000
0,00
0,50
1,00
1,50
2,00
2,50
3,00
3,50
4,00
4,50
5,00
2015 2016 2017
BOPDmmbl
Total production Ave daily production
0
2 000
4 000
6 000
8 000
10 000
12 000
14 000
0,00
0,20
0,40
0,60
0,80
1,00
1,20
Q1-17 Q2-17 Q3-17 Q4-17 Q1-18
BOPDmmbl
Total production Ave daily production

Average achieved selling price per barrel
• Average achieved selling price amounted to USD 63.7/bbl, up 18%
compared with Q4-17 (USD 53.9/bbl)
• 2 months delay in achieved selling price
9
58,1
40,5
51,8
20,0
40,0
60,0
2015 2016 2017
USD/bbl
50,7
53,7
48,6
53,9
63,7
40,0
45,0
50,0
55,0
60,0
65,0
Q1-17 Q2-17 Q3-17 Q4-17 Q1-18
USD/bbl

107,0
87,1
119,3
0,0
20,0
40,0
60,0
80,0
100,0
120,0
140,0
2015 2016 2017
MUSD
• Q1-18 Revenue and other income is up 14% compared with
Q4-17 mainly due to the increase in oil prices despite total
barrels produced being slightly lower
10
Revenue and other income
29,331,4
28,530,1
34,2
0,0
5,0
10,0
15,0
20,0
25,0
30,0
35,0
40,0
Q1-17 Q2-17 Q3-17 Q4-17 Q1-18
MUSD

Expenses
• Total OPEX up 29% compared with Q4-17 mainly due to
costs incurred in 2017 impacting the first quarter 2018
• Due to the impact of 2017 costs in the first quarter 2018, the quarter
is not representative of 2018 operating expenses.
11
42,936,5 34,9
5,2
5,8 5,9
0,0
10,0
20,0
30,0
40,0
50,0
60,0
2015 2016 2017
MUSD
Operating expenses Administrative expenses
8,5 8,29,2 9,0
11,6
1,4 2,11,1 1,4
1,1
0,0
2,0
4,0
6,0
8,0
10,0
12,0
14,0
Q1-17 Q2-17 Q3-17 Q4-17 Q1-18
MUSD
Operating expenses Administrative expenses
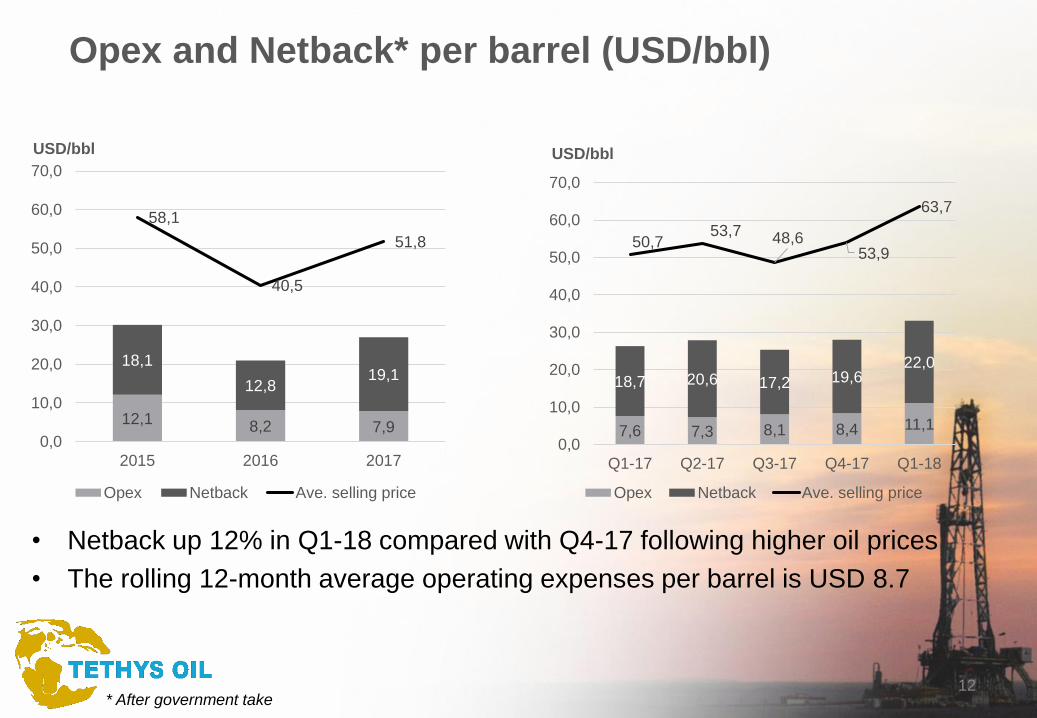
Opex and Netback* per barrel (USD/bbl)
12* After government take
• Netback up 12% in Q1-18 compared with Q4-17 following higher oil prices
• The rolling 12-month average operating expenses per barrel is USD 8.7
12,18,2 7,9
18,1
12,819,1
58,1
40,5
51,8
0,0
10,0
20,0
30,0
40,0
50,0
60,0
70,0
2015 2016 2017
USD/bbl
Opex Netback Ave. selling price
7,6 7,3 8,1 8,4 11,1
18,7 20,6 17,2 19,622,0
50,753,7 48,6
53,9
63,7
0,0
10,0
20,0
30,0
40,0
50,0
60,0
70,0
Q1-17 Q2-17 Q3-17 Q4-17 Q1-18
USD/bbl
Opex Netback Ave. selling price

EBITDA
• EBITDA of MUSD 21.5 in Q1-18, up 9% compared with Q4-17
• EBITDA margin amounted to 63% in Q1-18
13
58,6
44,0
78,2
0,0
10,0
20,0
30,0
40,0
50,0
60,0
70,0
80,0
90,0
2015 2016 2017
MUSD
19,3
21,0
18,2
19,7
21,5
16,0
17,0
18,0
19,0
20,0
21,0
22,0
Q1-17 Q2-17 Q3-17 Q4-17 Q1-18
MUSD

Balance Sheet
• Net cash position of MUSD 52.4, up from MUSD 42.0 on Dec 31, 2017
• Proposed distribution to shareholders of SEK 6.00 per share
– dividend of SEK 2.00 per share to be paid in two instalments of SEK 1.00 per share
– extraordinary distribution of SEK 4.00 by way of a mandatory share redemption
programme
– total distribution amounts to appr. MUSD 23
14
(MUSD) 2018-03-31 2017-12-31 2017-03-31
Net cash 52.4 42.0 40.1
Total assets 257.7 244.7 243.9
Shareholders’ equity 238.4 228.5 206.0
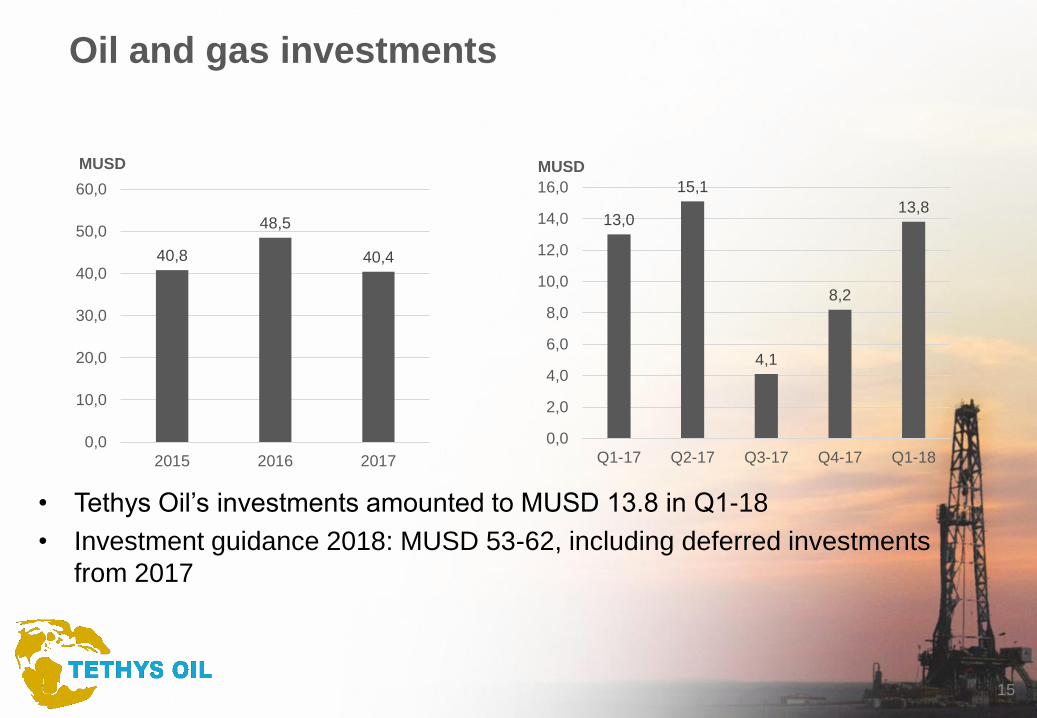
• Tethys Oil’s investments amounted to MUSD 13.8 in Q1-18
• Investment guidance 2018: MUSD 53-62, including deferred investments
from 2017
15
Oil and gas investments
40,8
48,5
40,4
0,0
10,0
20,0
30,0
40,0
50,0
60,0
2015 2016 2017
MUSD
13,0
15,1
4,1
8,2
13,8
0,0
2,0
4,0
6,0
8,0
10,0
12,0
14,0
16,0
Q1-17 Q2-17 Q3-17 Q4-17 Q1-18
MUSD

Wells on Blocks 3&4
16
Wells completed Q1-18 Farha South
Field
Shahd and
Saiwan East Fields
Near and
far field
Total
Appraisal/Production 4 - - 4
Water injection 4 1 - 5
Water source - 1 - 1
Exploration - - 2 2
Total 8 2 2 12
40
38
43
35
36
37
38
39
40
41
42
43
44
2015 2016 2017
14
12
98
12
0
2
4
6
8
10
12
14
16
Q1-17 Q2-17 Q3-17 Q4-17 Q1-18
17
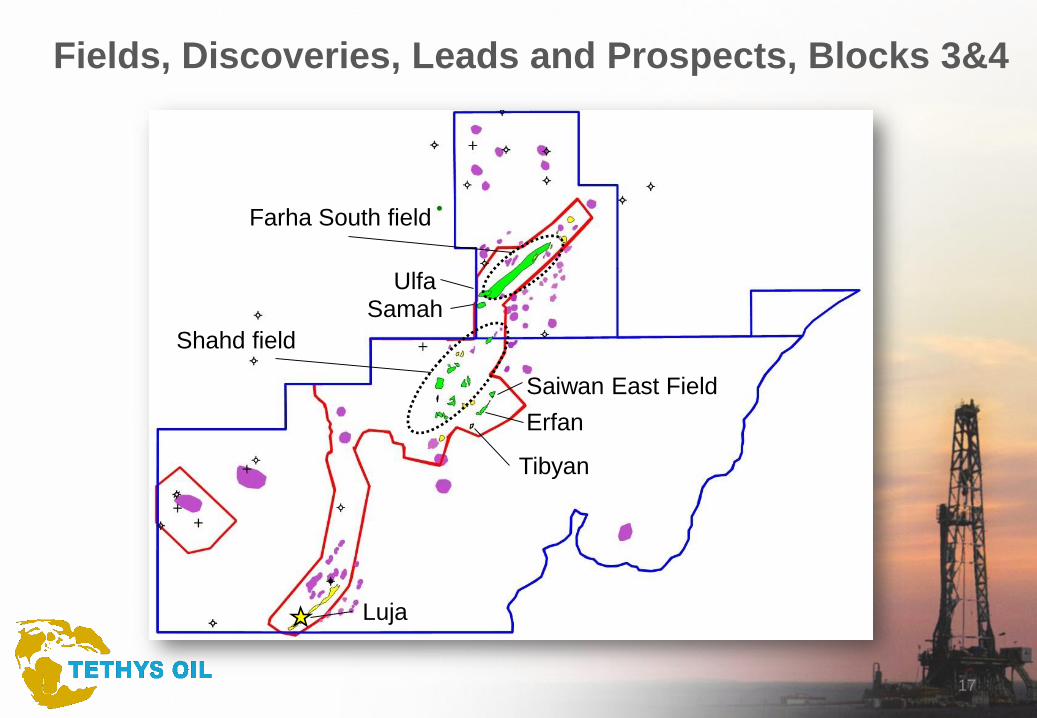
Fields, Discoveries, Leads and Prospects, Blocks 3&4
UlfaSamah
Farha South field
Shahd field
Saiwan East Field
Erfan
Tibyan
Luja
18
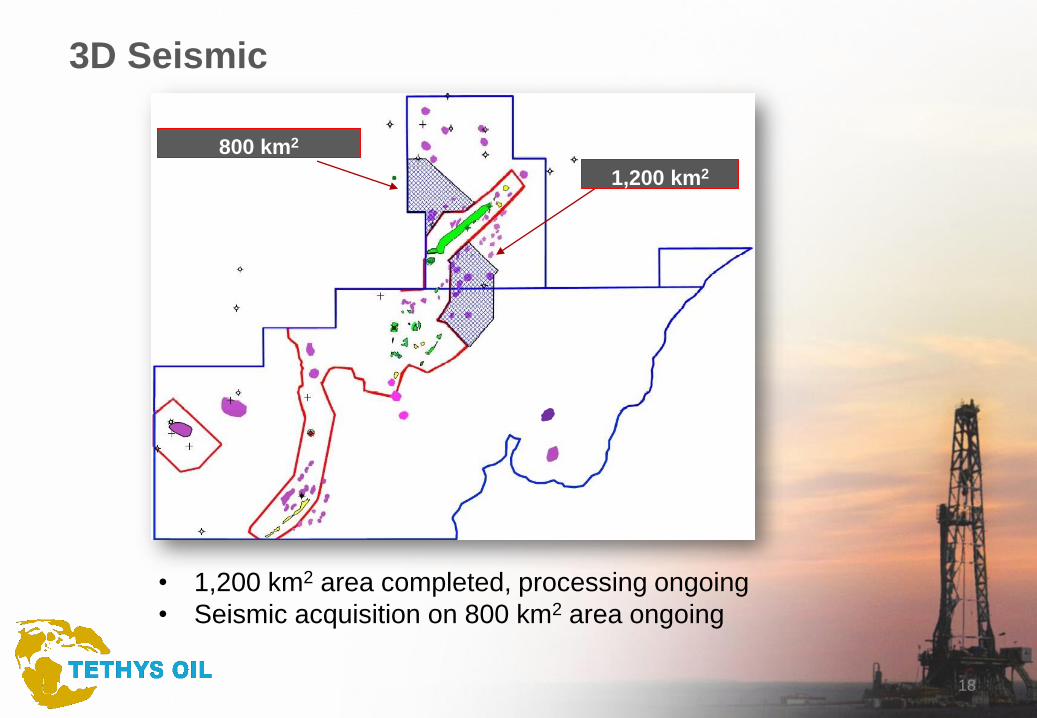
3D Seismic
800 km2
1,200 km2
• 1,200 km2 area completed, processing ongoing
• Seismic acquisition on 800 km2 area ongoing
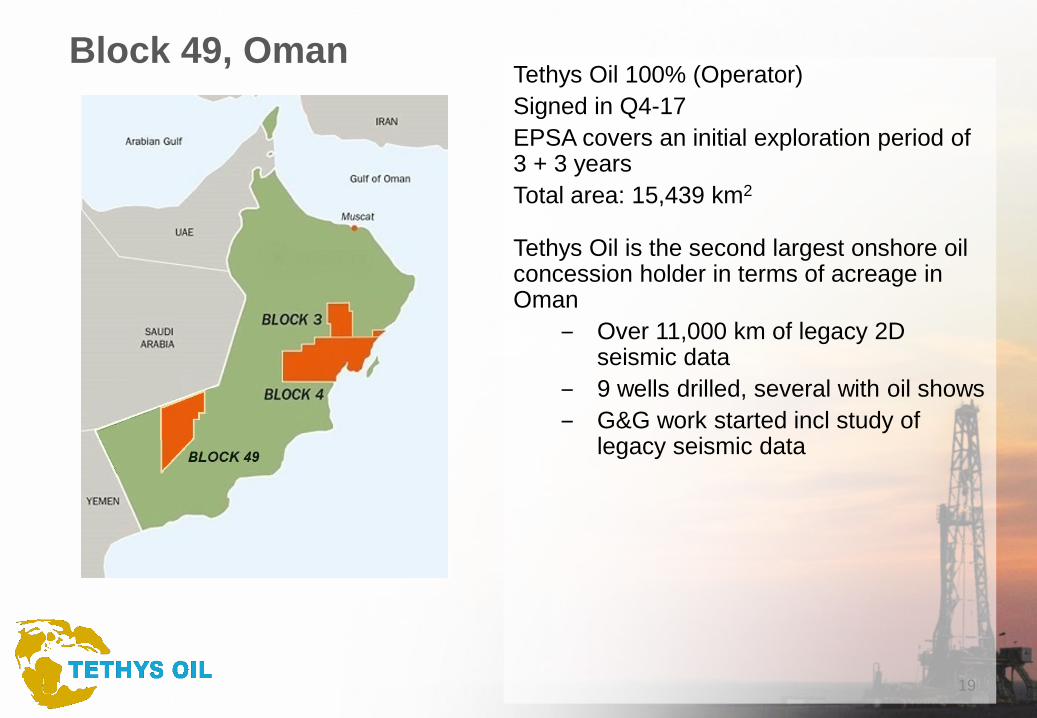
Tethys Oil 100% (Operator)
Signed in Q4-17
EPSA covers an initial exploration period of 3 + 3 years
Total area: 15,439 km2
Tethys Oil is the second largest onshore oil concession holder in terms of acreage in Oman
‒ Over 11,000 km of legacy 2D seismic data
‒ 9 wells drilled, several with oil shows
‒ G&G work started incl study of legacy seismic data
Block 49, Oman
19

Available Data (Block 49)
20
Block 49
Block 57
Block 58
Block 6
Shisr-1
Reported oil shows
Extensive legacy seismic coverage, more than 20 separate surveys of different vintages and one 3D from 2010
A tender process for reprocessing of legacy seismic data was conducted in the quarter.
21
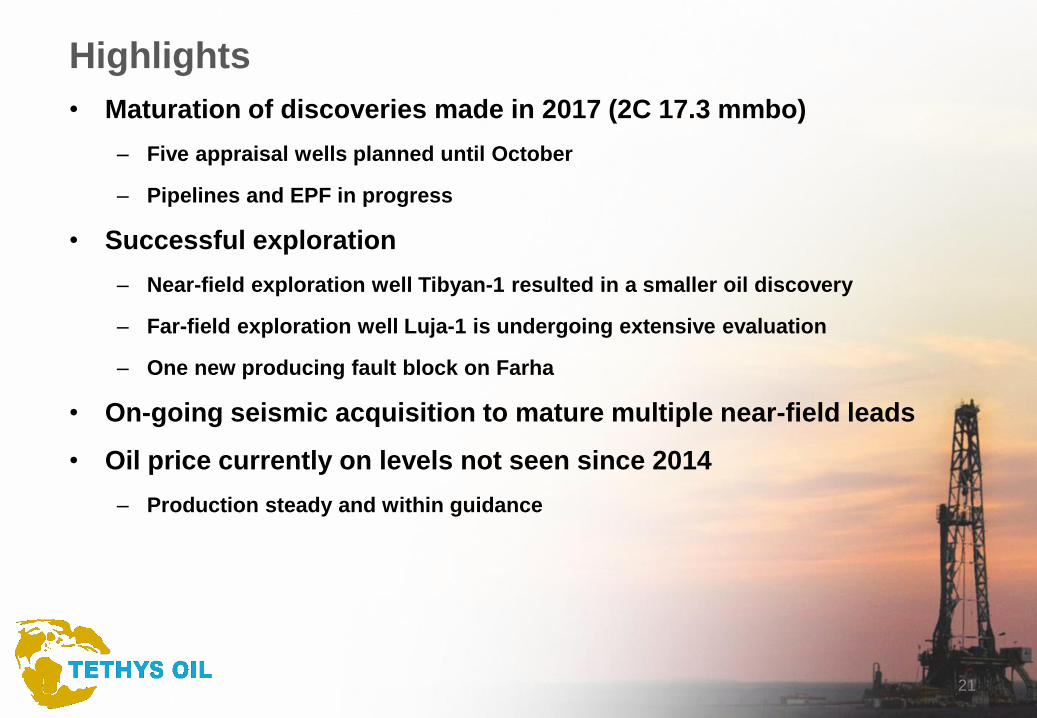
Highlights
• Maturation of discoveries made in 2017 (2C 17.3 mmbo)
– Five appraisal wells planned until October
– Pipelines and EPF in progress
• Successful exploration
– Near-field exploration well Tibyan-1 resulted in a smaller oil discovery
– Far-field exploration well Luja-1 is undergoing extensive evaluation
– One new producing fault block on Farha
• On-going seismic acquisition to mature multiple near-field leads
• Oil price currently on levels not seen since 2014
– Production steady and within guidance

Q2 2018Will be published 14 August 2018!
Important notice
This presentation and the information contained herein is being presented by the Company.
This presentation and the information contained herein do not constitute an offer to sell or invitation to purchase or subscribe for any securities,
commodities or instruments or related derivatives, nor do they constitute an offer or commitment to lend, syndicate or arrange a financing, underwrite
or purchase or act as an agent or advisor or in any other capacity with respect to any transaction, or commit capital, or to participate in any trading
strategies, and they do not constitute any legal, regulatory, accounting or tax advice to the recipient.
This presentation does not purport to be all-inclusive or to contain all the information that prospective investors may desire in analysing and deciding
whether or not to hold or transact in the Company’s shares. This document was prepared solely for informational purposes. Recipients of this
presentation must rely on their own examination of the legal, taxation, financial and other consequences of any possible holding or transaction involving
the Company’s shares or other securities, including the merits and risks involved. Recipients should not treat the contents of this presentation as advice
relating to legal, taxation or other matters and are advised to consult their own professional advisors concerning the acquisition, holding or disposal of
shares or other securities in the Company.
This document was prepared and the analyses contained in it based, in part, on certain assumptions made by and information obtained from the
Company, its directors, officers, employees, agents and/or affiliates. In addition, certain information contained in this presentation has been obtained
from third parties and published sources prepared by such third parties that the Company has deemed to be relevant. However, neither the Company
nor any of its affiliates, officers, employees or agents accepts or assumes any responsibility, obligation or liability (whether direct or indirect, in contract,
tort or otherwise) and makes no representation or warranty, express or implied, for the contents of this presentation or any oral information provided in
connection herewith, including its accuracy, completeness or verification for any other statement made or purported to be made by any of them, or on
their behalf. Nothing in this presentation is, or shall be relied upon as, a representation or promise made, whether as to the past, present or future.
This presentation contains forward-looking statements that reflect the Company’s current views with respect to certain future events and potential
financial performance. Although the Company believes that the expectations reflected in such forward-looking statements are reasonable, no
assurance can be given that such expectations will materialise. Accordingly, results could differ materially from those set out in the forward-looking
statements as a result of various factors, whether or not outside the control of the Company. To the extent that this presentation contains opinions,
estimates, forecasts or other forward looking statements, no guarantees or undertakings that these are correct or complete are given by the Company
or any of its members, advisors, officers or employees or any other person. Forecasts and assumptions which are subject to economic and competitive
uncertainty are outside such person’s control and no guarantee can be given that projected results will be achieved or that outcomes will correspond
with forecasts. You should not place undue reliance on the forward-looking statements. Forward-looking statements speak only at the date of this
document and the Company does not undertake any obligation to publicly update or revise any information contained herein. Information in this
presentation may be changed, added to or corrected without advance notification.
This document may contain terms, phrases and trademarks that are proprietary and the Company recognizes and acknowledges that all trademarks
are copyrighted, belonging to their respective owners.
This presentation as well as any other information provided by or on behalf of the Company shall be governed by Swedish law. Any dispute,
controversy or claim arising out of or in connection with such information or related matters shall be finally settled by arbitration in accordance with the
Arbitration Rules of the Arbitration Institute of the Stockholm Chamber of Commerce. The place of arbitration shall be Stockholm and the language to
be used in the arbitration proceedings shall be English.
23