powerpoint presentation - home | pfi - your industrial ... value gain on investment properties 5,970...
TRANSCRIPT


HIGHLIGHTS
4
▪ Internalisation of management on 30 June 2017
▪ Increased guidance: distributable profit of between 7.70 and 7.90 cents per share, cash dividend
of 7.45 cents per share
▪ Transition of the Penrose portfolio: approximately $13 million of shareholder value created
equating to a property level internal rate of return of approximately 24%
PROPERTY FOR INDUSTRY 2017 INTERIM RESULTS BRIEFING


PORTFOLIO SNAPSHOT
6
30 June 2017 31 December 2016 30 June 2016
Book value $1,096.0m $1,083.3m $1,010.1m
Number of properties 83 83 84
Number of tenants 144 143 142
Contract rent $73.2m $72.5m $72.6m
Occupancy 99.5% 99.6% 99.5%
Weighted average lease term 4.78 years 4.79 years 4.87 years
Auckland property 85.3% 85.3% 84.8%
Industrial property 85.4% 85.5% 85.0%
▪ PFI’s portfolio is diversified across 83 properties and 144 tenants, with 99.5% occupancy and a
weighted average lease term of 4.78 years, weighted towards Auckland industrial property
PROPERTY FOR INDUSTRY 2017 INTERIM RESULTS BRIEFING
PORTFOLIO PERFORMANCE
7
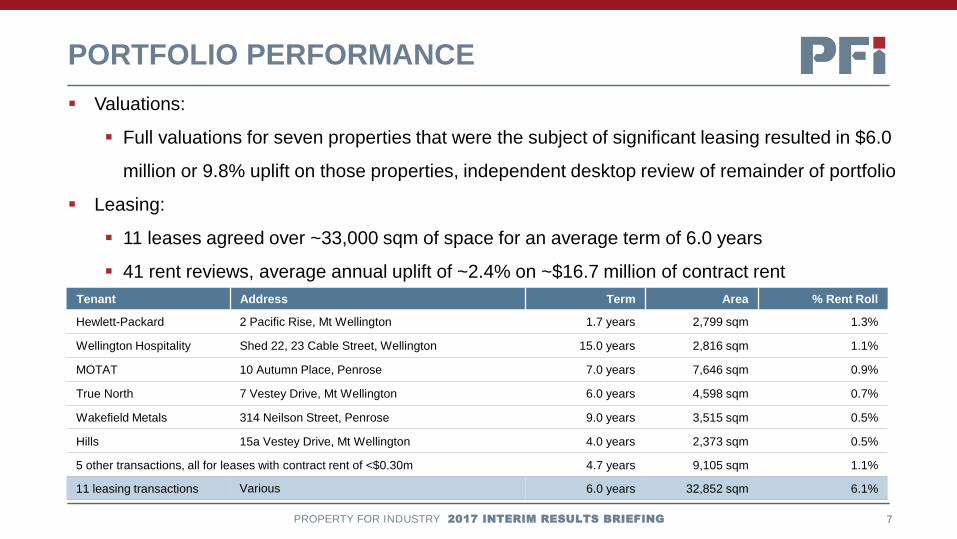
▪ Valuations:
▪ Full valuations for seven properties that were the subject of significant leasing resulted in $6.0
million or 9.8% uplift on those properties, independent desktop review of remainder of portfolio
▪ Leasing:
▪ 11 leases agreed over ~33,000 sqm of space for an average term of 6.0 years
▪ 41 rent reviews, average annual uplift of ~2.4% on ~$16.7 million of contract rent
PROPERTY FOR INDUSTRY 2017 INTERIM RESULTS BRIEFING
Tenant Address Term Area % Rent Roll
Hewlett-Packard 2 Pacific Rise, Mt Wellington 1.7 years 2,799 sqm 1.3%
Wellington Hospitality Shed 22, 23 Cable Street, Wellington 15.0 years 2,816 sqm 1.1%
MOTAT 10 Autumn Place, Penrose 7.0 years 7,646 sqm 0.9%
True North 7 Vestey Drive, Mt Wellington 6.0 years 4,598 sqm 0.7%
Wakefield Metals 314 Neilson Street, Penrose 9.0 years 3,515 sqm 0.5%
Hills 15a Vestey Drive, Mt Wellington 4.0 years 2,373 sqm 0.5%
5 other transactions, all for leases with contract rent of <$0.30m 4.7 years 9,105 sqm 1.1%
11 leasing transactions Various 6.0 years 32,852 sqm 6.1%

LEASE EVENTS
8
▪ ~42% of PFI’s portfolio subject to some form of lease
event during H2 2017
▪ Balanced spread of lease events, ~13% of H2 2017
events market related
PROPERTY FOR INDUSTRY 2017 INTERIM RESULTS BRIEFING
▪ Near term leasing outlook remains positive
▪ At 30 June 2017 just 5.5% of contract rent is due to
expire during H2 2017
▪ Since 30 June 2017 a further 1.8% of 2017 expiries
and 0.2% of vacancy has been leased
▪ Additional 1.3% of 2017 expiries are in advanced
stages of negotiation

PENROSE PORTFOLIO
9PROPERTY FOR INDUSTRY 2017 INTERIM RESULTS BRIEFING
▪ Portfolio of five Penrose
properties purchased in
August 2015
▪ 93% of the properties
have been transitioned
▪ ~$13 million of
shareholder value has
been created
▪ Property level internal
rate of return of around
24%


MARKET UPDATE
11
▪ The New Zealand economy appears to be in good shape:
▪ ANZ: current economic cycle mature, but annual GDP growth ~3% over 2017 expected, well
above developed world average
▪ Economic growth translating into high levels of occupier demand for industrial property:
▪ CBRE: Auckland industrial vacancy just 1.7% or 210,000 sqm, new rental benchmarks being
set for prime grade assets, rental growth of ~3% for secondary grade assets in Q1 2017
▪ Industrial property confidence increased across the board:
▪ Colliers International: July 2017 Commercial Property Investor Confidence Survey shows
Auckland’s industrial investor confidence was the highest at a net positive of 60%
▪ Mix of strong economic growth, favourable occupier supply and demand dynamics and high levels of
investor market confidence resulted in industrial property yields falling a further ~30 basis points
(0.3%) in the first six months of 2017 (CBRE)
PROPERTY FOR INDUSTRY 2017 INTERIM RESULTS BRIEFING

STRATEGY
12
▪ PFI has always invested in quality industrial property in prime locations, believing that this investment focus
has the potential to deliver attractive returns with a low level of volatility
PROPERTY FOR INDUSTRY 2017 INTERIM RESULTS BRIEFING
▪ Retention of existing team as part of internalisation
ensures continuity of PFI’s successful strategy
▪ We aim to drive shareholder returns by:
▪ Active asset management: Managing the
vacancy and upcoming lease expiries
▪ Acquisitions: Opportunistically pursuing both
core and value-add industrial acquisitions
▪ Development: Maximising utilisation of the
portfolio
▪ Divestments: Divesting of non-core assets
when value is maximised and an opportunity to
recycle capital into industrial property arises

DIVESTMENTS
13PROPERTY FOR INDUSTRY 2017 INTERIM RESULTS BRIEFING
▪ ~$47 million of divestments over the last three years, including:
▪ 65 Hugo Johnston Drive, Penrose sold during H1 2017 to an owner occupier for $14.3 million,
$1.9 million gain on sale represented a 17.8% premium above the December 2016 book value
▪ Approximately 5% of the portfolio still considered non-core, PFI may look to divest over the medium
term as and when value has been maximised
ACQUISTIONS & DEVELOPMENTS
14PROPERTY FOR INDUSTRY 2017 INTERIM RESULTS BRIEFING
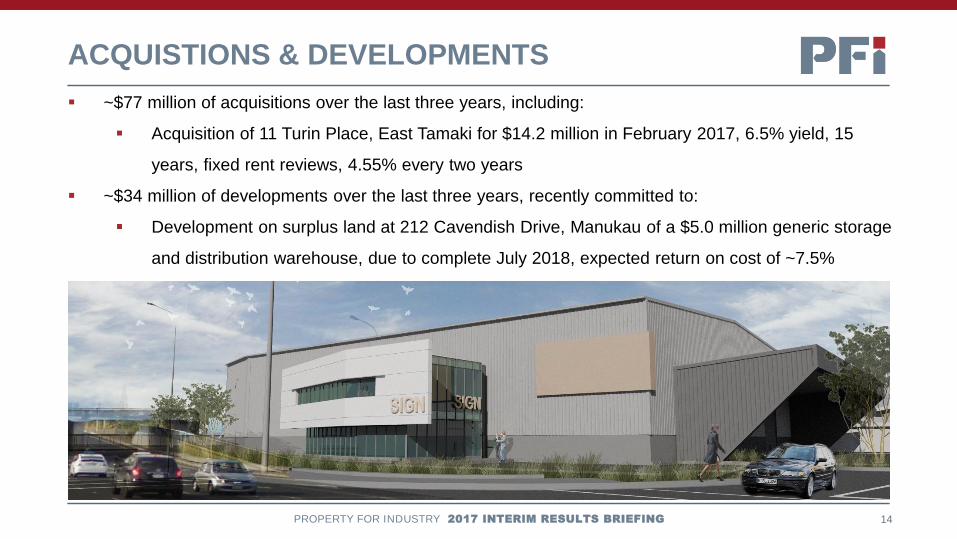
▪ ~$77 million of acquisitions over the last three years, including:
▪ Acquisition of 11 Turin Place, East Tamaki for $14.2 million in February 2017, 6.5% yield, 15
years, fixed rent reviews, 4.55% every two years
▪ ~$34 million of developments over the last three years, recently committed to:
▪ Development on surplus land at 212 Cavendish Drive, Manukau of a $5.0 million generic storage
and distribution warehouse, due to complete July 2018, expected return on cost of ~7.5%

OPERATING REVENUE
16
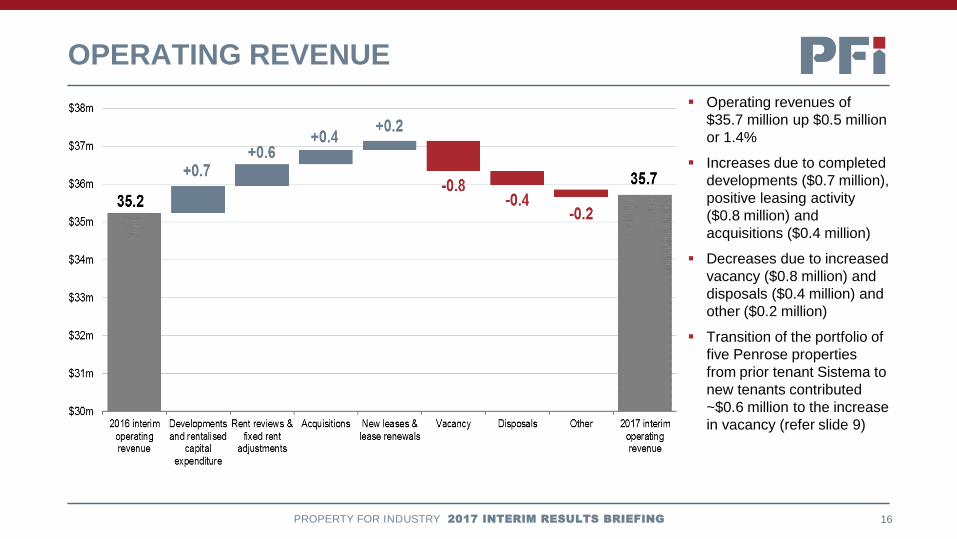
▪ Operating revenues of
$35.7 million up $0.5 million
or 1.4%
▪ Increases due to completed
developments ($0.7 million),
positive leasing activity
($0.8 million) and
acquisitions ($0.4 million)
▪ Decreases due to increased
vacancy ($0.8 million) and
disposals ($0.4 million) and
other ($0.2 million)
▪ Transition of the portfolio of
five Penrose properties
from prior tenant Sistema to
new tenants contributed
~$0.6 million to the increase
in vacancy (refer slide 9)
PROPERTY FOR INDUSTRY 2017 INTERIM RESULTS BRIEFING

COMPREHENSIVE INCOME
17
▪ Operating revenues up $0.5
million or 1.4%, refer slide
16: operating revenue
▪ Operating expenses down
$0.6 million or 4.2%, due to
management fees ($0.7
million), interest expense
and bank fees ($0.5 million)
▪ Higher non-recoverable
property costs ($0.6 million)
due to increased vacancy
and asbestos testing
programme
▪ Termination of management
agreement $42.9 million,
recorded in interim financial
statements, if removed,
profit after tax would be
$25.2 million or 5.58 cents
per share, up 12.2% on H1
2016 (refer Appendix 1)
For the six months ended (unaudited, $000) Jun 17 Jun 16 Change
Total operating revenue 35,714 35,228 486
Non-recoverable property costs (1,461) (894) (567)
Interest expense and bank fees (8,388) (8,913) 525
Management fees (2,919) (3,623) 704
Other expenses (690) (622) (68)
Total operating expenses (13,458) (14,052) 594
Total operating earnings 22,256 21,176 1,080
Fair value gain on investment properties 5,970 10,623 (4,653)
Gain / (loss) on disposal of investment properties 1,897 (6) 1,903
Material damage insurance income 505 - 505
Fair value loss on derivative financial instruments (582) (7,131) 6,549
Termination of management agreement (42,869) - (42,869)
Total non-operating income and expenses (35,079) 3,486 (38,565)
(Loss) / profit before taxation (12,823) 24,662 (37,485)
Current taxation - (3,892) 3,892
Deferred taxation 7,186 1,721 5,465
Total income tax benefit / (expense) 7,186 (2,171) 9,357
(Loss) / profit after income tax (5,637) 22,491 (28,128)
PROPERTY FOR INDUSTRY 2017 INTERIM RESULTS BRIEFING

DISTRIBUTABLE PROFIT (CENTS PER SHARE, CPS)
18
▪ Distributable profit per share
up 0.09 cps or 2.4%
▪ H1 2017 dividends of 3.50
cps, in line with H1 2016
▪ Increased earnings
guidance: full year
distributable profit increased
from 7.50 to 7.70 cps to 7.70
to 7.90 cps.
PROPERTY FOR INDUSTRY 2017 INTERIM RESULTS BRIEFING
1. Distributable profit is non-GAAP financial information used by the PFI Board to assist in determining dividends to shareholders. Refer: Note 4.1 of Interim Financial Statements.

FUNDS / ADJUSTED FUNDS FROM OPERATIONS
19
(Unaudited, $000, unless noted) 6ME Jun 2017 12ME Dec 2016
(Loss) / profit and total comprehensive income after income tax attributable to the shareholders of the
Company(5,637) 123,412
Adjusted for:
Fair value gain on investment properties (5,970) (88,214)
Material damage insurance income (505) -
Gain on disposal of investment properties (1,897) (302)
Fair value loss / (gain) on derivative financial instruments 582 (433)
Amortisation of tenant incentives 1,053 1,973
Straight lining of fixed rental increases (138) (607)
Deferred taxation (7,186) 136
Termination of management agreement 42,869 -
Current taxation without deductibility of termination of management agreement (4,725) -
Funds from operations (FFO) 18,446 35,965
FFO per share (cents) 4.08 7.99
FFO dividend pay-out ratio 86% 92%
Maintenance capex (1,413) (2,962)
Incentives and leasing fees given for the period (1,495) (1,729)
Other (6) (12)
Adjusted funds from operations (AFFO) 15,532 31,262
AFFO per share (cents) 3.43 6.95
AFFO dividend pay-out ratio 102% 106%
PROPERTY FOR INDUSTRY 2017 INTERIM RESULTS BRIEFING
▪ Funds From Operations
(FFO) earnings of 4.08 cps
and Adjusted Funds From
Operations (AFFO),
earnings of 3.43 cps
▪ FFO dividend pay-out ratio
of 86%, AFFO dividend pay-
out ratio of 102%
▪ “… the PFI Board is looking
to balance the competing
priorities of maintaining or
gradually increasing cash
dividends, whilst at the
same time seeking to grow
AFFO earnings to cover
those dividends.”
▪ Increased dividend
guidance: from at least 7.35
cps to 7.45 cps
1. FFO and AFFO are non-GAAP financial information and are common investor metrics, which have been calculated in accordance with the guidelines issued by the Property Council of Australia.

INVESTMENT PROPERTIES
20
▪ Portfolio value of ~ $1.1
billion
▪ Acquisition of 11 Turin
Place offset by divestment
of 65 Hugo Johnston (refer
slides 13 and 14 for details)
▪ Fair value gain of $6.0
million or 9.8% (refer slide 7
for details)
PROPERTY FOR INDUSTRY 2017 INTERIM RESULTS BRIEFING

NET TANGIBLE ASSETS (CENTS PER SHARE, CPS)
21
▪ Net tangible assets (NTA)
per down 5.1 cps or 3.2% to
155.6 cps
▪ Increase in NTA due to
increase in the fair value of
investment properties (1.3
cps) and a gain on the
disposal of PFI’s property at
65 Hugo Johnston Drive
(0.4 cents per share cps)
▪ Decrease in NTA due to net
internalisation payment (6.8
cps), if removed, NTA
would be 162.5 cps, up 1.8
cps or 1.1% over the first six
months of 2017 (refer
Appendix 1)
PROPERTY FOR INDUSTRY 2017 INTERIM RESULTS BRIEFING
1. Refer: Appendix 2: Financial Position for further detail.

CAPITAL MANAGEMENT
23
Jun 2017 Dec 2016
Facilities
Drawn (excluding overdraft) $373.6m $333.7m
Facilities limit $415.0m $375.0m
Facilities headroom $41.4m $41.3m
Facilities term (average) 3.1 years 3.8 years
Facilities banks ANZ, BNZ, CBA, Westpac ANZ, BNZ, CBA, Westpac
Covenants
Gearing 34.2% 30.1%
Interest cover ratio 3.6 times 3.4 times
Interest rates
Weighted average cost of debt (including margin and fees) 4.78% 5.24%
Interest rate hedging (excluding forward starting hedging, $m / rate / duration) $220m / 4.46% / 2.8 years $243m / 4.53% / 3.0 years
Interest rate hedging (forward starting hedging, $m / rate / duration) $130m / 3.59% / 3.3 years $70m / 3.54% / 2.9 years
▪ $40m short term facility obtained for internalisation
▪ Considering options incl. senior secured bond issue to extend and diversify borrowings
PROPERTY FOR INDUSTRY 2017 INTERIM RESULTS BRIEFING

INTEREST RATE HEDGING
24PROPERTY FOR INDUSTRY 2017 INTERIM RESULTS BRIEFING
▪ Weighted average cost of debt reduced to 4.78% at the end of the interim period
▪ Fair value of PFI’s interest rate hedging largely unchanged from year-end ($10.5m liability)

26
▪ PFI’s strategy is to invest in quality industrial property in New Zealand’s main urban centres and
the Company aims to deliver strong, stable shareholder returns
▪ Highlights of the first half of 2017:
▪ Internalisation of management on 30 June 2017
▪ Increased guidance: distributable profit of between 7.70 and 7.90 cents per share, cash
dividend of 7.45 cents per share
▪ Transition of the Penrose portfolio: approximately $13 million of shareholder value created
equating to a property level internal rate of return of approximately 24%
▪ Questions?
PROPERTY FOR INDUSTRY 2017 INTERIM RESULTS BRIEFING
REVIEW & QUESTIONS
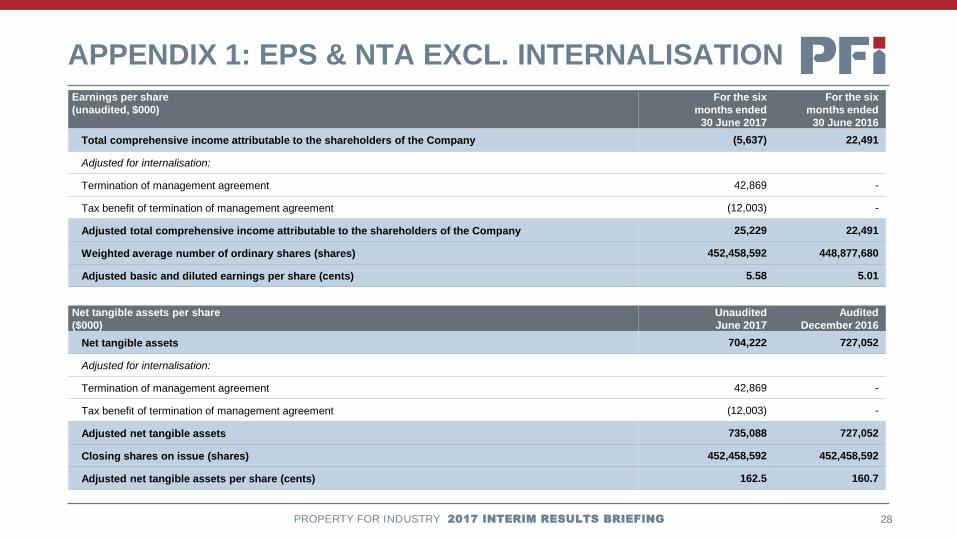
APPENDIX 1: EPS & NTA EXCL. INTERNALISATION
28
Earnings per share
(unaudited, $000)
For the six
months ended
30 June 2017
For the six
months ended
30 June 2016
Total comprehensive income attributable to the shareholders of the Company (5,637) 22,491
Adjusted for internalisation:
Termination of management agreement 42,869 -
Tax benefit of termination of management agreement (12,003) -
Adjusted total comprehensive income attributable to the shareholders of the Company 25,229 22,491
Weighted average number of ordinary shares (shares) 452,458,592 448,877,680
Adjusted basic and diluted earnings per share (cents) 5.58 5.01
PROPERTY FOR INDUSTRY 2017 INTERIM RESULTS BRIEFING
Net tangible assets per share
($000)
Unaudited
June 2017
Audited
December 2016
Net tangible assets 704,222 727,052
Adjusted for internalisation:
Termination of management agreement 42,869 -
Tax benefit of termination of management agreement (12,003) -
Adjusted net tangible assets 735,088 727,052
Closing shares on issue (shares) 452,458,592 452,458,592
Adjusted net tangible assets per share (cents) 162.5 160.7

APPENDIX 2: FINANCIAL POSITION
29
As at ($000, unless noted)Unaudited
Jun 2017
Audited
Dec 2016Change
Investment properties 1,095,989 1,083,300 12,689
Goodwill 29,086 29,086 -
Other assets 9,450 9,413 37
Total assets 1,134,525 1,121,799 12,726
Borrowings 372,913 332,924 (39,989)
Deferred tax liabilities 3,840 11,026 7,186
Other liabilities 24,464 21,711 (2,753)
Total liabilities 401,217 365,661 (35,556)
Total equity 733,308 756,138 (22,830)
Shares on issue 452,458,592 452,458,592 -
Net tangible (excluding goodwill) assets (cents per share) 156 161 (5)
PROPERTY FOR INDUSTRY 2017 INTERIM RESULTS BRIEFING
DISCLAIMER
30
The information included in this presentation is provided as at 9 August 2017.
Property for Industry Limited (PFI) does not guarantee the repayment of capital or the performance referred to in this presentation.
Past performance is not a reliable indicator of future performance.
The presentation includes a number of forward looking statements. Forward looking statements, by their nature, involve inherent risks and
uncertainties. Many of those risks and uncertainties are matters which are beyond PFI’s control and could cause actual results to differ
from those predicted. Variations could either be materially positive or materially negative.
While every care has been taken in the preparation of this presentation, PFI makes no representation or warranty as to the accuracy or
completeness of any statement in it including, without limitation, any forecasts.
This presentation has been prepared for the purpose of providing general information, without taking account of any particular investor’s
objectives, financial situation or needs. An investor should, before making any investment decisions, consider the appropriateness of the
information in this presentation, and seek professional advice, having regard to the investor’s objectives, financial situation and needs.
This presentation is solely for the use of the party to whom it is provided.
PROPERTY FOR INDUSTRY 2017 INTERIM RESULTS BRIEFING