powerpoint presentation - no slide...
TRANSCRIPT

Presenter:Gene IsenbergChairman & CEO
LEHMAN BROTHERS
19TH ANNUAL CEO ENERGY/POWER
CONFERENCE
September 7, 2005
2
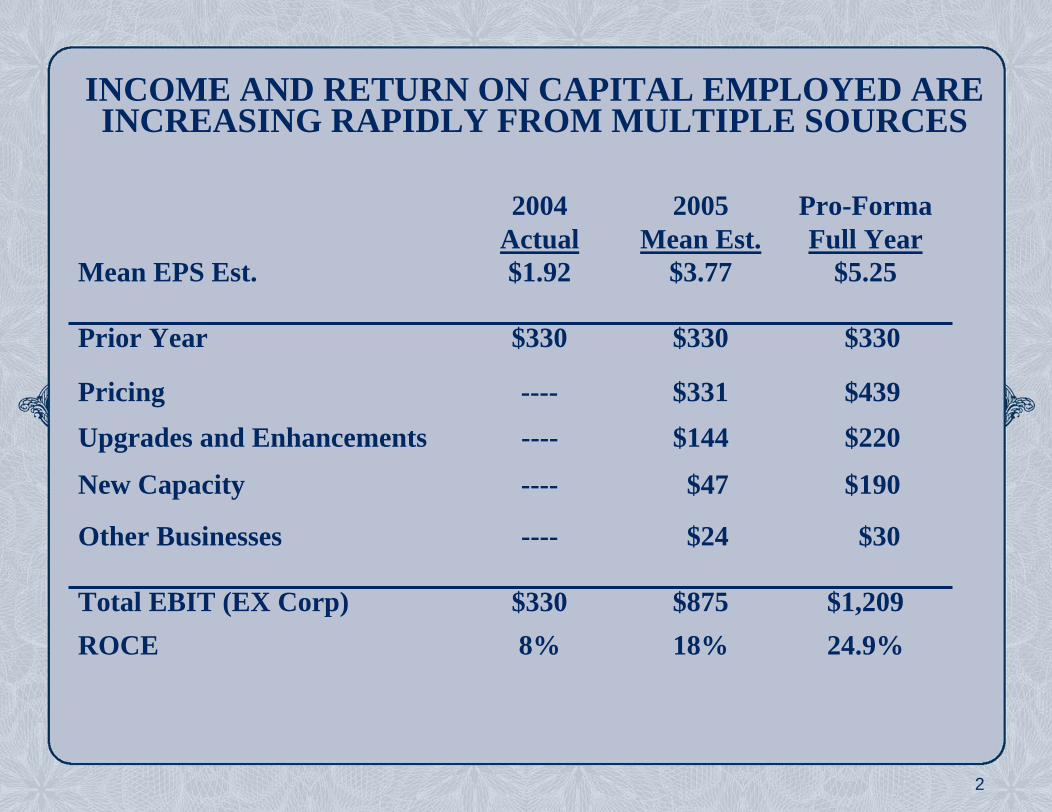
INCOME AND RETURN ON CAPITAL EMPLOYED ARE INCREASING RAPIDLY FROM MULTIPLE SOURCES
2004Actual
2005Mean Est.
Pro-FormaFull Year
Mean EPS Est. $1.92 $3.77 $5.25
Prior Year $330 $330 $330
Pricing ---- $331 $439Upgrades and Enhancements ---- $144 $220
New Capacity ---- $47 $190
Other Businesses ---- $24 $30
Total EBIT (EX Corp) $330 $875 $1,209ROCE 8% 18% 24.9%

3
2005 CAPITAL PROGRAM
Forecasted Capital Expenditures for 2005 = $1.1 Billion
$370 mm New Construction$320 mm Upgrades and Enhancements$280 mm Maintenance$100 mm Acquisitions and Oil & Gas Investments
$67 mm Mfg. & Logistics, Oil & Gas
$400 mm International$320 mm US Lower 48 Drilling$140 mm Canada$110 mm US Well Service$33 mm US Offshore and Alaska

4
Balance Sheet Data as of June 30, 2005
A CONSERVATIVE AND FLEXIBLE FINANCIAL POSITION
(1) Some debt issues are unrated
ActualCash & Securities 1,580Accounts Receivable 619Working Capital 591Property, Plant and Equipment, Net 3,461Total Assets 6,309Total Debt 2,018Stockholders’ Equity 3,291Total Debt to Total Capitalization 38%Net Debt to Capitalization 12%Weighted Average Shares Outstanding 161Moody’s Rating (1) A3Standard & Poors A-Indexes S&P 500, OSX
($ in millions)

5
Drilling2004Avg.
2Q05Avg. Today
1Q06Expected
North America6
2461550
7219
408
450125575
Alaska 7 7 10US 48 Drilling 199 229 260GOM Offshore 14 17 19Canada 47 26 70InternationalInt’l Land (1) 52 66 78Int’l Offshore (1) 16 18 20
Total Drilling 335 363 457
W.O./Well ServicingUS Lower 48 400 438 462Canada 138 110 138
Total W.O./Well Servicing 538 548 600
FLEET STATUS AS OF SEPTEMBER 3, 2005
(1) Represents Nabors’ Net Interest in J.V. Rigs in Saudi @ 50%, operating rig count includes those leased from GOM Offshore(2) Represents current firm and prospective near-term contract committments

6
North American gas decline rates imply 20+ BCFPD/year
Timing of the supply impact of stranded and imported gas
Additional drilling is required in US & Canadian Basins
Longer term, LNG will ultimately become the marginal supply
Global oil supply challenges and increasing demand
STRONG FUNDAMENTALS UNDERPIN POSITIVE OUTLOOK
Supply challenges point to a more orderly and sustainable cycle

7
Strong and sustaining rig demand- North America- Internationally
Nabors best positioned to capture disproportionate shareTerm contracts are underwriting capacity and efficiency investmentsOngoing reactivation programAccelerating new build program
RIG MARKET DYNAMICS

8
U.S. LOWER 48 LAND DRILLING DOMINATED BY GAS
TODAY – 1220Y-T-D – 1161
Source: Baker Hughes, Bloomberg
376463
564 563484
717691
939870
1025PEAK = 1068
Land Rigs 2001 2005
Now N/A 1,319
Avg. 981 1,214
High 1114 1,319
Low 743 1,117

9
650
700
750
800
850
900
950
1000
1050
1100
1150
1200
1/3/031/24/032/14/03
3/7/033/28/034/18/03
5/9/035/30/036/20/037/11/03
8/1/038/22/039/12/0310 /3/0310 /24 /0311 /14 /03
12 /5/0312 /26 /03
1/16/042/6/042/27/043/19/04
4/9/044/30/045/21/046/11/04
7/2/047/23/048/13/04
9/3/049/24/0410 /15 /04
11 /5/0411 /26 /0412 /17 /04
1/14/052/4/052/25/053/18/05
4/8/054/29/055/20/056/10/05
7/1/057/21/058/12/05
100110120130140150160170180190200210220230240250
1/3/03 08/26/05 Increase
BHI 675 1165 490 73%
NBR 108 248 140 129%
NBR Incremental Share = 29% since 1/3/03
NABORS US LOWER 48 VS. BHI LAND RIG COUNTAverage well depth and complexity is increasing
Source: Baker Hughes – Excludes N.E. States, California and Alaska
NBR Rigs
BHI NBR Area

10
REACTIVATIONS AND NEW BUILDS
Strength and breadth of demand for additional higher capability rigs
Adequate cash flow and multi-year contracts are underwriting investments
Strongest rig demand is for mid-depth rigs where inventory is depleted
Evolution and advantages of A/C drive technology
Drilling efficiency improvements driving demand for upgraded rigs– Higher hydraulic horsepower– Automated systems; pipe handling, BOP’s, etc.– Faster moving capability
Escalating cost of reactivations versus favorable cost of new construction

11
ECONOMICS OF CURRENT RIG REACTIVATIONS
Seven rigs currently being reactivated/refurbished
– (2) 2,000 HP, (1) 1,500 HP, (1) 900 HP, (2) 750 HP
Total expected cost = $11.5 million ($250K - $3.5MM)
Estimated annual cash flow = $24 million
Average years to cash payout = 0.50 years

12
NABORS’ EDGE IN NEW CAPACITY
Advantageous cost and availability of capitalAdvantageous operating costs
– Established infrastructure in 22 countries– Economies of Scale– Synergies among subsidiaries
Advantageous capital costs of new and reactivated rigs– Procuring for over 400 operating rigs yields favorable
price and delivery– Multiple sourcing of major components and rig delivery
Advantageous delivery schedule•Multiple rigs in multiple venues, quicker
13
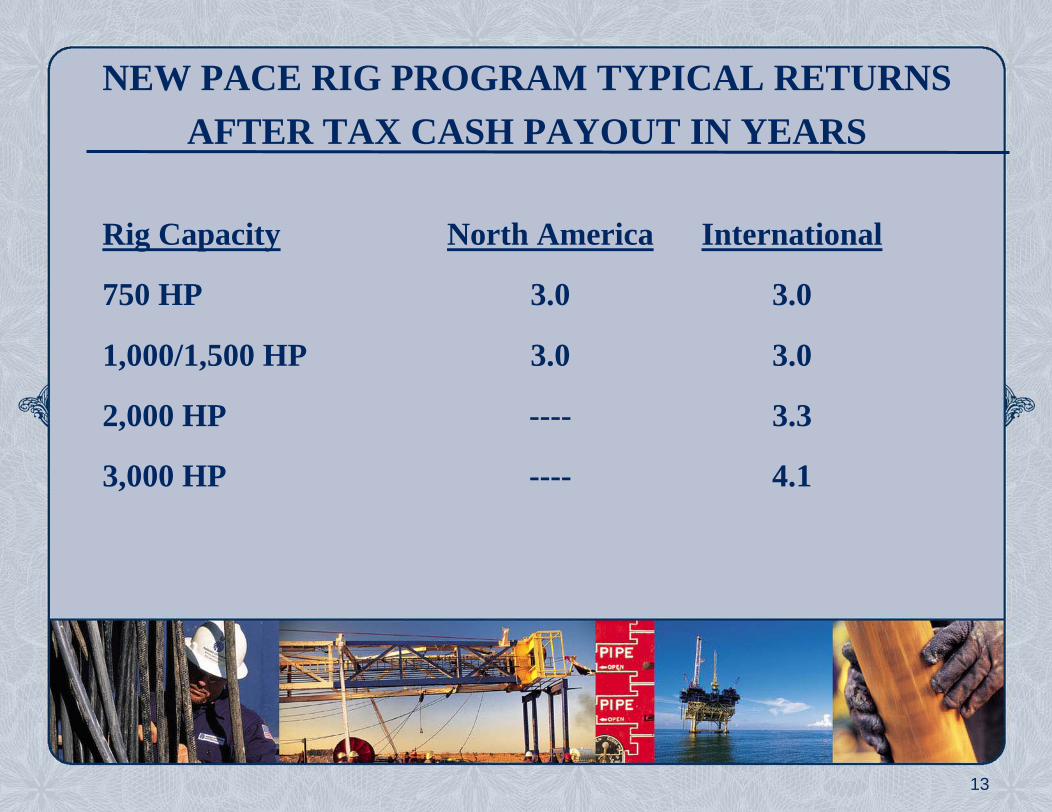
NEW PACE RIG PROGRAM TYPICAL RETURNSAFTER TAX CASH PAYOUT IN YEARS
Rig Capacity North America International
750 HP 3.0 3.0
1,000/1,500 HP 3.0 3.0
2,000 HP ---- 3.3
3,000 HP ---- 4.1
14
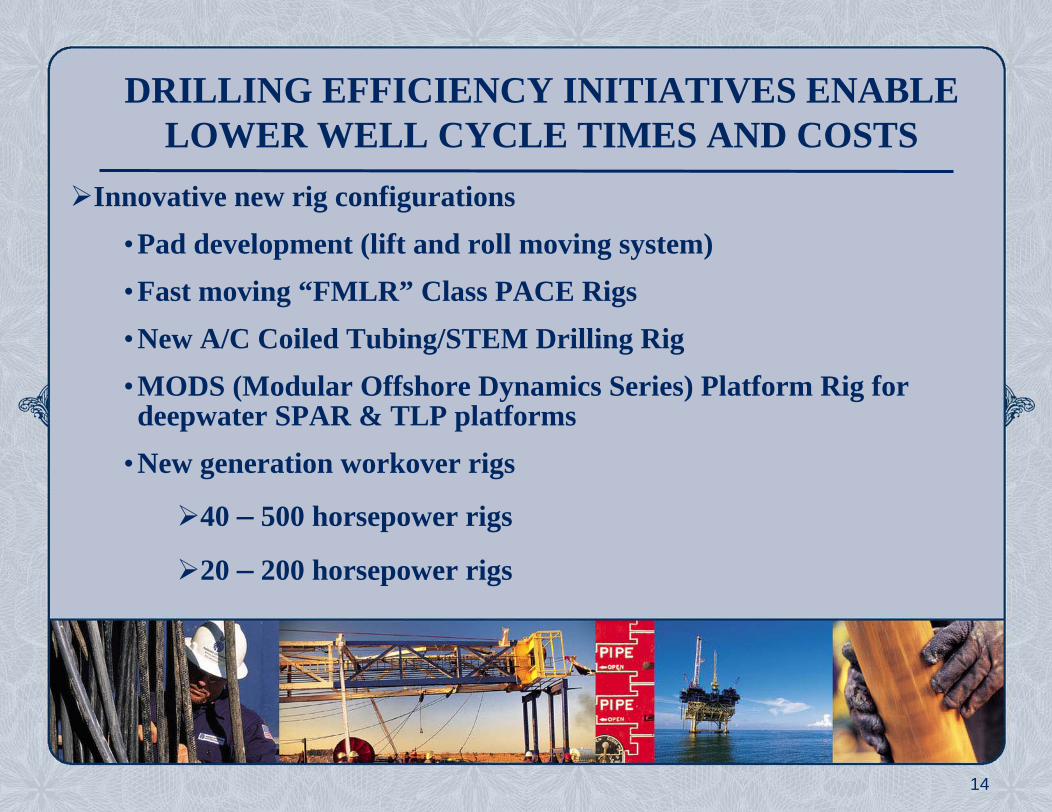
Innovative new rig configurations•Pad development (lift and roll moving system)•Fast moving “FMLR” Class PACE Rigs•New A/C Coiled Tubing/STEM Drilling Rig•MODS (Modular Offshore Dynamics Series) Platform Rig for deepwater SPAR & TLP platforms
•New generation workover rigs
40 – 500 horsepower rigs
20 – 200 horsepower rigs
DRILLING EFFICIENCY INITIATIVES ENABLE LOWER WELL CYCLE TIMES AND COSTS
15
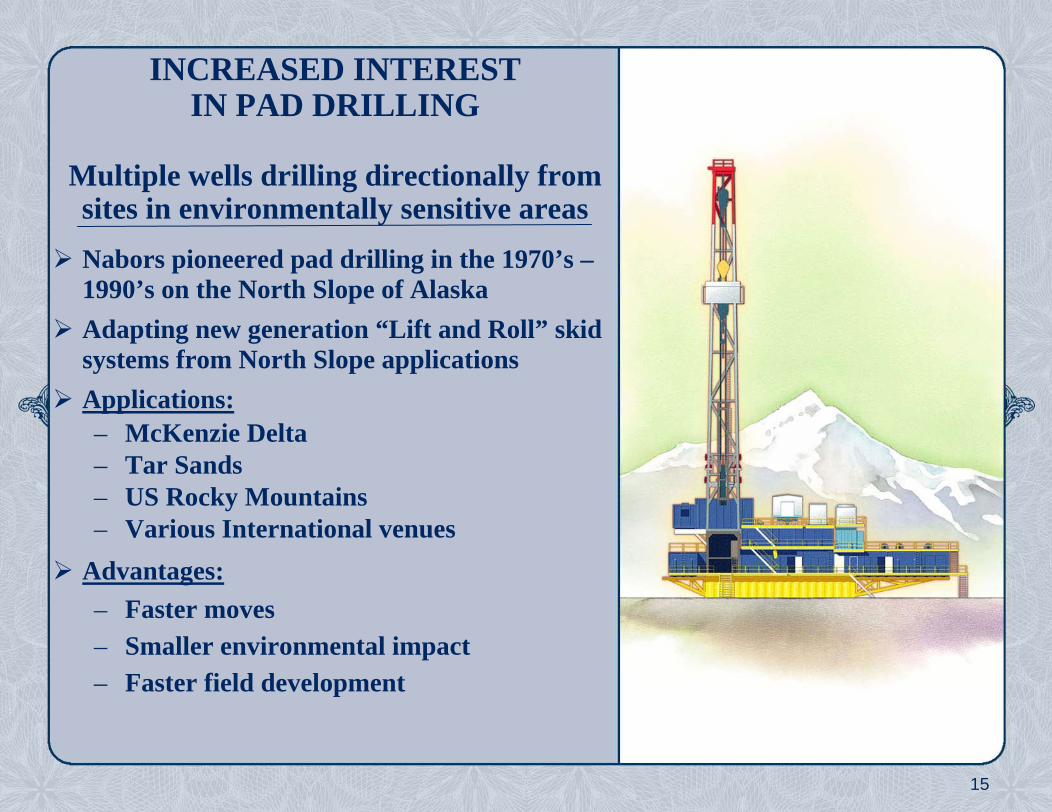
INCREASED INTERESTIN PAD DRILLING
Multiple wells drilling directionally from sites in environmentally sensitive areasNabors pioneered pad drilling in the 1970’s –1990’s on the North Slope of AlaskaAdapting new generation “Lift and Roll” skid systems from North Slope applicationsApplications:– McKenzie Delta– Tar Sands– US Rocky Mountains – Various International venues
Advantages:– Faster moves– Smaller environmental impact– Faster field development

16
Fast moving “PACE” (programmable A/C electric class rigs)
750–3,000 horsepower electric A/C drive. PLC (Programmable Logic Controls)
Nabors proprietary “Commander”Drawworks and “Academy” A/C VFD
Modularized skidded rigs for pad drilling
EFFICIENCY EMPHASIS LEADSTO LAND RIG INNOVATION
Building leading edge rigs, utilizing existing components, yields favorable returns
17
-
50.0
100.0
150.0
200.0
250.0
300.0
$-$1,000$2,000$3,000$4,000$5,000$6,000$7,000$8,000$9,000NABORS' RIG COUNT AVG MARGIN PER RIG DAY
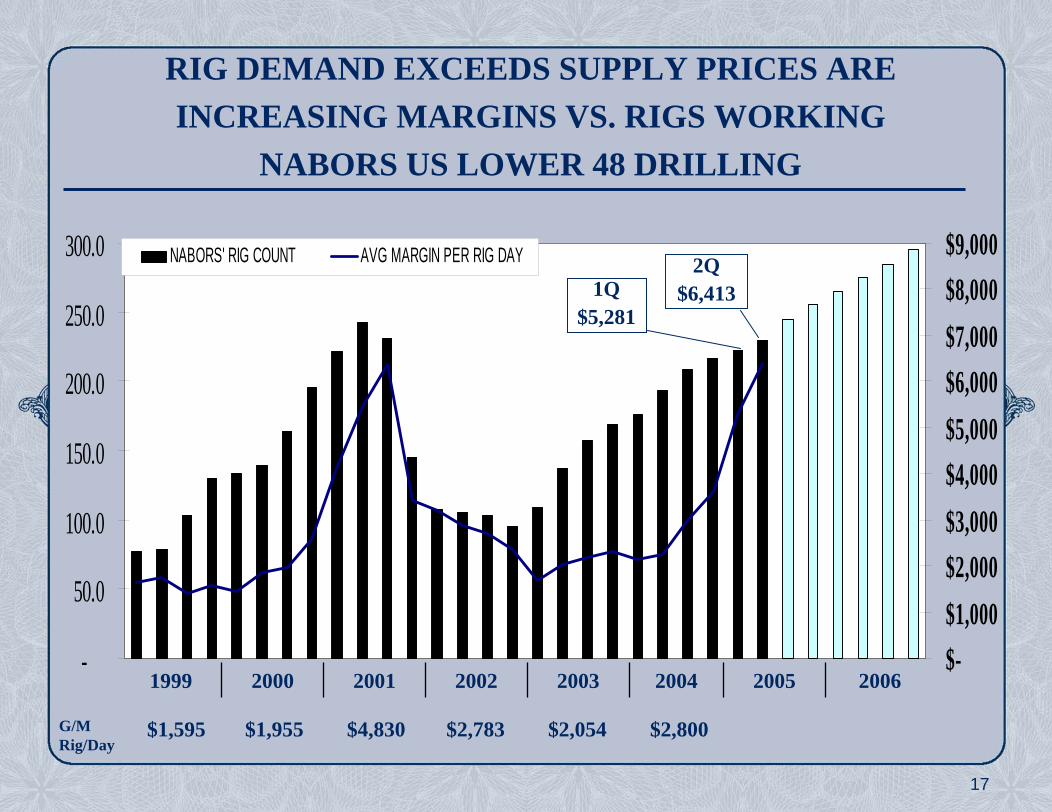
RIG DEMAND EXCEEDS SUPPLY PRICES ARE INCREASING MARGINS VS. RIGS WORKING
NABORS US LOWER 48 DRILLING
1Q$5,281
2Q$6,413
1999 2000 2001 2002 2003 2004 2005 2006
G/M Rig/Day
$1,595 $1,955 $4,830 $2,783 $2,054 $2,800
18
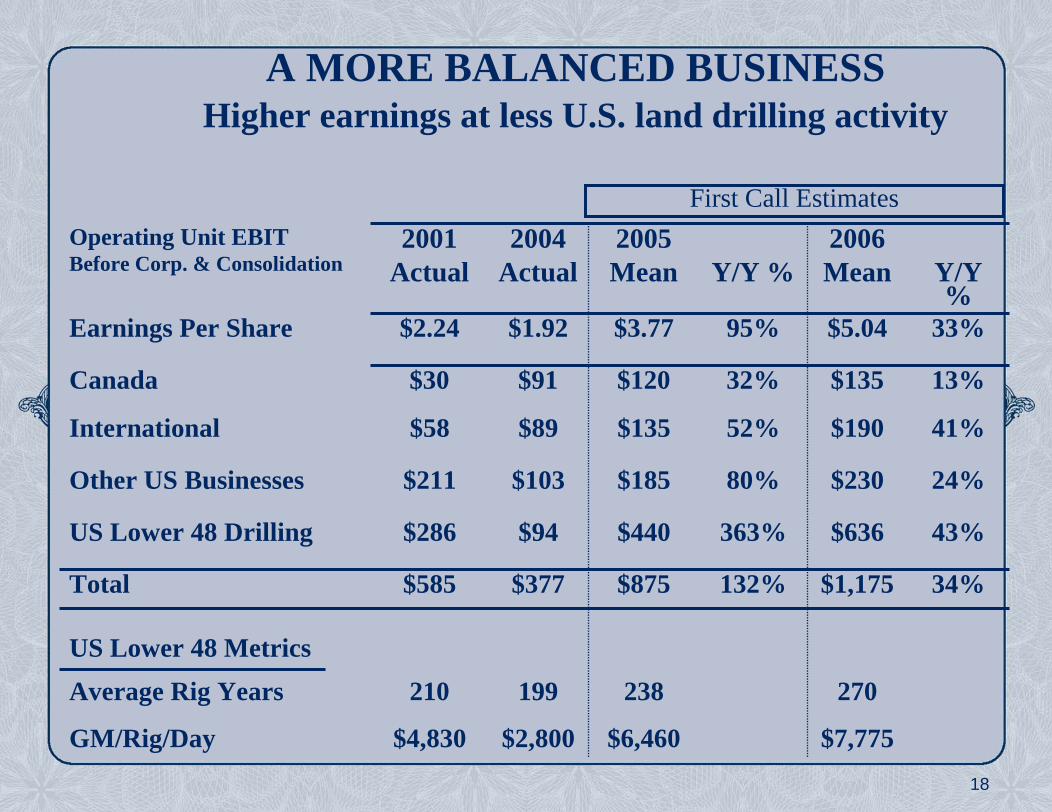
Operating Unit EBITBefore Corp. & Consolidation
2001Actual
2004Actual
2005Mean Y/Y %
2006Mean Y/Y
%Earnings Per Share $2.24 $1.92 $3.77 95% $5.04 33%
Canada $30 $91 $120 32% $135 13%
International $58 $89 $135 52% $190 41%
Other US Businesses $211 $103 $185 80% $230 24%
US Lower 48 Drilling $286 $94 $440 363% $636 43%
Total $585 $377 $875 132% $1,175 34%
US Lower 48 MetricsAverage Rig Years 210 199 238 270
GM/Rig/Day $4,830 $2,800 $6,460 $7,775
First Call Estimates
A MORE BALANCED BUSINESSHigher earnings at less U.S. land drilling activity