powerpoint presentation template - venturex resources€¦ · · 2016-09-24smelter/refinery ....
TRANSCRIPT

Ernest Henry copper concentrator, Australia
Investor Day 10 December 2014
08:00 - Welcome and Overview | Ivan Glasenberg
08:20 - Finance Update | Steven Kalmin
08:45 - Copper | Telis Mistakidis
09:15 - Coal | Tor Peterson & Peter Freyberg
09:45 - Break
10:05 - Zinc | Daniel Maté & Chris Eskdale
10:35 - Nickel | Kenny Ives & Peter Johnston
11:05 - Oil | Alex Beard
11:45 - Break
12:00 - Agricultural products | Chris Mahoney
12:30 - Conclusion and Q&A
08:00 - Welcome and Overview | Ivan Glasenberg
08:20 - Finance Update | Steven Kalmin
08:45 - Copper | Telis Mistakidis
09:15 - Coal | Tor Peterson & Peter Freyberg
09:45 - Break
10:05 - Zinc | Daniel Maté & Chris Eskdale
10:35 - Nickel | Kenny Ives & Peter Johnston
11:05 - Oil | Alex Beard
11:40 - Break
12:00 - Agricultural products | Chris Mahoney
12:30 - Conclusion and Q&A
2
Forward looking statements
This document contains statements that are, or may be deemed to be, “forward looking statements” which are prospective in nature. These forward looking statements may be identified
by the use of forward looking terminology, or the negative thereof such as "plans", "expects" or "does not expect", "is expected", "continues", "assumes", "is subject to", "budget",
"scheduled", "estimates", "aims", "forecasts", "risks", "intends", "positioned", "predicts", "anticipates" or "does not anticipate", or "believes", or variations of such words or comparable
terminology and phrases or statements that certain actions, events or results "may", "could", "should", “shall”, "would", "might" or "will" be taken, occur or be achieved. Such statements
are qualified in their entirety by the inherent risks and uncertainties surrounding future expectations. Forward-looking statements are not based on historical facts, but rather on current
predictions, expectations, beliefs, opinions, plans, objectives, goals, intentions and projections about future events, results of operations, prospects, financial condition and discussions
of strategy.
By their nature, forward looking statements involve known and unknown risks and uncertainties, many of which are beyond Glencore’s control. Forward looking statements are not
guarantees of future performance and may and often do differ materially from actual results. Important factors that could cause these uncertainties include, but are not limited to, those
discussed under “Principal risks and uncertainties” of Glencore’s Annual Report 2013 and “Risks and uncertainties” in Glencore’s 2014 Half-Year Report.
Neither Glencore nor any of its associates or directors, officers or advisers, provides any representation, assurance or guarantee that the occurrence of the events expressed or implied
in any forward-looking statements in this document will actually occur. You are cautioned not to place undue reliance on these forward-looking statements which only speak as of the
date of this document. Other than in accordance with its legal or regulatory obligations (including under the UK Listing Rules and the Disclosure and Transparency Rules of the Financial
Conduct Authority and the Rules Governing the Listing of Securities on the Stock Exchange of Hong Kong Limited and the Listing Requirements of the Johannesburg Stock Exchange
Limited), Glencore is not under any obligation and Glencore and its affiliates expressly disclaim any intention, obligation or undertaking to update or revise any forward looking
statements, whether as a result of new information, future events or otherwise. This document shall not, under any circumstances, create any implication that there has been no change
in the business or affairs of Glencore since the date of this document or that the information contained herein is correct as at any time subsequent to its date.
No statement in this document is intended as a profit forecast or a profit estimate and no statement in this document should be interpreted to mean that earnings per Glencore share for
the current or future financial years would necessarily match or exceed the historical published earnings per Glencore share.
This document does not constitute or form part of any offer or invitation to sell or issue, or any solicitation of any offer to purchase or subscribe for any securities. The making of this
document does not constitute a recommendation regarding any securities.

Copper Telis Mistakidis
Alumbrera copper concentrator, Argentina

Topics
1. Glencore Copper Department
• Overview
• Description
2. Katanga Mining
• Production issues
• Power
3. Antapaccay
• Tintaya concentrator restart
• Antapaccay mini expansion
4. Copper Market – where is the surplus?
4

Glencore copper in context
• Third largest global mined copper producer and the world’s largest copper supplier
• Integrated assets (mines, smelters and refineries) and marketing
5
2013 copper production (kt)
0
500
1,000
1,500
2,000
2,500
3,000
Competitor 1 Competitor 2 Glencore Competitor 3 Competitor 4 Competitor 5 Glencore 2014Fsupply
Source: Glencore, annual reports.

Glencore copper assets
6
Mined Cu
N America 90k MT
Asia 60k MT
Australia 260k MT Africa 500k MT S America 660k MT
Horne/CCR 300k MT
Isa/Pasar 600k MT Mopani 200k MT Altonorte 300k MT
Kazzinc 70k MT
Smelter/Refinery

Capability across the copper raw materials chain
Mt Isa Cobar Antapaccay Katanga Nkana
Townsville
Altonorte Horne Pasar Mopani Mt Isa
CCR Pasar Mopani
EHM
Marketing
3rd party 3rd party
3rd party
Alumbrera
Collahuasi
Antamina
3rd party
3rd party
3rd party
Lomas Bayas
3rd party
Mopani SXEW
3rd party
Mutanda Mufulira
• Integrated industrial assets and marketing
• One million MT custom smelting and refining
• Capability to process complex concentrates with precious metals and deleterious elements.
Min
ing
S
me
ltin
g
Re
fin
ing
7

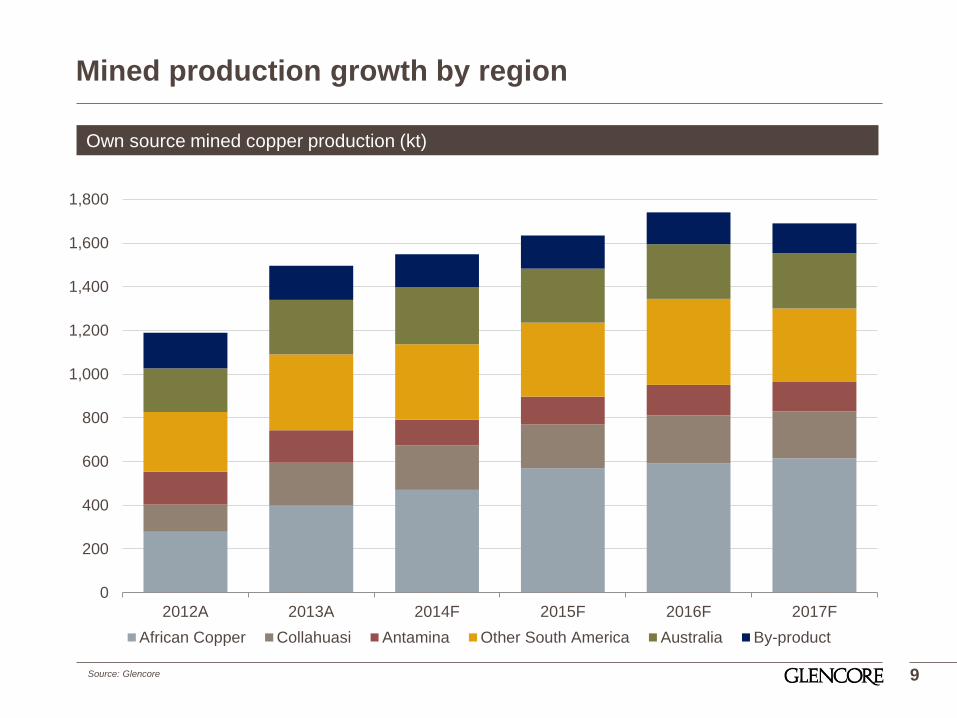
Mined production growth
8
Own source mined copper production (kt)
Note: does not include copper from Kidd, Kazzinc and Ni operations
Merger
2008 2009 2010 2011 2012 2013 2014F 2015F 2016F 2017F 2018F
Total copper Former Xstrata
0
200
400
600
800
1,000
1,200
1,400
1,600
1,800
2012A 2013A 2014F 2015F 2016F 2017F
African Copper Collahuasi Antamina Other South America Australia By-product
Mined production growth by region
9
Own source mined copper production (kt)
Source: Glencore
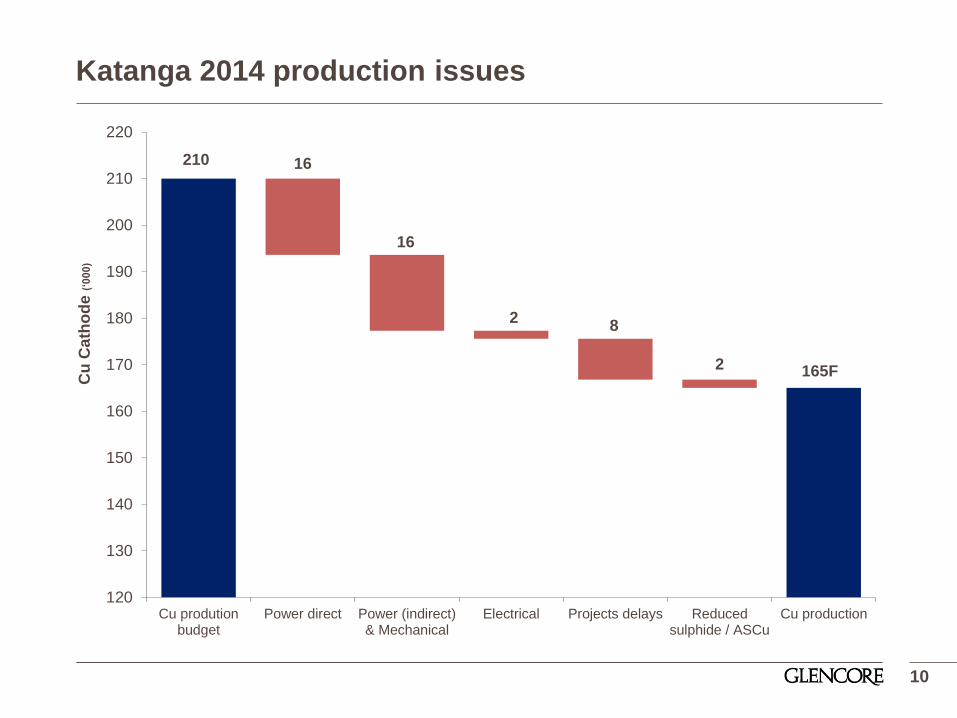
210
165F
16
16
2 8
2
120
130
140
150
160
170
180
190
200
210
220
Cu produtionbudget
Power direct Power (indirect)& Mechanical
Electrical Projects delays Reducedsulphide / ASCu
Cu productionactual
Cu
Ca
tho
de (‘000)
Katanga 2014 production issues
10
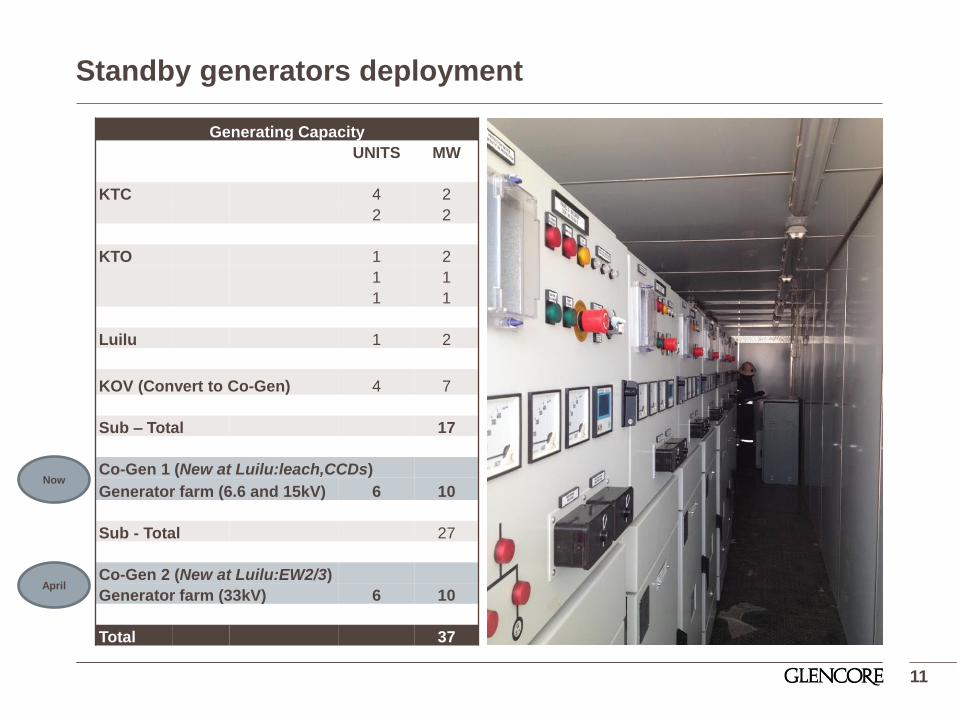
Standby generators deployment
11
Generating Capacity
UNITS MW
KTC 4 2
2 2
KTO 1 2
1 1
1 1
Luilu 1 2
KOV (Convert to Co-Gen) 4 7
Sub – Total 17
Co-Gen 1 (New at Luilu:leach,CCDs)
Generator farm (6.6 and 15kV) 6 10
Sub - Total 27
Co-Gen 2 (New at Luilu:EW2/3)
Generator farm (33kV) 6 10
Total 37
Now
April

Global Power Project – update
12
Description
• 450MW for Kamoto Copper Company and partners
• 350MW of new power and 1000MW transmission
from INGA to Kolwezi
• Project cost – $368M, Lots 1 to 14
• Reimbursed via 40% credit to power bills
• Additional 10% withheld for maintenance fund
• 75MW available to the population
Power milestones
• Transmission from INGA to Kolwezi from 40MW to
250MW Q1 2013
• 25MW (Nzilo) Q4 2014
• 165MW (G-27) Q4 2015
• 165MW (G-28) Q2 2017
Project status
• G27 disassembled and shipped to factory for repair
• 60% of transformers for the converter station have
passed factory acceptance. Remaining 40% to be
tested before year end. Commissioning expected
January 2016
• Synchronous condenser #2 awaiting confirmation
from SNEL, expected December 2014
• Fungurume transformer being commissioned now

Global Power Project – timeline
13
Q1 Q2 Q3 Q4 Q1 Q2 Q3 Q4 Q1 Q2 Q3 Q4 Q1 Q2 Q3 Q4 Q1 Q2
Lot 3 Unit 3 - Nzilo Quick Fix
Lot 4 Unit G27 Inga refurbishment
Lot 5 Unit G28 Inga refurbishment
Lot 6 Convertor transformer DC Link Pole 1
Lot 7 Convertor transformer DC Link Pole 2
Lot 8 OHL PDI-SCI Reinforcement
Lot 9 Additional Harmonic filters
Lot 10 Additional Synchronous compensator
Lot 11 RO Upgrading HV equipment
Lot 12 Auto-transformer SCK-RO #1 Installation
Lot 13 Auto-transformer SCK-RO #1 Installation
Lot 14 Studies and Final design
Additional power from lots 3, 4 & 5
Additional power available on the grid 25
Cumulative power added 25
2013 2014 2015 2016 2017
25 165
165
190
165
165
355
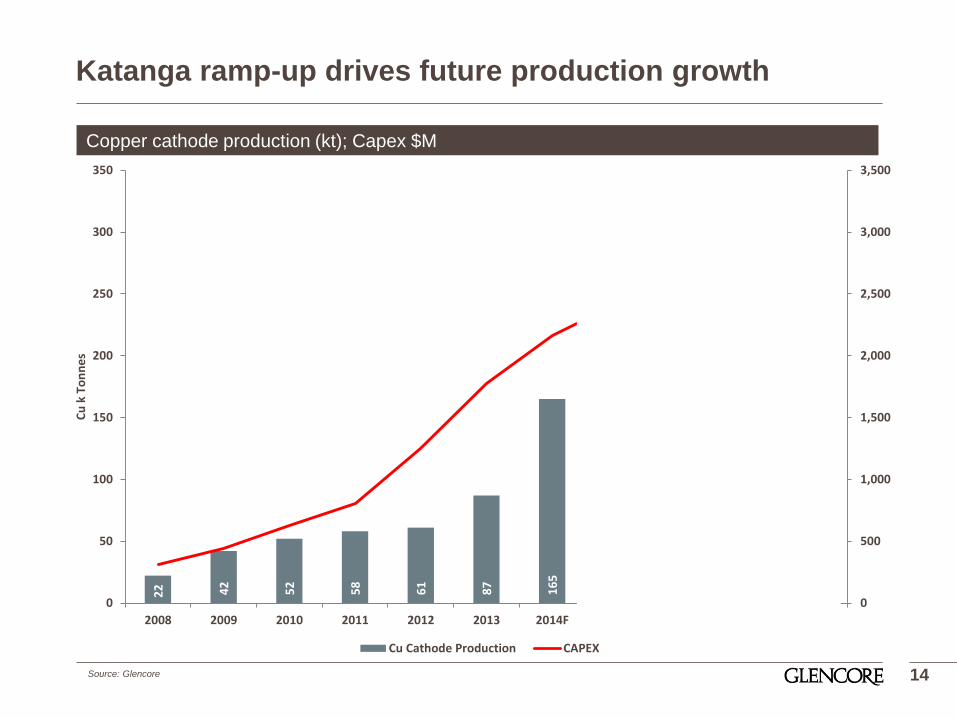
Katanga ramp-up drives future production growth
14
Copper cathode production (kt); Capex $M
Source: Glencore
22
42
52
58
61
87
16
5
24
2
27
4
28
6
30
1
0
500
1,000
1,500
2,000
2,500
3,000
3,500
0
50
100
150
200
250
300
350
2008 2009 2010 2011 2012 2013 2014F 2015F 2016F 2017F 2018F
Cu
k T
on
ne
s
Cu Cathode Production CAPEX
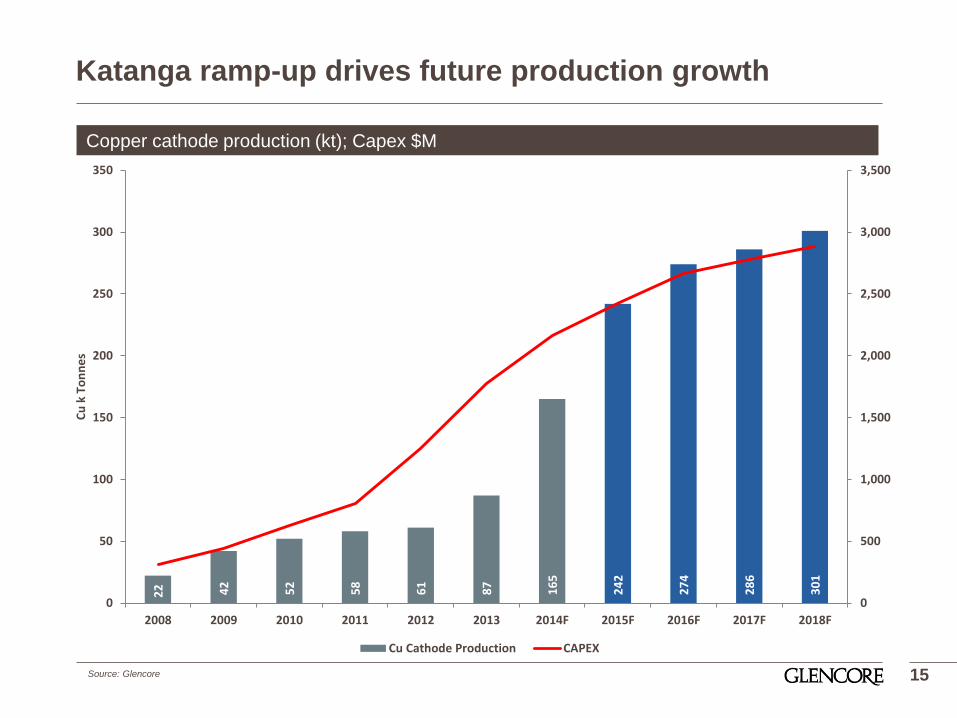
Katanga ramp-up drives future production growth
15
Copper cathode production (kt); Capex $M
Source: Glencore
22
42
52
58
61
87
16
5
24
2
27
4
28
6
30
1
0
500
1,000
1,500
2,000
2,500
3,000
3,500
0
50
100
150
200
250
300
350
2008 2009 2010 2011 2012 2013 2014F 2015F 2016F 2017F 2018F
Cu
k T
on
ne
s
Cu Cathode Production CAPEX

New CM5 SAG Mill installed and commissioned
16

New oxide floatation cells installed and commissioned
17

New concentrate roaster commissioned
18

Solvent Extraction commissioned
19

200ktpa EW2 in production
20
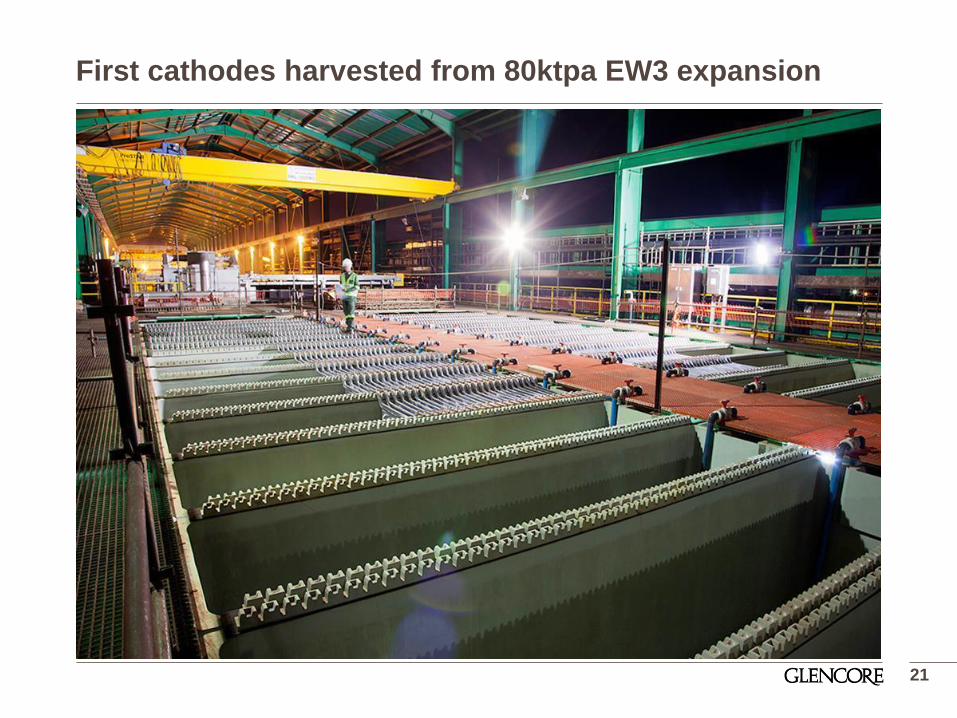
First cathodes harvested from 80ktpa EW3 expansion
21

Antapaccay – Tintaya Concentrator Restart
Tintaya restart
• Existing Tintaya concentrator to process 20 ktpd of ore from Antapaccay mine
• Startup in May 2015
• 34kt per year Cu in concs for LOM avg. 43kt per year Cu in concs for the first 5 years
• Capex of $64M:
• Mining: $25M
• Concentrator: $27M
• Infrastructure & Other: $12M
• Capital Intensity: $1.9M per 1,000t of Cu production
• Project NPV10% of $290M
• Project IRR of 119%
• Government approvals received this month
22
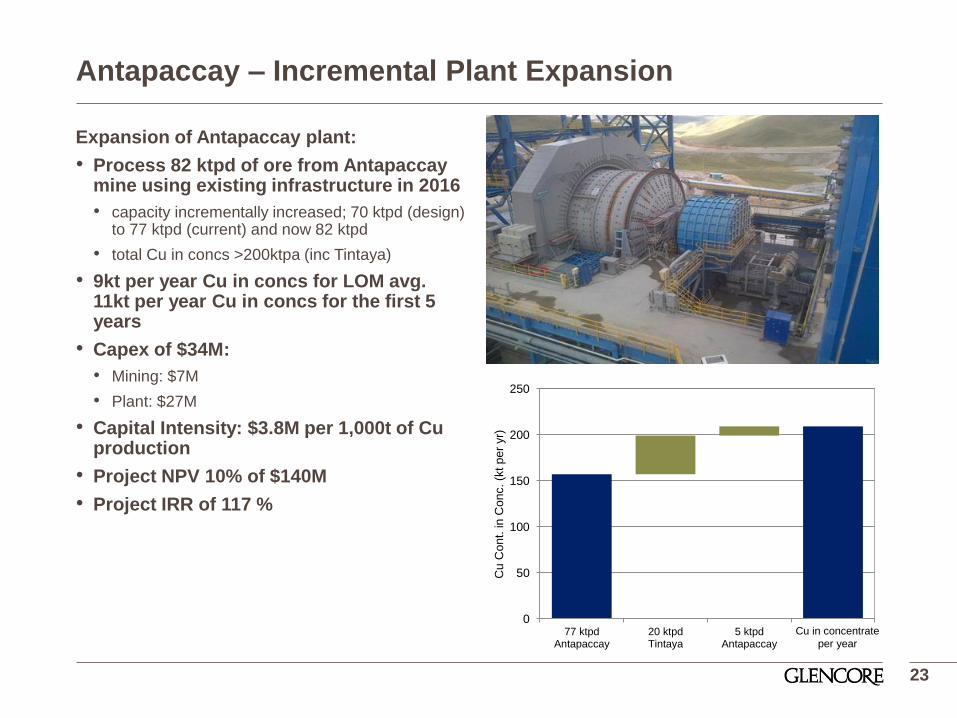
Antapaccay – Incremental Plant Expansion
Expansion of Antapaccay plant:
• Process 82 ktpd of ore from Antapaccay mine using existing infrastructure in 2016
• capacity incrementally increased; 70 ktpd (design) to 77 ktpd (current) and now 82 ktpd
• total Cu in concs >200ktpa (inc Tintaya)
• 9kt per year Cu in concs for LOM avg. 11kt per year Cu in concs for the first 5 years
• Capex of $34M:
• Mining: $7M
• Plant: $27M
• Capital Intensity: $3.8M per 1,000t of Cu production
• Project NPV 10% of $140M
• Project IRR of 117 %
23
42 10
157
209
0
50
100
150
200
250
77 ktpdAntapaccay
20 ktpdTintaya
5 ktpdAntapaccay
Cu C
on
t. in
Con
c. (k
t p
er
yr)
Cu in concentrate
per year
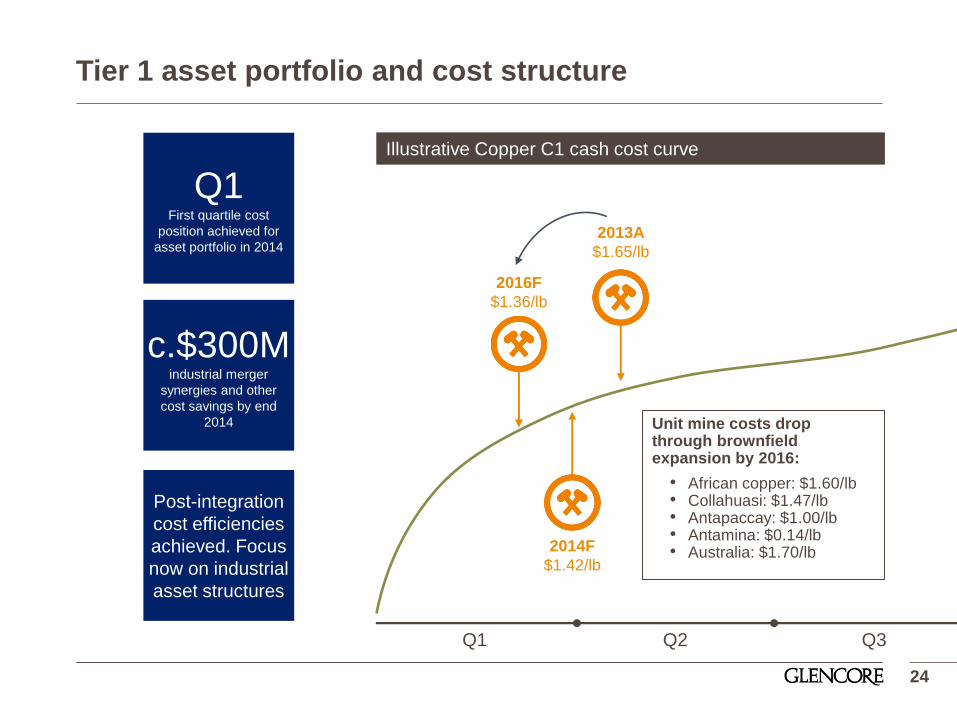
Tier 1 asset portfolio and cost structure
24
Q1 First quartile cost
position achieved for
asset portfolio in 2014
Post-integration
cost efficiencies
achieved. Focus
now on industrial
asset structures
Q1 Q2 Q3 Q4
Illustrative Copper C1 cash cost curve
2013A
$1.65/lb
Unit mine costs drop through brownfield expansion by 2016:
• African copper: $1.60/lb • Collahuasi: $1.47/lb • Antapaccay: $1.00/lb • Antamina: $0.14/lb • Australia: $1.70/lb 2014F
$1.42/lb
2016F
$1.36/lb
c.$300M industrial merger
synergies and other
cost savings by end
2014
Copper market
Altonorte anodes, Antofagasta Port, Chile

0
100,000
200,000
300,000
400,000
500,000
600,000
700,000
800,000
900,000
1,000,000Jul-0
8
Sep-0
8
No
v-0
8
Jan-0
9
Ma
r-0
9
Ma
y-0
9
Jul-0
9
Sep-0
9
No
v-0
9
Jan-1
0
Ma
r-1
0
Ma
y-1
0
Jul-1
0
Sep-1
0
No
v-1
0
Jan-1
1
Ma
r-1
1
Ma
y-1
1
Jul-1
1
Sep-1
1
No
v-1
1
Jan-1
2
Ma
r-1
2
Ma
y-1
2
Jul-1
2
Sep-1
2
No
v-1
2
Jan-1
3
Ma
r-1
3
Ma
y-1
3
Jul-1
3
Sep-1
3
No
v-1
3
Jan-1
4
Ma
r-1
4
Ma
y-1
4
Jul-1
4
Sep-1
4
LME SHFE COMEX
Global Exchange stocks are at lowest levels since 2008
26 Source: Bloomberg, Reuters

Global copper warehouse stocks are reducing further
27
722k
245k
0
200
400
600
800
1,000
1,200
1,400
1,600
1,800
Jan 2013 Jun 2013 Jan 2014 Jun 2014 Dec 2014
LME COMEX SHFE CHINA BONDED
Global warehouse copper stocks (kt Cu)
Source: Bloomberg, Reuters, Glencore estimates

0
500
1,000
1,500
2,000
2,500
3,000
2006 2007 2008 2009 2010 2011 2012 2013 2014
Chinese Copper scrap imports are falling
28
19% yoy
13% yoy
Chinese copper scrap net imports (kt contained Cu)
Source: China customs data
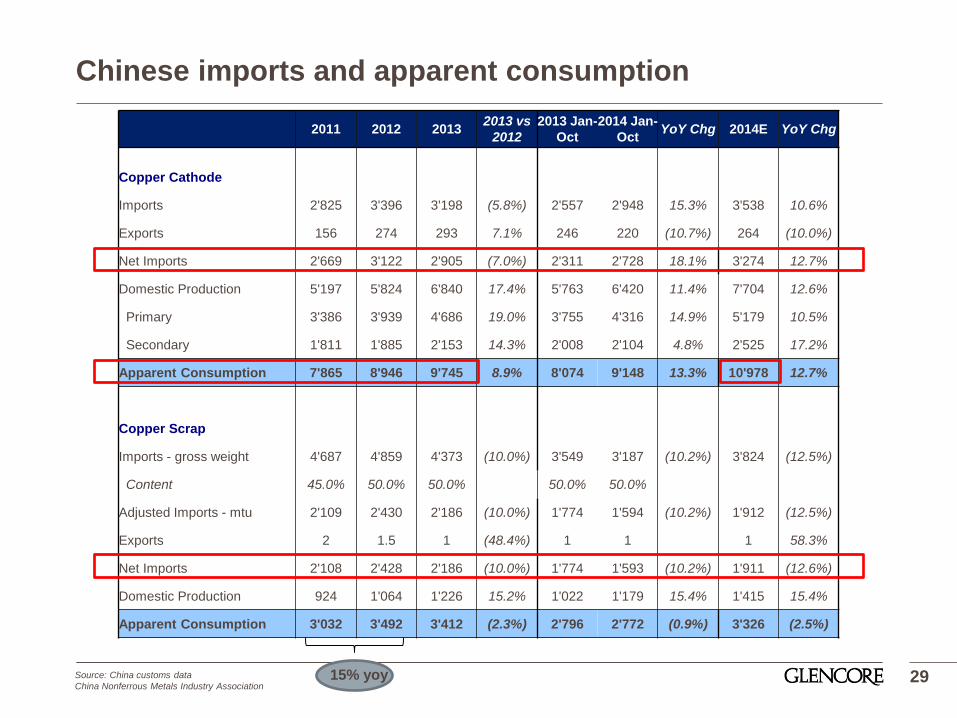
2011 2012 2013 2013 vs
2012
2013 Jan-
Oct
2014 Jan-
Oct YoY Chg 2014E YoY Chg
Copper Cathode
Imports 2'825 3'396 3'198 (5.8%) 2'557 2'948 15.3% 3'538 10.6%
Exports 156 274 293 7.1% 246 220 (10.7%) 264 (10.0%)
Net Imports 2'669 3'122 2'905 (7.0%) 2'311 2'728 18.1% 3'274 12.7%
Domestic Production 5'197 5'824 6'840 17.4% 5'763 6'420 11.4% 7'704 12.6%
Primary 3'386 3'939 4'686 19.0% 3'755 4'316 14.9% 5'179 10.5%
Secondary 1'811 1'885 2'153 14.3% 2'008 2'104 4.8% 2'525 17.2%
Apparent Consumption 7'865 8'946 9'745 8.9% 8'074 9'148 13.3% 10'978 12.7%
Copper Scrap
Imports - gross weight 4'687 4'859 4'373 (10.0%) 3'549 3'187 (10.2%) 3'824 (12.5%)
Content 45.0% 50.0% 50.0% 50.0% 50.0%
Adjusted Imports - mtu 2'109 2'430 2'186 (10.0%) 1'774 1'594 (10.2%) 1'912 (12.5%)
Exports 2 1.5 1 (48.4%) 1 1 1 58.3%
Net Imports 2'108 2'428 2'186 (10.0%) 1'774 1'593 (10.2%) 1'911 (12.6%)
Domestic Production 924 1'064 1'226 15.2% 1'022 1'179 15.4% 1'415 15.4%
Apparent Consumption 3'032 3'492 3'412 (2.3%) 2'796 2'772 (0.9%) 3'326 (2.5%)
Chinese imports and apparent consumption
29 15% yoy Source: China customs data
China Nonferrous Metals Industry Association

Minus:
Kennecott 100k
Escondida 150k
Alumbrera 50k
Surplus
now 90k
MT?
Demand vs Supply per ICSG and Wood Mackenzie
30 Source: ICSG, Wood Mackenzie Global copper short-term outlook, November 2014
Implications of the estimates:
• Implied mine production growth of ~1 million MT between 2014 and 2015
(6% growth)
• Where is the supply coming from?
2014 2015
ICSG Apr ‘14 Estimate
~400 kt
surplus
~600 kt
surplus
ICSG Oct ‘14 Estimate
~300 kt
deficit
(Δ 700 kt lower)
~390 kt
surplus
(Δ 210 kt lower)
WoodMac Nov ‘14
Estimate
180 kt
surplus
202 kt
surplus
Copper Demand/Supply balance estimates

Latest 2015 supply forecasts may still be very optimistic
31 Source: Wood Mackenzie Global copper short-term outlook, November 2014
+320kt?
• Production double counted Frontier at Mopani. 2014 production
is 720 kt;
• Production and commissioning issues. 2015 to be 850 kt
+87kt?
• OT phase 2 not next year as company states only open pit next
year
+72kt? Where does this come from?
+328kt?
• Major projects commissioned in 2014 (DMH, Caserones, Sierra
Gorda)
• Escondida lower by ~150kt
• Codelco lower by ~90kt (cathodes)
• Toromocho operating at 25% capacity
• Las Bambas delayed to 2016
• Constancia commissioning?
+353kt?
• Major projects commissioned in 2014 (Morenci, Eagle, Mt
Milligan, Nunavik)
• Operational incidents (Mt Polley tailings dam failure – mine shut
down, Buenavista- spillage in river and schedule pushed out
into 2016)
• Kennecott lower production (100kt)
+350kt?
• Indonesian concentrates export permits
• Production and labour issues at Grasberg - operating at 80%
+50kt? Alumbrera lower production
+200kt?
• DRC running at 950kt in 2014. To go to just over 1 mt in 2015
~1.8 million MT?

2015 copper supply forecast keeps changing
22,000
22,500
23,000
23,500
24,000
24,500
25,000
2010 Q1 2010 Q3 2011 Q1 2011 Q3 2012 Q1 2012 Q3 2013 Q1 2013 Q4 2014 Q2
32
2015 supply forecast as estimated in each period (kt Cu)
Source: Wood Mackenzie Global copper long-term outlook Q1 2010 to Q3 2014, Glencore estimates
-1.6Mt
• Project deferrals;
• Commissioning delays;
• Revised mine plans.
• Brookhunt and ICSG give 390 kt surplus guidance
• Taking the previous slide, deduct 1.8 Mt = Deficit of 1.4 - 1.6 Mt for 2015?
• Consumption - the world is emerging from the biggest recession in 100 years
Make your
own mind up?
Thank you
33

Appendix: Copper asset update
Kantanga Phase V, EW3 under commissioning, DRC
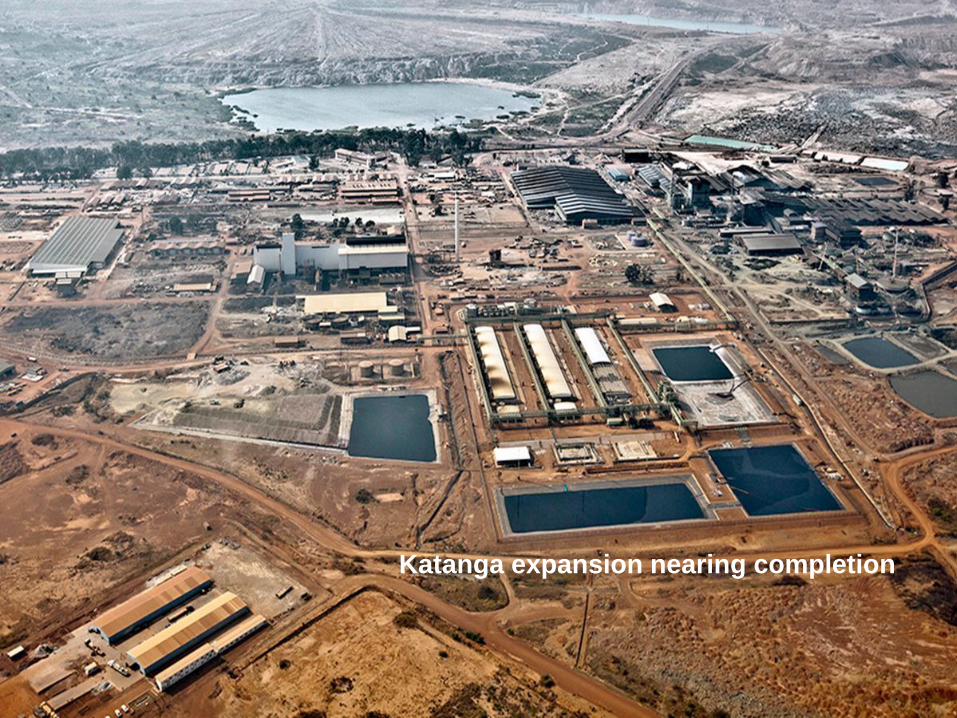
Katanga expansion nearing completion
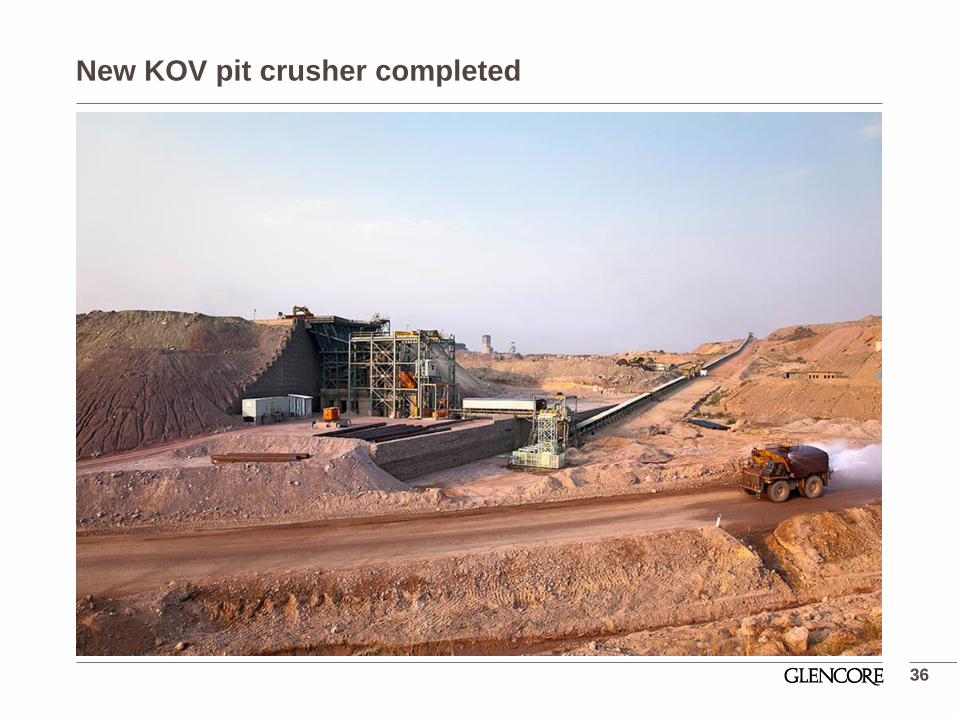
New KOV pit crusher completed
36
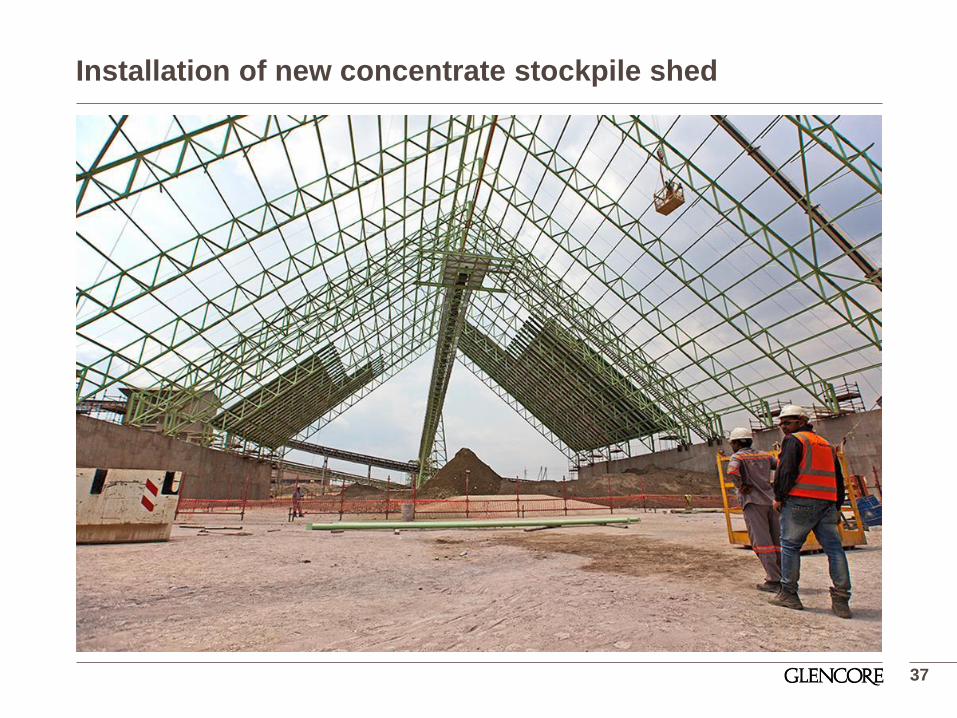
Installation of new concentrate stockpile shed
37

Heap leach extension complete
38

39
DRC power project
Refurbishment of Inga Unit G27, DRC

Mopani – synclinorium and deeps project update
New acid plant, Mufilira smelter, Zambia
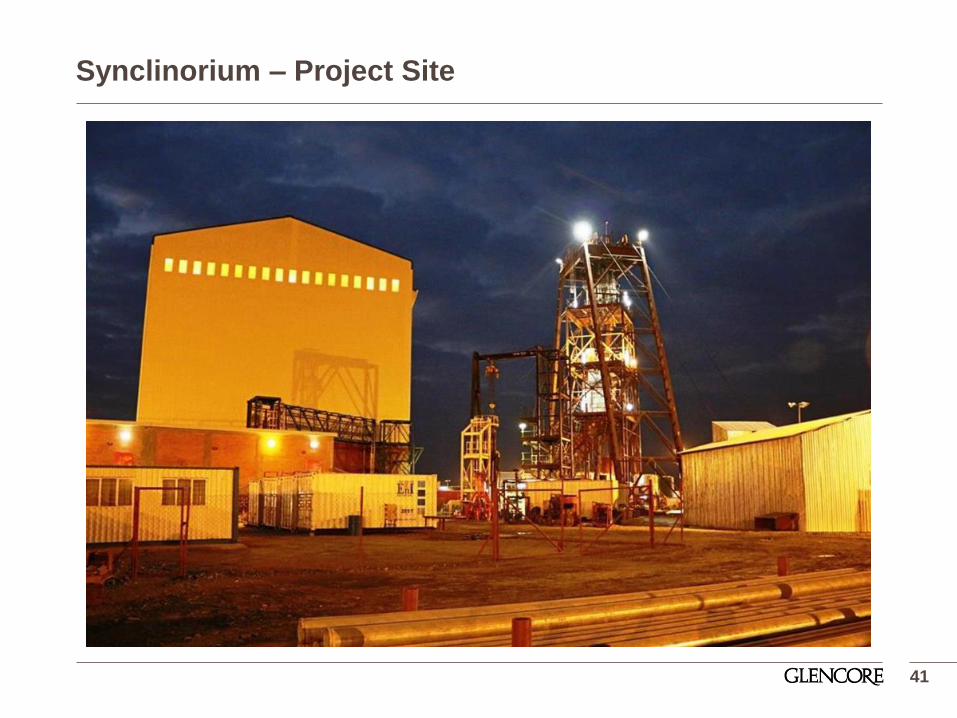
Synclinorium – Project Site
41

Synclinorium – New Winder Main Shaft
42

Synclinorium – New Winder
43

Synclinorium – New Winder House
44

Synclinorium – Sub Station
45

Synclinorium – New Generator Building
46

Synclinorium – Loading Station – 1231m level
47

Synclinorium – Loading Station – 1231m Level
48

Synclinorium – Ventilation Shaft
49
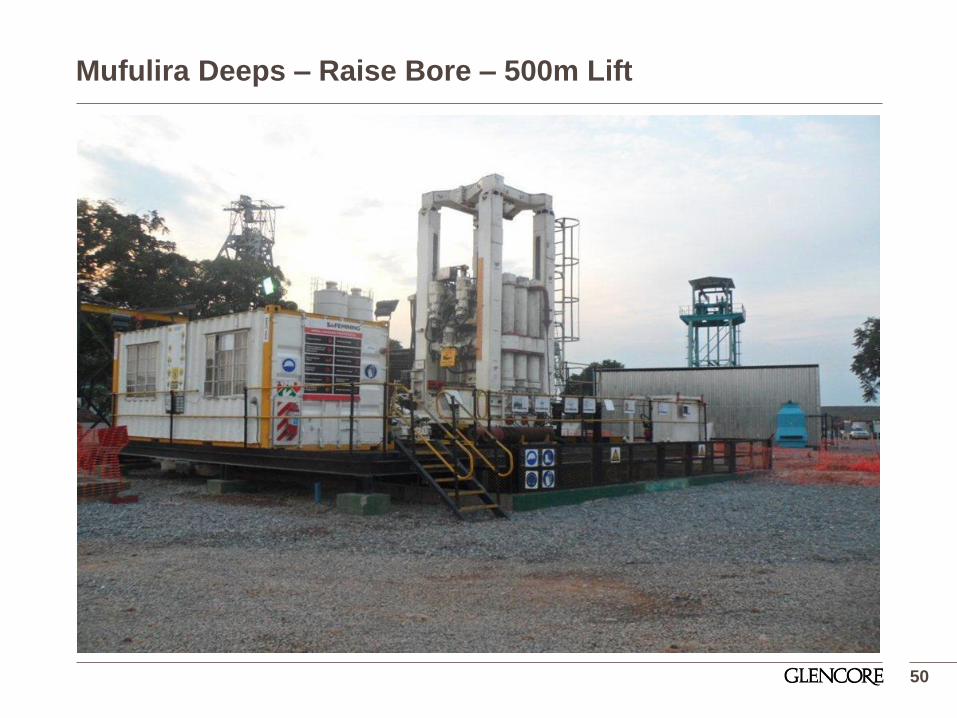
Mufulira Deeps – Raise Bore – 500m Lift
50

Mindola Deeps – 4960L
51