powerpoint timesaver
DESCRIPTION
pptTRANSCRIPT

Global Brand
PowerPoint TimesaverBetter charts, tables, and diagrams for better reports and presentations

© 2009 Deloitte Touche Tohmatsu
Purpose of this document
• This document contains over 200 preformatted charts which you can use for copying and pasting into your PowerPoint presentations
‒ it will save you time, ensure brand consistency, and result in a more polished and powerful end-product
• All charts are fully consistent with the global PowerPoint templates and visual identity system
‒ be sure you are using this template before pasting charts from this file into your presentation
• For comments and questions please contact
‒ Brian Resnick (US – New York, +1 212 492 4237)
‒ Dipankar Ghosh (US – Hyderabad, +91 40 6670 6537)
2

© 2009 Deloitte Touche Tohmatsu
Use this page to locate your charts, then switch to slide sorter mode and copy the charts you need into your document
3
Structured Text
ShapesCharts
Graphs
Special Graphics
Trees
Maps
Conceptual Charts
Bars
Columns
Tables Relations
Logic Trees
Org Charts
Chevrons
Circles
World
Strategy Process
Activity Maps
Moon
Development stages
Areas
Pies
Quotes
Driver Trees
Spheres
Boxes
Process flows
Timelines
Radars
Lines
Puzzles
Calendars
Curves
Waterfalls
Flags
Others
Triangles
Others
1
2
3
4
5
6
7
America
Europe
Others
Tip! Two fast ways to locateyour favorite slide1. Switch to slide show view (Shift
F5) and click on the box of your choice
2. Stay in normal view, right click on the appropriate Text and select Open Hyperlink
Press Home - Pg Dn - Pg Dn toreturn to this page
Text Charts
Forces at work

© 2009 Deloitte Touche Tohmatsu
Use these generic elements for copying and pasting
4
• Generic text with bullet
‒ Generic dash text
• Generic subbullet text
O
Draft
For discussion only
Preliminary Illustrative
Tip! Use the Paint Brush on the Formatting Toolbar to copy identical settings onto other objects. Rotate and Flip objects as needed
using the Draw Toolbar
Directional Indicative
Note:Source:
Arrows Text items Generic header
BallsScale Breaks
DRAFT
Important Note: The colors red and yellow are used as part of heat maps and traffic light signals because these carry apt meaning to their usage. Please do not use these colors for any other purpose, they are strictly for Heat maps and Traffic light signal usage.
1
2

© 2009 Deloitte Touche Tohmatsu
Use this color scheme, with the indicated text colors
5
Deloitte BluePantone 280
R 0G 39B 118
Deloitte GreenPantone 375
R 146G 212B 0
Mid BluePantone 299
R 0G 161B 222
Dark GreenPantone 363
R 60G 138B 46
Light GreenPantone 381
R 201G 221B 3
Text
Text
Light BluePantone 297
R 114G 199B 231
Text Text Text Text Text
Text Text Text Text Text
Text Text Text Text Text Text
First level
Second level - Darker 25%
Second level - Lighter 40%
R 0G 29B 89
R 0G 121B 166
R 45G 104B 35
R 40G 170B 218
R 151G 166B 2
R 109G 159B 0
R 20G 98B 255
R 82G 208B 255
R 123G 206B 108
R 170G 221B 241
R 237G 253B 86
R 199G 255B 76

© 2009 Deloitte Touche Tohmatsu
Structured Text
Trees
Graphs
Shapes
Maps
Special Graphics
Conceptual Charts
Agenda
6

© 2009 Deloitte Touche Tohmatsu
Tables - Data table
7
Subhead Subhead Subhead Subhead Subhead Subhead Subhead Subhead
Row description xx xx xx xx xx xx xx xx
Row description xx xx xx xx xx xx xx xx
Row description xx xx xx xx xx xx xx xx
Row description xx xx xx xx xx xx xx xx
Row description xx xx xx xx xx xx xx xx
Row description xx xx xx xx xx xx xx xx
Row description xx xx xx xx xx xx xx xx
Row description xx xx xx xx xx xx xx xx
Text
© 2009 Deloitte Touche Tohmatsu
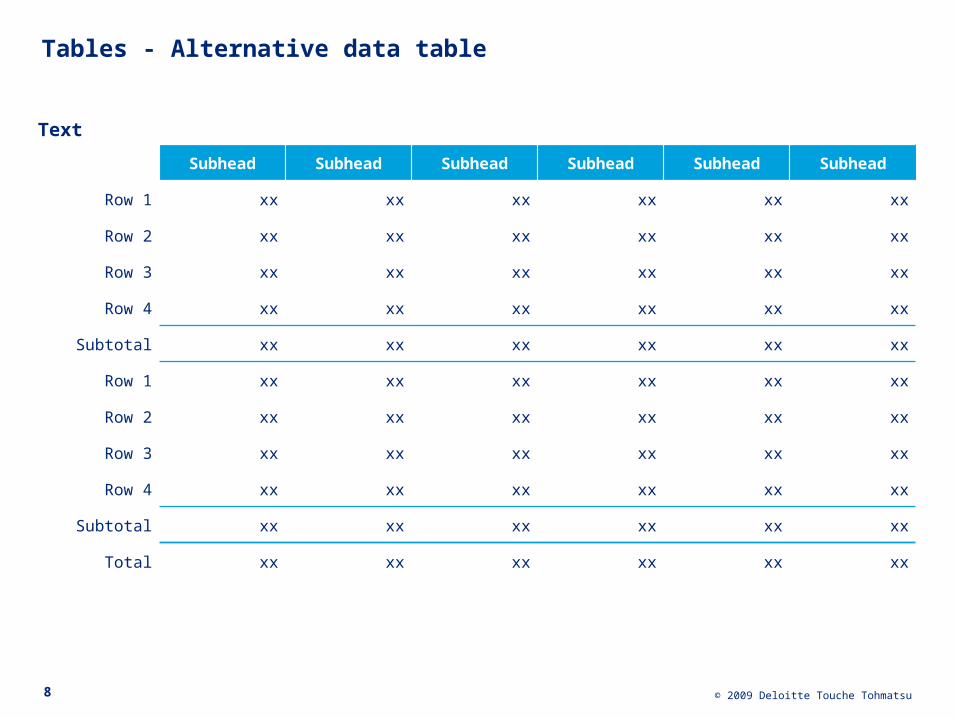
Tables - Alternative data table
8
Subhead Subhead Subhead Subhead Subhead Subhead
Row 1 xx xx xx xx xx xx
Row 2 xx xx xx xx xx xx
Row 3 xx xx xx xx xx xx
Row 4 xx xx xx xx xx xx
Subtotal xx xx xx xx xx xx
Row 1 xx xx xx xx xx xx
Row 2 xx xx xx xx xx xx
Row 3 xx xx xx xx xx xx
Row 4 xx xx xx xx xx xx
Subtotal xx xx xx xx xx xx
Total xx xx xx xx xx xx
Text

© 2009 Deloitte Touche Tohmatsu9
Tables - Table with text
Subhead Subhead
Row description Text line (if not needed, delete)
• Bullet
‒ Dash
• Subbullet
Text line (if not needed, delete)
• Bullet
‒ Dash
• Subbullet
Row description Text line (if not needed, delete)
• Bullet
‒ Dash
• Subbullet
Text line (if not needed, delete)
• Bullet
‒ Dash
• Subbullet
Row description Text line (if not needed, delete)
• Bullet
‒ Dash
• Subbullet
Text line (if not needed, delete)
• Bullet
‒ Dash
• Subbullet
Text

© 2009 Deloitte Touche Tohmatsu
Tables - Table with full column of bullets and dashes
10
Subhead Subhead Subhead Subhead
Text line (if not needed, delete)
• Bullet
‒ Dash
• Subbullet
Text line (if not needed, delete)
• Bullet
‒ Dash
• Subbullet
Text line (if not needed, delete)
• Bullet
‒ Dash
• Subbullet
Text line (if not needed, delete)
• Bullet
‒ Dash
• Subbullet
Text line (if not needed, delete)
• Bullet
‒ Dash
• Subbullet
Text line (if not needed, delete)
• Bullet
‒ Dash
• Subbullet
Text line (if not needed, delete)
• Bullet
‒ Dash
• Subbullet
Text line (if not needed, delete)
• Bullet
‒ Dash
• Subbullet
Text

© 2009 Deloitte Touche Tohmatsu
Tables - Chevron table
11
Subhead Subhead Subhead Subhead
Heading
• Bullet
‒ Dash
• Subbullet
Heading
• Bullet
‒ Dash
• Subbullet
Heading
• Bullet
‒ Dash
• Subbullet
Heading
• Bullet
‒ Dash
• Subbullet
Heading
• Bullet
‒ Dash
• Subbullet
Heading
• Bullet
‒ Dash
• Subbullet
Heading
• Bullet
‒ Dash
• Subbullet
Heading
• Bullet
‒ Dash
• Subbullet
Heading
• Bullet
‒ Dash
• Subbullet
Heading
• Bullet
‒ Dash
• Subbullet
Heading
• Bullet
‒ Dash
• Subbullet
Heading
• Bullet
‒ Dash
• Subbullet
Text, Arial 14-pt bold
Text Text Text
Text

Divider – Times New Roman 52pt

© 2009 Deloitte Touche Tohmatsu
Text boxes - Single text box with paragraph, bullet, and dash points
Paragraph (if not needed, delete)
• Bullet
‒ Dash
• Sub bullet
13

© 2009 Deloitte Touche Tohmatsu
Text boxes - Two text boxes with paragraph, bullet, and dash points
14
Text
Paragraph (if not needed, delete)
• Bullet
‒ Dash
• Subbullet
Text
Paragraph (if not needed, delete)
• Bullet
‒ Dash
• Subbullet
Text
© 2009 Deloitte Touche Tohmatsu
Text boxes - Three to a slide, with paragraph, bullet, and dash points
15
Text
Paragraph (if not needed, delete)
• Bullet
‒ Dash
• Subbullet
Text
Paragraph (if not needed, delete)
• Bullet
‒ Dash
• Subbullet
Text
Paragraph (if not needed, delete)
• Bullet
‒ Dash
• Subbullet
Text

© 2009 Deloitte Touche Tohmatsu
Text boxes - Four to a slide, with paragraph, bullet, and dash points
16
Text
Paragraph (if not needed, delete)
• Bullet
‒ Dash
• Subbullet
Text
Paragraph (if not needed, delete)
• Bullet
‒ Dash
• Subbullet
Text
Paragraph (if not needed, delete)
• Bullet
‒ Dash
• Subbullet
Text
Paragraph (if not needed, delete)
• Bullet
‒ Dash
• Subbullet
Text

© 2009 Deloitte Touche Tohmatsu
Text boxes - Two by two
17
Text
Paragraph (if not needed, delete)
• Bullet
‒ Dash
• Subbullet
Text
Paragraph (if not needed, delete)
• Bullet
‒ Dash
• Subbullet
Text
Paragraph (if not needed, delete)
• Bullet
‒ Dash
• Subbullet
Text
Paragraph (if not needed, delete)
• Bullet
‒ Dash
• Subbullet
Text

© 2009 Deloitte Touche Tohmatsu
Text boxes - Three by two
18
Text
Paragraph (if not needed, delete)
• Bullet
‒ Dash
• Subbullet
Text
Paragraph (if not needed, delete)
• Bullet
‒ Dash
• Subbullet
Text
Paragraph (if not needed, delete)
• Bullet
‒ Dash
• Subbullet
Text
Paragraph (if not needed, delete)
• Bullet
‒ Dash
• Subbullet
Text
Paragraph (if not needed, delete)
• Bullet
‒ Dash
• Subbullet
Text
Paragraph (if not needed, delete)
• Bullet
‒ Dash
• Subbullet
Text

© 2009 Deloitte Touche Tohmatsu
Text boxes - Four by two
19
Text
Paragraph (if not needed, delete)
• Bullet
‒ Dash
• Subbullet
Text
Paragraph (if not needed, delete)
• Bullet
‒ Dash
• Subbullet
Text
Paragraph (if not needed, delete)
• Bullet
‒ Dash
• Subbullet
Text
Paragraph (if not needed, delete)
• Bullet
‒ Dash
• Subbullet
Text
Paragraph (if not needed, delete)
• Bullet
‒ Dash
• Subbullet
Text
Paragraph (if not needed, delete)
• Bullet
‒ Dash
• Subbullet
Text
Paragraph (if not needed, delete)
• Bullet
‒ Dash
• Subbullet
Text
Paragraph (if not needed, delete)
• Bullet
‒ Dash
• Subbullet
Text

© 2009 Deloitte Touche Tohmatsu
1
Text boxes - Two columns of numbered points for each point
20
3
4
5
2
• Bullet
‒ Dash
• Subbullet
• 2nd column bullet
‒ Dash
• Subbullet
• Bullet
‒ Dash
• Subbullet
• 2nd column bullet
‒ Dash
• Subbullet
• Bullet
‒ Dash
• Subbullet
• 2nd column bullet
‒ Dash
• Subbullet
• Bullet
‒ Dash
• Subbullet
• 2nd column bullet
‒ Dash
• Subbullet
• Bullet
‒ Dash
• Subbullet
• 2nd column bullet
‒ Dash
• Subbullet

© 2009 Deloitte Touche Tohmatsu
Text boxes - Two columns of numbered points for each point
21
3
4
5
2
• Bullet
‒ Dash
• Subbullet
1
• Bullet
‒ Dash
• Subbullet
• Bullet
‒ Dash
• Subbullet
• Bullet
‒ Dash
• Subbullet
• Bullet
‒ Dash
• Subbullet
8
9
10
7
• Bullet
‒ Dash
• Subbullet
6
• Bullet
‒ Dash
• Subbullet
• Bullet
‒ Dash
• Subbullet
• Bullet
‒ Dash
• Subbullet
• Bullet
‒ Dash
• Subbullet

© 2009 Deloitte Touche Tohmatsu
Snapshot boxes
22
No. 1
In the market
100bn
In revenues
200m
Customers
50,000
Suppliers
200m
Customers
50,000
Suppliers
200m
Customers
50,000
Suppliers
200m
Customers
50,000
Suppliers
200m
Customers
50,000
Suppliers
No. 1
In the market
100bn
In revenues
No. 1
In the market
100bn
In revenues
No. 1
In the market
100bn
In revenues
No. 1
In the market
100bn
In revenues
Text

© 2009 Deloitte Touche Tohmatsu
Text boxes - Two ways of showing major points
23
• Bullet
• Bullet
• Bullet
• Bullet
• Bullet
• Bullet
• Bullet
• Bullet
• Bullet
• Bullet
• Bullet
• Bullet
• Bullet
• Bullet
• Bullet
• Bullet
• Bullet
• Bullet
Text
Text
Text
Text
• Bullet
• Bullet
• Bullet
• Bullet
• Bullet
• Bullet
Text

© 2009 Deloitte Touche Tohmatsu
Text boxes - Major points with chevrons
24
Text
Text
Text
Text
• Bullet
• Bullet
• Bullet
• Bullet
• Bullet
• Bullet
• Bullet
• Bullet
• Bullet
• Bullet
• Bullet
• Bullet
• Bullet
• Bullet
• Bullet
• Bullet
• Bullet
• Bullet
• Bullet
• Bullet
• Bullet
• Bullet
• Bullet
• Bullet
Text

© 2009 Deloitte Touche Tohmatsu
Text boxes - Chevrons with text boxes
25
Paragraph (if not needed, delete)
• Bullet
‒ Dash
• Subbullet
Paragraph (if not needed, delete)
• Bullet
‒ Dash
• Subbullet
Paragraph (if not needed, delete)
• Bullet
‒ Dash
• Subbullet
Paragraph (if not needed, delete)
• Bullet
‒ Dash
• Subbullet
Text, Arial 14-pt bold
Text Text Text
Text

© 2009 Deloitte Touche Tohmatsu
Text boxes - Vertical chevrons with text
26
• Bullet
‒ Dash
• Subbullet
• Bullet
‒ Dash
• Subbullet
• Bullet
‒ Dash
• Subbullet
Text
Text
Text
Text
• Bullet
‒ Dash
• Subbullet
Text

© 2009 Deloitte Touche Tohmatsu
Text blocks - Influencing chevrons
27
Text
Text
• Bullet
‒ Dash
• Subbullet
Text
• Bullet
‒ Dash
• Subbullet
Text
• Bullet
‒ Dash
• Subbullet
Text
• Bullet
‒ Dash
• Subbullet
Text
• Bullet
‒ Dash
• Subbullet
Text
• Bullet
‒ Dash
• Subbullet
Text

© 2009 Deloitte Touche Tohmatsu
TextText
• Bullet
‒ Dash
Text
• Bullet
‒ Dash
Text
• Bullet
‒ Dash
Text
• Bullet
‒ Dash
Text
• Bullet
‒ Dash
Text
• Bullet
‒ Dash
Text blocks - Chevrons resulting from
28
Text
• Bullet
‒ Dash
Text
• Bullet
‒ Dash
Text

© 2009 Deloitte Touche Tohmatsu
Text blocks - Arrow leading to
29
• Text
• Text
• Text
• Text
• Text
• Text
Text
Text

© 2009 Deloitte Touche Tohmatsu
Text blocks - Elements Leading To
30
Text Text Text
Text Text Text
Text Text Text Text
TextText

© 2009 Deloitte Touche Tohmatsu
Text
Text
• Bullet
‒ Dash
• Subbullet
Text blocks - Interrelated
31
Text
Text
• Bullet
‒ Dash
• Subbullet
Text
Text
• Bullet
‒ Dash
• Subbullet
Text
Text
• Bullet
‒ Dash
• Subbullet
Text

© 2009 Deloitte Touche Tohmatsu
Text blocks - Sequence
32
• Bullet
‒ Dash
• Bullet
‒ Dash
• Bullet
‒ Dash
• Bullet
‒ Dash
Text

© 2009 Deloitte Touche Tohmatsu
Text blocks - Enveloping elements
33
Text
….
….
….
….
….
….
Text
Text

© 2009 Deloitte Touche Tohmatsu
Text blocks - Michelangelo (top alignment)
34
Paragraph (if not needed, delete)
• Bullet
‒ Dash
• Subbullet
Paragraph (if not needed, delete)
• Bullet
‒ Dash
• Subbullet
Text
Image or Text area
Text

© 2009 Deloitte Touche Tohmatsu
Text
Text blocks - Michelangelo (left alignment)
35
Paragraph (if not needed, delete)
• Bullet
‒ Dash
• Subbullet
Image or Text area
Text

© 2009 Deloitte Touche Tohmatsu36
Text blocks - Two squares
Paragraph (if not needed, delete)
• Bullet
‒ Dash
• Subbullet
Paragraph (if not needed, delete)
• Bullet
‒ Dash
• Subbullet
Text

© 2009 Deloitte Touche Tohmatsu37
Text blocks - Leading to
Conclusion
• Text • Text
• Text • Text
• Text • Text
• Text • Text
• Text • Text
Text

© 2009 Deloitte Touche Tohmatsu38
Text blocks - Interaction
Paragraph (if not needed, delete)
• Bullet
‒ Dash
• Subbullet
Paragraph (if not needed, delete)
• Bullet
‒ Dash
• Subbullet
Text

© 2009 Deloitte Touche Tohmatsu39
Text blocks - Coupled vertical
Paragraph (if not needed, delete)
• Bullet
‒ Dash
• Subbullet
Paragraph (if not needed, delete)
• Bullet
‒ Dash
• Subbullet
Text

© 2009 Deloitte Touche Tohmatsu40
Text blocks - Working together
Paragraph (if not needed, delete)
• Bullet
‒ Dash
• Subbullet
Paragraph (if not needed, delete)
• Bullet
‒ Dash
• Subbullet
Text

© 2009 Deloitte Touche Tohmatsu
Text
Text blocks - Sources leading to
41
Paragraph (if not needed, delete)
• Bullet
‒ Dash
• Subbullet
Paragraph (if not needed, delete)
• Bullet
‒ Dash
• Subbullet
Text Text

© 2009 Deloitte Touche Tohmatsu
Text blocks - Gravitating to
42
It all comes down to this
Text
Text
Text
Text Text
Text
Text
Text
Text

© 2009 Deloitte Touche Tohmatsu43
Quotes
……
…
…
…
…
…
…
…
…
…
Text

© 2009 Deloitte Touche Tohmatsu44
Quotes
……
…
…
…
…
…
…
…
…
…
Text

© 2009 Deloitte Touche Tohmatsu45
Agenda
Structured Text
Trees
Graphs
Shapes
Maps
Special Graphics
Conceptual Charts

© 2009 Deloitte Touche Tohmatsu46
Logic trees - Blue, one level plus text
• Bullet
‒ Dash
• Subbullet
• Bullet
‒ Dash
• Subbullet
• Bullet
‒ Dash
• Subbullet
• Bullet
‒ Dash
• Subbullet
Text
Text
Text
Text
Text
Tip! Use the Connectors under AutoShapes to connect additional boxes. Use Align and Distribute in the Draw toolbar to properly position the boxes on the page. Work from right to left: first align, then distribute
Text

© 2009 Deloitte Touche Tohmatsu47
Logic trees - White, one level plus text
• Bullet
‒ Dash
• Subbullet
• Bullet
‒ Dash
• Subbullet
• Bullet
‒ Dash
• Subbullet
• Bullet
‒ Dash
• Subbullet
Text
Text
Text
Text
Text
Text

© 2009 Deloitte Touche Tohmatsu48
Logic trees - Blue, two levels
Text
Text
Text
Text
Text
Text
Text
Text
Text
Text
Text

© 2009 Deloitte Touche Tohmatsu49
Logic trees - White, two levels
Text
Text
Text
Text
Text
Text
Text
Text
Text
Text
Text
© 2009 Deloitte Touche Tohmatsu50
Logic trees - Vertical
Text
Text Text Text Text Text Text Text Text
Text Text Text
Text
Text

© 2009 Deloitte Touche Tohmatsu51
Logic trees - Vertical with straight lines
Text
Text Text Text Text Text Text Text Text
Text Text Text
Text
Text

© 2009 Deloitte Touche Tohmatsu52
Introduction• Situation: Text
• Complication: Text• Question: Text
Logic trees - Hypothesis tree
• Slide hypothesis
‒ Dash
• Slide hypothesis
‒ Dash
• Slide hypothesis
‒ Dash
• Slide hypothesis
‒ Dash
Chapter X
Supporting hypothesis
Chapter X
Supporting hypothesis
Chapter X
Supporting hypothesis
Chapter X
Supporting hypothesis
Answer
Main hypothesis

© 2009 Deloitte Touche Tohmatsu53
Logic trees - Executive summary tree
Report title
Main Conclusion
Chapter titleSupporting conclusion
Chapter titleSupporting conclusion
Chapter titleSupporting conclusion
Chapter titleSupporting conclusion
• Slide text
‒ Dash
• Slide text
‒ Dash
• Slide text
‒ Dash
• Slide text
‒ Dash

© 2009 Deloitte Touche Tohmatsu54
Driver trees - Arrows showing base trends
Text
Text
Text Text
Text
Text
Text
Text
Text Text Text
Text Text

© 2009 Deloitte Touche Tohmatsu55
Driver trees - Moons showing base trends
Text
Text
Text
Text
Text
Text
strong weak
TextTextTextTextText
Text Text
© 2009 Deloitte Touche Tohmatsu56
Driver trees - Text with general trends
• Bullet
‒ Dash
• Bullet
‒ Dash
• Bullet
‒ Dash
• Bullet
‒ Dash
• Bullet
‒ Dash
• Bullet
‒ Dash
Text
Text
Text
Text
Text
Text
Text
Text
Text
Text

© 2009 Deloitte Touche Tohmatsu57
Text
Paragraph (if not needed, delete)
• Bullet
‒ Dash
• Subbullet
Driver trees - Expanded text
Text
Text
Text
Text
Text Text
Text
Text
Text
Text
Text
Text
Text
Paragraph (if not needed, delete)
• Bullet
‒ Dash
• Subbullet
Text

© 2009 Deloitte Touche Tohmatsu58
Driver Trees - Arrows showing trend
Text
Text
Text
Text
Text
Text
Text
Text
Text
TextText
Text
Text
Text
Text
Text
Text
Text
Text
Text
Text

© 2009 Deloitte Touche Tohmatsu59
LabelLine 1
Line 2
LabelLine 1
Line 2
LabelLine 1
Line 2
LabelLine 1
Line 2
LabelLine 1
Line 2
LabelLine 1
Line 2
LabelLine 1
Line 2
Label
Line 1
Line 2
Label
Line 1
Line 2
LabelLine 1
Line 2
Organization chart - Simple
Text

© 2009 Deloitte Touche Tohmatsu60
LabelText
LabelText
LabelText
LabelText
LabelText
LabelText
Label
Text
Label
Text
Label
Text
Label
Text
Label
Text
Organization chart - Extensive
Text
LabelText
LabelText
LabelText
LabelText
LabelText
LabelText
LabelText
LabelText
LabelText
LabelText
LabelText
LabelText

© 2009 Deloitte Touche Tohmatsu
Organization chart - With text blocks
61
Text
Text
Text Text Text
• Bullet
‒ Dash
• Subbullet
• Bullet
‒ Dash
• Subbullet
• Bullet
‒ Dash
• Subbullet
Text

© 2009 Deloitte Touche Tohmatsu62
Agenda
Structured Text
Trees
Graphs
Shapes
Maps
Special Graphics
Conceptual Charts

© 2009 Deloitte Touche Tohmatsu63
Bar Chart - Stacked
East
West
North
0 20 40 60 80 100 120 140 160 180 200
45.9
30.5
25.4
46.9
38.6
45.6
45
34.6
39.2
43.9
31.6
30.4
A B C D
Unit or additional information
Units
Note: Source:
Text

© 2009 Deloitte Touche Tohmatsu64
Bars - Two Stacked
Units
A B C D
Unit or additional information
Units
Unit or additional information
East
West
North
0 20 40 60 80 100 120 140 160 180 200
45.9
30.5
25.4
46.9
38.6
45.6
45
34.6
39.2
43.9
31.6
30.4
East
West
North
0 20 40 60 80 100 120 140 160 180 200
45.9
30.5
25.4
46.9
38.6
45.6
45
34.6
39.2
43.9
31.6
30.4
A B C D
Note:Source:
Text Text

© 2009 Deloitte Touche Tohmatsu65
Bars - Three Stacked
Units
A B C D
Unit or additional information
East
West
North
Note:Source:
Units
A B C D
Unit or additional information
East
West
North
Units
A B C D
Unit or additional information
East
West
North
Text Text Text
© 2009 Deloitte Touche Tohmatsu66
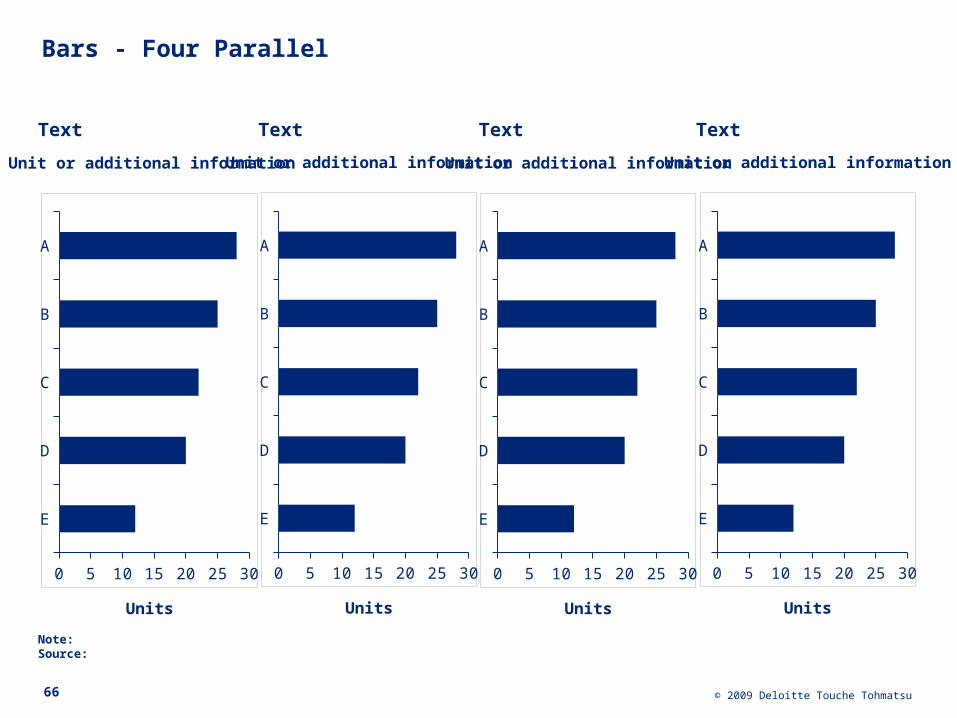
Bars - Four Parallel
Units
Unit or additional information
E
D
C
B
A
0 5 10 15 20 25 30
Note:Source:
Units
Unit or additional information
E
D
C
B
A
0 5 10 15 20 25 30
Units
Unit or additional information
E
D
C
B
A
0 5 10 15 20 25 30
Units
Unit or additional information
E
D
C
B
A
0 5 10 15 20 25 30
Text Text Text Text

© 2009 Deloitte Touche Tohmatsu67
Bars - Paired
Units
Unit or additional information
Note:Source:
East
West
North
0 5 10 15 20 25 30 35 40 45
41.1
34.3
32.2
40.3
33.6
30.4
B
A
Text

© 2009 Deloitte Touche Tohmatsu68
Bars - Two paired
Units
Unit or additional information
Note:Source:
East
West
North
0 5 10 15 20 25 30 35 40 45
41.1
34.3
32.2
40.3
33.6
30.4
B
A
East
West
North
0 5 10 15 20 25 30 35 40 45
41.1
34.3
32.2
40.3
33.6
30.4
B
A
Unit or additional information
Text Text
© 2009 Deloitte Touche Tohmatsu69
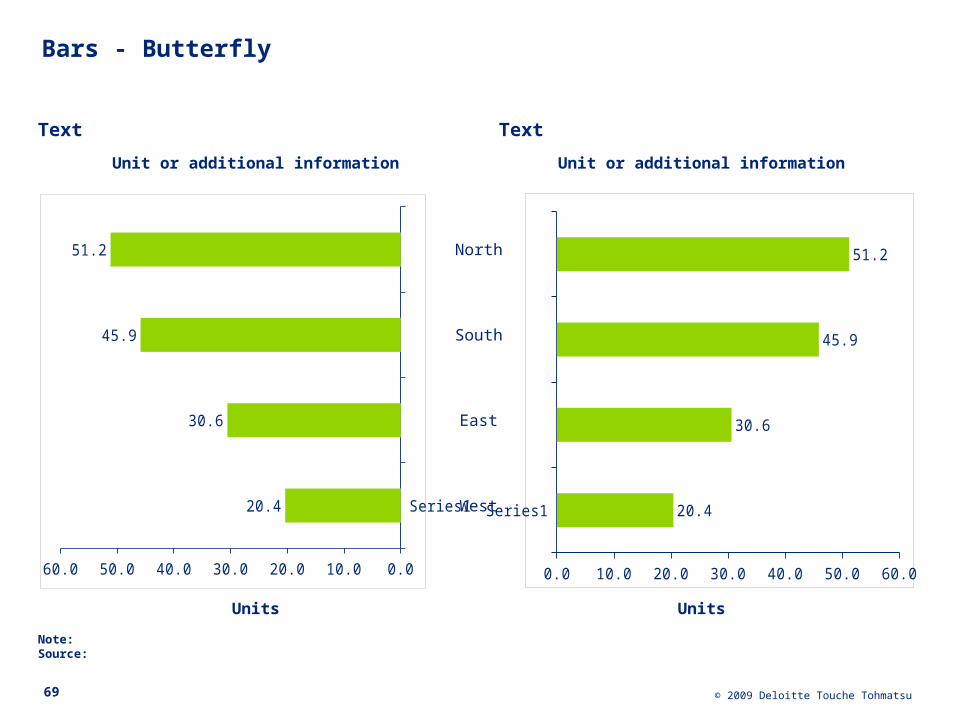
Bars - Butterfly
Units
Unit or additional information
Note:Source:
Series1
0.010.020.030.040.050.060.0
20.4
30.6
45.9
51.2
Unit or additional information
Series1
0.0 10.0 20.0 30.0 40.0 50.0 60.0
20.4
30.6
45.9
51.2North
South
East
West
Units
Text Text
© 2009 Deloitte Touche Tohmatsu70
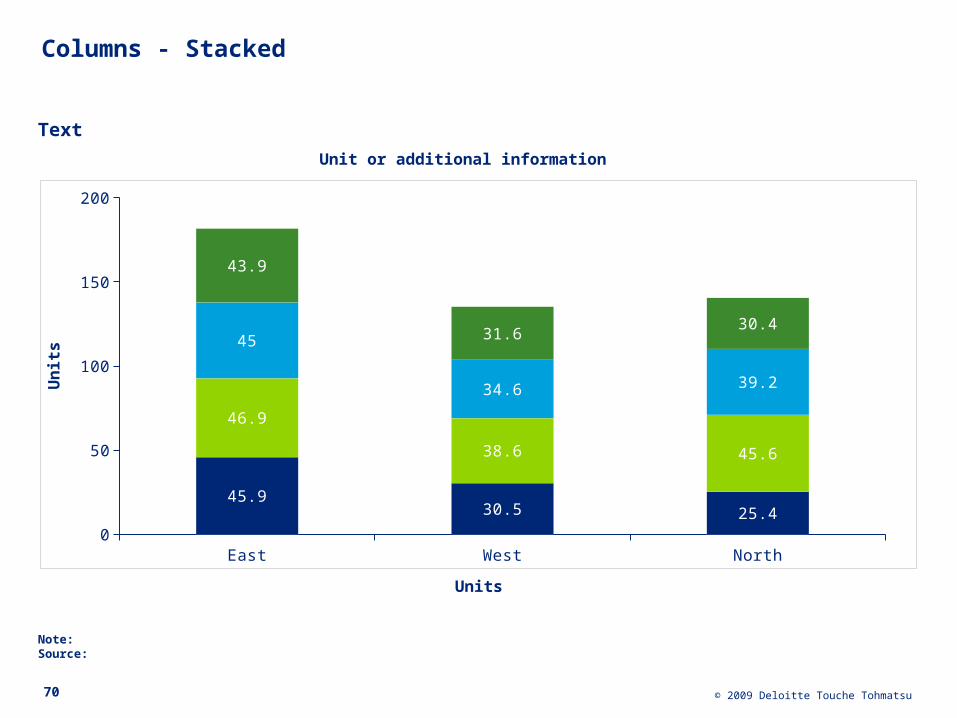
Columns - Stacked
East West North0
50
100
150
200
45.930.5 25.4
46.9
38.6 45.6
45
34.6 39.2
43.9
31.630.4
Unit or additional information
Units
Note:Source:
Un
its
Text
© 2009 Deloitte Touche Tohmatsu71
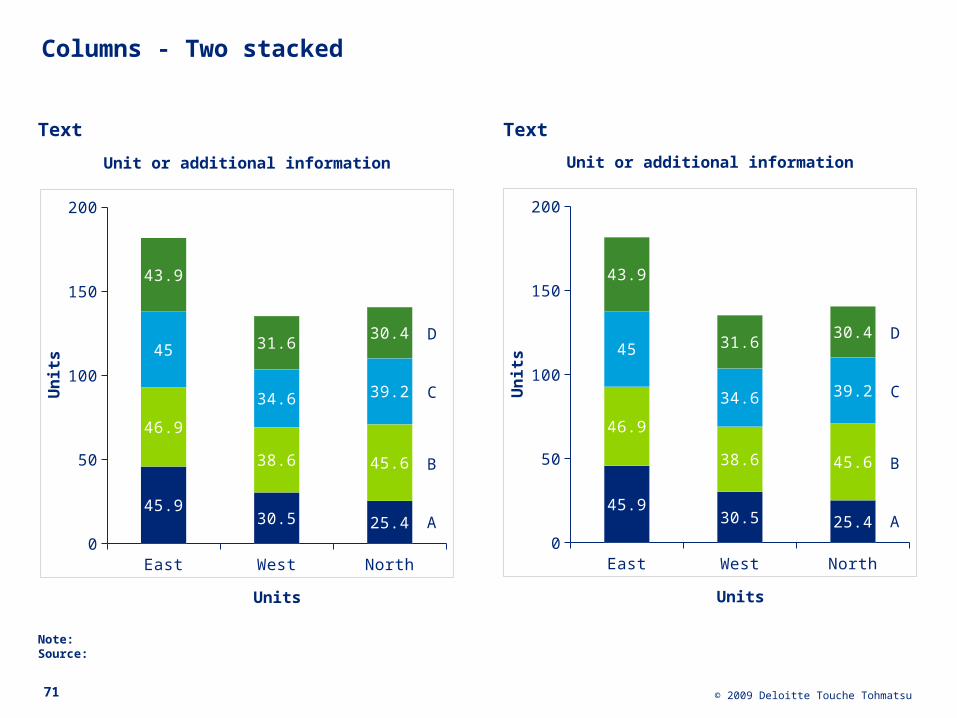
Columns - Two stacked
East West North0
50
100
150
200
45.930.5 25.4
46.9
38.6 45.6
45
34.6 39.2
43.9
31.630.4
Units
Note:Source:
Un
its
D
C
B
A
Unit or additional information
East West North0
50
100
150
200
45.930.5 25.4
46.9
38.6 45.6
45
34.6 39.2
43.9
31.630.4
Units
Un
its
D
C
B
A
Unit or additional information
Text Text

© 2009 Deloitte Touche Tohmatsu72
Columns - Four on a page
East West North05
101520253035404550
45.9
30.5 25.4
Units
Note:Source:
Un
its
Unit or additional information
East West North05
101520253035404550
45.9
30.5 25.4
Un
its
Unit or additional information
East West North05
101520253035404550
45.9
30.5 25.4
Un
its
East West North05
101520253035404550
45.9
30.5 25.4U
nit
s
Text Text

© 2009 Deloitte Touche Tohmatsu73
Columns - Paired
Units
Unit or additional information
Note:Source:
East West North0
20
40
60
41.1
34.3 32.2
40.3
33.630.4
A
B
Un
its
Text

© 2009 Deloitte Touche Tohmatsu74
Columns - Four paired
Units
Unit or additional information
Note:Source:
East West North0
20
40
6055
3432
52
3430
A
B
Un
its
Units
Unit or additional information
East West North0
20
40
6055
3432
52
3430
A
B
Un
its
Units
Unit or additional information
East West North0
20
40
6055
3432
52
3430
A
B
Un
its
Units
Unit or additional information
East West North0
20
40
6055
3432
52
3430
A
B
Un
its
Text Text Text Text

© 2009 Deloitte Touche Tohmatsu75
Columns - Multiple
Note:Source:
0.0
10.0
20.0
30.0
40.0
10.08.0
6.010.0
8.06.0
10.08.0
6.010.0
8.06.0
10.08.0
6.0
10.0
8.0
6.0
10.0
8.0
6.0
10.0
8.0
6.0
10.0
8.0
6.0
10.0
8.0
6.0
10.0
8.0
6.0
10.0
8.0
6.0
10.0
8.0
6.0
10.0
8.0
6.0
10.0
8.0
6.0
10.0
8.0
6.0
10.0
8.0
6.0
10.0
8.0
6.0
10.0
8.0
6.0
10.0
8.0
6.0
D
C
B
A
Unit or additional information
Un
its
Category Name Category Name Category Name Category Name Category Name
Text

© 2009 Deloitte Touche Tohmatsu76
Areas - Stacked
2002 2003 2004 20050
50
100
150
200
Unit or additional information
Units
Note:Source:
Un
its
A
B
C
D
Text

© 2009 Deloitte Touche Tohmatsu77
Areas - 100% ('Parfait Chart')
2002 2003 2004 20050%
10%
20%
30%
40%
50%
60%
70%
80%
90%
100%
Unit or additional information
Units
Note:Source:
Un
its
Company A
Company B
Company C
Company DCAGR: .%
CAGR: .%
CAGR: .%
CAGR: .%
Text
© 2009 Deloitte Touche Tohmatsu78
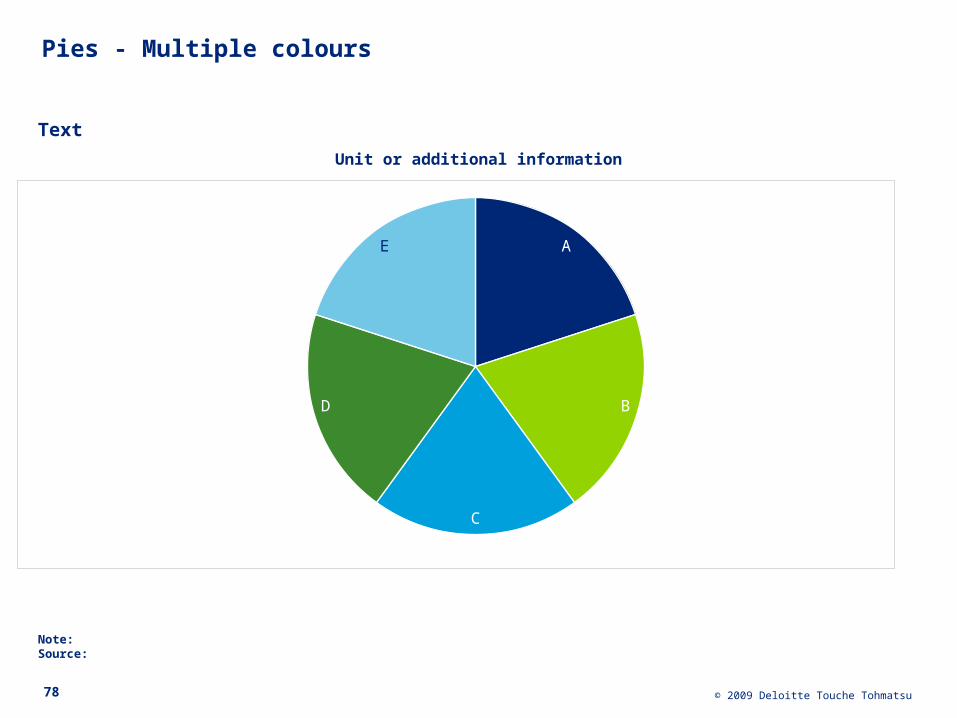
Pies - Multiple colours
Unit or additional information
Note:Source:
A
B
C
D
E
Text

© 2009 Deloitte Touche Tohmatsu79
Pies - Single colour
Unit or additional information
Note:Source:
East
West
North
SouthUp
Down
Left
Right
Text

© 2009 Deloitte Touche Tohmatsu80
Pies - Labels on inside
Unit or additional information
Note:Source:
A
B
C
D
E
Unit or additional information
A
B
C
D
E
Text Text

© 2009 Deloitte Touche Tohmatsu81
Pies - Slice exploded
Unit or additional information
Note:Source:
Client A13%
Client B17%
Client C57%
Client D13%
Client A13%
Client B17%
Client C57%
Client D13%
Text

© 2009 Deloitte Touche Tohmatsu82
Pies - Explosion
Unit or additional information
Note:Source:
West25%
North25%
South25%
East25%
West0
50
100
150
200
45.9
46.9
45
43.9
Text
Text
Text
Text
Text
© 2009 Deloitte Touche Tohmatsu83
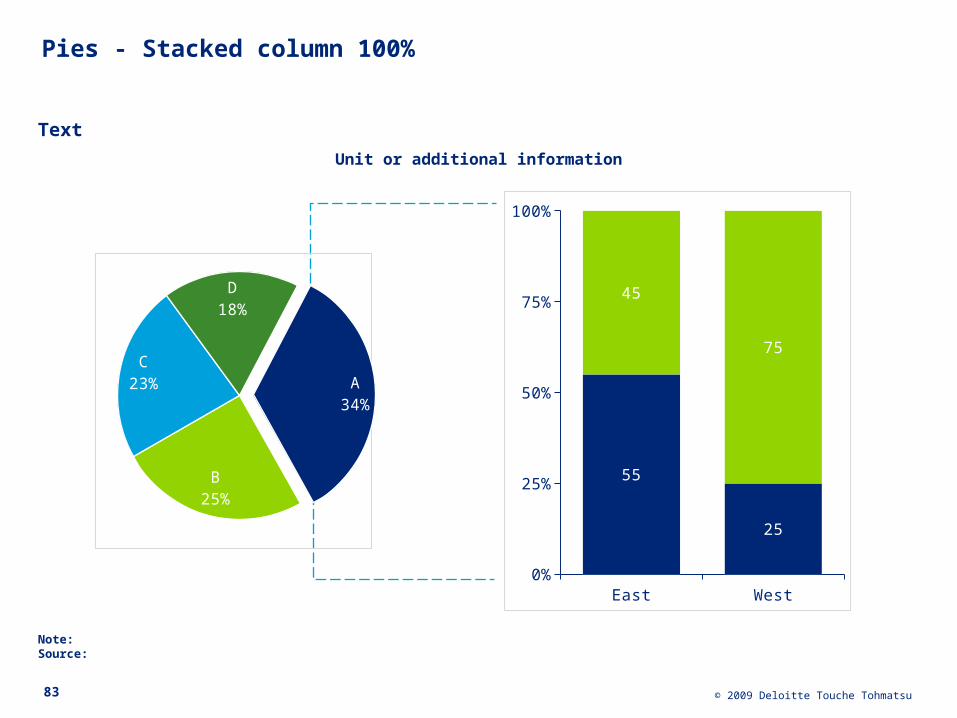
Pies - Stacked column 100%
Unit or additional information
Note:Source:
A34%
B25%
C23%
D18%
East West0%
25%
50%
75%
100%
55
25
45
75
Text

© 2009 Deloitte Touche Tohmatsu84
Pies - Labels on outside
Unit or additional information
Note:Source:
55%26%
19%
xxx
xxx
xxx
15
31
22xxx
xxx
xxx
Text

© 2009 Deloitte Touche Tohmatsu85
Radars
Note:Source:
Criterium 1
Criterium 2
Criterium 3Criterium 4
Criterium 5
0
1
2
3
4
5
Deloitte blueDeloitte greenMid blueDark Green
Unit or additional information
Text

© 2009 Deloitte Touche Tohmatsu86
Lines
Note:Source:
0 1 2 3 4 5 60
25
50
75
100
Unit or additional information
Un
its
Units
Deloitte blue
Deloitte green
Mid Blue
Text

© 2009 Deloitte Touche Tohmatsu87
Lines - Two
Note:Source:
0 1 2 3 4 5 60
25
50
75
100
Unit or additional information
Un
its
Units0 1 2 3 4 5 6
0
25
50
75
100
Unit or additional information
Un
its
Units
Deloitte blue
Deloitte green
Mid Blue
Deloitte blue
Deloitte green
Mid Blue
Text Text

© 2009 Deloitte Touche Tohmatsu88
Smooth Lines
Note:Source:
0 1 2 3 4 5 60
25
50
75
100
Unit or additional information
Un
its
Units
Deloitte blue line
Dotted line
Mid blue line
Text

© 2009 Deloitte Touche Tohmatsu89
Smooth Lines - Two
Note:Source:
0 1 2 3 4 5 60
25
50
75
100
Unit or additional information
Un
its
Units
Deloitte blue line
Dotted line
Mid blue line
0 1 2 3 4 5 60
25
50
75
100
Unit or additional information
Un
its
Units
Deloitte blue line
Dotted line
Mid blue line
Text Text

© 2009 Deloitte Touche Tohmatsu90
Waterfalls - Columns
A + B + C = Subtotal - E - F - G = Total0
10
20
30
40
10
15
10 35 5
10
5
15
Unit or additional information
Note:Source:
Un
its
Categories
Text

© 2009 Deloitte Touche Tohmatsu91
Waterfalls - Columns without gap
A B C D E F G H0
20
40
60
80
100
120
140
140
20
20
20
20
20
20
20
Unit or additional information
Categories
Note:Source:
Un
its
Text
© 2009 Deloitte Touche Tohmatsu92
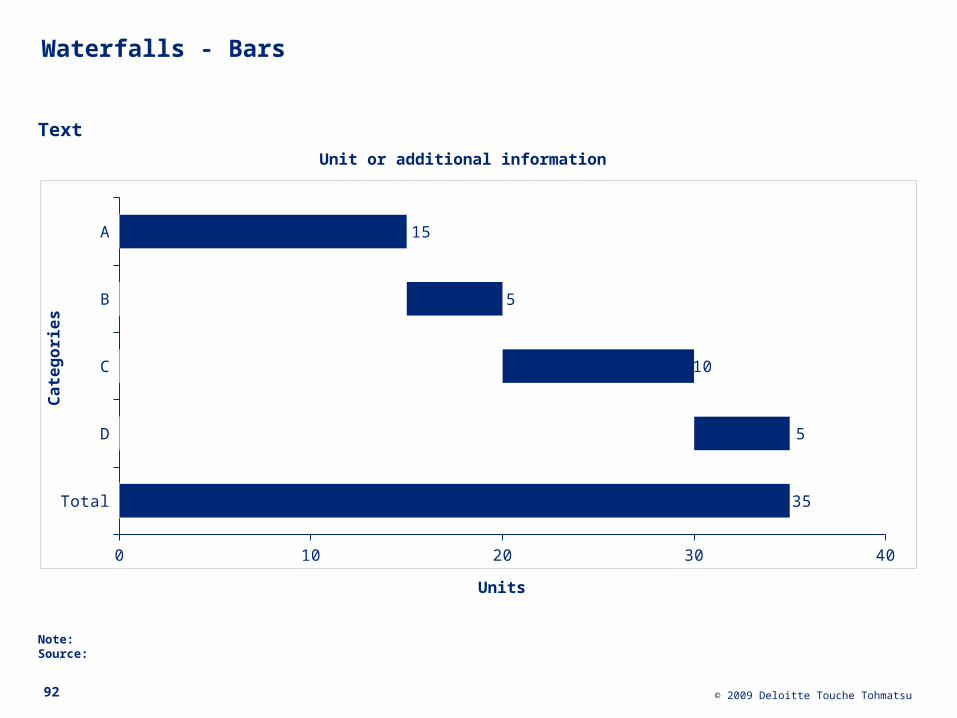
Waterfalls - Bars
Total
D
C
B
A
0 10 20 30 40
35
5
10
5
15
Unit or additional information
Units
Note:Source:
Ca
teg
ori
es
Text
© 2009 Deloitte Touche Tohmatsu93
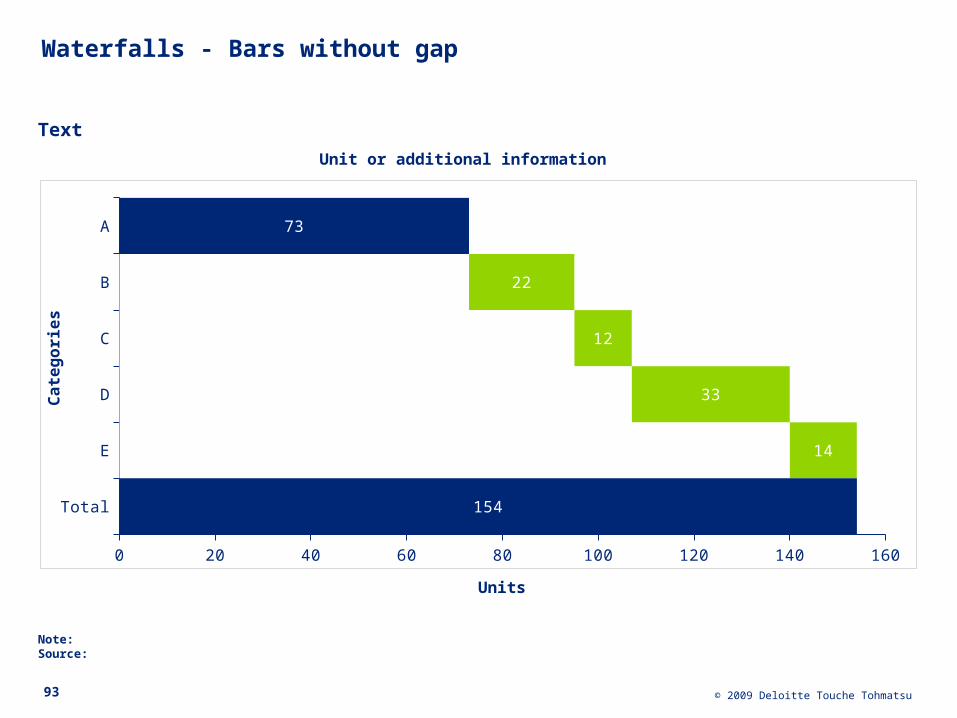
Waterfalls - Bars without gap
Total
E
D
C
B
A
0 20 40 60 80 100 120 140 160
154
73
14
33
12
22
Unit or additional information
Units
Note:Source:
Ca
teg
ori
es
Text

© 2009 Deloitte Touche Tohmatsu94
Other Graphs - High-low chart
Note:Source:
A B C D E F G H I J K L0
10
20
30
40
50
Unit or additional information
Un
its
Units
Text

© 2009 Deloitte Touche Tohmatsu95
Other Graphs - High-low-median chart
Note:Source:
A B C D E F G H I J K L0
10
20
30
40
50
Unit or additional information
Un
its
Units
Text

© 2009 Deloitte Touche Tohmatsu96
Other Graphs - Stock/elevator chart
Note:Source:
A B C D0
100
200
300
400
500
600
0
10
20
30
40
50
60
70
80
Unit or additional information
Un
its
Units
Text

© 2009 Deloitte Touche Tohmatsu97
Other Graphs - Elevator chart
Note:Source:
0 1 2 3 4 5 6 70
5
10
15
20
25
30
35
Unit or additional information
Un
its
Units
Text

© 2009 Deloitte Touche Tohmatsu98
Other Graphs - Scatter chart
Note:Source:
0 10 20 30 40 50 60 70 80 90 1000
20
40
60
80
100
120
xxxxxx
xxx
xxx
xxx
xxx
xxx
xxx
xxx
xxx
xxx
Unit or additional information
Un
its
Units
Text

© 2009 Deloitte Touche Tohmatsu99
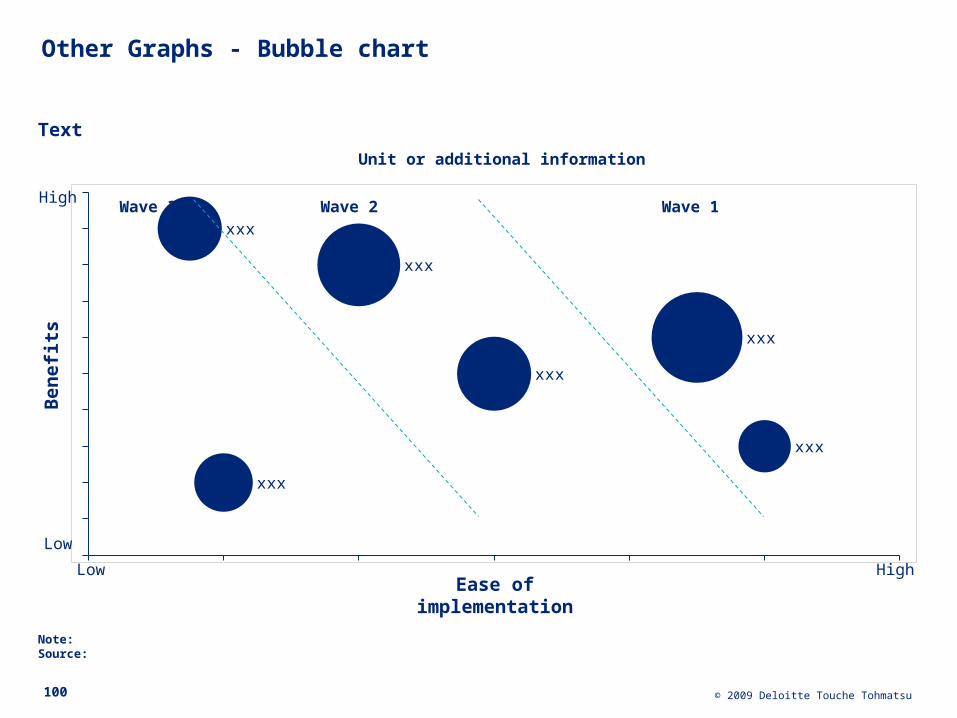
Other Graphs - Bubble chart
Note:Source:
0 2 4 6 8 10 120
20
40
60
80
100
120
xxxxxx
xxx
xxx
xxx
xxx
xxx
xxx
xxx
xxx
xxxxxx
Unit or additional information
Un
its
Units
Text
© 2009 Deloitte Touche Tohmatsu100
Other Graphs - Bubble chart
Note:Source:
xxx
xxx
xxx
xxx
xxx
xxx
Unit or additional information
Ben
efi
ts
Ease of implementation
Wave 1Wave 2Wave 3High
Low
Low High
Text

© 2009 Deloitte Touche Tohmatsu101
Other graphs - Driver tree chart / DuPont chart with bars
Unit or additional information
Text
Text
Text
Text
Text
Tip! You can use these marks on the driver tree charts.
X + - / f
Note:Source:
Text

© 2009 Deloitte Touche Tohmatsu102
Other graphs - CAGR tree
Key figure
Text
Text Text Text
Text
Text Text Text
Text
Text Text Text
Text
Text Text Text
Text
Text Text Text
Text
Text Text Text
Text
Text Text Text
Text
Text Text Text
Text
Text Text Text
Text
Text Text Text
Text
Text Text Text
DriverCAGR0x0y
Value0y
CAGR0y0z
Unit or additional information
Note:Source:
Text
© 2009 Deloitte Touche Tohmatsu103
Agenda
Structured Text
Trees
Graphs
Shapes
Maps
Special Graphics
Conceptual Charts

© 2009 Deloitte Touche Tohmatsu104
Chevrons
Text
Text Text
Text Text Text
Text Text Text Text
Text Text Text Text Text
Text Text Text Text Text Text
Text Text Text Text Text Text Text
© 2009 Deloitte Touche Tohmatsu105
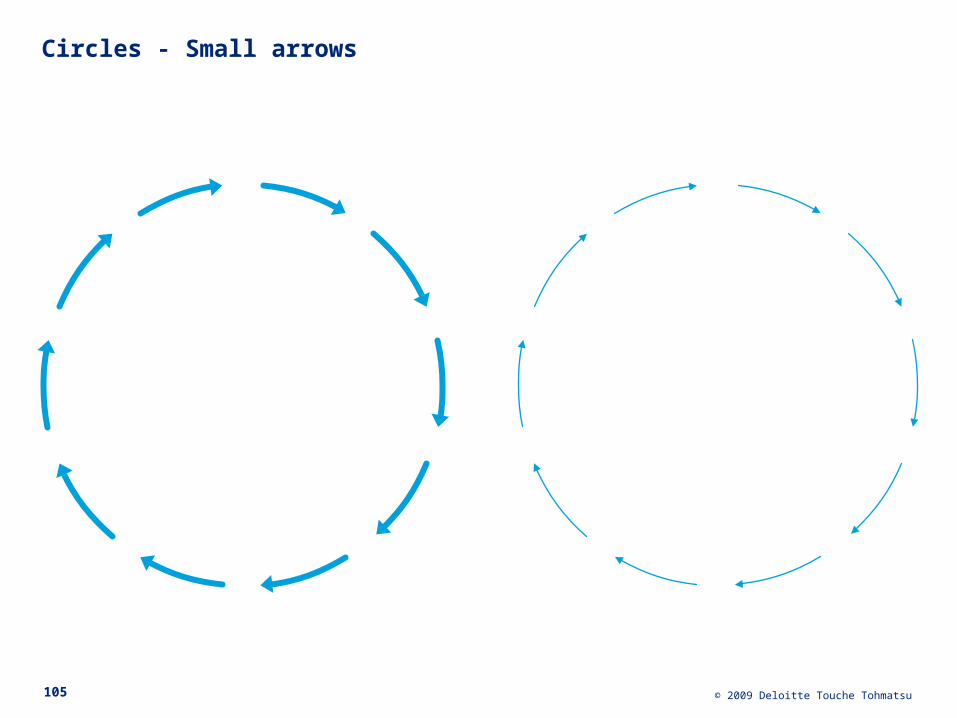
Circles - Small arrows

© 2009 Deloitte Touche Tohmatsu106
Circles - Arrows
Tip! Hold the Shift key when enlarging a circle to keep it circular
Text TextText
Text
Text
Text
TextTextText
Text
Text
Text
TextText
Text
Text
Text
Text
Text
TextText
Text
Text

© 2009 Deloitte Touche Tohmatsu107
Circles - Chevrons
Text
Text
Text
Text
Text
Text
TextText
Text
Text
Text
Text
Text
Text
Text

© 2009 Deloitte Touche Tohmatsu108
Circles - Process ending in a closed loop
Text
Text
Text
Text
Text
Text
Text

© 2009 Deloitte Touche Tohmatsu109
Spheres - Interrelated
Tip! Hold the Shift key when enlarging the spheres to keep them circular
Text Text
Text

© 2009 Deloitte Touche Tohmatsu110
Spheres - Overlapping
Text Text
Text
Text Text
Text
Text Text
Text

© 2009 Deloitte Touche Tohmatsu111
Spheres - Blades
Text
Text
Text
Text
Text

© 2009 Deloitte Touche Tohmatsu112
Spheres - Sizes in
Text
Text
Text
Text
Text
Text
Text

© 2009 Deloitte Touche Tohmatsu113
Spheres - Spotlight and rollers
Text
Text Text
Text
Text
Text
Text
Text Text

© 2009 Deloitte Touche Tohmatsu114
Spheres - Closed loop
Text
Text
Text
Text
Text
Text

© 2009 Deloitte Touche Tohmatsu115
Spheres - 2 around
Text
Text
Text

© 2009 Deloitte Touche Tohmatsu116
Spheres - Visor
Text

© 2009 Deloitte Touche Tohmatsu117
Spheres - Pieces
Text
Text Text
Text
Text
Text
TextText
Text
Text
Text
Text

© 2009 Deloitte Touche Tohmatsu118
Spheres - Ying and yang
Text
Text
Text

© 2009 Deloitte Touche Tohmatsu119
Spheres - Circles of influence (colors)
Text

© 2009 Deloitte Touche Tohmatsu120
Spheres - Circles of influence (white)
Text

© 2009 Deloitte Touche Tohmatsu121
Spheres - Eggs
Text
Text
Text
Text
Text
Text
Text
Text

© 2009 Deloitte Touche Tohmatsu122
Boxes - Matrices
Title:
Text
Title:
Text
Title:
Text
Title:
Text
Ver
tica
l axi
s
High
Small Horizontal axis
Low
Large
Title:
Text
Title:
Text
Title:
Text
Title:
Text
Title:
Text
Title:
Text
Title:
Text
Title:
Text
Title:
Text
Ver
tica
l axi
s
High
Small Horizontal axis
Low
Large
Tip! Group before changing the size of the matrix

© 2009 Deloitte Touche Tohmatsu123
Boxes - Honeycomb
Text
Text
Text
Text
Text
Text
Text
Text

© 2009 Deloitte Touche Tohmatsu124
Triangles - Basical
Text
Text
Text Text
Text Text
Text

© 2009 Deloitte Touche Tohmatsu125
Triangles - Pyramids
Tip! Use Flip Horizontal in the Format ribbon to create an inverted pyramid
Text
Text
Text
Text
Text
Text
Text
Text
Text
TextTextTextTextTextTextTextTextTextTextTextTextText

© 2009 Deloitte Touche Tohmatsu126
Triangles - More pyramids
Level 1
Level 2
Level 3
Level 4
Level 1
Level 2
Level 3
A
B
C

© 2009 Deloitte Touche Tohmatsu127
Puzzles - Square
Tip! Hold the Shift key when enlarging the pieces if you want them to remain square

© 2009 Deloitte Touche Tohmatsu128
Puzzles - Rectangular

© 2009 Deloitte Touche Tohmatsu129
Puzzles - Five pieces
Text

© 2009 Deloitte Touche Tohmatsu130
Puzzles - Pieces not fitting together

© 2009 Deloitte Touche Tohmatsu131
Others - Trackers
Tip! Place in top right corner of slide when your chapter is very long

© 2009 Deloitte Touche Tohmatsu132
Agenda
Structured Text
Trees
Graphs
Shapes
Maps
Special Graphics
Conceptual Charts

© 2009 Deloitte Touche Tohmatsu133
Maps - The World
Tip! Ungroup and apply colors to highlight countriesText

© 2009 Deloitte Touche Tohmatsu134
Maps - United States
Text

© 2009 Deloitte Touche Tohmatsu135
Maps - Europe, Asia, and North Africa
Text
© 2009 Deloitte Touche Tohmatsu136
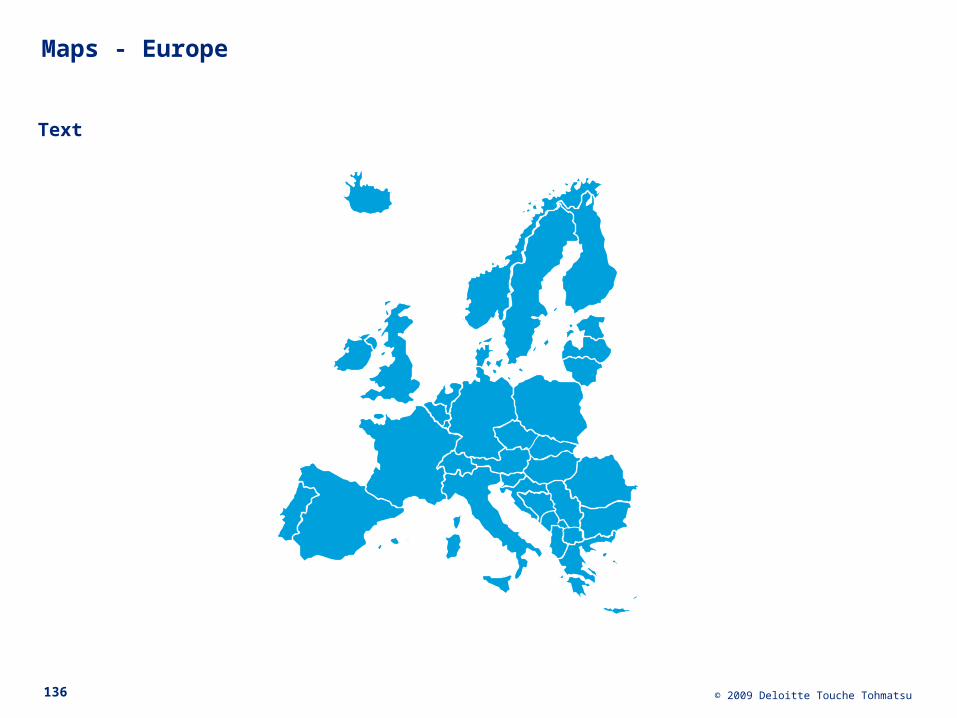
Maps - Europe
Text
© 2009 Deloitte Touche Tohmatsu137
Maps - Netherlands
Text

© 2009 Deloitte Touche Tohmatsu138
Maps - Benelux
Text

© 2009 Deloitte Touche Tohmatsu139
Maps - UK
Text

© 2009 Deloitte Touche Tohmatsu140
Maps - Italy
Text

© 2009 Deloitte Touche Tohmatsu141
Maps - France
Text

© 2009 Deloitte Touche Tohmatsu142
Maps - Australia
Text

© 2009 Deloitte Touche Tohmatsu143
Maps - Germany & Spain
Germany Spain

© 2009 Deloitte Touche Tohmatsu144
Maps - Switzerland & Austria
Switzerland Austria
© 2009 Deloitte Touche Tohmatsu145
Maps - Sweden & Finland
Sweden Finland
© 2009 Deloitte Touche Tohmatsu146
Maps - Hungary & Poland
Hungary Poland

© 2009 Deloitte Touche Tohmatsu147
Maps - Russia
Text

© 2009 Deloitte Touche Tohmatsu148
Maps - Tunisia & Greece
Tunesia Greece

© 2009 Deloitte Touche Tohmatsu149
Maps - India & China
India China

© 2009 Deloitte Touche Tohmatsu150
Flags
Australia
Canada
China
Denmark
France
Germany
Ireland
Italy
Japan
Luxembourg
Mexico
Netherlands
Singapore
Spain
South Africa
United Kingdom
United States

© 2009 Deloitte Touche Tohmatsu151
Agenda
Structured Text
Trees
Graphs
Shapes
Maps
Special Graphics
Conceptual Charts

© 2009 Deloitte Touche Tohmatsu152
Creativity
Generic strategy development framework - English
2. ConductAnalysis
1. EvaluateSituation
BusinessDefinition
BusinessConstraints
BusinessImperatives
External Analysis
Internal Analysis
Key Insights
FutureIndustry
Scenarios
Future Industry
Scenarios
3. FormulateStrategy
4. PlanImplementation
Action Plan
Financial Plan
Plans
Strategic Options
Risk and Reward
Strategic Direction
Desk Research and Interviews
Interviews and Workshops
Workshops and Analyses
Business Plan Writing
Text

© 2009 Deloitte Touche Tohmatsu153
Restructuring framework
Restructuring Concept
Cost and Asset
Reduction
Portfolio Adjust-ment
Opportunities
Restructuring Plan
Project managementStakeholder Communication
FinancialReview
StrategicReview
Change Imperative
Situation Assessment
Financial Needs
Bench-marking
Targets
TargetSetting
Implemen-tation
Detailed Planning
Performance
Mgmt
Actions
Phase I Phase II Phase III Phase IV
Text

© 2009 Deloitte Touche Tohmatsu154
Competitive strategy 3.0 framework
ProjectManagement
3. FormulateStrategy
4. PlanTransformation
1. EvaluateSituation
2. ConductAnalysis
Document Strategic Direction and Objectives
Conduct PreliminarySituation Assessment
Develop and TestStrategic Hypotheses
Analyze Marketand Industry
Conduct Value, Profiling and Benchmarking
Conduct CustomerAnalysis
Analyze Competitionand Positioning
Build StrategicSynthesis
Evaluate Strategic Options
Develop StrategicRecommendations
Develop PreliminaryAction Plan
Analyze Internal Operations
StrategicObjectives
StrategicAnalysis
SolutionDevelopment
Conduct Financial Modelling
FinancialAnalysis
Manage Project and Communications
Conduct Value, Profiling and Benchmarking Develop Financial Plan
Text

© 2009 Deloitte Touche Tohmatsu155
Strategy development - The fish
Text
ChosenStrategy
Projects &Resources
MonitoringFinancial Position
Strategic Position
Capital Market
Economic Profitability
Growth
Commercial Market
MarketAttractiveness
Competitive Position
InsightCSFs & KPIs
Strategic Issues
Scope & Context
Creativity
Scenarios& Options

© 2009 Deloitte Touche Tohmatsu156
Strategy development - The loop
CAPITAL MARKET MANAGED PERFORMANCE
COMMERCIAL MARKET STRUCTURE & RESOURCES
Strategic Position
Competitive PositionMarket Attractiveness
Scope & Context
Strategic IssuesInsight
Value Creation
Financial Position
GrowthEconomic Profitability
Critical Success Factors & Key Performance Indicators
Performance Monitoring & Incentive Compensation
Organizational Architecture
Projects & ResourcesChosen Strategy
Scenarios & Options
Creativity
Text
© 2009 Deloitte Touche Tohmatsu157
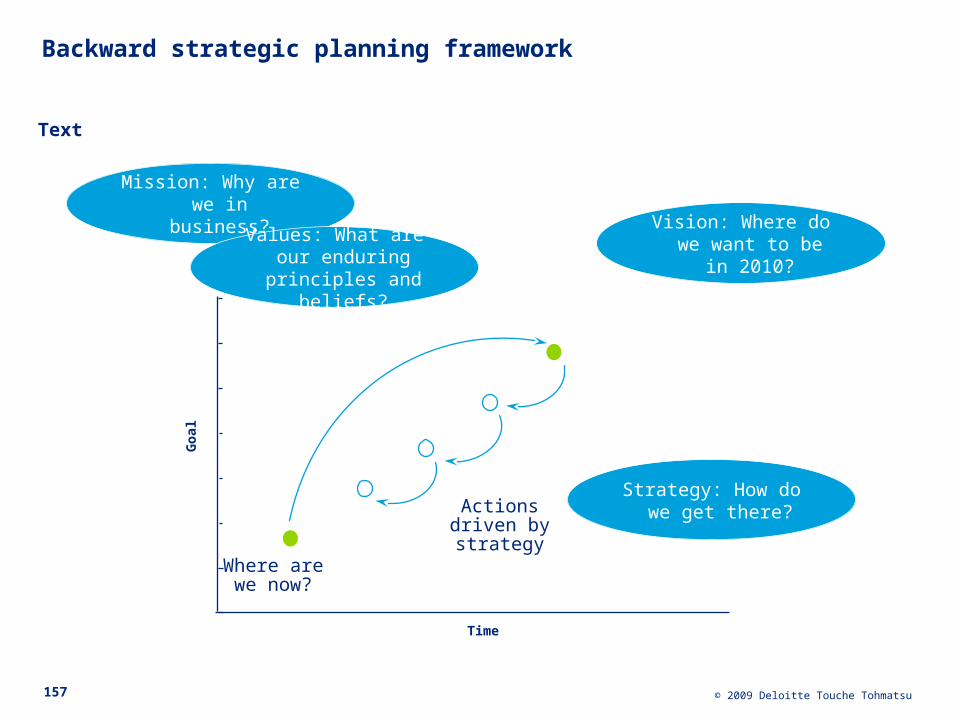
Backward strategic planning framework
Time
Go
al
Actions driven by strategy
Where are we now?
Mission: Why are we in business?
Values: What are our enduring principles
and beliefs?
Vision: Where do we want to be in 2010?
Strategy: How do we get there?
Text

© 2009 Deloitte Touche Tohmatsu158
Incremental versus Dynamic strategic planning framework
Versus
Incrementalism[One reason why companies stagnate]
Time
Go
al
Where weare now?
Actions taken in response to circumstances
Where can we be next year?
Focus[One reason why companies grow]
Time
Go
al
Actions driven by strategy
Where are we now?
Vision of where we need to be five years from now
Incremental Planning Process Dynamic Strategic Planning Process

© 2009 Deloitte Touche Tohmatsu159
Pentagon
Text
3
Restructuring framework
1
2
4
5

© 2009 Deloitte Touche Tohmatsu160
Strategic disciplines
Text
Text Text
Text
……

© 2009 Deloitte Touche Tohmatsu161
7S
Strategy Systems
StyleSkills
Shared
values
Staff
Structure
Text

© 2009 Deloitte Touche Tohmatsu162
3Cs triangle
Customer
Clients
Distributors
Competitors
Suppliers
Text

© 2009 Deloitte Touche Tohmatsu163
Value creation
Growthroughculturalinitiative
Redeployassets
Improve corebusiness
performance
Grow throughacquisition
and/or merger
Adopt soundfinancingapproach
Maximizeshareholder
value
Text

© 2009 Deloitte Touche Tohmatsu164
Portfolio matrix
Competitive Position(Returns compared to Industry Average)
Low High
Mar
ket
Att
ract
ive
nes
s(I
nd
ust
ry A
vera
ge
Ret
urn
s ab
ove
Co
st o
f C
ap
ital
)
ROCE > CoC
ROCE < CoC
ROCE = CoC
High
Low
Text

© 2009 Deloitte Touche Tohmatsu165
Business portfolio 3x3
Co
mp
etit
ive
po
siti
on
Low
Med
ium
Hig
h
Product/market attractiveness
Low Medium High
Text

© 2009 Deloitte Touche Tohmatsu166
Business portfolio 3x3
Text
Ben
efi
t
Price
Competitivedisadvantage
Competitiveadvantage

© 2009 Deloitte Touche Tohmatsu167
Five forces
CompetitorsCustomersSuppliers
Substitutes
New Entrants
Strong
Moderate
Weak
Text

© 2009 Deloitte Touche Tohmatsu168
Activity map - Generic
Text
Text
Text
Text
Text
Text
Text
Advantaged
Neutral
Disadvantaged
Text
Text
Text
Text
Text
Text
Text
Text
Text
Text
Text
Text
Text
Text
Text
Text
Text
Text
Text
Text
Text
Text
Text
Text
Text
Text
Text
Text
Text
Text
Text
Text
Text
Text
Text
Text
Text
Text
Text
Text
Text
Text
Text

© 2009 Deloitte Touche Tohmatsu169
Thermal & energy
technology
Activity map - Very detailed
Geographic markets
Distribution channel
Customer
End use
Industry
System design /Application engineering
Installation
Service
Middle East & Africa
New business strengths
Installed base
strengths
Customised Standard
Sub-systems
Food packaging
Canning Bottling
System Sales force OEM Direct Independent
Agent
MNC Regional National
N.America L.America W.Europe E.Europe Asia Japan Australasia
Liquid Hybrid Dry Processed
Pumps Valves Homogenisers Tubular heatexchangers
Food Processing
Evaporators
Tanks
Other
Ohmic heaters
Freezers & Refrigerators
Plate heatexchangers
Separators Air treatment
AutomationWrapping
Dryers Cartoning
Systems
Subcontractor management
3rd party maintenance
Upgrades/ modifications
Contract Time/material
Own maintenance
Conveyer systems
Aseptic processing systems
Blow moulding
equipment
Filtration equipment
Control systems
Sealing
Labelling Global
Standard
Dairy Brewing Soft drinks Juices Cheese Ice Cream Baked Snacks/ Confectionery
CerealsSoups/sauces Baby Food Oil/fats/margarines
Project management
Filling lines
Canning Bottling Pumps Valves Homogenisers Tubular heatexchangers
Evaporators
Tanks Ohmic heaters
Plate heatexchangers
Separators
Wrapping
Dryers Cartoning
Sealing
Labelling
Filling lines
Convenience food
Customer DIY
Spareparts
Freezers & Refrigerators
AutomationConveyer systems
Aseptic processing systems
Blow moulding
equipment
Filtration equipment
Control systems
Strong position
Average
Weak position
No position

© 2009 Deloitte Touche Tohmatsu170
Activity map - Competitor overview
Text
Advantaged Neutral
Text
Text
Text
Text
Text
Text
Text TextText TextText Text
Text
Disadvantaged
Text

© 2009 Deloitte Touche Tohmatsu171
Activity map - Synergy analysis
Text Text Text
Advantaged
Disadvantaged
Text
Text
Text
Text
Text
Text
Text
Text
Text
Text
Text Text
TextText
Text Text
Text Text
Text
Text Text Text Text
Text Text Text
Text Text TextText Text Text
NM
A
Average
Text Text
B
Text
Text

© 2009 Deloitte Touche Tohmatsu172
Activity map - Synergy summary
A B New Co
+ =
Advantaged
Disadvantaged
NM
AverageText
Text
Text
Text
Text
Text
Text
Text
Text
Text

© 2009 Deloitte Touche Tohmatsu173
Activity map - Competitive groups
Competitive advantage
• Text• Text
Competitive advantage
• Text• Text
Activity
Competitive Group(sample companies)
• Text• Text
ActivityActivityActivity
ActivityActivity
Competitive Group(sample companies)
• Text• Text
ActivityActivityActivity
Activity
Activity
Competitive Group(sample companies)
ActivityActivityActivity
ActivityActivity
Competitive Group(sample companies)
ActivityActivityActivity
Activity
Text

© 2009 Deloitte Touche Tohmatsu174
Activity map - Ranges of activities across value chain
Text Text Text Text
Text Text Text
Text Text Text Text
Text Text Text Text Text
Text Text
Stage ..
Text Text Text
TextStage ..
Stage ..
Stage ..
Stage ..
Stage ..
Text Text
Text

© 2009 Deloitte Touche Tohmatsu175
Swimlanes
Department Activity Activity Activity Activity Activity Activity
Department Activity Activity Activity Activity Activity Activity
Department
Department
Department
Activity Activity Activity Activity Activity Activity
Activity Activity Activity Activity Activity Activity
Activity Activity Activity Activity Activity Activity
Text

© 2009 Deloitte Touche Tohmatsu176
Process flow
Process
Process
Process
Process
Process
Process
Text
Text
Text
Text
Text
Text
Text
Text
Text
Text
Text
Text
Text
Text
Text
Text
Text
Text
Text
Text
Text
Text
Text
Text
Text
Text
Text
Text
Text
Text
Text
Text
Text
Text
Text
Text
Text

© 2009 Deloitte Touche Tohmatsu177
Process map
Participant
Participant
Participant
Participant
Participant
Participant
Activity
Activity
Activity
Activity
Start
Activity
Activity
Activity
Activity Decision
End
Participant activity

© 2009 Deloitte Touche Tohmatsu178
Agenda
Structured Text
Trees
Graphs
Shapes
Maps
Special Graphics
Conceptual Charts

© 2009 Deloitte Touche Tohmatsu179
Subhead Subhead Subhead Subhead Subhead Subhead
Row description
Row description
Row description
Row description
Row description
Table with moonsTip! This is a table. Add or remove rows and columns as appropriate. Use Distribute Columns Evenly and Distribute Rows Evenly in Layout ribbon to
keep equal column and row widths
strong weak
Text

© 2009 Deloitte Touche Tohmatsu180
More moons (a.k.a. Harvey Balls)
¾
½
¼
0
1
¾
½
¼
0
1

© 2009 Deloitte Touche Tohmatsu181
Table with traffic lights
Negative
Neutral
Positive
Subhead Subhead Subhead Subhead Subhead Subhead
Row description
Row description
Row description
Row description
Row description
Text

© 2009 Deloitte Touche Tohmatsu182
Table with arrows
Positive Neutral Negative
Subhead Subhead Subhead Subhead Subhead Subhead
Row description
Row description
Row description
Row description
Row description
Text

© 2009 Deloitte Touche Tohmatsu183
Heat map
Tip! Copy and paste cells to change cell colours
Positive Neutral Negative
Subhead Subhead Subhead Subhead Subhead Subhead Subhead Subhead
Row description
Row description
Row description
Row description
Row description
Row description
Row description
Row description
Text

© 2009 Deloitte Touche Tohmatsu184
Levels of maturity
Text
Stage 1
Stage 2
Stage 3
Stage 4

© 2009 Deloitte Touche Tohmatsu
• Bullet
‒ Dash
• Subbullet
Steps
185
• Bullet
‒ Dash
• Subbullet
• Bullet
‒ Dash
• SubbulletStep 1
Step 2
Step 3
Text

© 2009 Deloitte Touche Tohmatsu
Steps
186
• Bullet
‒ Dash
• Subbullet
• Bullet
‒ Dash
• Subbullet
• Bullet
‒ Dash
• Subbullet
• Bullet
‒ Dash
• Subbullet
Step 1
Step 2
Step 3
Step 4
Text

© 2009 Deloitte Touche Tohmatsu
Steps
187
• Bullet
‒ Dash
• Subbullet
• Bullet
‒ Dash
• Subbullet
• Bullet
‒ Dash
• Subbullet
• Bullet
‒ Dash
• Subbullet
• Bullet
‒ Dash
• Subbullet
Step 1
Step 2
Step 3
Step 4
Step 5
Text

© 2009 Deloitte Touche Tohmatsu
Steps
188
• Bullet
‒ Dash
• Bullet
‒ Dash
• Bullet
‒ Dash
• Bullet
‒ Dash
• Bullet
‒ Dash
• Bullet
‒ DashStep 1
Step 2
Step 3
Step 4
Step 5
Step 6
Text

© 2009 Deloitte Touche Tohmatsu
Steps
189
• Bullet
‒ Dash
• Bullet
‒ Dash
• Bullet
‒ Dash
• Bullet
‒ Dash
• Bullet
‒ Dash
• Bullet
‒ DashStep 1
Step 2
Step 3
Step 4
Step 5
Step 6
Step 7
• Bullet
‒ Dash
Text

© 2009 Deloitte Touche Tohmatsu190
Steps - With more flights

© 2009 Deloitte Touche Tohmatsu
• Bullet
‒ Dash
• Subbullet
Diagonal boxes
191
• Bullet
‒ Dash
• Subbullet
• Bullet
‒ Dash
• Subbullet
Text
Text
Text
Text Text Text
Text

© 2009 Deloitte Touche Tohmatsu
Steps
192
• Bullet
‒ Dash
• Bullet
‒ Dash
• Bullet
‒ Dash
• Bullet
‒ DashStep 1Text
Text
Text
Text
Text Text Text Text
Text

© 2009 Deloitte Touche Tohmatsu
Steps
193
• Bullet
‒ Dash
• Bullet
‒ Dash
• Bullet
‒ Dash
• Bullet
‒ DashText
Text
Text
Text
Text
Text Text Text Text Text
• Bullet
‒ Dash
Text

© 2009 Deloitte Touche Tohmatsu
Steps
194
• Bullet
‒ Dash
• Bullet
‒ Dash
• Bullet
‒ Dash
• Bullet
‒ Dash
• Bullet
‒ Dash
Text
Text Text Text Text Text Text
Text
Text
Text
Text
Text
• Bullet
‒ Dash
Text

© 2009 Deloitte Touche Tohmatsu
Linear texts
195
• Bullet
‒ Dash
• Subbullet
• Bullet
‒ Dash
• Subbullet
• Bullet
‒ Dash
• Subbullet
• Bullet
‒ Dash
Text

© 2009 Deloitte Touche Tohmatsu
Expansion
196
• Bullet
‒ Dash
• Subbullet
• Bullet
‒ Dash
• Subbullet
• Bullet
‒ Dash
• Subbullet
Text

© 2009 Deloitte Touche Tohmatsu
Diversion
197
• Bullet
‒ Dash
• Subbullet
Text
© 2009 Deloitte Touche Tohmatsu198
Continuous
Text
Text Text
Text Text Text
TextText
Text

© 2009 Deloitte Touche Tohmatsu199
Cutout
Text
Text Text
Text
Text

© 2009 Deloitte Touche Tohmatsu200
Linear
Text
Text
Text Text
Text
Text
Text

© 2009 Deloitte Touche Tohmatsu201
Linear
Text Text Text Text
TextText
Text
Text

© 2009 Deloitte Touche Tohmatsu202
Radiating outward
High
Low
LowHigh
Text

© 2009 Deloitte Touche Tohmatsu203
Expansion
• Bullet
‒ Dash
• Subbullet
• Bullet
‒ Dash
• Subbullet
• Bullet
‒ Dash
• Subbullet
• Bullet
‒ Dash
• Subbullet
Text
Text
Text
Text
Text

© 2009 Deloitte Touche Tohmatsu204
Step by step actions
Step 6Step 4Step 3Step 2Step 1
Text

© 2009 Deloitte Touche Tohmatsu205
Interrelated stages
Text
Text
Text
Text
Text

© 2009 Deloitte Touche Tohmatsu206
Diamond
Text
Text
Text Text
Text
Text
TextText
Text

© 2009 Deloitte Touche Tohmatsu207
Leverage
Text
Text
Text

© 2009 Deloitte Touche Tohmatsu208
Balance 1
CostsCosts
Paragraph (if not needed, delete)
• Bullet
‒ Dash
• Subbullet
Benefits
Paragraph (if not needed, delete)
• Bullet
‒ Dash
• Subbullet
Text

© 2009 Deloitte Touche Tohmatsu209
Jumping Point
TextText
Paragraph (if not needed, delete)
• Bullet
‒ Dash
• Subbullet
Text

© 2009 Deloitte Touche Tohmatsu210
Forces at work
• Bullet
‒ Dash
• Subbullet
• Bullet
‒ Dash
• Subbullet
• Bullet
‒ Dash
• Subbullet
• Bullet
‒ Dash
• Subbullet
• Bullet
‒ Dash
• Subbullet
Text

© 2009 Deloitte Touche Tohmatsu211
Forced
Text
Text
• Bullet
‒ Dash
• Subbullet
• Bullet
‒ Dash
• Subbullet
• Bullet
‒ Dash
• Subbullet
• Bullet
‒ Dash
• Subbullet

© 2009 Deloitte Touche Tohmatsu212
Surround
Text
Text

© 2009 Deloitte Touche Tohmatsu213
Flow down
Text
Text
Text
Text

© 2009 Deloitte Touche Tohmatsu214
History
x x x x x 2006
Text

© 2009 Deloitte Touche Tohmatsu215
Timelines
x x x x x x x x x x x
x x x x x x x x x x Label
x x x x x x x x x x x
January February March April May June July August September October November December
January February March April May June July August September October November December
Text

© 2009 Deloitte Touche Tohmatsu216
Gantt chart or Timeline chart
Week 2 3
Starts on 7/1 14/1
Phase 1
• Activity
• Activity
• Activity
Phase 2
• Activity
• Activity
Phase 3
• Activity
• Activity
• Activity
Phase 4
• Activity
Milestone Milestone Milestone Milestone
• This is a PowerPoint table
• Add or delete columns and rows where appropriate
• Use Distribute Columns Evenly and Distribute Rows Evenly in Layout ribbon to keep columns and rows equal in width

© 2009 Deloitte Touche Tohmatsu217
Calender
M T W T F
Week #
Week #
Week #
Week #
Week #
Tip! This is a table. Change cell colors as appropriate. Use Distribute Columns Evenly and Distribute Rows Evenly in Layout ribbon to keep equal column and row widths.
Enter events, like meeting dates, in the cellsText

© 2009 Deloitte Touche Tohmatsu218
M T W T F
1 2 3 4 5
8 9 10 11 12
15 16 17 18 19
22 23 24 25 26
29 30 31
Calendars - First day of the month is Monday, Tuesday, Wednesday or Thursday
Steering Committee Meeting Board Meeting
M T W T F
1 2 3 4
7 8 9 10 11
14 15 16 17 18
21 22 23 24 25
28 29 30 31
M T W T F
1 2 3
6 7 8 9 10
13 14 15 16 17
20 21 22 23 24
27 28 29 30 31
M T W T F
1 2
5 6 7 8 9
12 13 14 15 16
19 20 21 22 23
26 27 28 29 30
Working Group Meeting
Text Text

© 2009 Deloitte Touche Tohmatsu219
Calendars - First day of the month is Friday, Saturday or Sunday
M T W T F
1
4 5 6 7 8
11 12 13 14 15
18 19 20 21 22
25 26 27 28 29
M T W T F
3 4 5 6 7
10 11 12 13 14
17 18 19 20 21
24 25 26 27 28
31
M T W T F
2 3 4 5 6
9 10 11 12 13
16 17 18 19 20
23 24 25 26 27
30 31
Steering Committee BoardWorking Group
Text Text

© 2009 Deloitte Touche Tohmatsu220
Curves - Generic life cycle
Un
its
sold
Time since launch
Product A
Product B
Product C
Product D
Text

© 2009 Deloitte Touche Tohmatsu221
Curves - Country maturity
Emerging MatureDevelopment
Stage
Netherlands
Sweden
U.K.
France
ItalyGermany
Text

© 2009 Deloitte Touche Tohmatsu222
Curves - Bell curve
Nu
mb
er o
f O
ccu
rren
ces
Unit
Text

© 2009 Deloitte Touche Tohmatsu223
Curves - Cost curve
Co
st/u
nit
Cumulative Volume
Text
Text
Text Text
Text

© 2009 Deloitte Touche Tohmatsu224
Curves - Downward and upward slopes
1
2
3
Time
3
2
1
Time
Text Text
© 2009 Deloitte Touche Tohmatsu225
Other - Cross
Text
Text
Text
Text
Text

© 2009 Deloitte Touche Tohmatsu226
Other - Funnels
© 2009 Deloitte Touche Tohmatsu227
Other - Spectrum
Text Text
Text
Text
Text Text Text
Low High

© 2009 Deloitte Touche Tohmatsu228
Other - Thermometers
10
9
8
7
6
5
4
3
2
1
0
10
0
10
Tip! Click on the green area and move up or down according to the level needed to show

© 2009 Deloitte Touche Tohmatsu229
Other – Saving thermometer
€ 2 mln
€ 3 mln
€ 1 mln
€ 4 mln
€ 0 mln
€ 6 mln
Savings Category A: € .. mln:• ..Savings Category B: € .. mln:• ..Savings Category C: € .. mln:• ..
Total: € .. mln
€ 7 mln
€ 5 mln
€ 8 mln
Savings Category D: € .. mln:• ..
Category CCategory BCategory A Category D
Category E
Savings Category E: € .. mln:• ..Savings Category F: € .. mln:• ..
Tip! Double-click on the colored area to adjust the amount per category, to change the scale use right click
on the invisible vertical axis

© 2009 Deloitte Touche Tohmatsu