ppt template -...
TRANSCRIPT

Slide 1

SS OPTMZ-01 Part 1SimSci OptimizationOpening Session
Optimization Update andIntegrated Yield Accounting
@InvensysOpsMgmt / #SoftwareRevolution
/InvensysOpsMgmt
/InvensysVideos
social.invensys.com
© 2013 Invensys. All Rights Reserved. The names, logos, and taglines identifying the products and services of Invensys are proprietary marks of Invensys or its subsidiaries.All third party trademarks and service marks are the proprietary marks of their respective owners.
John Hernandez
Tom Kinney
/Group/SimSci

ROMeo 6.1 Guiding Objectives
Strengthen customer partnerships by developing features that meettheir needs with online optimization software by:
• Meeting Customer Commitments
• Expanding into Utilities Optimization Market
• Enhancing Usability, Improve Configuration Efficiency andMaintainability
• Solution Extensions
Slide 3
Strengthen customer partnerships by developing features that meettheir needs with online optimization software by:
• Meeting Customer Commitments
• Expanding into Utilities Optimization Market
• Enhancing Usability, Improve Configuration Efficiency andMaintainability
• Solution Extensions

What’s New in ROMeo 6.1
• First wave of KBC Reactors, NHTR
• Information Stream
• Utilities Optimization (ERTO)
• LP Update Manager
• Off-sites Integration
• MBM Enhancements• Component balance
Slide 4
• First wave of KBC Reactors, NHTR
• Information Stream
• Utilities Optimization (ERTO)
• LP Update Manager
• Off-sites Integration
• MBM Enhancements• Component balance

Utilities Enhancements with 6.1
• Single platform: Process RTO and Utilities Optimization=>flexibility of training on a single tool
• Enhance usability=> utility models fit for Utilities/Energy optimization
• New Energy Real-Time Optimization (ERTO) Models:
• Boiler Model
• Steam Turbine Model
• Heat Recovery Steam Generator Model (HRSG)
• Gas Turbine Generator Model (GTG)
Slide 5
• Single platform: Process RTO and Utilities Optimization=>flexibility of training on a single tool
• Enhance usability=> utility models fit for Utilities/Energy optimization
• New Energy Real-Time Optimization (ERTO) Models:
• Boiler Model
• Steam Turbine Model
• Heat Recovery Steam Generator Model (HRSG)
• Gas Turbine Generator Model (GTG)

ERTO Boiler
• Simple (Steam Side) Model
– Option to Free Boiler Feed Water Within Model
• Detailed (Exhaust Side) model
• Internal or External Fuel & Air Streams
• Fixed or Calculated Efficiency
Slide 6
• Simple (Steam Side) Model
– Option to Free Boiler Feed Water Within Model
• Detailed (Exhaust Side) model
• Internal or External Fuel & Air Streams
• Fixed or Calculated Efficiency

ERTO Boiler
• Boiler2 icon – lay down
Slide 7
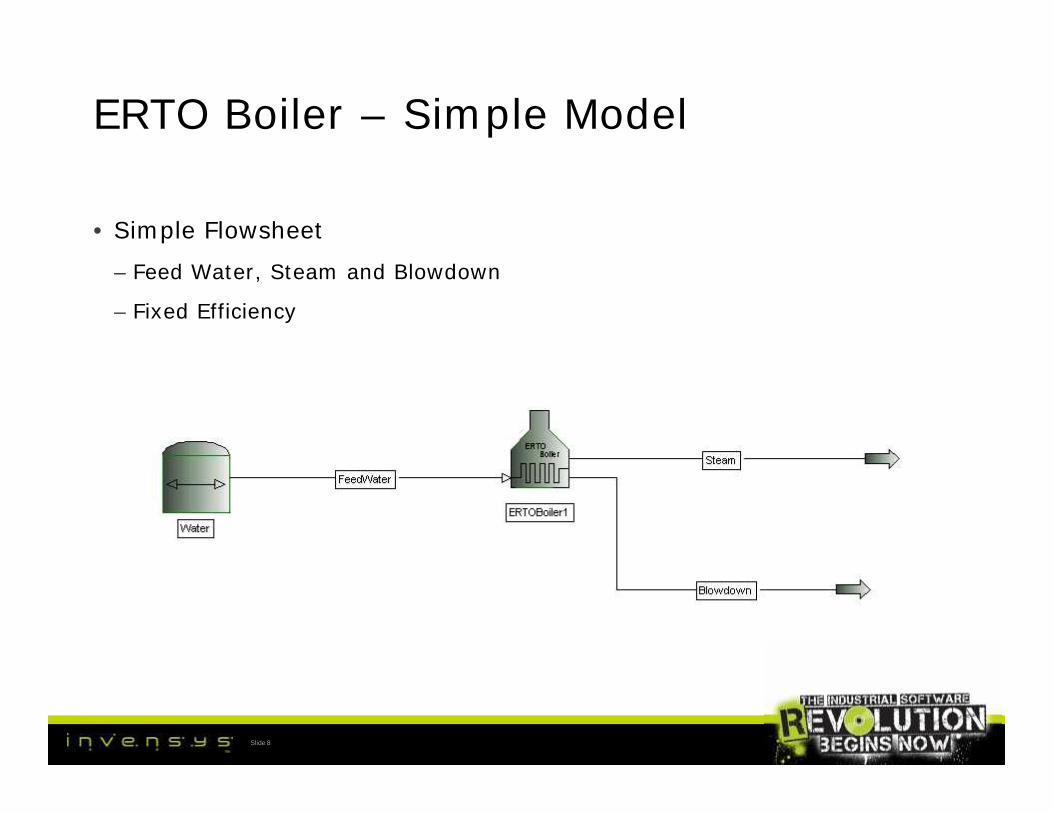
ERTO Boiler – Simple Model
• Simple Flowsheet
– Feed Water, Steam and Blowdown
– Fixed Efficiency
Slide 8

ERTO Boiler – Simple Model
• Simple Model
• Calculated Efficiency
– Feed Water, Steam and Blowdown
– Fuels and Air
– Choose 1 free fuel
Slide 9
• Simple Model
• Calculated Efficiency
– Feed Water, Steam and Blowdown
– Fuels and Air
– Choose 1 free fuel

ERTO Steam Turbine
• Same Model as Original Steam Turbine
• Ability to Free Feed Rate Through Model
Slide 10

ERTO HRSG
• Can be Paired with the GTG
• Fired or Unfired
• Simple and Detailed models
• Internal or External Fuel Side Streams
Slide 11

ERTO GTG
• Paired with the HRSG Model
• No Feed or Product Streams
• Curves for:
– Max Power
– IGV Position
– Heat Rate
– Unfired Efficiency
Slide 12
• Paired with the HRSG Model
• No Feed or Product Streams
• Curves for:
– Max Power
– IGV Position
– Heat Rate
– Unfired Efficiency

Usability Improvement with 6.1Enhance Usability, Improve Building Efficiency and Maintainability
• Customers desire improved sustainability and maintainability ofROMeo applications
• Update features to provide graphical features that make it easier todetermine how the model is configured and related.
• New Information Stream Model
• Ergonomic Enhancements – 33 New keyboard shortcuts
• RTS Macro Manager• Centralized management of scripts used in the Real-Time-System (RTS)
Enhance Usability, Improve Building Efficiency and Maintainability
• Customers desire improved sustainability and maintainability ofROMeo applications
• Update features to provide graphical features that make it easier todetermine how the model is configured and related.
• New Information Stream Model
• Ergonomic Enhancements – 33 New keyboard shortcuts
• RTS Macro Manager• Centralized management of scripts used in the Real-Time-System (RTS)

InfoStream
• Graphically Link or Equate variables
• Graphically Link Parameters
• Equations in the form of a + b (Var – c)
Slide 14

InfoStream
Slide 15

InfoVectors
• User Defined Sets of Variables and/or Parameters that can be Viewedin InfoStream
Slide 16

InfoVectors
Slide 17
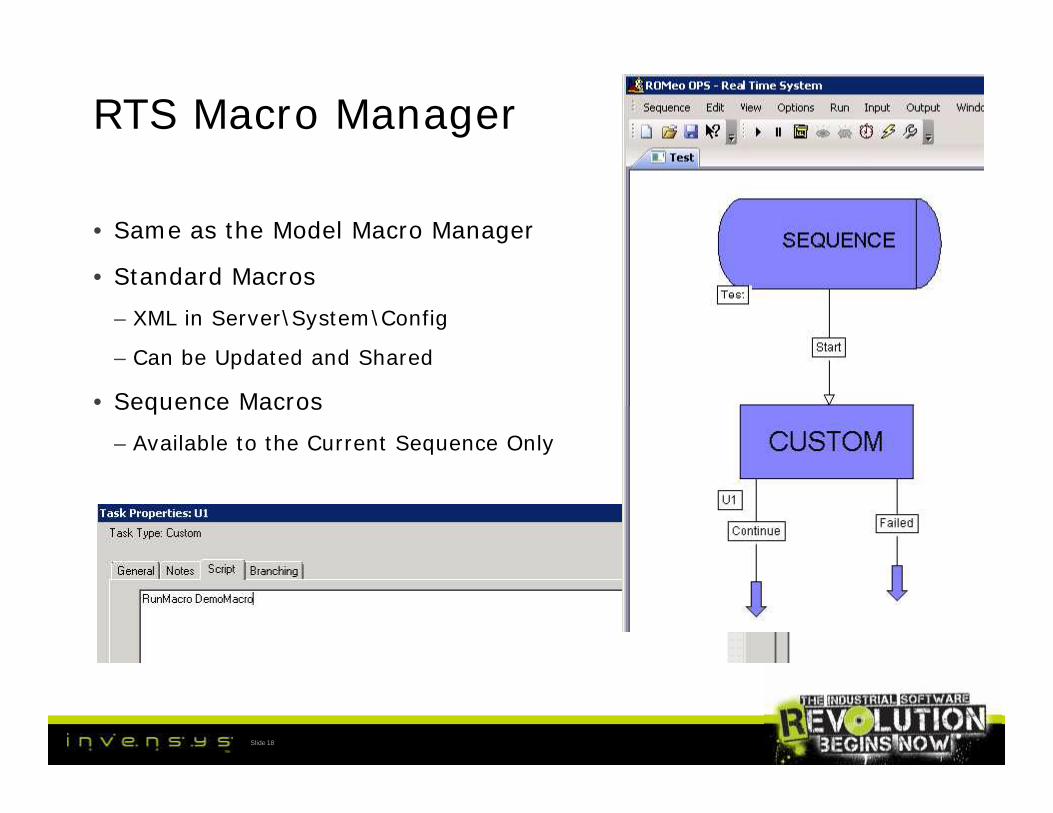
RTS Macro Manager
• Same as the Model Macro Manager
• Standard Macros
– XML in Server\System\Config
– Can be Updated and Shared
• Sequence Macros
– Available to the Current Sequence Only
Slide 18
• Same as the Model Macro Manager
• Standard Macros
– XML in Server\System\Config
– Can be Updated and Shared
• Sequence Macros
– Available to the Current Sequence Only

New Reactor Capabilities with 6.1
Customer Commitments
• Customers desire the ability to use 3rd-party reactor models in ROMeo, like theNaphtha Hydrotreater Model
• Build interfaces to SimSuite 4.1
• New SimSuite 4.1 N-HTR Model
Slide 19
Customer Commitments
• Customers desire the ability to use 3rd-party reactor models in ROMeo, like theNaphtha Hydrotreater Model
• Build interfaces to SimSuite 4.1
• New SimSuite 4.1 N-HTR Model

NHTR (PetroSim 4.1) Reactor
• New Naphtha Hydrotreater Reactor
• KBC’s PetroSim 4.1
• Runs as part of PetroSim, not as a dll
• Options to Open the PetroSim GUI whenRunning the Model in ROMeo
• Requires KBC PetroSim Installation and *.ksc Data File
• Tip: Keep the PetroSim Model as Small as Possible
Slide 20
• New Naphtha Hydrotreater Reactor
• KBC’s PetroSim 4.1
• Runs as part of PetroSim, not as a dll
• Options to Open the PetroSim GUI whenRunning the Model in ROMeo
• Requires KBC PetroSim Installation and *.ksc Data File
• Tip: Keep the PetroSim Model as Small as Possible

Solution Extensions with 6.1
Integration of ROMeo with other applications
• Component and heat balance capability to MBM
• Connect to Invensys Off-sites Suite
• Updates to planning applications
Slide 21
Integration of ROMeo with other applications
• Component and heat balance capability to MBM
• Connect to Invensys Off-sites Suite
• Updates to planning applications

MBM Component and Heat Balance
• Options to Either Report or Balance Components
– Not Linked to Thermo
– Split Fractions
• Option to Report Heat Balance
– Simplified User input of Duty per Node
Slide 22
• Options to Either Report or Balance Components
– Not Linked to Thermo
– Split Fractions
• Option to Report Heat Balance
– Simplified User input of Duty per Node

MBM Component and Heat Balance
Report ComponentBalances
Reconcile ComponentBalances
Report HeatBalances
Slide 23
Report HeatBalances

Offsites Integration with ROMeo 6.1• Objectives
• Leverage Offsites Crude composition data for ROMeo Optimization• Leverage ROMeo product properties with Offsites Product Blending
• Value• Improved Crude Feed composition improves ROMeo Optimization results• Optimized Product property data improves Offsites product blending output
Engineering or RTOModel
Slide 24
Engineering or RTOModel
Crude/FeedData
ProductProperties
Offsites Operations

Off-sites Integration with 6.1 via EDI
• SQLOLEDB Connection Designed to Work Specifically with Offsites
• Option to Import All Tags when First Creating Port Group
(This option goes away once the group has been created)
Slide 25

Updating LP Models with ROMeo 6.1
• Update any LP model with rigorous model results (vectors)
• Accommodate the variety in the LP model structures
• Reliable and easy
Capabilities
Process
Slide 26
• Update any LP model with rigorous model results (vectors)
• Accommodate the variety in the LP model structures
• Reliable and easy
• Import LP model coefficients from ROMeo rigorous model run(s)
• Planner retains control of the Mapping process
• Ability to make custom unit conversions if required
• Export results in spread sheet form, ready for use in LP
• Retains record of all model updates and ability to trend coefficient
values over time
Process

LP Update Manager
PlantRTDB
RTO Model
Plant DataCrude/FeedData
DCS
Slide 27
LP VectorsLP UpdateManager
RefineryLP
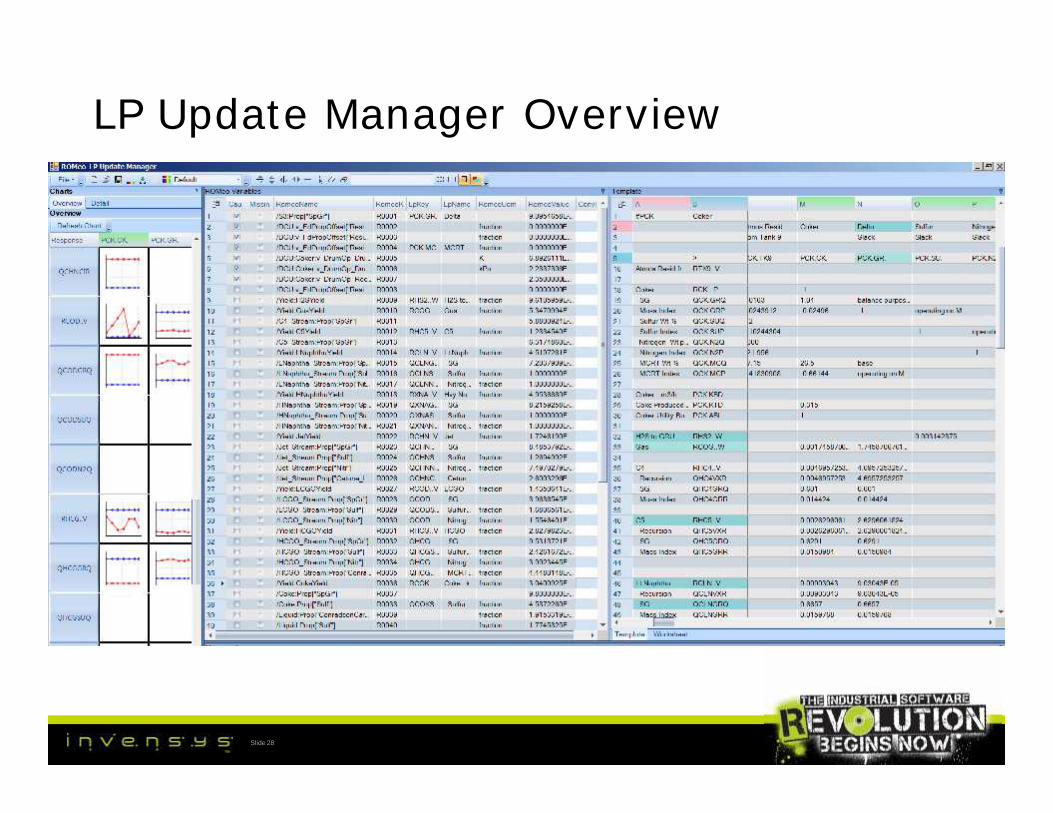
LP Update Manager Overview
Slide 28

LP Update Manager Environment
Slide 29
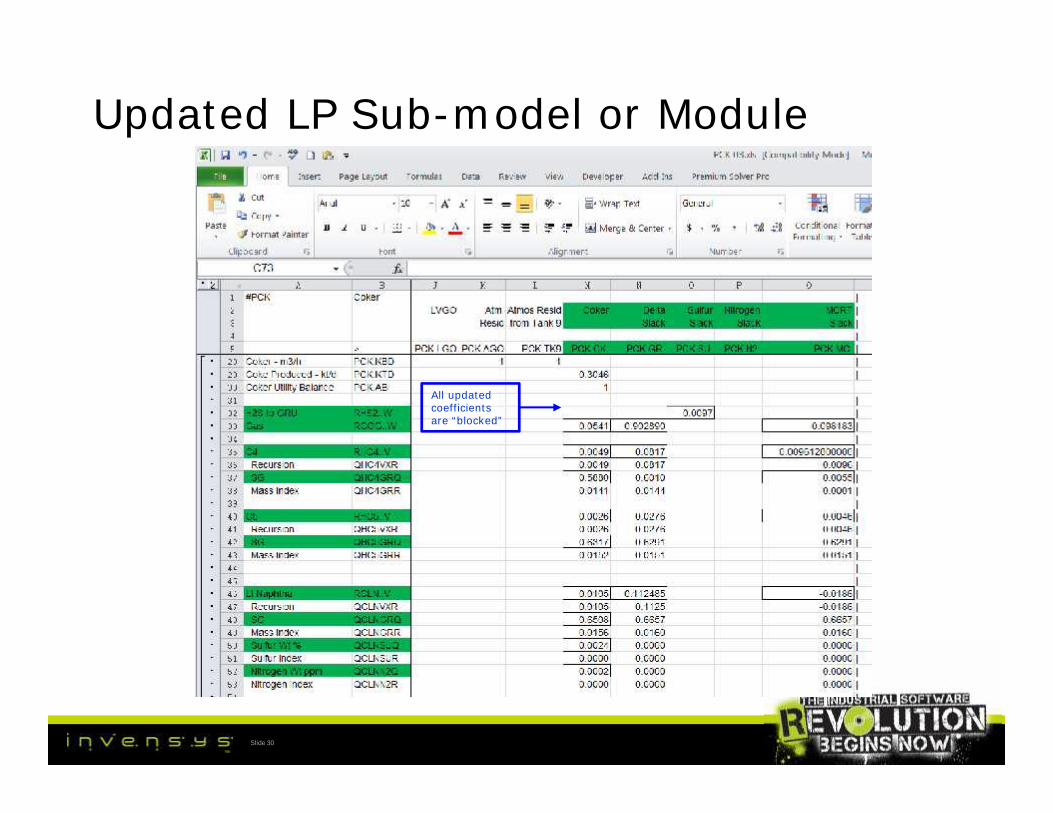
All updatedcoefficientsare “blocked”
Updated LP Sub-model or Module
Slide 30
All updatedcoefficientsare “blocked”

What’s Coming Up in 6.1.
ROMeo 6.1.1
• Spiral Integration
• Information Stream Improvements
• REFSim 4.1 Integration
Slide 31
ROMeo 6.1.1
• Spiral Integration
• Information Stream Improvements
• REFSim 4.1 Integration

ROMeo 6.1.1
• Spiral Integration• On track for ROMeo 6.1.1 release
• MINLP• Mixed Integer non-linear optimization
• Planned for ROMeo 7 release
Slide 32
• MINLP• Mixed Integer non-linear optimization
• Planned for ROMeo 7 release
• 64-Bit Operation• ROMeo servers to be native 64-bit
• KBC v3.3 models currently 32-bit, v4.1 will be 64-bit compatible(not a barrier, separate processor)
• Spyro 64-bit release uncertain pending commitment from Technip
• Release will be a ROMeo v7 issue

ROMeo Intelligence ROMeo iMonitor
• ROMeo 6.0 release with Intelligence:• Integration component to push data from ROMeo to WWIntelligence
environment
• Uni-directional data flow: ROMeo WWIntelligence
• Addressed need to:• Monitor ROMeo RTO applications and Key Performance Indicators• Provide user-accessibility via the browser
• Invensys is moving to incorporate iMonitor into the ROMeoSuite• Extends the features that are offered by the WWIntelligence integration• Users can interact with ROMeo via the web browser (data entry
capability)
• Invensys will maintain and support iMonitor moving forward
Slide 33
• ROMeo 6.0 release with Intelligence:• Integration component to push data from ROMeo to WWIntelligence
environment
• Uni-directional data flow: ROMeo WWIntelligence
• Addressed need to:• Monitor ROMeo RTO applications and Key Performance Indicators• Provide user-accessibility via the browser
• Invensys is moving to incorporate iMonitor into the ROMeoSuite• Extends the features that are offered by the WWIntelligence integration• Users can interact with ROMeo via the web browser (data entry
capability)
• Invensys will maintain and support iMonitor moving forward
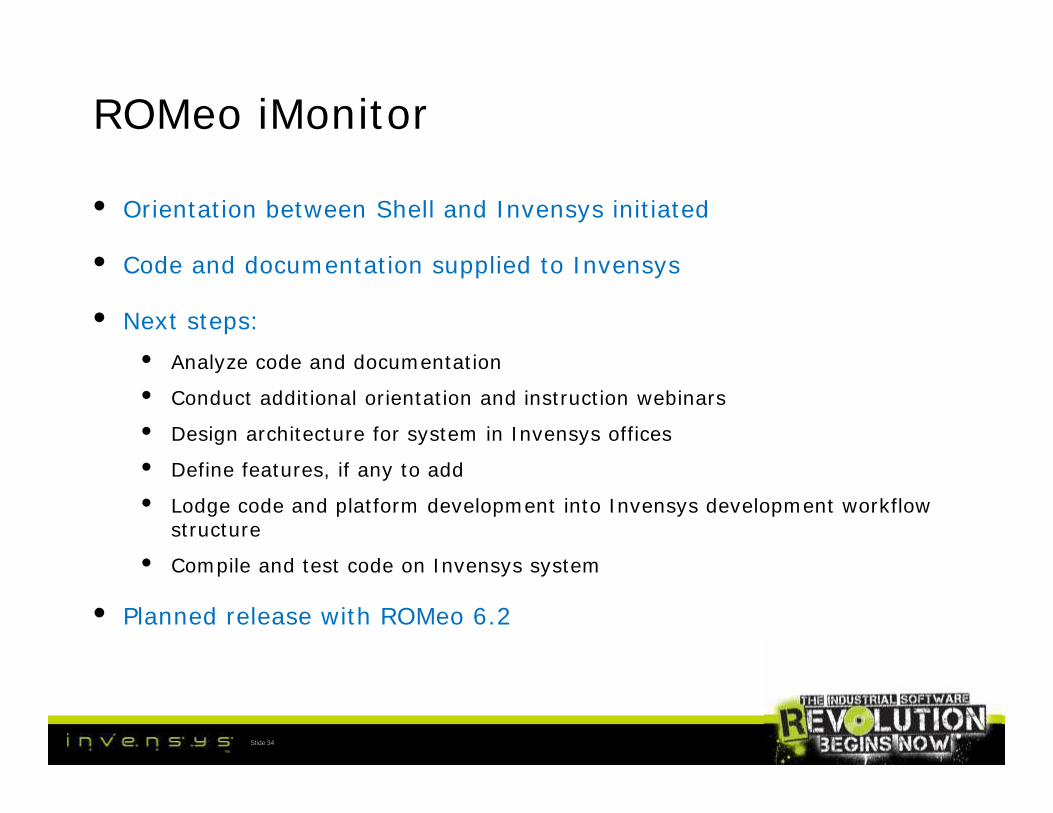
ROMeo iMonitor
• Orientation between Shell and Invensys initiated
• Code and documentation supplied to Invensys
• Next steps:• Analyze code and documentation
• Conduct additional orientation and instruction webinars
• Design architecture for system in Invensys offices
• Define features, if any to add
• Lodge code and platform development into Invensys development workflowstructure
• Compile and test code on Invensys system
• Planned release with ROMeo 6.2
Slide 34
• Orientation between Shell and Invensys initiated
• Code and documentation supplied to Invensys
• Next steps:• Analyze code and documentation
• Conduct additional orientation and instruction webinars
• Design architecture for system in Invensys offices
• Define features, if any to add
• Lodge code and platform development into Invensys development workflowstructure
• Compile and test code on Invensys system
• Planned release with ROMeo 6.2
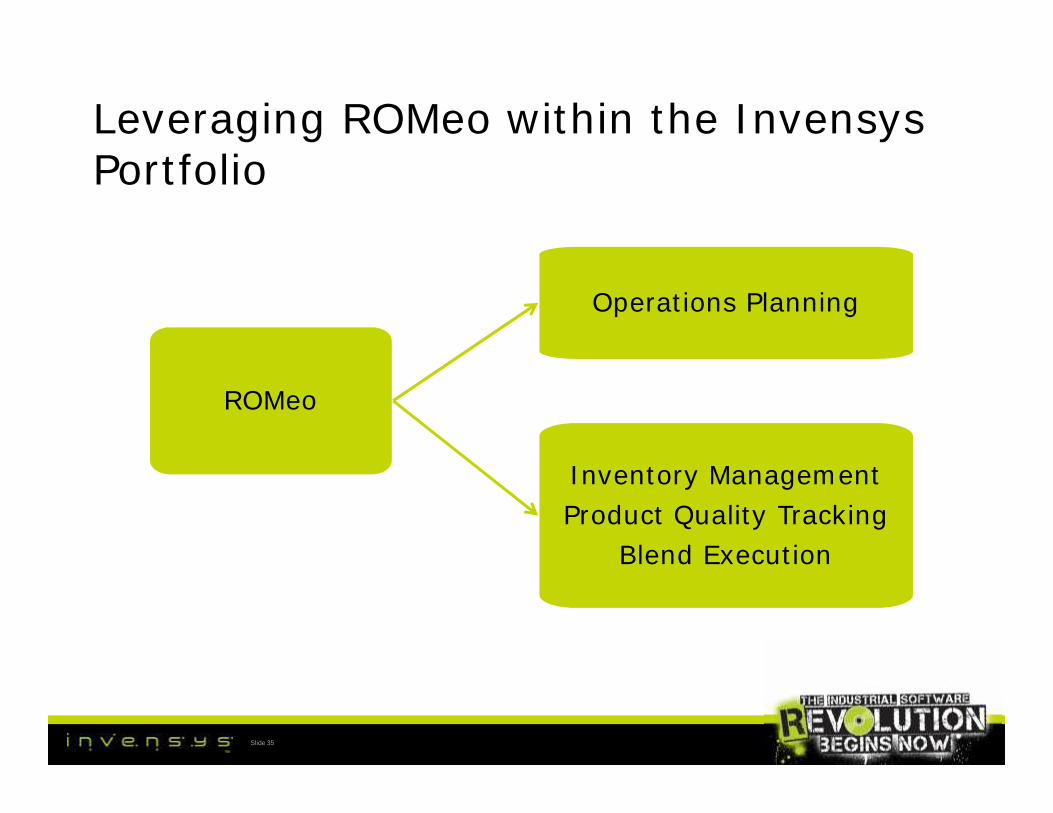
Leveraging ROMeo within the InvensysPortfolio
ROMeo
Operations Planning
Slide 35
ROMeo
Inventory ManagementProduct Quality Tracking
Blend Execution

High-level Roadmap
• EfficiencyEnhancements
• ERTO 1st release
• LP Bridge-Rxtrs
• Off-sites Integration
• MBM ComponentBalance
• 64-Bit Support
• MINLP
• Integration withSpiral
• iMonitor
• Line Up Manager
• ISOMAR Rxtr
• Improved FCCModel
• ImprovedIntegration withSpiral
• NH3 Rxtr Models
• Enhanced APCIntegration
Slide 36
Patches• Released as required• Customer driven
• EfficiencyEnhancements
• ERTO 1st release
• LP Bridge-Rxtrs
• Off-sites Integration
• MBM ComponentBalance
• 64-Bit Support
• MINLP
• Integration withSpiral
• iMonitor
• Line Up Manager
• ISOMAR Rxtr
• Improved FCCModel
• ImprovedIntegration withSpiral
• NH3 Rxtr Models
• Customer Satisfaction• Leverage via Integration
• Ease of Use• Partnering with our customers
Focused Development

Integrated Yield Accounting
© 2013 Invensys. All Rights Reserved. The names, logos, and taglines identifying the products and services of Invensys are proprietary marks of Invensys or its subsidiaries.All third party trademarks and service marks are the proprietary marks of their respective owners.

ErrorSolver User Environment
Slide 38
ModelsDetails and Drilldown
Analysis
Models

Integration to Off-sites
Slide 39

Integrated Mass Balance & Reconciliation
Process DataLab. Data
DR results
Purchase and sales
2
3
4
RTDBRTDB
Automatic DR
MaterialBalance
MaterialBalance
DR ModelsDR Models
Yield AccountingReporting System
ERPERP
Tank Inventory &Movement System
Slide 40
Process DataLab. Data
1
RTDBRTDB
LIMSLIMS
MaterialBalance
MaterialBalance
CompositionTracking
CompositionTracking
Tank Inventory &Movement SystemTank and
movementdata

Modeling Capability for Mass, Volumeand Energy
H2 - Energy Fuel Gas/LNG - Energy Fuel Oil - Energy
H2 Supply H2 Consumption Fuel Gas Supply Fuel Oil Supply
Heater&
Boileretc.
Slide 41
ProcessYield DR Models
OFF-SITES
H2 Supply H2 Consumption Fuel Gas Supply Fuel Oil Supply
Rundown
Charge

Questions&
Answers
Slide 42
Questions&
Answers

Slide 43

AdditionalSlides
Slide 44
AdditionalSlides

Opportunities
• Refineries that have blend operations and optimizationpractices are potentially not leveraging two sources ofinformation to improve efficiency and profitability.
Refiners are faced with the challenge of updating their planning modelswhich affect the yield patterns. ROMeo models of the conversion unitscan be used to generate accurate predicted yield patterns and yieldsensitivity values (delta vectors) for the LP.
Actual crude blend data should be used as input to the ROMeoconversion models, resulting in more accurate yield vectors for the LPModels
Slide 45
• Refineries that have blend operations and optimizationpractices are potentially not leveraging two sources ofinformation to improve efficiency and profitability.
Refiners are faced with the challenge of updating their planning modelswhich affect the yield patterns. ROMeo models of the conversion unitscan be used to generate accurate predicted yield patterns and yieldsensitivity values (delta vectors) for the LP.
Actual crude blend data should be used as input to the ROMeoconversion models, resulting in more accurate yield vectors for the LPModels

Optimizing the Planning Process
• Do we have a close connection between our Planning and Scheduling
functions and our day-to-day Plant Optimization strategies and
applications?
• Do we have consistency between the models used in the planning
process and the conversion units?
• How can we better coordinate between what the planner needs for
his LP updating and what the plant engineer can provide?
Slide 46
• Do we have a close connection between our Planning and Scheduling
functions and our day-to-day Plant Optimization strategies and
applications?
• Do we have consistency between the models used in the planning
process and the conversion units?
• How can we better coordinate between what the planner needs for
his LP updating and what the plant engineer can provide?

Connecting disparate data sources
Crude Oil Manager
Crude Oil Blending
Crude Oil Testing
UpdatedASSAYS
Compositions,properties, etc.
Actualcompositions,properties, etc.
Crude oilvalues
Optimalsetpointtargets
Some key questions:
• How can existingdata be leveraged?
• How can we becertain of thequality of the data?
• How can theassociated tasks becompleted with easeand confidence?
• Which aspects ofthe operation orbusiness will beimproved?
• What are thefinancial benefits?
• Ultimately how candata be exchangedand work processesbe sustained?
Slide 47
Refinery LP
Product Blending
Actualcompositions,properties, etc.
Base anddelta vectorcoefficients
Operatinggoals &targets Stream
properties
Inventories &blend stocks
Optimalsetpointtargets
Starting point - the use of information sources based on best available data
Some key questions:
• How can existingdata be leveraged?
• How can we becertain of thequality of the data?
• How can theassociated tasks becompleted with easeand confidence?
• Which aspects ofthe operation orbusiness will beimproved?
• What are thefinancial benefits?
• Ultimately how candata be exchangedand work processesbe sustained?
Tank InventoriesLifting Schedule
Real timeOptimization
Real timeOptimization

What are the results:
• Crude Oil Blending
• Improve crude oil management
• Reduced upsets to operations
• Crude Unit Optimization
• More profitable crude unit operations
• Operations
• Reduced Plan vs. Actual gap
• More profitable unit operations
• Feed Stock Acquisitions
• More profitable crude oil and feed stock
purchases
• Product Blending
• Inventory Forecast
• Reduced product cost
Summary of concepts:
• Addressing some of the most important
operational and business decisions such as feed
stock purchases, plant shutdowns, product
qualities, etc.
• System developments; Crude Blending to ROMeo
and ROMeo LP Update Manager
• Extend existing applications to benefit each other
through sharing of data
• Sustainable solutions; completing task with
necessary ease and confidence
• Additional value from existing investments
• The specific aspects of the operation or business
will be improved
Slide 48
What are the results:
• Crude Oil Blending
• Improve crude oil management
• Reduced upsets to operations
• Crude Unit Optimization
• More profitable crude unit operations
• Operations
• Reduced Plan vs. Actual gap
• More profitable unit operations
• Feed Stock Acquisitions
• More profitable crude oil and feed stock
purchases
• Product Blending
• Inventory Forecast
• Reduced product cost
$0.10 to $1.00 per barrel processed
Summary of concepts:
• Addressing some of the most important
operational and business decisions such as feed
stock purchases, plant shutdowns, product
qualities, etc.
• System developments; Crude Blending to ROMeo
and ROMeo LP Update Manager
• Extend existing applications to benefit each other
through sharing of data
• Sustainable solutions; completing task with
necessary ease and confidence
• Additional value from existing investments
• The specific aspects of the operation or business
will be improved
Actions more profitable & reliableoperations
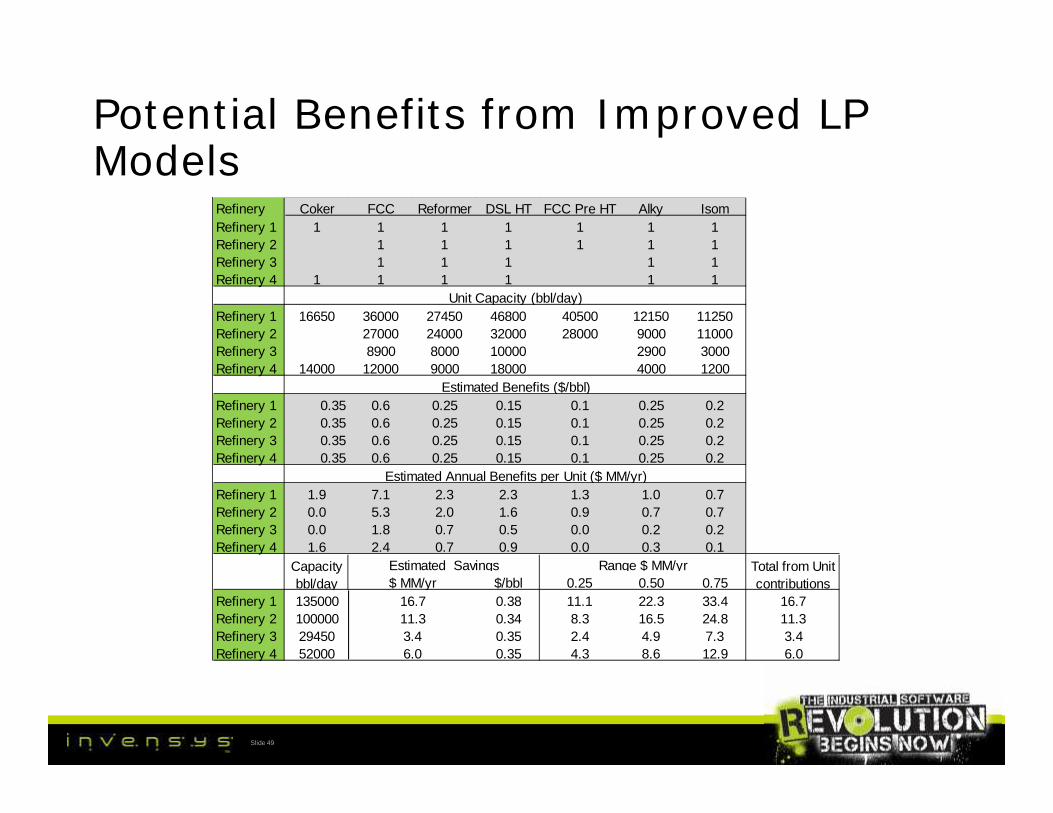
Potential Benefits from Improved LPModels
Refinery Coker FCC Reformer DSL HT FCC Pre HT Alky IsomRefinery 1 1 1 1 1 1 1 1Refinery 2 1 1 1 1 1 1Refinery 3 1 1 1 1 1Refinery 4 1 1 1 1 1 1
Refinery 1 16650 36000 27450 46800 40500 12150 11250Refinery 2 27000 24000 32000 28000 9000 11000Refinery 3 8900 8000 10000 2900 3000Refinery 4 14000 12000 9000 18000 4000 1200
Refinery 1 0.35 0.6 0.25 0.15 0.1 0.25 0.2Refinery 2 0.35 0.6 0.25 0.15 0.1 0.25 0.2Refinery 3 0.35 0.6 0.25 0.15 0.1 0.25 0.2Refinery 4 0.35 0.6 0.25 0.15 0.1 0.25 0.2
Refinery 1 1.9 7.1 2.3 2.3 1.3 1.0 0.7Refinery 2 0.0 5.3 2.0 1.6 0.9 0.7 0.7Refinery 3 0.0 1.8 0.7 0.5 0.0 0.2 0.2Refinery 4 1.6 2.4 0.7 0.9 0.0 0.3 0.1
$/bbl 0.25 0.50 0.75Refinery 1 135000 0.38 11.1 22.3 33.4 16.7Refinery 2 100000 0.34 8.3 16.5 24.8 11.3Refinery 3 29450 0.35 2.4 4.9 7.3 3.4Refinery 4 52000 0.35 4.3 8.6 12.9 6.0
Total from Unitcontributions
Estimated Annual Benefits per Unit ($ MM/yr)
16.711.33.46.0
Unit Capacity (bbl/day)
Estimated Benefits ($/bbl)
Capacitybbl/day
Estimated Savings Range $ MM/yr$ MM/yr
Slide 49
Refinery Coker FCC Reformer DSL HT FCC Pre HT Alky IsomRefinery 1 1 1 1 1 1 1 1Refinery 2 1 1 1 1 1 1Refinery 3 1 1 1 1 1Refinery 4 1 1 1 1 1 1
Refinery 1 16650 36000 27450 46800 40500 12150 11250Refinery 2 27000 24000 32000 28000 9000 11000Refinery 3 8900 8000 10000 2900 3000Refinery 4 14000 12000 9000 18000 4000 1200
Refinery 1 0.35 0.6 0.25 0.15 0.1 0.25 0.2Refinery 2 0.35 0.6 0.25 0.15 0.1 0.25 0.2Refinery 3 0.35 0.6 0.25 0.15 0.1 0.25 0.2Refinery 4 0.35 0.6 0.25 0.15 0.1 0.25 0.2
Refinery 1 1.9 7.1 2.3 2.3 1.3 1.0 0.7Refinery 2 0.0 5.3 2.0 1.6 0.9 0.7 0.7Refinery 3 0.0 1.8 0.7 0.5 0.0 0.2 0.2Refinery 4 1.6 2.4 0.7 0.9 0.0 0.3 0.1
$/bbl 0.25 0.50 0.75Refinery 1 135000 0.38 11.1 22.3 33.4 16.7Refinery 2 100000 0.34 8.3 16.5 24.8 11.3Refinery 3 29450 0.35 2.4 4.9 7.3 3.4Refinery 4 52000 0.35 4.3 8.6 12.9 6.0
Total from Unitcontributions
Estimated Annual Benefits per Unit ($ MM/yr)
16.711.33.46.0
Unit Capacity (bbl/day)
Estimated Benefits ($/bbl)
Capacitybbl/day
Estimated Savings Range $ MM/yr$ MM/yr

LP Model Challenges• How do we update any LP model with rigorous flow sheeting models?
• There is a great variety in the LP model structures
• Any approach or method should be reliable and easy
Goals
Slide 50
• Import LP model coefficients from ROMeo rigorous model run(s)
• Planner retains control of the Mapping process
• Ability to make custom unit conversions if required
• Export results in spread sheet form, ready for use in LP
• Retains record of all model updates and ability to trend coefficient
values over time

Case Comparison Interface –Coker Example
Slide 51

Case Comparison Interface –Reforming Example
Slide 52

LP Update Manager Overview
Slide 53

LP Sub-model or Module Template
Slide 54

MappingControls
Imported Rigorous Model Values
Slide 55
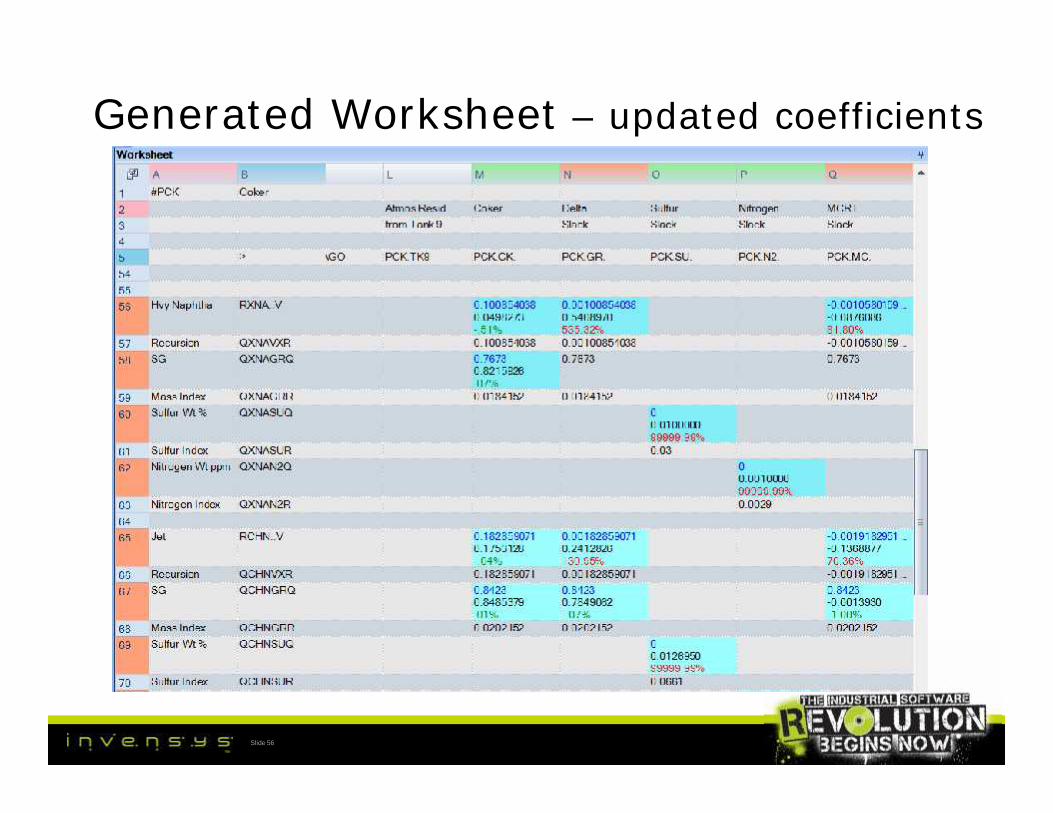
Generated Worksheet – updated coefficients
Slide 56

Tracking Coefficient Values
Slide 57

All updatedcoefficientsare “blocked”
Updated LP Sub-model or Module
Slide 58
All updatedcoefficientsare “blocked”
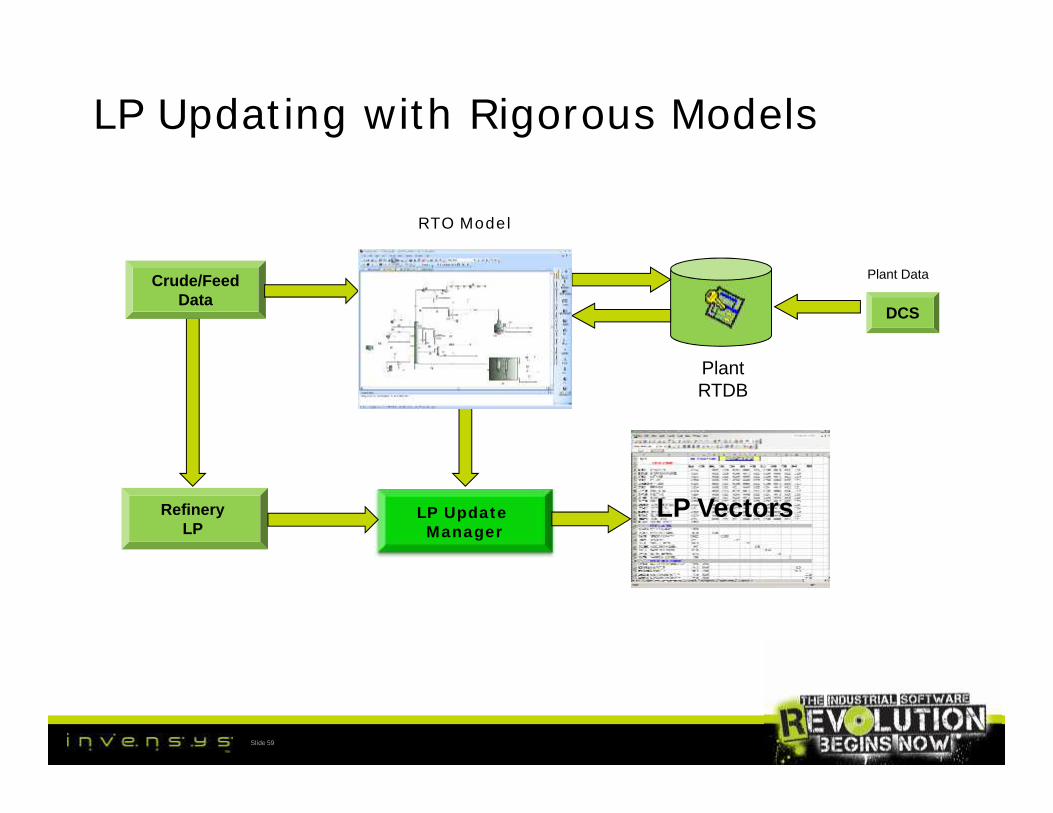
LP Updating with Rigorous Models
PlantRTDB
RTO Model
Plant DataCrude/FeedData
DCS
Slide 59
LP VectorsLP UpdateManager
RefineryLP
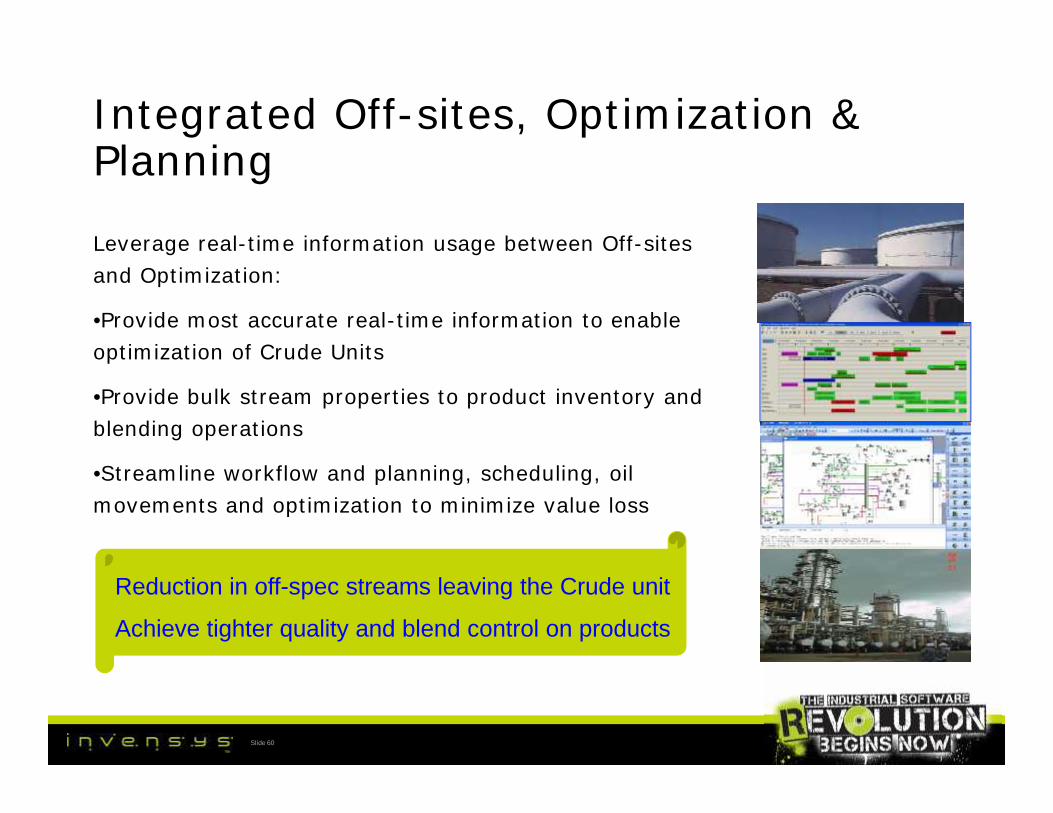
Integrated Off-sites, Optimization &Planning
Leverage real-time information usage between Off-sitesand Optimization:
•Provide most accurate real-time information to enableoptimization of Crude Units
•Provide bulk stream properties to product inventory andblending operations
•Streamline workflow and planning, scheduling, oilmovements and optimization to minimize value loss
Slide 60
Leverage real-time information usage between Off-sitesand Optimization:
•Provide most accurate real-time information to enableoptimization of Crude Units
•Provide bulk stream properties to product inventory andblending operations
•Streamline workflow and planning, scheduling, oilmovements and optimization to minimize value loss
Reduction in off-spec streams leaving the Crude unit
Achieve tighter quality and blend control on products

Why Perform Data Reconciliation?
Receipt(Purchase)
Shipment(Sales)
Feedstock inventory Product inventoryProcess
Accounting loss
Physical loss
Accounting loss
Slide 61
Increasing accuracy of measurementsusing Data Reconciliation
Material Balanceusing Data Reconciliation
Data Reconciliation will produce more accurate and reliable data.

Measurement Reliability - Bad Actors
Measurement error of flow meterin normal refinery/petrochemical plant
Slide 62
Slide62
(Measurement Error)

Where can Losses Occur?
Receipt ShipmentFeedstockinventory
ProductinventoryProcess
Slide 63
Physical Losses• Fugitive Emissions• Leakage and Misdirection• Major plant disturbance
Accounting Losses• Measurement
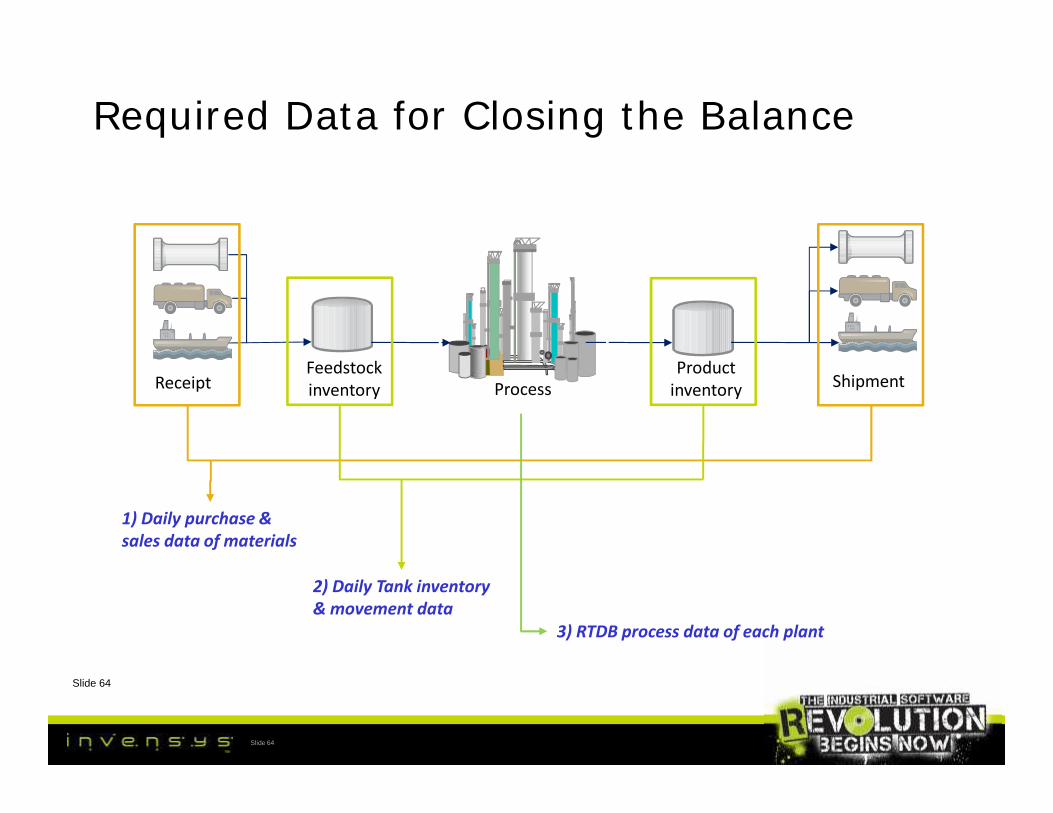
Required Data for Closing the Balance
Receipt ShipmentFeedstockinventory
ProductinventoryProcess
Slide 64
1) Daily purchase &sales data of materials
2) Daily Tank inventory& movement data
3) RTDB process data of each plant
Slide 64

Receipts and Shipments
Receipts Shipments
Slide 65
• Cargo tickets• Pipeline transfer tickets• Transport Certificates
Potential Losses• Fugitive during transport• Data management

Off-sitesRaw Materials
Products
Slide 66
Products
Potential Losses• Stuck gauges• Leaks/misdirection• Emissions• Calibration• Breathing
• Gauging• Temperature• Composition
• Dippings• Filling/Emptying• Blending

Inventory Management
Measured level
PumpableVolume
Ullage TankCapacity
MaximumWorkingVolume
MinimumWorkingVolume
TotalObservedVolume
LAHHH, Interlock, no TIS alarmLAHH, Movement shutdownMaximum Working LevelLAH
Operator setpoint
LALMinimum Working LevelLALL, movement shutdown
• Measure, validate and track tankinventories in real-time
Slide 67
Measured level
PumpableVolume
Ullage TankCapacity
MaximumWorkingVolume
MinimumWorkingVolume
TotalObservedVolume
LAHHH, Interlock, no TIS alarmLAHH, Movement shutdownMaximum Working LevelLAH
Operator setpoint
LALMinimum Working LevelLALL, movement shutdown
• Calculations to adjust data for materialtypes, blending, conditions, and othertank activities

Order & Movement Management• Must unify the work & data flows
between marketing, planning &scheduling, operations, &accounting.
Slide 68
• Must manage all tank, unit,pipeline/dock/rack terminal movementcategories, including blendingoperations, and other complex orders

Emissions Monitoring
LE
VE
L
TIME
FILL
HOLD
EMPTY
Breathing Losses
ExpellationLosses Evaporation
Losses
LE
VE
L
TIMETIME
FILL
HOLD
EMPTY
Breathing Losses
ExpellationLosses Evaporation
Losses
Slide 69
LE
VE
L
TIME
FILL
HOLD
EMPTY
Breathing Losses
ExpellationLosses Evaporation
Losses
LE
VE
L
TIMETIME
FILL
HOLD
EMPTY
Breathing Losses
ExpellationLosses Evaporation
Losses

Composition and Tank Quality
• Product Composition Tracking
• Tank Quality Integration
Slide 70
E
Mx1 … Mxn
My1 … Mym
E
Mx1 … Mxn My1 … Mym
Equipment configurations
– Flow-by
– Fill/Draw

Movement Automation
• Line-up Checks and Validations• Integration with Field Devices
• Reduced product contamination, slops,stock loss, off-spec product release,demurrage
Slide 71
• Line-up Checks and Validations• Integration with Field Devices
• Reduced product contamination, slops,stock loss, off-spec product release,demurrage

Process Units
Flow metersTemperature gauges
Pressure gaugesLab and field quality data
Potential Booked Losses from• Calibration• Properties changed, multiple phases• Different service• Instrument faults• Plugged meter connections• Eroded orifice or nozzle• Signal losses• Misalignment of quality data
Slide 72
Potential Booked Losses from• Calibration• Properties changed, multiple phases• Different service• Instrument faults• Plugged meter connections• Eroded orifice or nozzle• Signal losses• Misalignment of quality data

Potential for Human Errors
Slide 73
Feeds Products Inventory change No Loss?

Automated Data Gathering
Slide 74
Electronic data gathering everywhere possible eliminates thepossibility of human error in the data

ModelValidation
VariableClassification
Missing FlowDetection&FaultyMeasurementDetection
DataReconciliation
Optimization
Steps in Closing the Balances
GrossGross ErrorErrorDetectionDetection
Data ReconciliationData Reconciliation
RepresentativeRepresentativeModelModel
Slide 75
ModelValidation
Missing FlowDetection&FaultyMeasurementDetection
InaccurateMeasurement Value
Accurate Reconciled Valuewith Material Balance
Material Balance(Constraint)
Increase AccuracyIncrease Accuracy
Accurate Optimized Valuewith all kinds of Constraints(such as min/max of stream)

ErrorSolver User Environment
Slide 76
ModelsDetails and Drilldown
Analysis
Models

Integration to Off-sites
Slide 77
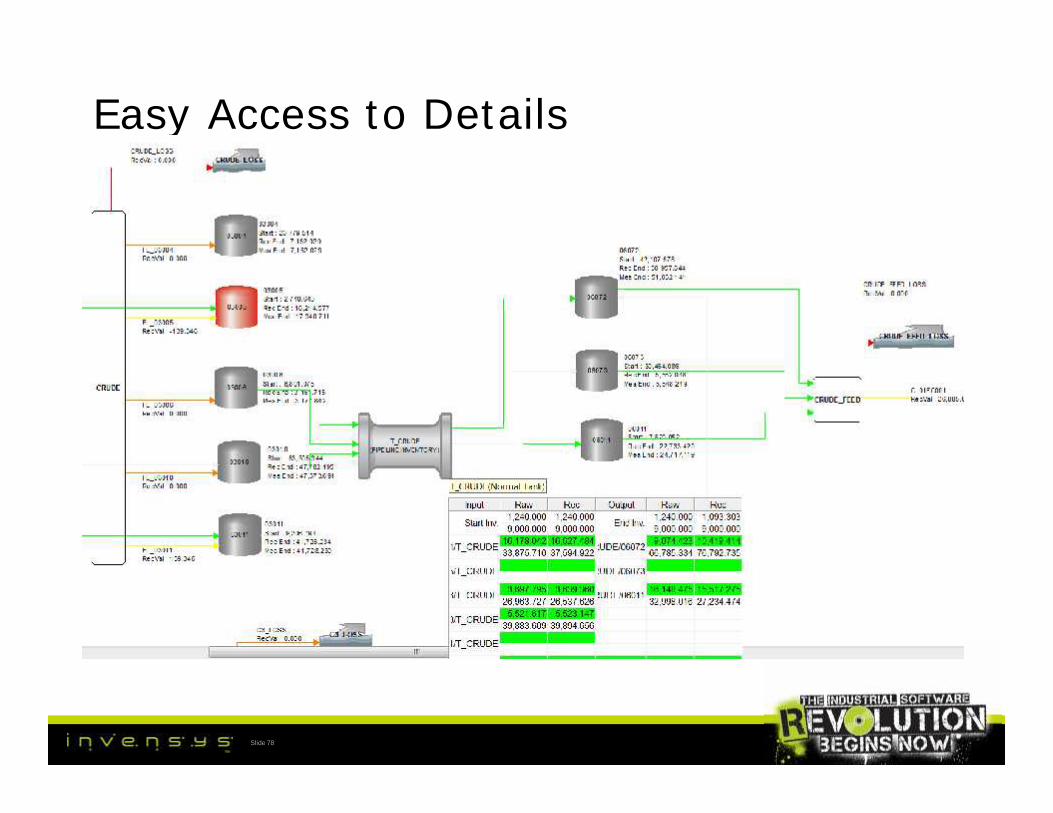
Easy Access to Details
Slide 78

ReconciliationReporting
Slide 79

Summary Reports
Slide 80

Loss Analysis Views
Slide 81
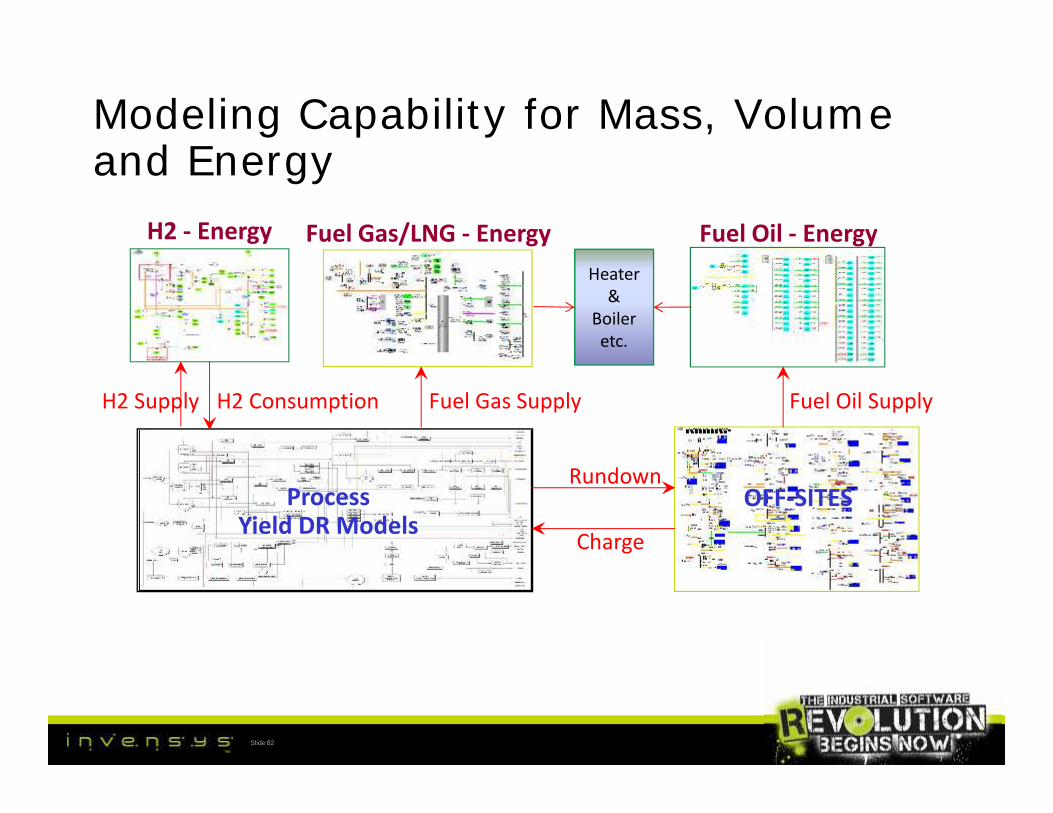
Modeling Capability for Mass, Volumeand Energy
H2 - Energy Fuel Gas/LNG - Energy Fuel Oil - Energy
H2 Supply H2 Consumption Fuel Gas Supply Fuel Oil Supply
Heater&
Boileretc.
Slide 82
ProcessYield DR Models
OFF-SITES
H2 Supply H2 Consumption Fuel Gas Supply Fuel Oil Supply
Rundown
Charge
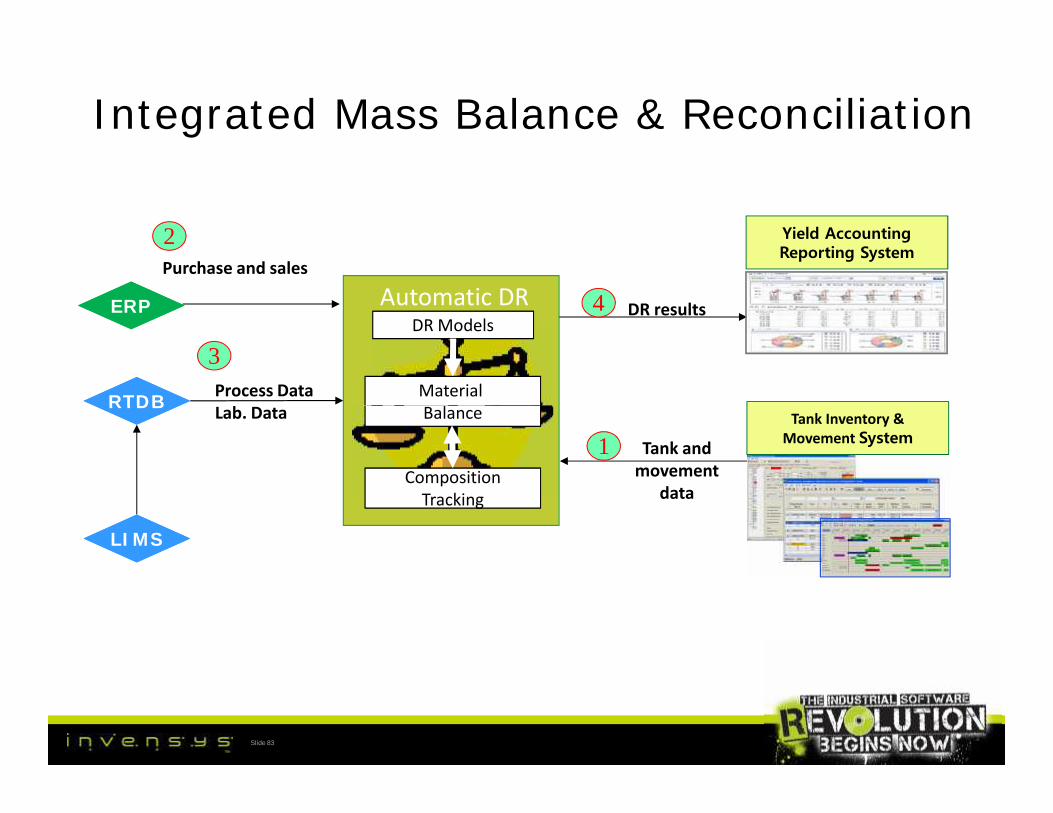
Integrated Mass Balance & Reconciliation
Process DataLab. Data
DR results
Purchase and sales
2
3
4
RTDBRTDB
Automatic DR
MaterialBalance
MaterialBalance
DR ModelsDR Models
Yield AccountingReporting System
ERPERP
Tank Inventory &Movement System
Slide 83
Process DataLab. Data
1
RTDBRTDB
LIMSLIMS
MaterialBalance
MaterialBalance
CompositionTracking
CompositionTracking
Tank Inventory &Movement SystemTank and
movementdata