pr gress - the new zealand...
TRANSCRIPT

PR GRESS
FONTERRA INTERIM REPORT 2013FONTERRA CO-OPERATIVE GROUP LIMITEDA REPORT ON PROGRESS MADE FOR THE SIX MONTHS ENDED 31 JANUARY 2013

VELOCITYDarfielD
Supporting our ability to meet growing demand for high quality powders
StuDholme Increased operational flexibility and new milk added
Waikato Investing more than $100 million in a new
UHT milk processing plant in the Waikato to meet increasing demand from our foodservice
and consumer operations
the NetherlaNDS Greenfields plant in The Netherlands will
process the whey and lactose produced in cheese production into premium nutrition dairy ingredients
for our global customer base
ChiNa Signed agreements to complete first farming hub in China. Our farms on track to produce
over 69,000 MT of milk this year
VOLUMEGrouP SaleS Volume NzmP SaleS Volume CoNSumer (ComBiNeD)
SaleS Volume
8% 9% 6%
VaLUE
foreCaSt CaSh PaYout for the 2012/13 SeaSoN $6.12iNterim earNiNGS Per Share
29CPS
iNterim DiViDeND
16CPS
NormaliSeD eBit
$693M
21%FROM PRIOR PERIOD 33%
FROM PRIOR PERIOD 26%
FROM PRIOR PERIOD
Fonterra refers to Normalised Earnings/Normalised EBIT, EBIT, constant currency variances, Normalisation Adjustments and payout when discussing financial performance. These are non-GAAP financial measures and are not prepared in accordance with IFRS. Management believes that these measures provide useful information as they provide valuable insight on the underlying performance of the business. They are used internally to evaluate the underlying performance of business units and to analyse trends. These measures are not uniformly defined or utilised by all companies. Accordingly, these measures may not be comparable with similarly titled measures used by other companies. Non-GAAP financial measures should not be viewed in isolation nor considered as a substitute for measures reported in accordance with IFRS. Please refer to page 27 for details of Normalisation Adjustments. FONTERRA INTERIM REPORT 2013 1

We will be investing more than $100 million in a new UHT milk processing plant in the Waikato, which will enable us to double our UHT production over the next few years.
chAIRMAN AND cEO’S lETTER
Chairman and CEO’s Letterafter a strong start to the year with record milk flows, we are now in a challenging time for farmer shareholders. The declaration of drought in many parts of the North Island in early March explains why. Lack of rain means lack of pasture, with farmers turning to supplementary feeds and a shift to once a day milking to maintain the condition of their herds.
Coping with the climate is part of farming and we have had dry periods before. But there is no denying the stress it causes and at times like these, farmer shareholders are looking for support from their Co-operative.
Payout is top of the list. Getting the best performance out of the business so farmer shareholders see a strong
return on their investment in our Co-operative is what we all want to see.
The best Farmgate Milk Price is fundamental to growth goals, securing milk volumes and enabling farmers to plan for future increases in production. Delivering here is good for our farmer shareholders and good for the business.
a good dividend is also important. Our strategy emphasises value as well as volume, so we deliver strong returns on farmers’ capital investment in our Co-operative. Our ability to pay a 33 per cent higher interim dividend of 16 cents reflects Fonterra’s good performance in achieving improved margins through New Zealand Milk Products and growth in the consumer and foodservice segments in asia and Latin america.
Backed by our strong balance sheet and operating cash flows, we were able to increase the advance rate paid to farmers for their milk.
The faster advance rate, together with the higher forecast milk price, means that, on average, farmer shareholders will receive around $100,0001 earlier in the season.
More Volume, More ValueOur interim results show that our ambition to drive more volume and value is being translated to action, with increased milk production and sales volumes, and some export records broken. Our smart management of production choices, which saw us reacting quickly and flexibly to pricing signals, also drove improved profits with very good margins secured over commodity benchmarks.
We also made good volume and value progress in asia/aME where demand in foodservice and consumer brands saw a 13% increase in sales volumes, while in Latin america there was an 11% volume increase – largely on the back of Soprole’s improved performance. across the Tasman, however, our australia business had another tough six months.
Volume and value always have to flow through to better returns for our farmer shareholders. That’s even more important as drought impacts their operations.
With a stable capital structure, we are backing our growth strategy with investment in stainless steel. Following on from our Darfield investment which is strongly supporting our ability to meet growing demand for high quality powders, we will be investing more than $100 million in a new UHT (Ultra Heat
Treated) processing plant in the Waikato. The new plant will enable us to double our UHT production over the next few years, producing a range of products including UHT white milk and UHT cream which is in increasing demand from the foodservice sector in asia.
Early in the second half we also confirmed our partnership with Netherlands-based a-ware Food Group. Together we will develop a greenfields site in the Netherlands where a-ware will operate a cheese plant and Fonterra an adjacent dairy ingredients plant. This will process the whey and lactose produced in cheese production into premium nutrition dairy ingredients for our global customer base.
OutlookFonterra’s strong first half earnings are unlikely to be repeated in the second half.
For the full year, we expect to see total milk volumes for the current season to be in line with last season.
The ongoing volatility in commodity markets could have a negative impact on product mix profitability.
In many of our consumer markets, we are expecting intensified competition in the second half – particularly in australia – and in asia we are seeing signs of demand slowing.
Net Profit after taX
33%
oN aVeraGe farmer ShareholDerS Will reCeiVe arouND
$100K1
earlier iN the SeaSoN
iNterim DiViDeND
16CPS
FONTERRA INTERIM REPORT 2013 32 FONTERRA INTERIM REPORT 2013
1 As at June 2013, compared to the opening advance rate schedule.
40SHaRES/UNITS
1BoNuS
SHaRE/UNIT
=Each shareholder and unit holder will receive one bonus Share or Unit for every 40 shares or units held on 12 april.
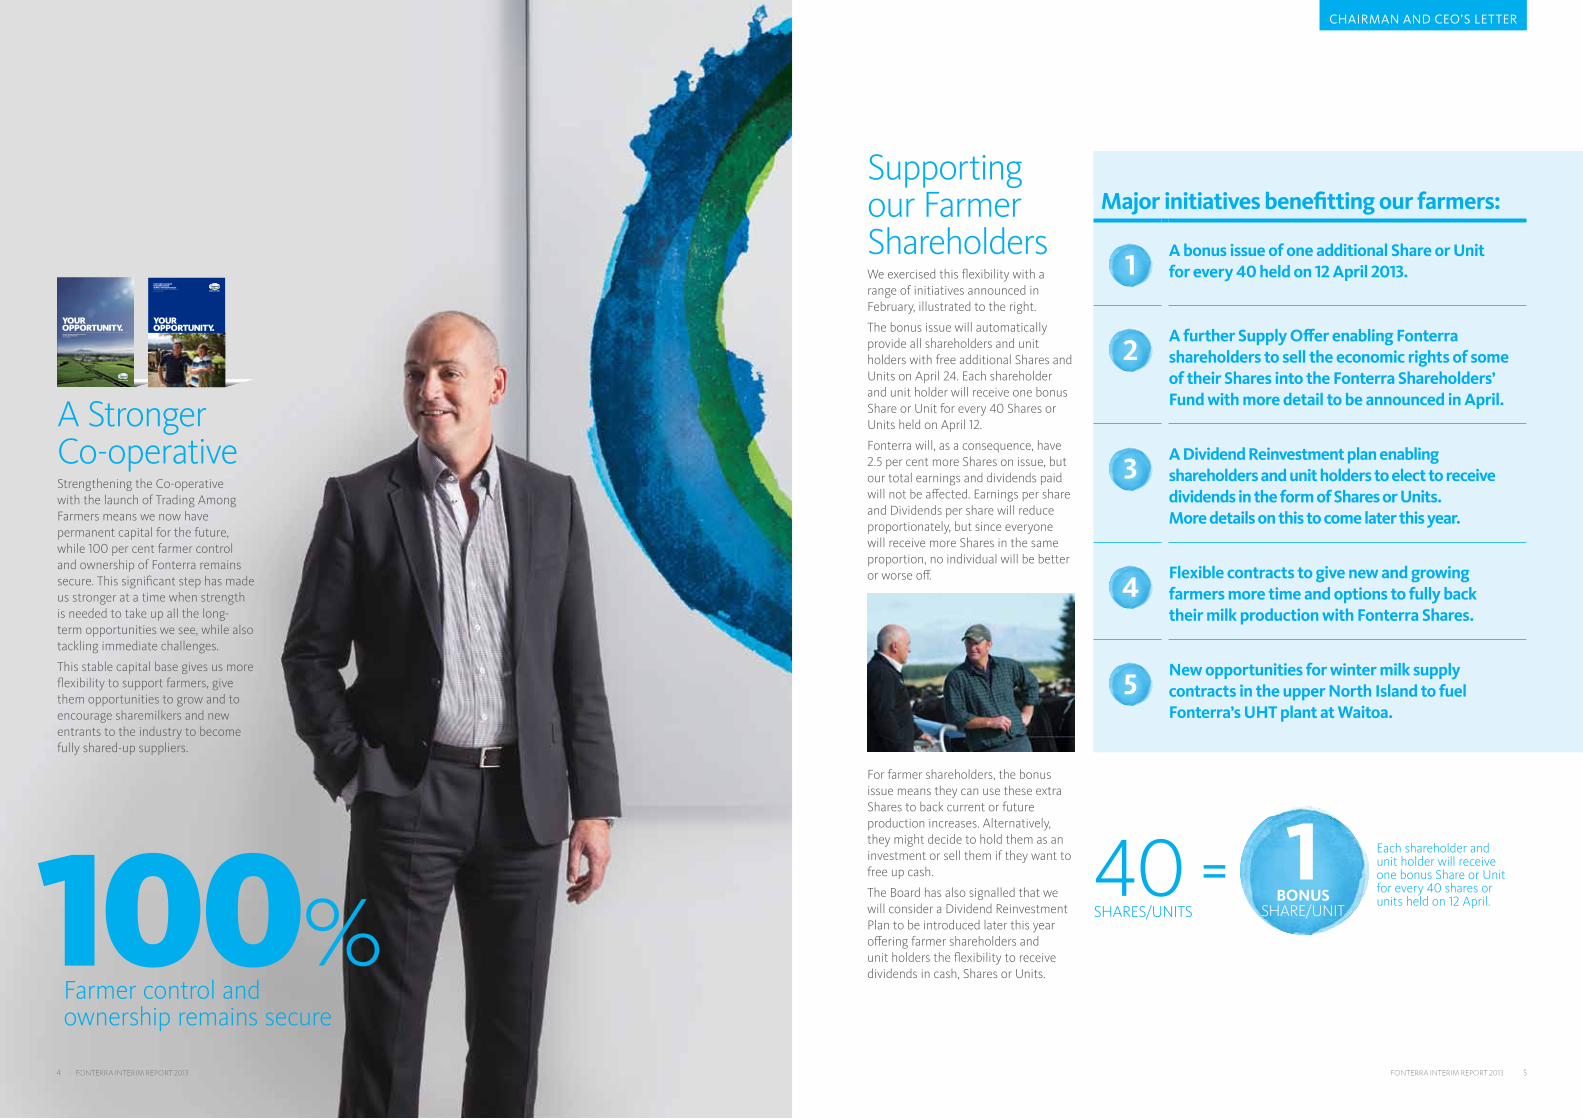
Supporting our Farmer ShareholdersWe exercised this flexibility with a range of initiatives announced in February, illustrated to the right.
The bonus issue will automatically provide all shareholders and unit holders with free additional Shares and Units on april 24. Each shareholder and unit holder will receive one bonus Share or Unit for every 40 Shares or Units held on april 12.
Fonterra will, as a consequence, have 2.5 per cent more Shares on issue, but our total earnings and dividends paid will not be affected. Earnings per share and Dividends per share will reduce proportionately, but since everyone will receive more Shares in the same proportion, no individual will be better or worse off.
For farmer shareholders, the bonus issue means they can use these extra Shares to back current or future production increases. alternatively, they might decide to hold them as an investment or sell them if they want to free up cash.
The Board has also signalled that we will consider a Dividend Reinvestment Plan to be introduced later this year offering farmer shareholders and unit holders the flexibility to receive dividends in cash, Shares or Units.
major initiatives benefitting our farmers:
1a bonus issue of one additional Share or unit for every 40 held on 12 april 2013.
2a further Supply offer enabling fonterra shareholders to sell the economic rights of some of their Shares into the fonterra Shareholders’ fund with more detail to be announced in april.
3a Dividend reinvestment plan enabling shareholders and unit holders to elect to receive dividends in the form of Shares or units. more details on this to come later this year.
4flexible contracts to give new and growing farmers more time and options to fully back their milk production with fonterra Shares.
5New opportunities for winter milk supply contracts in the upper North island to fuel fonterra’s uht plant at Waitoa.
chAIRMAN AND cEO’S lETTER
FONTERRA FARMER SHAREHOLDERS’ SUPPLY OFFER BOOKLETFONTERRA CO-OPERATIVE GROUP LIMITED26 OCTOBER 2012
OPPORTUNITY.YOUR
OPPORTUNITY.YOURFONTERRA SHAREHOLDERS’ FUND PROSPECTUS AND INVESTMENT STATEMENT26 OCTOBER 2012
THIS DOCUMENT IS PRINTED ON AN ENVIRONMENTALLY RESPONSIBLE PAPER PRODUCED USING ELEMENTAL CHLORINE FREE (ECF)FSC® CERTIFIED MIXED SOURCE PULP, SOURCED FROM WELL MANAGED AND LEGALLY HARVESTED FORESTS, AND MANUFACTURED UNDER THE STRICT ISO14001 ENVIRONMENTAL MANAGEMENT SYSTEM.
FON
TERR
A SH
AR
EHO
LDER
S’ FUN
D P
RO
SPEC
TUS A
ND
INV
ESTMEN
T STATEM
ENT
FONT1001 IPO Cover with Spine AW.indd 1 25/10/12 5:56 PM
a Stronger Co-operativeStrengthening the Co-operative with the launch of Trading among Farmers means we now have permanent capital for the future, while 100 per cent farmer control and ownership of Fonterra remains secure. This significant step has made us stronger at a time when strength is needed to take up all the long-term opportunities we see, while also tackling immediate challenges.
This stable capital base gives us more flexibility to support farmers, give them opportunities to grow and to encourage sharemilkers and new entrants to the industry to become fully shared-up suppliers.
100%Farmer control and ownership remains secure
4 FONTERRA INTERIM REPORT 2013 FONTERRA INTERIM REPORT 2013 5

John WilsonCHaIRMaN
Theo SpieringsCEO
chAIRMAN AND cEO’S lETTER
We intend to conduct another Supply Offer, as we indicated in the Fund prospectus. The Offer provides farmers a further option for dealing with the financial stress of a tough season, if that is the right choice for them, by selling the Economic Rights to a portion of their Shares and freeing up some capital.
Our new supply contract options – which will support and grow Fonterra’s milk supply – will be available to new and current farmer shareholders who are growing production. Share-backed production is a fundamental principle of our Co-operative. This remains unchanged – the new contracts simply provide more time to share up.
There will be additional opportunities for Fonterra farmers in the upper North Island to take up winter milk contracts. We aim to increase our winter milk supply by more than 50 per cent over the next two years for the Waitoa UHT plant.
These initiatives are in the best interests of our farmer shareholders and all those with a financial stake in our future performance. They show our ability to meet challenges head-on, and not all of them are posed by climate.
We are in a competitive environment for milk supply with some international companies signalling their intention to start processing milk in New Zealand for export.
Future FocusWe have come through an historic period for our Co-operative, but this is no time for reflection.
all of our energies are going into delivering on our volume and value strategy. Fundamental to this is our access to high quality milk, produced profitably, responsibly and with community support. We are placing even more emphasis than ever on being a responsible, resilient business, owned by profitable farmers using
resources well. Ultimately, we want to lead the way in sustainable dairying.
Our farmer shareholders have made significant progress on-farm, investing millions over the past nine years on environmental improvements on farms.
This is a significant commitment, but farmers have made it because it is important.
On-farm our cornerstone programme, Supply Fonterra, lays out what we need to do in important areas like
managing effluent, waterways and nutrients. It gives clear guidance on our expectations of our farmers, including those which need to be met as a condition of supply.
Having led water quality commitments through the voluntary Dairying and Clean Streams accord with government and regional councils in 2003, we are right behind the new Sustainable Dairying: Water accord which now involves all dairy companies and their suppliers.
ConclusionOur scale, competitive advantage with quality milk and our integrated supply chain all start on our farmer shareholders’ farms. This is a strength we will always vigorously defend.
Our strength comes from our shareholder base. Our primary purpose is to ensure our farmers thrive and where they want to grow production, they are able to have that production processed by their Co-operative.
Farmer loyalty and support will not be won with promises. It has to be earned with performance at every level: delivering the best returns, delivering the best service and protecting our farmer shareholders’ interests.
Our farmer shareholders have made significant progress on-farm, investing millions over the past nine years on environmental improvements on farms.
6 FONTERRA INTERIM REPORT 2013 FONTERRA INTERIM REPORT 2013 7

Group Overview The Co-operative’s interim result reflected a strong half year, with a 33 per cent increase in net profit after tax of $459 million on the back of a particularly robust performance by NZ Milk Products and significant lifts in first half sales volumes in Fonterra’s asian and Latin american brands. These achievements were offset by continuing challenges affecting the performance of the australian business.
Record New Zealand milk flows in the first half, up 6 per cent, were matched by strong growth in sales volume, up 8 per cent across our business globally.
We had excellent spring and early summer growing conditions across most of the country. However, the drought in the third quarter means we are currently forecasting total milk collection volumes to finish close to what we achieved last season.
Revenue of $9.3 billion was 7 per cent lower than the comparable period, with lower dairy prices and the strength of the New Zealand dollar against the US dollar more than offsetting higher volumes sold.
Our operating cash flow was consistent with the same period last year. Cash flow improved as a result of the
strong earnings growth and inventory management, but this was partly offset by faster payments to our farmers.
Our gearing ratio improved to 40 per cent from 47 per cent in the prior period. although the gearing ratio at 31 July 2012 was lower at 39 per cent, the seasonal nature of our business means the more meaningful comparison is with the position at the previous half year.
The Board declared an interim dividend of 16 cents per share, 4 cents per share higher than the comparable period. 16 cents represents 50% of our forecast dividend for the current financial year, and the maximum available under the 40-50% range in our dividend policy. It reflects expectation that earnings will be weighted more to the first half of the year.
Normalised eBit growth1
We had strong growth in normalised eBit up 26 per cent to $693 million. this was driven by a number of key factors:
NZ Milk Products
65%
NZ Milk Products had a strong first half with normalised EBIT up 65 per cent to $422 million, reflecting a favourable product mix that made the most of comparatively higher cheese and casein prices, and improved price premiums.
AsiA/AME
27%
asia/aME’s first half normalised EBIT of $100 million was up 27 per cent, a result of sustained growth in Foodservice and consumer brands across South East asia and China.
soProlE
40%
Soprole’s normalised EBIT was up 40 per cent, the result of improvements in consumer sales and margins in Chile.
ANZ
32%
The above gains were partially offset by a 32 per cent fall in aNZ’s normalised EBIT to $98 million. a significant reshape of the australian business is underway to better position it for the future.
Volumes
H1 2011 H1 2012 H1 2013
0
500
1,000
1,500
2,000
2,500
‘000 MT
+5%+8%
1,826 1,918 2,067
Normalised EBIT
Keyhighlights
foreCaSt CaSh PaYout milk VolumeS SaleS Volume
$6.12 6% 8%Forecast Farmgate Milk Price lifted to $5.80 per kgMS. Forecast annual dividend of 32 cents per share.
Record milk volumes collected up 6 per cent.
Total external sales volume growth of 8 per cent to 2.1 million MT.
NormaliSeD eBit iNterim DiViDeND GeariNG
$693M 16CPS 40%Normalised EBIT of $693 million was up 26 per cent on the prior period. Earnings per share (EPS) of 29 cents, up 21 per cent.
Interim dividend of 16 cents, up 33 per cent.
Gearing improved 7 percentage points compared to the first half last year.
KEY hIGhlIGhTS
61%NZ MILK PRODUCTS
14%ASIA/AME
14%ANZ
10%LATAM
1%OTHER
1 Normalised EBIT growth compared to previous comparative period.
8 FONTERRA INTERIM REPORT 2013 FONTERRA INTERIM REPORT 2013 9

VolumeFavourable weather conditions across most of New Zealand until mid-December resulted in above average dairy production and record volumes of milk collected. The dry conditions in January to March have created challenges for farmers in parts of the North Island with very little rain falling compared to the same period last year. Milk supply for the season to date was up 6 per cent compared to the same period last year, reaching 1,075 million kgMS collected for the eight months to 31 January 2013.
The record milk collections translated into sales volume growth in Whole Milk Powder (WMP), Skim Milk Powder (SMP) and Cheese resulting in total sales volume up 9 per cent to 1.5 million MT.
However, revenue was 11 per cent lower than the comparable period because of lower dairy commodity prices. The weighted average USD denominated average selling price per metric tonne was down 16 per cent.
ValueNZ Milk Products normalised EBIT rose 65 per cent to $422 million compared to last year, mainly as a result of favourable relative cheese and protein pricing, effective management of our product mix and higher price premiums compared to dairy commodity prices.
The business manufactures approximately 20 to 25 per cent of New Zealand sourced milk into products such as cheese and protein products derived from whey and casein. On a relative basis, cheese prices were higher than WMP and other powder prices for most of the first half of the financial year. We moved our discretionary manufacturing to take advantage of this pricing differential. This included:
• Greater use of our mozzarella capability to sell higher volumes through our foodservice channel.
• Increasing volumes of cheese and protein products into North asia to take advantage of the favourable relative prices.
Normalised EBIT was also boosted by improved price premiums above dairy commodity prices, through an ongoing focus on offering value-adding customer services and enhanced product specifications.
In addition, the growth in normalised EBIT reflects the effective management of our administrative and other operating expenses. Costs were lower than last year on a per unit basis, despite the higher activity levels.
a measure of the underlying operational performance of the business is contribution margin1 per metric tonne of sales, which is shown in the table on page 11.
The marked improvement in the contribution margin, up 23 per cent to $448 per metric tonne, reflects the improvement in gross margin with the benefit of relatively higher cheese and casein prices, and the strong operational performance of the business supported by a more efficient distribution channel.
Darfield and StudholmeThe opening of Darfield and the acquisition of the Studholme plant saw a major addition to the asset footprint in the South Island. The increased production capacity in the region during a period of strong growth in milk supply has driven operational efficiencies in milk collection, processing and distribution. These new plants and improvements enabled us to increase production in the important September to December peak capacity period. Further operational benefits arising from investment in quality processes and systems have also contributed to record months of production and shipment over the last six months.
Joint VenturesDFE Pharma, our joint venture with Royal FrieslandCampina, specialises in the manufacture of excipients. The share of profit from DFE was significantly lower reflecting one off adjustments in DFE results in the first half of last year. However the underlying performance of this business remains solid with lactose volumes and prices up in all categories.
DairiConcepts, our joint venture with Dairy Farmers of america, based in the US, makes cheese and dairy ingredients primarily for the US market. The share of profit from this business improved following the divestment of its underperforming Portales plant in June 2012.
KEY FINANCIALS
NZD MILLION6 MONThS TO
31 JANuARY 20136 MONThS TO
31 JANuARY 2012 chANGE
Total volume2 (‘000 MT) 1,474 1,349 9%
Revenue 6,762 7,560 (11%)
Gross margin 797 617 29%
Gross margin percentage 11.8% 8.2% 3.6pp
Operating expenses (442) (433) 2%
EBIT excluding DFE and Dairiconcepts 396 239 58%
EBIT – Fonterra’s normalised share of earnings from DFE and Dairiconcepts
26 16 63%
Normalised EBIT 422 255 65%
Normalised EBIT margin 6.2% 3.4% 2.8pp
2 Total volume includes intercompany volumes
coNtriButioN MArGiN PEr Mt1
NZD MILLION6 MONThS TO
31 JANuARY 20136 MONThS TO
31 JANuARY 2012
Total sales volumes (‘000 MT) 1,474 1,349
Gross margin 797 617
Selling, marketing and distribution expenses (137) (126)
Contribution margin 660 491
Contribution margin per MT 448 364
Growth percentage 23%
1
NZ Milk ProductsNZ Milk Products comprises the core New Zealand milk supply chain from collection, manufacturing and logistics through to the end sale of dairy products to business customers and the Fonterra regional businesses. It also includes international milk sourcing, dairy nutrition-related joint ventures and the Co-operative’s corporate activities.
coNtriButioN MArGiN
$448per MT, Up 23%
Favourable weather conditions until December resulted in above average dairy production and record volumes of milk collected.
NorMAlisEd EBit MArGiN
6.2%
1 contribution margin eliminates the impact of both volume changes (which in the current period have resulted in higher storage and distribution costs) and commodity price and exchange rate fluctuations, which are partly reflected in the cost of New Zealand milk through the Farmgate Milk Price, and the cost of globally sourced milk.
NZ MIlK PRODucTS
10 FONTERRA INTERIM REPORT 2013 FONTERRA INTERIM REPORT 2013 11

australia and New Zealand
reshaping through:
• Brand and product rationalisation
• Reorganisation
• Optimisation of our asset base
VolumeTotal sales volume of 471,000 MT was down 4 per cent compared to last year, primarily because of the sale of the Norco liquid distribution business and lower volumes in private label in our australian business. after adjusting for the sale of Norco, which was sold in November 2012, external sales volume was up 1 per cent to 391,000 MT. Despite the challenging environment in australia, volume in our branded products increased, particularly spreads and cheese.
Value aNZ had a challenging first half, mainly because of tough trading conditions in australia for both the consumer and the ingredients businesses. Normalised EBIT was 32 per cent lower than last period at $98 million, after adjusting for costs of $24 million associated with the planned closure of the Cororooke plant in australia.
The competitive retail environment that has been prevalent in australia over the past few years continued in the first half, and normalised EBIT for the australian consumer business was 31 per cent lower than the comparable period. Our margins were impacted by increased trade spend to defend market share, but we managed to maintain our market position with growth in dairy desserts and spreads offset by a slight decline in yoghurt.
Our consumer business performance in New Zealand was slightly up on last year supported by market share and sales growth in flavoured milk, dairy foods, natural cheese and ice cream. Tip Top had a solid performance with normalised EBIT up 10 per cent on last year. We are also starting to reap the benefits of our strategy to rationalise our product range in our local market.
Our ingredients business in australia had some volume growth, but the business experienced a significant margin squeeze as the competition
for milk supply in australia intensified. This was compounded by an adverse product mix due to lower demand in the export sales of value added nutritional powders, and more milk being channelled into lower value milk powder sales. The earnings of our australian ingredients operations declined significantly compared to the previous period.
australia and New Zealand (aNZ) encompasses three separate consumer and out-of-home foodservices businesses, and a dairy processing and manufacturing business that collects approximately 18 per cent of australia’s milk supply. aNZ also includes RD1 (New Zealand’s largest rural supplies retailer).
ANZ had a challenging first half primarily as a result of tough trading conditions in Australia.
KEY FINANCIALS
NZD MILLION6 MONThS TO
31 JANuARY 20136 MONThS TO
31 JANuARY 2012 chANGE
Total volume 1 (‘000 MT) 471 493 (4%)
Revenue 2,018 2,251 (10%)
Gross margin 423 482 (12%)
Gross margin percentage 21.0% 21.4% (0.4pp)
Normalised EBIT 98 145 (32%)
Normalised EBIT margin 4.9% 6.4% (1.5pp)
1 Total volume includes intercompany volumes
NORMALISED EBIT MARGIN
4.9%
2
Reshaping aNZThe reshape of the aNZ business is progressing to plan. We are in the process of reorganising the consumer business across the asia Pacific region and have combined our australian, New Zealand and aSEaN/Middle East/North africa businesses to form a single asia Pacific/Middle East/africa (aPMEa) business unit. While the
trading situation is expected to remain challenging we are focusing on aligning our strategy in australia to the market conditions:
• Brand and product rationalisation – we have reduced the number of products and brands and this process will continue.
• Reorganisation – the business is currently undergoing organisational change to deliver greater efficiencies.
• Optimisation of our asset base – the upcoming closure of Cororooke will improve efficiencies, and reduce costs through higher utilisation of our other plants.
AuSTRAlIA AND NEW ZEAlAND
0
100
200
300
400
500
H1 2012 H1 2013
’000 MT
493 471
12 FONTERRA INTERIM REPORT 2013 FONTERRA INTERIM REPORT 2013 13
asia / aME
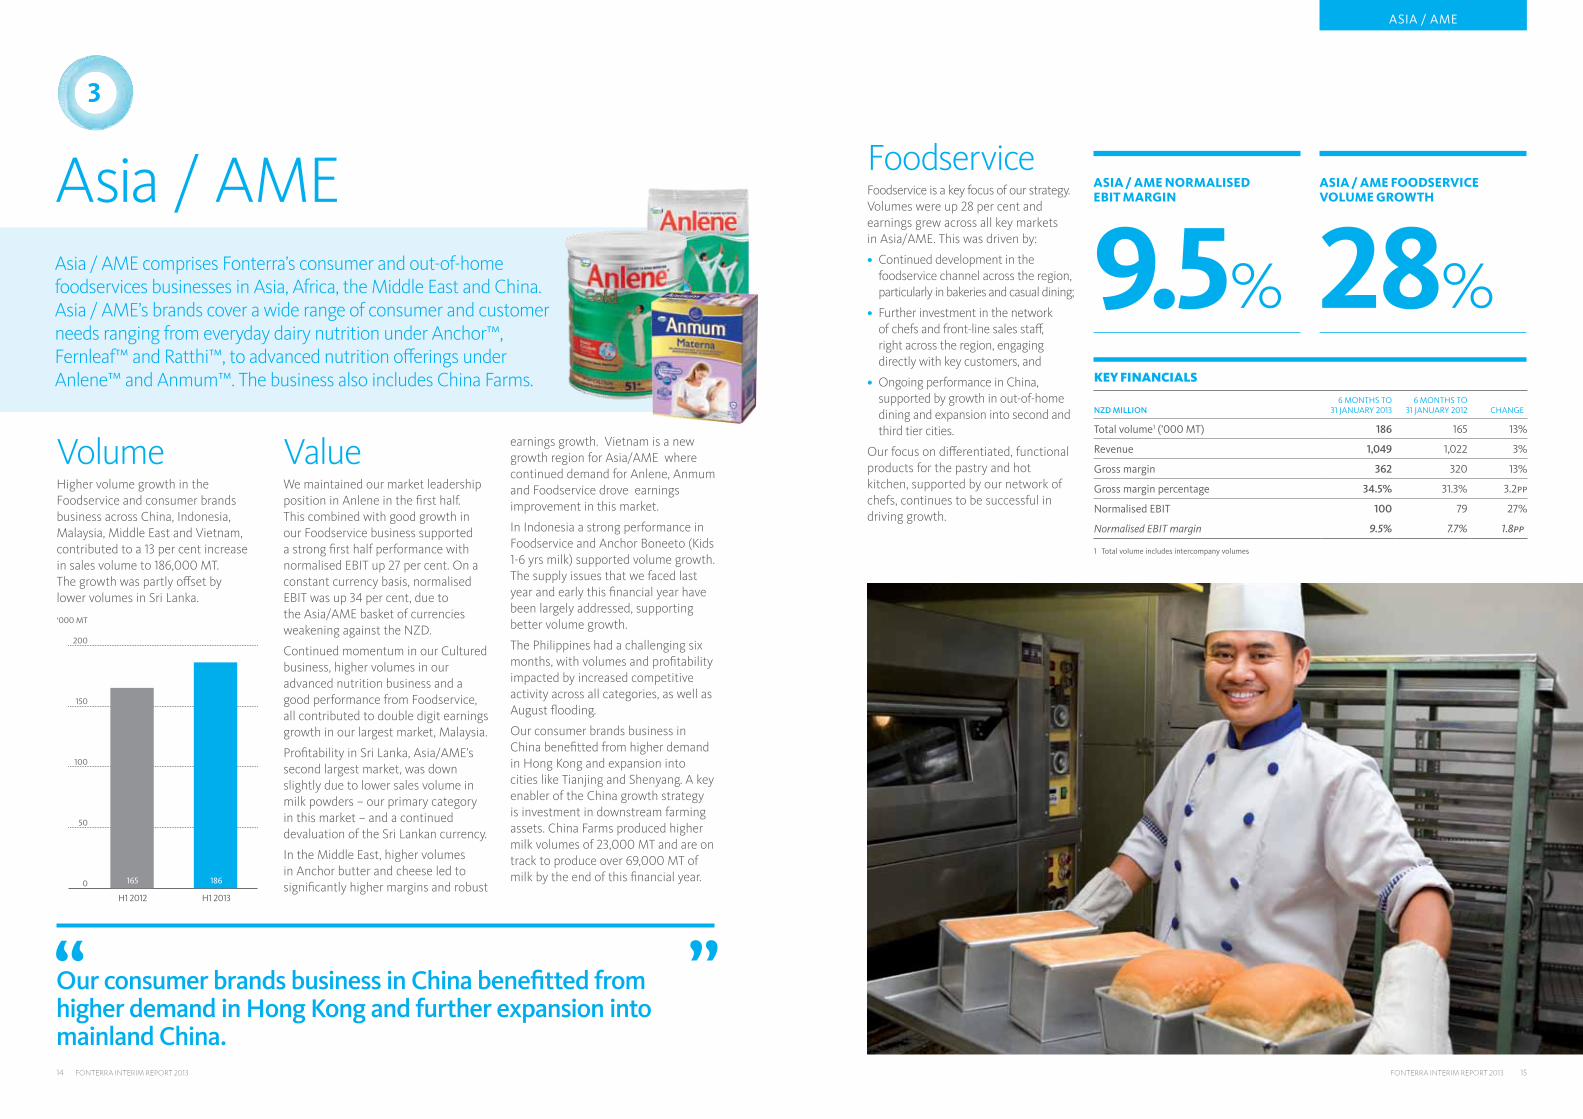
VolumeHigher volume growth in the Foodservice and consumer brands business across China, Indonesia, Malaysia, Middle East and Vietnam, contributed to a 13 per cent increase in sales volume to 186,000 MT. The growth was partly offset by lower volumes in Sri Lanka.
ValueWe maintained our market leadership position in anlene in the first half. This combined with good growth in our Foodservice business supported a strong first half performance with normalised EBIT up 27 per cent. On a constant currency basis, normalised EBIT was up 34 per cent, due to the asia/aME basket of currencies weakening against the NZD.
Continued momentum in our Cultured business, higher volumes in our advanced nutrition business and a good performance from Foodservice, all contributed to double digit earnings growth in our largest market, Malaysia.
Profitability in Sri Lanka, asia/aME’s second largest market, was down slightly due to lower sales volume in milk powders – our primary category in this market – and a continued devaluation of the Sri Lankan currency.
In the Middle East, higher volumes in anchor butter and cheese led to significantly higher margins and robust
earnings growth. Vietnam is a new growth region for asia/aME where continued demand for anlene, anmum and Foodservice drove earnings improvement in this market.
In Indonesia a strong performance in Foodservice and anchor Boneeto (Kids 1-6 yrs milk) supported volume growth. The supply issues that we faced last year and early this financial year have been largely addressed, supporting better volume growth.
The Philippines had a challenging six months, with volumes and profitability impacted by increased competitive activity across all categories, as well as august flooding.
Our consumer brands business in China benefitted from higher demand in Hong Kong and expansion into cities like Tianjing and Shenyang. a key enabler of the China growth strategy is investment in downstream farming assets. China Farms produced higher milk volumes of 23,000 MT and are on track to produce over 69,000 MT of milk by the end of this financial year.
asia / aME comprises Fonterra’s consumer and out-of-home foodservices businesses in asia, africa, the Middle East and China. asia / aME’s brands cover a wide range of consumer and customer needs ranging from everyday dairy nutrition under anchor™, Fernleaf™ and Ratthi™, to advanced nutrition offerings under anlene™ and anmum™. The business also includes China Farms.
3
Our consumer brands business in China benefitted from higher demand in Hong Kong and further expansion into mainland China.
ASIA / AME
H1 2012 H1 2013
0
50
100
150
200
‘000 MT
165 186
FoodserviceFoodservice is a key focus of our strategy. Volumes were up 28 per cent and earnings grew across all key markets in asia/aME. This was driven by:
• Continued development in the foodservice channel across the region, particularly in bakeries and casual dining;
• Further investment in the network of chefs and front-line sales staff, right across the region, engaging directly with key customers, and
• Ongoing performance in China, supported by growth in out-of-home dining and expansion into second and third tier cities.
Our focus on differentiated, functional products for the pastry and hot kitchen, supported by our network of chefs, continues to be successful in driving growth.
KEY FINANCIALS
NZD MILLION6 MONThS TO
31 JANuARY 20136 MONThS TO
31 JANuARY 2012 chANGE
Total volume1 (’000 MT) 186 165 13%
Revenue 1,049 1,022 3%
Gross margin 362 320 13%
Gross margin percentage 34.5% 31.3% 3.2pp
Normalised EBIT 100 79 27%
Normalised EBIT margin 9.5% 7.7% 1.8pp
1 Total volume includes intercompany volumes
ASIA / AME FOODSERVICE VOLUME GROWTH
28%
ASIA / AME NORMALISED EBIT MARGIN
9.5%
14 FONTERRA INTERIM REPORT 2013 FONTERRA INTERIM REPORT 2013 15
Latam
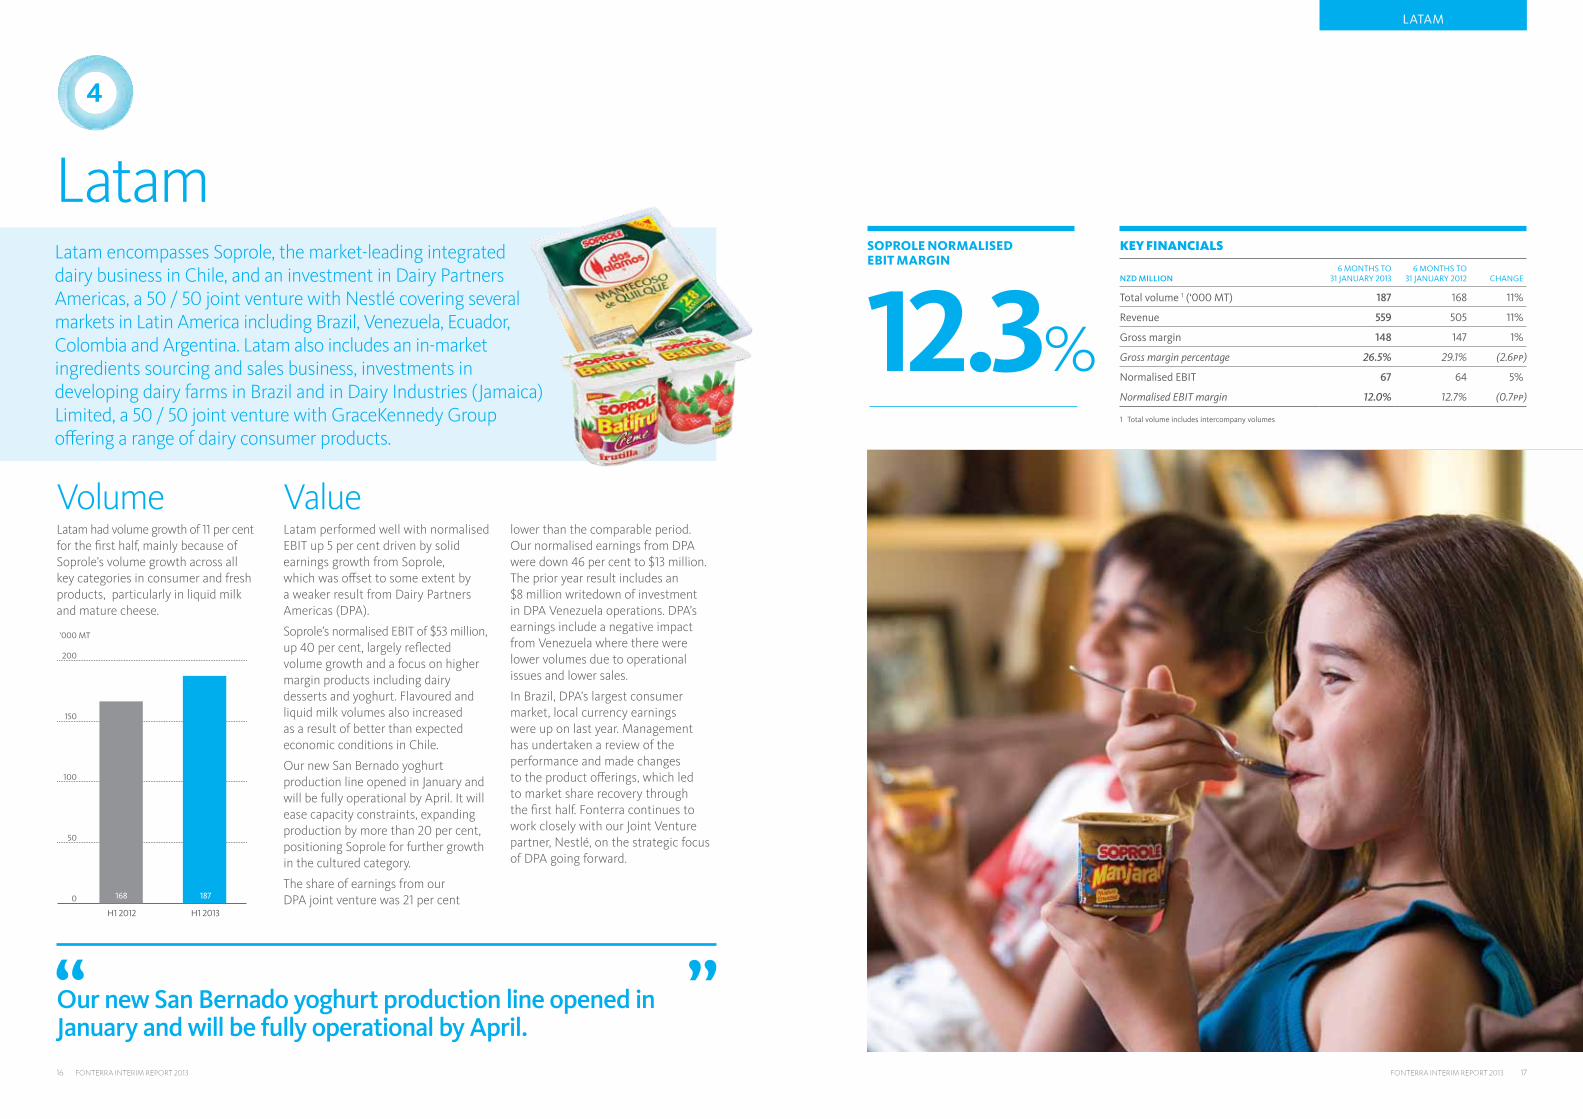
VolumeLatam had volume growth of 11 per cent for the first half, mainly because of Soprole’s volume growth across all key categories in consumer and fresh products, particularly in liquid milk and mature cheese.
ValueLatam performed well with normalised EBIT up 5 per cent driven by solid earnings growth from Soprole, which was offset to some extent by a weaker result from Dairy Partners americas (DPa).
Soprole’s normalised EBIT of $53 million, up 40 per cent, largely reflected volume growth and a focus on higher margin products including dairy desserts and yoghurt. Flavoured and liquid milk volumes also increased as a result of better than expected economic conditions in Chile.
Our new San Bernado yoghurt production line opened in January and will be fully operational by april. It will ease capacity constraints, expanding production by more than 20 per cent, positioning Soprole for further growth in the cultured category.
The share of earnings from our DPa joint venture was 21 per cent
lower than the comparable period. Our normalised earnings from DPa were down 46 per cent to $13 million. The prior year result includes an $8 million writedown of investment in DPa Venezuela operations. DPa’s earnings include a negative impact from Venezuela where there were lower volumes due to operational issues and lower sales.
In Brazil, DPa’s largest consumer market, local currency earnings were up on last year. Management has undertaken a review of the performance and made changes to the product offerings, which led to market share recovery through the first half. Fonterra continues to work closely with our Joint Venture partner, Nestlé, on the strategic focus of DPa going forward.
Latam encompasses Soprole, the market-leading integrated dairy business in Chile, and an investment in Dairy Partners americas, a 50 / 50 joint venture with Nestlé covering several markets in Latin america including Brazil, Venezuela, Ecuador, Colombia and argentina. Latam also includes an in-market ingredients sourcing and sales business, investments in developing dairy farms in Brazil and in Dairy Industries (Jamaica) Limited, a 50 / 50 joint venture with GraceKennedy Group offering a range of dairy consumer products.
Our new San Bernado yoghurt production line opened in January and will be fully operational by April.
KEY FINANCIALS
NZD MILLION6 MONThS TO
31 JANuARY 20136 MONThS TO
31 JANuARY 2012 chANGE
Total volume 1 (‘000 MT) 187 168 11%
Revenue 559 505 11%
Gross margin 148 147 1%
Gross margin percentage 26.5% 29.1% (2.6pp)
Normalised EBIT 67 64 5%
Normalised EBIT margin 12.0% 12.7% (0.7pp)
1 Total volume includes intercompany volumes
4
SOPROLE NORMALISED EBIT MARGIN
12.3%
lATAM
H1 2012 H1 2013
0
50
100
150
200
’000 MT
168 187
16 FONTERRA INTERIM REPORT 2013 FONTERRA INTERIM REPORT 2013 17

FONTERRA INTERIM REPORT 2013 19
Consolidated Interim Financial Statements.For the six months ended 31 January 2013.
Contents:Directors’ statement . . . . . . . . . . . . . . . . . . . . . . . . . . . . . . . . . . . . . . . . . . . . . . . . . 19
income statement . . . . . . . . . . . . . . . . . . . . . . . . . . . . . . . . . . . . . . . . . . . . . . . . . . . . 20
statement of comprehensive income . . . . . . . . . . . . . . . . . . . . . . . . . . . . . . . 21
statement of financial position . . . . . . . . . . . . . . . . . . . . . . . . . . . . . . . . . . . . 22
statement of changes in equity . . . . . . . . . . . . . . . . . . . . . . . . . . . . . . . . . . . . . 23
cash flow statement . . . . . . . . . . . . . . . . . . . . . . . . . . . . . . . . . . . . . . . . . . . . . . . . . 24
conDenseD statement of significant accounting policies . . . . . . . . 25
notes to the financial statements . . . . . . . . . . . . . . . . . . . . . . . . . . . . . . . . . . 26
JOhN WIlSON chairman
26 March 2013
Directors’ Statement FOR THE SIX MONTHS ENDED 31 JANUARY 2013
The Directors of Fonterra co-operative Group limited (Fonterra or the company) are pleased to present to Shareholders the financial statements for Fonterra and its subsidiaries (together the Group) and the Group’s interest in its equity accounted investees for the six months ended 31 January 2013.
The Directors are responsible for presenting financial statements for the six months which give a true and fair view of the financial position for the Group and of the financial performance and cash flows for that period.
The Directors consider the financial statements of the Group have been prepared using accounting policies which have been consistently applied and supported by reasonable judgements and estimates, and that all relevant financial reporting and accounting standards have been followed.
The Directors believe that proper accounting records have been kept which enable, with reasonable accuracy, the determination of the financial position of the Group and facilitate compliance of the financial statements with the Financial Reporting Act 1993.
The Directors consider that they have taken adequate steps to safeguard the assets of the Group, and to prevent and detect fraud and other irregularities.
The Directors hereby approve and authorise for issue the financial statements for the six months ended 31 January 2013 presented on pages 20 to 35. For and on behalf of the Board:
DAVID JAcKSON Director
26 March 2013
18 FONTERRA INTERIM REPORT 2013
INTERIM FINANcIAl STATEMENTS

The accompanying notes form part of these interim financial statements. The accompanying notes form part of these interim financial statements.
20 FONTERRA INTERIM REPORT 2013 FONTERRA INTERIM REPORT 2013 21
Income StatementFOR THE SIX MONTHS ENDED 31 JANUARY 2013
GROUP $ MILLION
SIX MONTHS TO YEAR ENDED
NOTES31 JAN 2013
UNAUDITED31 JAN 2012
UNAUDITED31 JUL 2012
AUDITED
Revenue from sale of goods 9,334 10,026 19,769
Cost of goods sold 1 (7,598) (8,451) (16,721)
Grossprofit 1,736 1,575 3,048
Other operating income 58 61 132
Selling and marketing expenses (320) (318) (568)
Distribution expenses (261) (242) (501)
Administrative expenses (378) (374) (784)
Other operating expenses (205) (182) (385)
Net foreign exchange gains/(losses) 9 (4) (7)
Share of profit of equity accounted investees 30 14 52
Profitbeforenetfinancecostsandtax 2 669 530 987
Finance income 16 18 30
Finance costs (168) (171) (340)
Netfinancecosts (152) (153) (310)
Profitbeforetax 517 377 677
Tax expense (58) (31) (53)
Profitfortheperiod 459 346 624
Profitfortheperiodisattributableto:
Equity holders of the Parent 449 339 609
Non-controlling interests 10 7 15
Profitfortheperiod 459 346 624
GROUP $
SIX MONTHS TO YEAR ENDED
31 JAN 2013 UNAUDITED
31 JAN 2012 UNAUDITED
31 JUL 2012 AUDITED
Earningspershare:
Basic and diluted earnings per share 0.29 0.24 0.42
GROUP $ MILLION
SIX MONTHS TO YEAR ENDED
31 JAN 2013 UNAUDITED
31 JAN 2012 UNAUDITED
31 JUL 2012 AUDITED
Profitfortheperiod 459 346 624
Itemsthatmaybereclassifiedsubsequentlytoprofitorloss:
Cash flow hedges:
– Net fair value gains/(losses) 221 (233) (229)
– Transferred and reported in revenue from sale of goods (185) (239) (400)
– Tax (expense)/credit on cash flow hedges (10) 132 176
Net investment hedges:
– Net fair value gains/(losses) on hedging instruments 6 (32) (33)
– Tax (expense)/credit on net investment hedges (2) 9 9
Foreign currency translation (losses)/gains attributable to equity holders (39) 29 37
Foreign currency translation reserve transferred to the income statement (1) (2) (7)
Share of equity accounted investees’ movements in reserves – – 1
Totalitemsthatmaybereclassifiedsubsequentlytoprofitorloss (10) (336) (446)
Itemsthatwillnotbereclassifiedsubsequentlytoprofitorloss:
Foreign currency translation losses attributable to non-controlling interests – – 1
Totalitemsthatwillnotbereclassifiedsubsequentlytoprofitorloss – – 1
Totalothercomprehensiveexpenserecogniseddirectlyinequity (10) (336) (445)
Totalcomprehensiveincomefortheperiod 449 10 179
Attributableto:
Equity holders of the Parent 439 3 163
Non-controlling interests 10 7 16
Totalcomprehensiveincomefortheperiod 449 10 179
Statement of Comprehensive IncomeFOR THE SIX MONTHS ENDED 31 JANUARY 2013
INTERIM FINANcIAl STATEMENTS

The accompanying notes form part of these interim financial statements. The accompanying notes form part of these interim financial statements.
22 FONTERRA INTERIM REPORT 2013 FONTERRA INTERIM REPORT 2013 23
Statement of Financial PositionAS AT 31 JANUARY 2013
GROUP $ MILLION
AS AT
NOTES31 JAN 2013
UNAUDITED31 JAN 2012
UNAUDITED31 JUL 2012
AUDITED
ASSETS
Currentassets
Cash and cash equivalents 530 684 1,033
Trade and other receivables 2,441 2,693 2,302
Inventories 4,644 5,204 2,981
Tax receivable 18 34 18
Derivative financial instruments 356 477 275
Other current assets 68 68 83
Totalcurrentassets 8,057 9,160 6,692
Non-currentassets
Property, plant and equipment 4,671 4,368 4,569
Equity accounted investments 458 446 439
Intangible assets 2,876 2,810 2,882
Deferred tax assets 88 87 99
Derivative financial instruments 142 237 198
Other non-current assets 254 210 238
Totalnon-currentassets 8,489 8,158 8,425
Totalassets 16,546 17,318 15,117
LIABILITIES
Currentliabilities
Bank overdraft 17 27 42
Borrowings 10 1,144 1,485 1,204
Trade and other payables 1,476 1,419 1,386
Owing to suppliers 1,599 2,641 1,083
Tax payable 20 14 28
Derivative financial instruments 256 50 255
Provisions 85 61 83
Other current liabilities 11 35 44
Totalcurrentliabilities 4,608 5,732 4,125
Non-currentliabilities
Borrowings 10 3,914 4,317 3,745
Derivative financial instruments 414 676 413
Provisions 87 72 81
Deferred tax liability 112 146 85
Other non-current liabilities 9 20 13
Totalnon-currentliabilities 4,536 5,231 4,337
Totalliabilities 9,144 10,963 8,462
Netassets 7,402 6,355 6,655
EQUITY
Subscribed equity 6,282 5,380 5,690
Retained earnings 1,240 979 1,078
Foreign currency translation reserve (247) (213) (211)
Cash flow hedge reserve 89 176 63
TotalequityattributabletoequityholdersoftheParent 7,364 6,322 6,620
Non-controlling interests 38 33 35
Totalequity 7,402 6,355 6,655
Statement of Changes In EquityFOR THE SIX MONTHS ENDED 31 JANUARY 2013
ATTRIBUTABLE TO EqUITY HOLDERS OF THE PARENT
GROUP $ MILLIONSUBSCRIBED
EqUITYRETAINED
EARNINGS
FOREIGN CURRENCY
TRANSLATION RESERVE
CASH FLOW HEDGE
RESERVE TOTAL
NON- CONTROLLING
INTERESTSTOTAL
EqUITY
Asat1August2012 5,690 1,078 (211) 63 6,620 35 6,655
Profit for the period – 449 – – 449 10 459
Other comprehensive (expense)/income for the period – – (36) 26 (10) – (10)
Totalcomprehensiveincome/(expense)fortheperiod – 449 (36) 26 439 10 449
Transactionswithequityholdersintheircapacityasequityholders:
Dividend paid to equity holders – (287) – – (287) – (287)
Equity instruments issued 611 – – – 611 – 611
Equity instruments surrendered (1) – – – (1) – (1)
Equity transactions costs (18) – – – (18) – (18)
Dividend paid to non-controlling interests – – – – – (7) (7)
Asat31January2013(unaudited) 6,282 1,240 (247) 89 7,364 38 7,402
Asat1August2011 5,261 943 (217) 516 6,503 38 6,541
Profit for the period – 339 – – 339 7 346
Other comprehensive income/(expense) for the period – – 4 (340) (336) – (336)
Totalcomprehensiveincome/(expense)fortheperiod – 339 4 (340) 3 7 10
Transactionswithequityholdersintheircapacityasequityholders:
Dividend paid to equity holders – (303) – – (303) – (303)
Equity instruments issued 120 – – – 120 – 120
Equity instruments surrendered (1) – – – (1) – (1)
Dividend paid to non-controlling interests – – – – – (12) (12)
Asat31January2012(unaudited) 5,380 979 (213) 176 6,322 33 6,355
Asat1August2011 5,261 943 (217) 516 6,503 38 6,541
Profit for the year – 609 – – 609 15 624
Other comprehensive income/(expense) for the year – 1 6 (453) (446) 1 (445)
Totalcomprehensiveincome/(expense)fortheyear – 610 6 (453) 163 16 179
Transactionswithequityholdersintheircapacityasequityholders:
Dividend paid to equity holders – (475) – – (475) – (475)
Equity instruments issued 584 – – – 584 – 584
Equity instruments surrendered (155) – – – (155) – (155)
Dividend paid to non-controlling interests – – – – – (19) (19)
Asat31July2012(audited) 5,690 1,078 (211) 63 6,620 35 6,655
INTERIM FINANcIAl STATEMENTS

The accompanying notes form part of these interim financial statements.
24 FONTERRA INTERIM REPORT 2013 FONTERRA INTERIM REPORT 2013 25
GROUP $ MILLION
SIX MONTHS TO YEAR ENDED
NOTES31 JAN 2013
UNAUDITED31 JAN 2012
UNAUDITED31 JUL 2012
AUDITED
CashflowsfromoperatingactivitiesProfit before net finance costs and tax 669 530 987Adjustments for:Foreign exchange losses/(gains) 2 17 16Depreciation and amortisation 264 243 492Movement in provisions 223 296 109Other (15) (17) (7)
474 539 610Increase/(decrease) in working capital:Inventories (1,857) (2,188) 307Trade and other receivables (193) (319) 196Amounts owing to suppliers 511 1,004 (567)Payables and accruals 2 12 (64)Other movements 9 39 (13)Total (1,528) (1,452) (141)Cashgeneratedfromoperations (385) (383) 1,456Net taxes paid (38) (59) (66)Netcashflowsfromoperatingactivities (423) (442) 1,390
CashflowsfrominvestingactivitiesCash was provided from:– Proceeds from sale of Group entities and other business operations 5 – –– Proceeds from disposal of property, plant and equipment 3 7 11– Other cash inflows (3) 26 26Cash was applied to:– Acquisition of Group entities and other business operations (49) (3) –– Acquisition of property, plant and equipment, and intangible assets (390) (322) (857)– Other cash outflows (4) (2) (6)Netcashflowsfrominvestingactivities (438) (294) (826)
CashflowsfromfinancingactivitiesCash was provided from:– Proceeds from borrowings 10 1,292 1,317 2,215– Proceeds from issue of equity instruments 652 128 505– Interest received 18 17 31– Other cash inflows – 13 57Cash was applied to:– Repayment of borrowings 10 (1,078) (313) (2,097)– Surrender of equity instruments – (1) (155)– Dividends paid to equity holders of the Parent (287) (303) (475)– Interest paid (180) (224) (406)– Equity transaction costs 5 (18) – –– Other cash outflows (15) (13) (24)Netcashflowsfromfinancingactivities 384 621 (349)Net(decrease)/increaseincashandcashequivalents (477) (115) 215Cash and cash equivalents at the beginning of the period 991 762 762Effect of exchange rate changes on cash balances (1) 10 14Cashandcashequivalentsattheendoftheperiod 513 657 991Reconciliationofclosingcashbalancestothestatementoffinancialposition:Cash and cash equivalents 530 684 1,033Bank overdraft (17) (27) (42)Closingcashbalances 513 657 991
Cash Flow StatementFOR THE SIX MONTHS ENDED 31 JANUARY 2013
Condensed Statement of Significant accounting PoliciesFOR THE SIX MONTHS ENDED 31 JANUARY 2013
A) GENERAL INfORMATION
Fonterra co-operative Group limited (Fonterra or the company) is a co-operative company incorporated and domiciled in New Zealand. Fonterra is registered under the companies Act 1993 and the co-operative companies Act 1996, and is an issuer for the purposes of the Financial Reporting Act 1993. Fonterra is also required to comply with the Dairy Industry Restructuring Act 2001.
These consolidated interim financial statements of Fonterra, as at and for the six months ended 31 January 2013, comprise Fonterra and its subsidiaries (together the Group) and the Group’s interest in its equity accounted investees.
The Group is primarily involved in the collection, manufacture and sale of milk and milk derived products and is a profit oriented entity.
b) bAsIs Of PREPARATION
These consolidated interim financial statements comply with New Zealand Generally Accepted Accounting Practice (NZ GAAP) and have been prepared in accordance with New Zealand Equivalent to International Accounting Standard 34: Interim Financial Reporting. These consolidated interim financial statements also comply with International Accounting Standard 34: Interim Financial Reporting. These statements should be read in conjunction with the consolidated financial statements for the year ended 31 July 2012.
In November 2012, Fonterra launched Trading Among Farmers (“TAF”). TAF will enable Farmer Shareholders to trade Shares among themselves and will result in permanent capital for Fonterra. Refer to Note 5 Equity Instruments and Note 8 New Group Entities for further information.
These consolidated interim financial statements are presented in New Zealand dollars ($), which is the company’s functional currency. All financial information has been rounded to the nearest million, except where otherwise stated.
Interim income tax is calculated based on the best estimate of the full year effective tax rate taking into account profit before tax, the tax effect of distributions to shareholders and the impact of recognition and de-recognition of deferred tax.
c) chANGE IN AccOUNTING POLIcy
Fonterra adopted the Amendments to various existing New Zealand International Financial Reporting Standards (“harmonisation Amendments”) during the year ended 31 July 2012. One of the changes the harmonisation Amendments introduced was the option to use the indirect method of presenting cash flows from operating activities in the cash Flow Statement. The Board has concluded that the indirect method provides users of the financial statements with more relevant information on the key factors influencing Fonterra’s operating cash flows, and therefore, for the six months ended 31 January 2013, Fonterra has changed its accounting policy to use the indirect method of presenting cash flows from operating activities. This change in accounting policy has been applied retrospectively and the comparative figures in the cash Flow Statement have been updated to use the indirect method. This change in accounting policy is presentational only.
D) cOMPARATIvE fIGUREs
Where a change in the presentational format of the financial statements has been made during the period, comparative figures have been restated accordingly. Where material, additional disclosure has been provided in the notes to these consolidated interim financial statements.
E) NEw AccOUNTING POLIcIEs AND AMENDED INTERNATIONAL fINANcIAL REPORTING sTANDARDs
Except for the change in accounting policy outlined in c) above, the same accounting policies are followed in these consolidated interim financial statements as were applied in the Group’s financial statements for the year ended 31 July 2012.
The Group adopted the amendments to NZ IAS 1: Presentation of Financial Statements during the period. This has resulted in a change in presentation in the Statement of comprehensive Income to show whether items of other comprehensive income are subsequently reclassified to profit or loss.
INTERIM FINANcIAl STATEMENTS

26 FONTERRA INTERIM REPORT 2013 FONTERRA INTERIM REPORT 2013 27
Notes to the Financial StatementsFOR THE SIX MONTHS ENDED 31 JANUARY 2013
1 cOsT Of GOODs sOLD
GROUP $ MILLION
SIX MONTHS TO YEAR ENDED
31 JAN 2013 UNAUDITED
31 JAN 2012 UNAUDITED
31 JUL 2012 AUDITED
Opening inventory 2,981 3,277 3,277
Cost of Milk:
– New Zealand sourced 5,382 6,394 9,033
– Non-New Zealand sourced 573 640 1,148
Other purchases 3,306 3,344 6,244
Closing inventory (4,644) (5,204) (2,981)
Totalcostofgoodssold 7,598 8,451 16,721
2 PROfIT bEfORE NET fINANcE cOsTs AND TAx
GROUP $ MILLION
SIX MONTHS TO YEAR ENDED
31 JAN 2013 UNAUDITED
31 JAN 2012 UNAUDITED
31 JUL 2012 AUDITED
The following items have been included in arriving at profit before net finance costs and tax:
Operating lease expense 36 37 73
Research and development costs 40 45 93
Net loss on disposal of investments – 2 –
Donations – – 3
Research and development grants received from government (2) (3) (9)
Total employee benefits expense 892 847 1,704
Included in employee benefits expense are contributions to defined contribution plans 28 27 54
3 sEGMENT REPORTING
The Group operates predominantly in the international dairy industry.
The Group has four reportable segments that are defined by product type and geographic area to reflect how the Group’s operations are managed.
The reportable segments presented reflect the Group’s management and reporting structure as viewed by the Fonterra Management Team, which is the Group’s chief operating decision maker.
Transactions between segments are based on estimated market prices.
On 1 August 2012, Fonterra’s organisational structure was re-aligned. As a result, certain operations were placed under the control of different business units. These changes have had the following impact on Fonterra’s reported segments:
– RD1 has been moved from New Zealand Milk Products to ANZ;
– International farming ventures has been moved from New Zealand Milk Products to Asia/AME (international farming ventures in China) and Latam (international farming ventures in South America).
Certain functions within New Zealand Milk Products have also been renamed.
Comparatives have been restated to reflect these changes.
REPORTAbLE sEGMENTs DEscRIPTION
New Zealand Milk Products Represents the collection, processing and distribution of New Zealand milk, global sales and marketing of New Zealand and non-New Zealand milk products, Fonterra Nutrition, Group Strategy & Optimisation, Co-operative Affairs and Group Services.
ANZ Represents Fast Moving Consumer Goods (FMCG) operations in New Zealand (including export to the Pacific Islands) and all FMCG and Ingredients operations in Australia (including Milk Supply and Manufacturing). It includes foodservice sales in Australia and New Zealand (except for foodservice sales to Quick Service Restaurants), and RD1.
Asia/AME Represents FMCG operations in Asia (excluding North Asia), Africa and the Middle East, and foodservice sales in Asia/AME and China. It includes international farming ventures in China.
Latam Represents FMCG operations in Chile and equity accounted investments in South America. It includes international farming ventures in South America.
a) Segmentincome
GROUP $ MILLION
NEW ZEALAND MILK
PRODUCTS ANZ ASIA/AME LATAM ELIMINATIONSTOTAL
GROUP
Segmentincomestatement
Six months ended 31 January 2013 (unaudited)
External revenue 6,052 1,676 1,048 558 – 9,334
Inter-segment revenue 710 342 1 1 (1,054) –
Revenuefromsaleofgoods 6,762 2,018 1,049 559 (1,054) 9,334
Segmentgrossprofit 797 423 362 148 6 1,736
Selling and marketing expenses (42) (79) (172) (27) – (320)
Distribution expenses (95) (107) (19) (40) – (261)
Administrative and other operating expenses (305) (171) (89) (27) 9 (583)
Segmentoperatingexpenses (442) (357) (280) (94) 9 (1,164)
Segmentearningsbeforenetfinancecostsandtax 422 74 100 67 6 669
Normalisation adjustments – 24 – – – 24
Normalisedsegmentearningsbeforenetfinancecostsandtax 422 98 100 67 6 693
Normalisation adjustments (24)
Finance income 16
Finance costs (168)
Profitbeforetaxfortheyear 517
Profit before tax for the year includes the following amounts:
Depreciation (164) (38) (7) (13) – (222)
Amortisation (33) (7) (2) – – (42)
Share of profit of equity accounted investees 25 1 – 4 – 30
Other income from equity accounted investees 1 1 – 10 – 12
Normalisation adjustments consist of the following amounts:
Costs associated with closure of Cororooke plant in Australia1 – 24 – – – 24
Segment asset information:
As at and for the six months ended 31 January 2013
Equity accounted investments 215 29 – 214 – 458
Capital expenditure 302 91 21 13 – 427
1 Of the $24 million normalisation adjustment, $21 million related to administrative and other operating expenses and $3 million to cost of goods sold.
NOTES TO ThE FINANcIAl STATEMENTS

28 FONTERRA INTERIM REPORT 2013 FONTERRA INTERIM REPORT 2013 29
Notes to the Financial Statements CONTINUEDFOR THE SIX MONTHS ENDED 31 JANUARY 2013
3 sEGMENT REPORTING continued
GROUP $ MILLION
NEW ZEALAND MILK
PRODUCTS ANZ ASIA/AME LATAM ELIMINATIONSTOTAL
GROUP
Segmentincomestatement
Six months ended 31 January 2012 (unaudited)
External revenue 6,653 1,852 1,020 501 – 10,026
Inter-segment revenue 907 399 2 4 (1,312) –
Revenuefromsaleofgoods 7,560 2,251 1,022 505 (1,312) 10,026
Segmentgrossprofit 617 482 320 147 9 1,575
Selling and marketing expenses (42) (78) (151) (47) – (318)
Distribution expenses (84) (109) (20) (29) – (242)
Administrative and other operating expenses (307) (152) (70) (33) 6 (556)
Segmentoperatingexpenses (433) (339) (241) (109) 6 (1,116)
Segmentearningsbeforenetfinancecostsandtax 242 144 79 56 9 530
Normalisation adjustments 13 1 – 8 – 22
Normalisedsegmentearningsbeforenetfinancecostsandtax 255 145 79 64 9 552
Normalisation adjustments (22)
Finance income 18
Finance costs (171)
Profitbeforetaxfortheyear 377
Profit before tax for the year includes the following amounts:
Depreciation (154) (36) (4) (11) – (205)
Amortisation (32) (5) (1) – – (38)
Share of profit of equity accounted investees 3 1 – 10 – 14
Other income from equity accounted investees 1 – – 8 – 9
Normalisation adjustments consist of the following amounts:
Impairment losses recorded in equity accounted investees 12 – – 8 – 20
Other 1 1 – – – 2
Totalnormalisationadjustments 13 1 – 8 – 22
Segment asset information:
As at and for the six months ended 31 January 2012
Equity accounted investments 188 21 – 237 – 446
Capital expenditure 201 81 22 24 – 328
GROUP $ MILLION
NEW ZEALAND MILK
PRODUCTS ANZ ASIA/AME LATAM ELIMINATIONSTOTAL
GROUP
Segmentincomestatement
Year ended 31 July 2012 (audited)
External revenue 13,228 3,538 1,998 1,005 – 19,769
Inter-segment revenue 1,764 761 3 5 (2,533) –
Revenuefromsaleofgoods 14,992 4,299 2,001 1,010 (2,533) 19,769
Segmentgrossprofit 1,285 869 648 260 (14) 3,048
Selling and marketing expenses (81) (144) (288) (55) – (568)
Distribution expenses (188) (215) (37) (61) – (501)
Administrative and other operating expenses (665) (313) (148) (60) 17 (1,169)
Segmentoperatingexpenses (934) (672) (473) (176) 17 (2,238)
Segmentearningsbeforenetfinancecostsandtax 477 218 182 124 (14) 987
Normalisation adjustments 24 9 – 8 – 41
Normalisedsegmentearningsbeforenetfinancecostsandtax 501 227 182 132 (14) 1,028
Normalisation adjustments (41)
Finance income 30
Finance costs (340)
Profitbeforetaxfortheyear 677
Profit before tax for the year includes the following amounts:
Depreciation (304) (72) (10) (24) – (410)
Amortisation (66) (12) (3) (1) – (82)
Share of profit of equity accounted investees 40 9 – 3 – 52
Other income from equity accounted investees 1 – – 38 – 39
Normalisation adjustments consist of the following amounts:
Impairment losses recorded in equity accounted investees – – – 8 – 8
Restructuring costs associated with the Group Strategy Refresh 23 7 – – – 30
Other 1 2 – – – 3
Totalnormalisationadjustments 24 9 – 8 – 41
Segment asset information:
As at and for the year ended 31 July 2012
Equity accounted investments 196 29 – 214 – 439
Capital expenditure 586 192 57 53 – 888
NOTES TO ThE FINANcIAl STATEMENTS

30 FONTERRA INTERIM REPORT 2013 FONTERRA INTERIM REPORT 2013 31
3 sEGMENT REPORTING continued
b) Revenue
GROUP $ MILLION
SIX MONTHS TO YEAR ENDED
31 JAN 2013 UNAUDITED
31 JAN 2012 UNAUDITED
31 JUL 2012 AUDITED
Entity wide products and services:
Consumer goods 2,406 2,527 4,945
Ingredients and other revenue 6,928 7,499 14,824
Revenuefromsaleofgoods 9,334 10,026 19,769
GROUP $ MILLION
EUROPE CHINA REST OF ASIA AUSTRALIANEW
ZEALAND USAREST OF WORLD TOTAL
Geographical segment external revenue:
Sixmonthsended31January2013 513 1,283 2,553 1,019 968 704 2,294 9,334
Six months ended 31 January 2012 488 872 2,911 1,193 1,021 857 2,684 10,026
Year ended 31 July 2012 1,169 2,031 5,676 2,300 1,928 1,445 5,220 19,769
Revenue is allocated to geographical segments on the basis of the destination of the goods sold.
c) Non-currentassets
GROUP $ MILLION
NEW ZEALAND MILK PRODUCTS ANZ
NEW ZEALAND
REST OF WORLD
NEW ZEALAND AUSTRALIA ASIA/AME LATAM TOTAL
Geographical segment reportable non-current assets:
Asat31January2013 4,044 289 1,467 1,024 864 571 8,259
As at 31 January 2012 3,784 283 1,372 1,028 795 572 7,834
As at 31 July 2012 3,950 267 1,394 1,087 858 572 8,128
GROUP $ MILLION
SIX MONTHS TO YEAR ENDED
31 JAN 2013 UNAUDITED
31 JAN 2012 UNAUDITED
31 JUL 2012 AUDITED
Reconciliation of geographical segment non-current assets to total non-current assets:
Geographical segment non-current assets 8,259 7,834 8,128
Deferred tax asset 88 87 99
Derivative financial instruments 142 237 198
Totalnon-currentassets 8,489 8,158 8,425
4 cONTINGENT LIAbILITIEs
In the normal course of business, Fonterra, its subsidiaries and equity accounted investments are exposed to claims, legal proceedings and arbitrations that may in some cases result in costs to the Group. The Directors believe that these have been adequately provided for and appropriately disclosed by the Group.
In October 2012, the purchaser of the Group’s former Western Australian dairy business made warranty claims, as disclosed the Fonterra Shareholders’ Fund Prospectus and Investment Statement, of AuD 103 million. The claimant subsequently revised their total claim and confirmed it as being AuD 42 million. The claim is in dispute and the dispute resolution process set out in the transaction documentation has been triggered. Based on currently available information, and claims made to date, Fonterra will vigorously defend its position and does not believe that it is likely these claims will result in a material obligation.
The Group has no contingent liabilities as at 31 January 2013 (31 January 2012: nil; 31 July 2012: nil). There are no additional legal proceedings or arbitrations that are pending at the date of these interim financial statements that require provision or disclosure.
Notes to the Financial Statements CONTINUEDFOR THE SIX MONTHS ENDED 31 JANUARY 2013
5 sUbscRIbED EqUITy INsTRUMENTs
Subscribed equity instruments include co-operative shares and units in the Fonterra Shareholders Fund.
cO-OPERATIvE shAREs, INcLUDING shAREs hELD wIThIN ThE GROUP
CO-OPERATIVE SHARES (THOUSANDS)
Balanceat1August2012 1,501,784
Shares issued 115,695
Shares surrendered (99)
Balanceat31January2013(unaudited) 1,617,380
Balanceat1 August2011 1,406,945
Shares issued 26,577
Shares surrendered (302)
Balanceat31January2012(unaudited) 1,433,220
Balanceat1August2011 1,406,945
Shares issued 129,157
Shares surrendered (34,318)
Balanceat31July2012(audited) 1,501,784
co-operative shares may only be held by a Shareholder supplying milk to the company in a season (“Shareholder supplier”) and Fonterra Farmer custodian limited (“the custodian”). Rights attaching to co-operative shares1 include:
– voting rights when backed by milk supply;
– the right to receive the share-backed milk price on each kgMS produced by the Shareholder supplier;
– rights to any distributions declared by the Board; and
– rights to share in any surplus on liquidation of the company.
Shareholdersuppliers
The company maintains a share standard that requires a Shareholder supplier to hold one co-operative share for each kilogram of milksolids supplied to the company by that Shareholder supplier on average over the three preceding seasons2 (excluding milk supplied under contract supply in that season)3. Shareholder suppliers are permitted to hold more or fewer co-operative shares than required by the share standard in certain circumstances. Shareholder suppliers supplying under contract must hold at least 1,000 co-operative shares.
In addition to co-operative shares held under the share standard, Shareholder suppliers are able to hold further co-operative shares up to 100% of production (where production is defined as the minimum number of co-operative shares a Shareholder supplier is required to hold under the share standard). No Shareholder supplier (including its related parties) is allowed to hold interests in co-operative Shares, not backed by milk supply, exceeding 5% of the total number of co-operative shares on issue.
Shareholder suppliers are permitted to meet the requirements of the share standard over a three year period, with one third of the required holding of co-operative shares to be held in the first Season, two thirds in the second Season, with the share standard to be met in the third Season.
Voting rights in the company are dependent on milk supply supported by co-operative shares held. A Shareholder supplier is entitled on a poll or postal vote, to one vote per 1,000 kilograms of milksolids if that Shareholder supplier holds a co-operative share for each of those kilograms of milksolids. The amount of milksolids that support voting rights are measured at 31 May, the season end date4. As at the season end date, 31 May 2012, the aggregate milksolids eligible for voting was 1,463,000,000 kilograms of milksolids (31 May 2011: 1,320,000,000 kilograms of milksolids).
Shareholder suppliers are able to buy and sell co-operative shares directly on the Fonterra Shareholders’ Market. Shareholders may elect to sell the economic rights of some of their co-operative shares to the Fonterra Shareholders’ Fund (“the Fund”), subject to an individual limit set by the Board within an overall individual limit set out in the company’s constitution. On the sale of an economic right of a co-operative share to the Fund, a Shareholder supplier transfers the legal title to the co-operative share to the custodian. Where the co-operative share transferred was backed by milk supply, the Shareholder supplier is issued a voucher by the custodian (subject to limits).
TheCustodian
The custodian holds legal title of co-operative shares of which the economic rights have been sold to the Fund on trusts for the benefit of the Fund. At 31 January 2013, 95,689,000 co-operative shares were legally owned by the custodian, on trusts for the benefit of the Fund.
1 These rights are also attached to vouchers when backed by milk supply (subject to limits).
2 This requirement commences from 1 June 2013. Prior to this date, the requirement is based on kilograms of milksolids supplied for the previous season.
3 The Fonterra Board may permit the share standard to be satisfied through the holding of both Co-operative shares and vouchers.
4 Aggregate milksolids eligible for voting at season end date are adjusted for Shareholder suppliers who have joined the Co-operative or are no longer supplying milk to the Co-operative in the period between the season end date and the record date for the meeting at which the vote is to be held.
NOTES TO ThE FINANcIAl STATEMENTS
32 FONTERRA INTERIM REPORT 2013 FONTERRA INTERIM REPORT 2013 33
5 sUbscRIbED EqUITy INsTRUMENTs continued
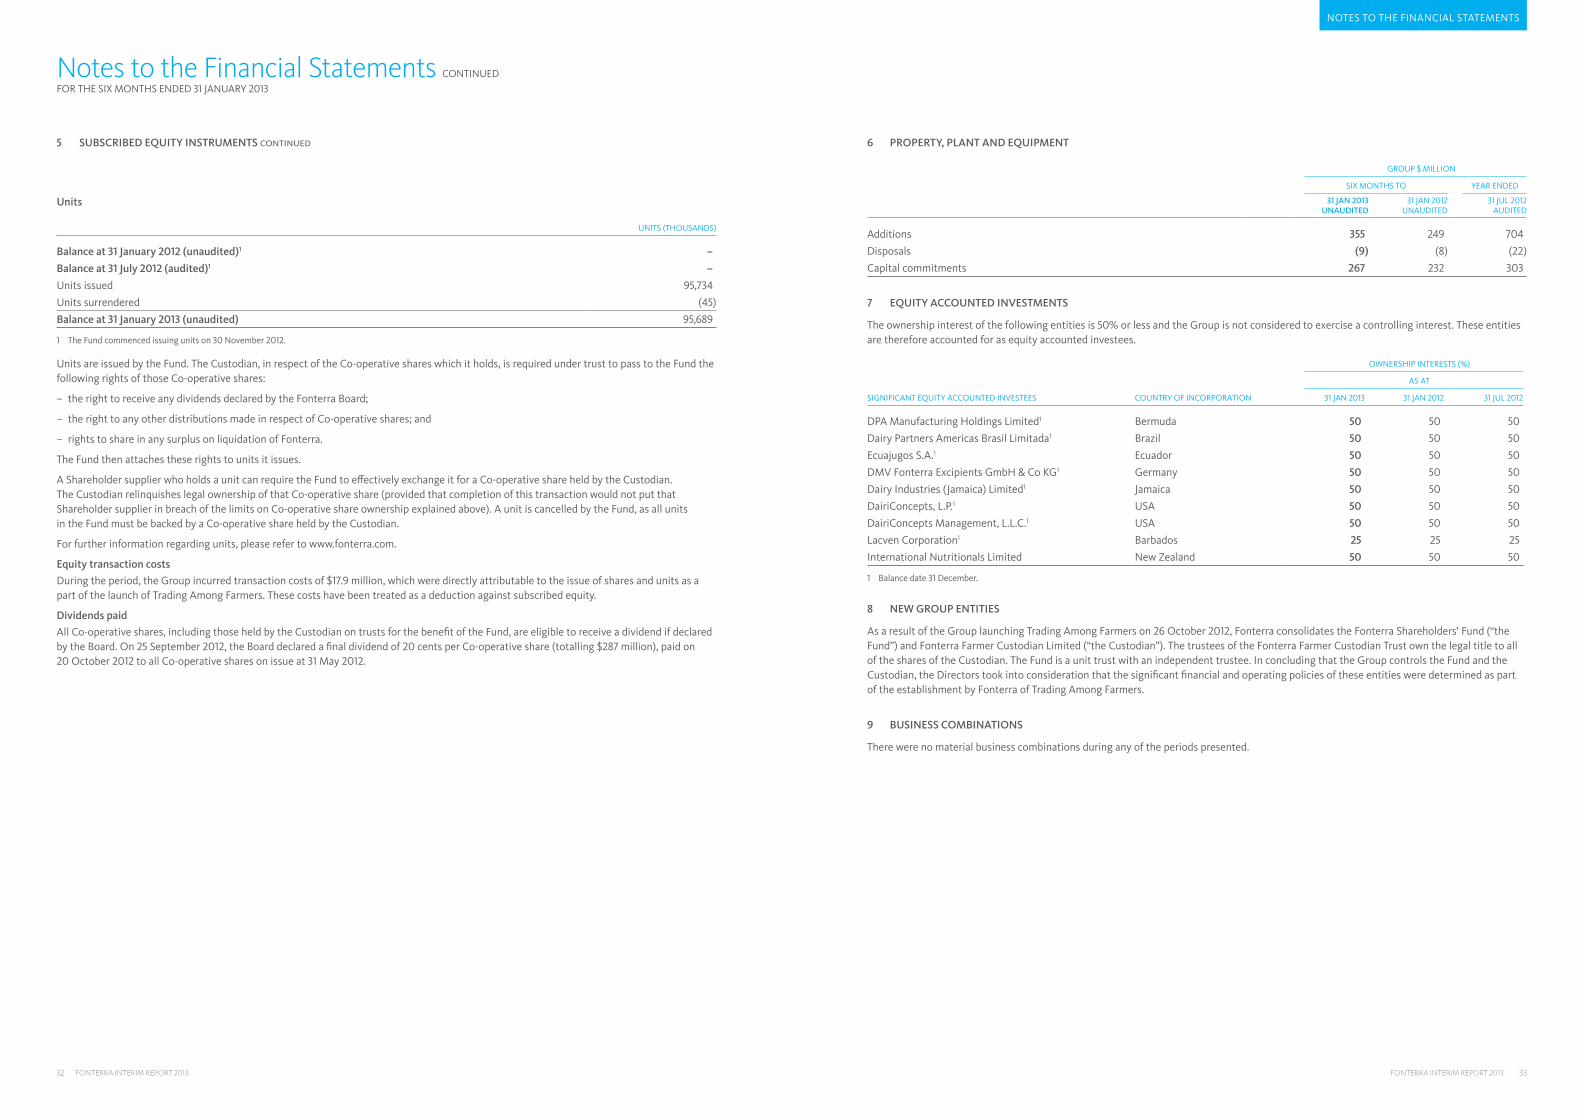
Units
UNITS (THOUSANDS)
Balanceat31January2012(unaudited)1 –
Balanceat31July2012(audited)1 –
Units issued 95,734
Units surrendered (45)
Balanceat31January2013(unaudited) 95,689
1 The Fund commenced issuing units on 30 November 2012.
units are issued by the Fund. The custodian, in respect of the co-operative shares which it holds, is required under trust to pass to the Fund the following rights of those co-operative shares:
– the right to receive any dividends declared by the Fonterra Board;
– the right to any other distributions made in respect of co-operative shares; and
– rights to share in any surplus on liquidation of Fonterra.
The Fund then attaches these rights to units it issues.
A Shareholder supplier who holds a unit can require the Fund to effectively exchange it for a co-operative share held by the custodian. The custodian relinquishes legal ownership of that co-operative share (provided that completion of this transaction would not put that Shareholder supplier in breach of the limits on co-operative share ownership explained above). A unit is cancelled by the Fund, as all units in the Fund must be backed by a co-operative share held by the custodian.
For further information regarding units, please refer to www.fonterra.com.
Equitytransactioncosts
During the period, the Group incurred transaction costs of $17.9 million, which were directly attributable to the issue of shares and units as a part of the launch of Trading Among Farmers. These costs have been treated as a deduction against subscribed equity.
Dividendspaid
All co-operative shares, including those held by the custodian on trusts for the benefit of the Fund, are eligible to receive a dividend if declared by the Board. On 25 September 2012, the Board declared a final dividend of 20 cents per co-operative share (totalling $287 million), paid on 20 October 2012 to all co-operative shares on issue at 31 May 2012.
Notes to the Financial Statements CONTINUEDFOR THE SIX MONTHS ENDED 31 JANUARY 2013
6 PROPERTy, PLANT AND EqUIPMENT
GROUP $ MILLION
SIX MONTHS TO YEAR ENDED
31 JAN 2013 UNAUDITED
31 JAN 2012 UNAUDITED
31 JUL 2012 AUDITED
Additions 355 249 704
Disposals (9) (8) (22)
capital commitments 267 232 303
7 EqUITy AccOUNTED INvEsTMENTs
The ownership interest of the following entities is 50% or less and the Group is not considered to exercise a controlling interest. These entities are therefore accounted for as equity accounted investees.
OWNERSHIP INTERESTS (%)
AS AT
SIGNIFICANT EqUITY ACCOUNTED INVESTEES COUNTRY OF INCORPORATION 31 JAN 2013 31 JAN 2012 31 JUL 2012
DPA Manufacturing Holdings Limited1 Bermuda 50 50 50
Dairy Partners Americas Brasil Limitada1 Brazil 50 50 50
Ecuajugos S.A.1 Ecuador 50 50 50
DMV Fonterra Excipients GmbH & Co KG1 Germany 50 50 50
Dairy Industries (Jamaica) Limited1 Jamaica 50 50 50
DairiConcepts, L.P.1 USA 50 50 50
DairiConcepts Management, L.L.C.1 USA 50 50 50
Lacven Corporation1 Barbados 25 25 25
International Nutritionals Limited New Zealand 50 50 50
1 Balance date 31 December.
8 NEw GROUP ENTITIEs
As a result of the Group launching Trading Among Farmers on 26 October 2012, Fonterra consolidates the Fonterra Shareholders’ Fund (“the Fund”) and Fonterra Farmer Custodian Limited (“the Custodian”). The trustees of the Fonterra Farmer Custodian Trust own the legal title to all of the shares of the Custodian. The Fund is a unit trust with an independent trustee. In concluding that the Group controls the Fund and the Custodian, the Directors took into consideration that the significant financial and operating policies of these entities were determined as part of the establishment by Fonterra of Trading Among Farmers.
9 bUsINEss cOMbINATIONs
There were no material business combinations during any of the periods presented.
NOTES TO ThE FINANcIAl STATEMENTS
34 FONTERRA INTERIM REPORT 2013 FONTERRA INTERIM REPORT 2013 35
Notes to the Financial Statements CONTINUEDFOR THE SIX MONTHS ENDED 31 JANUARY 2013
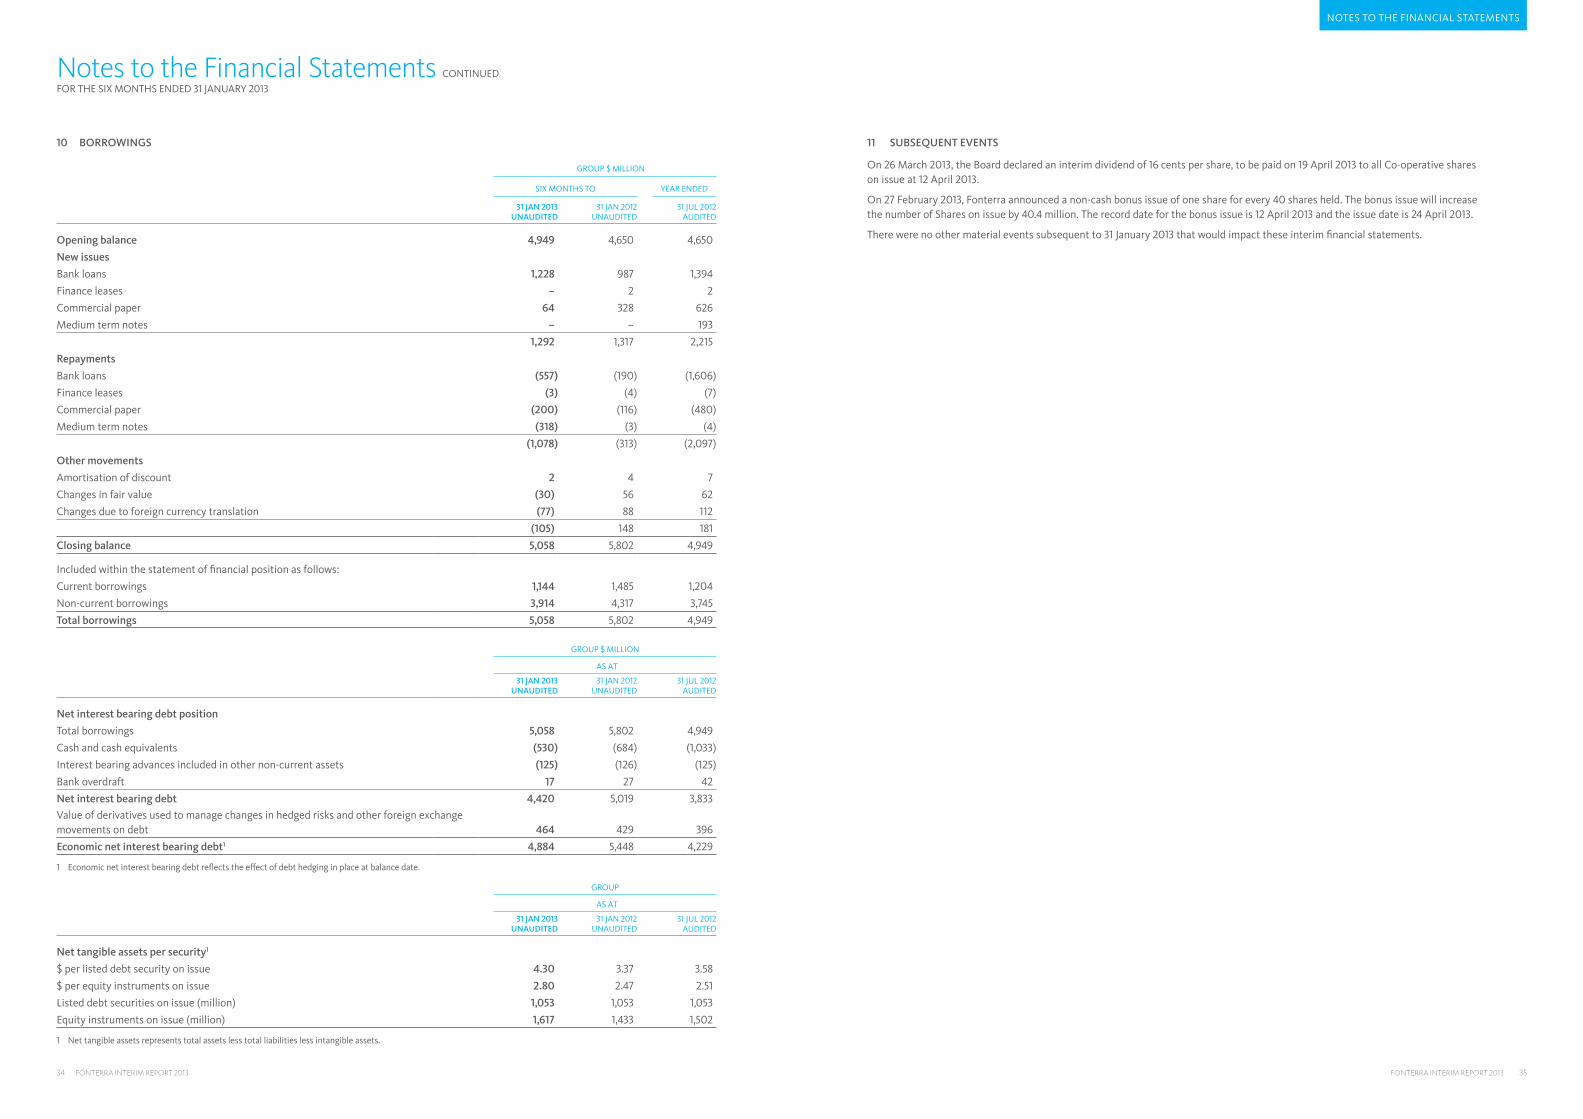
10 bORROwINGs
GROUP $ MILLION
SIX MONTHS TO YEAR ENDED
31 JAN 2013 UNAUDITED
31 JAN 2012 UNAUDITED
31 JUL 2012 AUDITED
Openingbalance 4,949 4,650 4,650
Newissues
Bank loans 1,228 987 1,394
Finance leases – 2 2
Commercial paper 64 328 626
Medium term notes – – 193
1,292 1,317 2,215
Repayments
Bank loans (557) (190) (1,606)
Finance leases (3) (4) (7)
Commercial paper (200) (116) (480)
Medium term notes (318) (3) (4)
(1,078) (313) (2,097)
Othermovements
Amortisation of discount 2 4 7
Changes in fair value (30) 56 62
Changes due to foreign currency translation (77) 88 112
(105) 148 181
Closingbalance 5,058 5,802 4,949
Included within the statement of financial position as follows:
Current borrowings 1,144 1,485 1,204
Non-current borrowings 3,914 4,317 3,745
Totalborrowings 5,058 5,802 4,949
GROUP $ MILLION
AS AT
31 JAN 2013 UNAUDITED
31 JAN 2012 UNAUDITED
31 JUL 2012 AUDITED
Netinterestbearingdebtposition
Total borrowings 5,058 5,802 4,949
Cash and cash equivalents (530) (684) (1,033)
Interest bearing advances included in other non-current assets (125) (126) (125)
Bank overdraft 17 27 42
Netinterestbearingdebt 4,420 5,019 3,833
Value of derivatives used to manage changes in hedged risks and other foreign exchange movements on debt 464 429 396
Economicnetinterestbearingdebt1 4,884 5,448 4,229
1 Economic net interest bearing debt reflects the effect of debt hedging in place at balance date.
GROUP
AS AT
31 JAN 2013 UNAUDITED
31 JAN 2012 UNAUDITED
31 JUL 2012 AUDITED
Nettangibleassetspersecurity1
$ per listed debt security on issue 4.30 3.37 3.58
$ per equity instruments on issue 2.80 2.47 2.51
Listed debt securities on issue (million) 1,053 1,053 1,053
Equity instruments on issue (million) 1,617 1,433 1,502
1 Net tangible assets represents total assets less total liabilities less intangible assets.
11 sUbsEqUENT EvENTs
On 26 March 2013, the Board declared an interim dividend of 16 cents per share, to be paid on 19 April 2013 to all co-operative shares on issue at 12 April 2013.
On 27 February 2013, Fonterra announced a non-cash bonus issue of one share for every 40 shares held. The bonus issue will increase the number of Shares on issue by 40.4 million. The record date for the bonus issue is 12 April 2013 and the issue date is 24 April 2013.
There were no other material events subsequent to 31 January 2013 that would impact these interim financial statements.
NOTES TO ThE FINANcIAl STATEMENTS


PRINTED uSING 100% MINERAl FREE INKS.ThIS DOcuMENT IS PRINTED ON AN ENVIRONMENTAllY RESPONSIBlE PAPER PRODucED uSING ElEMENTAl chlORINE FREE (EcF) FSc® cERTIFIED MIxED SOuRcE PulP, SOuRcED FROM WEll MANAGED AND lEGAllY hARVESTED FORESTS, AND MANuFAcTuRED uNDER ThE STRIcT ISO14001 ENVIRONMENTAl MANAGEMENT SYSTEM.
FONTERRA cO-OPERATIVE GROuP lIMITED PRIVATE BAG 92032 AucKlAND 1142 NEW ZEAlAND64 9 374 9000 (PhONE) 64 9 374 9001 (FAx)ShAREhOlDER AND SuPPlIER SERVIcES FREEPhONE 0800 65 65 68FOR GlOBAl lOcATIONS VISIT WWW.FONTERRA.cOM