fonterra interim report - the new zealand...
TRANSCRIPT

fonterra co-operative group liMiteD
fonterra interim report 2010

Contents
HaLf Year HiGHLiGHtS 1
cHairman / ceo review 2
conSoLiDateD interim financiaL StatementS 14
noteS to tHe conSoLiDateD interim financiaL StatementS 21
«cover: crawford Street coolStore, waikato
Fonterra’s new Crawford Street Coolstore in Hamilton, one of the largest in Australasia, has capacity to hold more than 50,000 tonnes of cheese and butter. The Coolstore is a key step in streamlining Fonterra’s supply chain out of New Zealand, to deliver cost savings, supply security for our customers globally and flexibility that maximises the value of our farmers’ milk. Along with the cool and dry stores being developed at Mosgiel in the South Island, our Crawford Street stores will be part of a full intermodal logistics network which reduces our dependence on third-party stores, while significantly improving efficiencies in inventory management, handling and transportation. The Coolstore is the central hub for the more than 210,000 tonnes of cheese and butter produced by Fonterra in the Waikato region, and links road and rail seamlessly with our key export ports. For our local community, it reduces the number of truck movements on the region’s roads, meaning a further reduction in costs and a lower carbon footprint for our transportation operations.

1
half year highlights
revenue totalled $7.7 billion, 3.7 per cent lower than the corresponding period in 2008/09, as volume growth in product sold was more than offset by a decline in average prices achieved.
full year forecast for the Milk Price remains at $5.70 per kilogram of milksolids (kgMS), with a forecast Distributable Profit of 40-50 cents per share and a target dividend range of 20-30 cents per share. If we deliver this Milk Price and dividend for the full year, farmer cash returns will be the second highest achieved by Fonterra.
interim dividend of 8 cents per share will be paid to shareholders on 20 April 2010, based on a full year target dividend range of 20-30 cents per share. This is in line with the Board’s policy to target an interim dividend of around 30 per cent of the forecast full year dividend. Any final dividend payment will be made in October.
Cash flow and working capital management over the half year was seasonally strong and resulted in only a modest increase in gearing from 52.7 per cent at 31 July 2009 to 53.3 per cent – well below the 61.5 per cent at 31 January 2009.
overseas asset portfolio was refined, through further investments in the Co-operative’s pharmaceutical lactose joint venture and Middle East consumer business. Fonterra also divested non-strategic assets such as its stake in the Arla Foods joint venture in the UK, which had a positive impact on the balance sheet.
Capital structure changes to strengthen the Co-operative were approved by nearly 90 per cent of farmer shareholders voting at the Annual Meeting in November 2009.

2
introDUCtionA strong recovery in global dairy prices underpinned an improved Milk Price performance by the Co-operative in the six months to 31 January 2010. The recovery prompted the Board to increase the 2009/10 forecast Milk Price to $5.70 per kilogram of milksolids (kgMS) – well up on the season’s opening forecast of $4.10 per kgMS. Our consumer businesses also traded well, and we expect them to continue their solid growth trends in profitability for the full year.
Although we faced further volatility in both prices and exchange rates following the upheavals of the previous year, demand from our customers increased as consumer confidence improved in key markets around the world. Our sales volumes were higher on the back of this stronger demand, meaning our inventory levels across the seasonal peak were at more normal levels after the unusual highs of a year earlier. Lower inventory holding costs, combined with equity inflows from capital structure initiatives, contributed to a significant improvement in our interim balance sheet position.
We refined our portfolio of overseas assets, making important investments to strengthen our position in pharmaceutical lactose products and in the Middle East region for consumer and foodservice products. We also divested assets
no longer considered core to our long-term strategy.
During the half year, our farmer shareholders took the first steps to strengthen the Co-operative’s capital structure and achieve a more stable capital base designed to drive improved returns to farmers in coming years.
inCoMe stateMentIn the six months to 31 January 2010, our revenue totalled $7.7 billion, 3.7 per cent lower than the $8.0 billion achieved in the corresponding period in 2008/09. The reduction in revenue primarily reflects the impact of lower international dairy prices compared with the previous period, which more than offset increased sales volumes. As an indication, we began the half year with average selling prices for Whole Milk Powder (WMP) on our globalDairyTrade™ platform almost 40 per cent down on a year earlier. Although global prices rose markedly as the half year progressed (in contrast to the previous period’s sharp decline), the improvement did not come early enough to offset the difficult start to the period.
Milk production for the season to 31 January 2010 was 1.0 per cent higher than at the same point in the previous season, with the increase largely due to South Island dry farm conversions. Production in the South Island was up 8.3 per cent on last season, while there was a decrease of 2.3 per cent in the North Island
DEMAND FrOM OUr
CUSTOMErS INCrEASED AS
CONSUMEr CONFIDENCE
IMPrOvED IN KEy MArKETS
ArOUND ThE WOrLD
fonterra interim report 2010
ChairMan/CeoreVieW

3
which was impacted by a cold, wet spring followed by a dry summer in most regions (including a drought declared in Northland). In the lower North Island, production was also affected by loss of milk supply to a newly-established processor.
Our operating expenses increased 5.8 per cent or $55 million compared with the prior period. higher investment in advertising and promotions to grow and defend market share in our regional consumer brands businesses was primarily responsible for the increase. Excluding this, operating expenses were largely flat as while overseas expenses were lower when translated to New Zealand dollars, some one-off benefits in 2009 were not repeated in 2010.
Net finance costs of $172 million were substantially lower than the prior period’s $368 million. About $60 million of the reduction was due to lower debt levels and the cost of borrowing, about $160 million reflected changes in the fair values of interest rate hedges that adversely affected us last year, and the balance was as a result of lower interest received on our funds on deposit.
Due to the seasonal nature of Fonterra’s business, the final Milk Price for the season can only be confirmed at the end of the financial year. Since the Milk Price represents Fonterra’s largest business cost, a small change in the Milk Price could
have a material impact on reported profit. For the purposes of the interim financial statements, a Milk Price which results in a nil profit attributable to shareholders has been used. Fonterra therefore reports only on revenue and not profit of its segments at the half year. however, some general comments can still be made about performance across these segments.
BUsiness oVerVieW As part of ongoing initiatives to improve understanding of how Fonterra adds value to farmers’ milk, we have refined the way we describe various dairy product categories.
Dairy ingredients are products sold into markets with multiple suppliers and/or low barriers to entry. They include most of our milk powder products and the bulk of our butter and cheese sales (previously, we called these products Dairy Commodities).
Value add ingredients are products that are more advanced than Dairy Ingredients, but not unique enough to be classed as Specialty Ingredients. Examples are nutritional bases for infant formula and growing up milk powders.
specialty ingredients are products that have unique propositions with higher margins and limited demand volatility. Examples are some of our advances in the use of dairy for paediatric and functional nutrition, as well as products such as pharmaceutical lactose.
NET FINANCE COSTS
OF $172 MILLION WErE
SUBSTANTIALLy LOWEr
ThAN ThE PrIOr PErIOD’S
$368 MILLION

4
fonterra interim report 2010
ChairMan / Ceo reVieW
Consumer Products are products sold direct to consumers through Fonterra-owned and licenced brands in our regional consumer businesses.
In volume terms, value Add and Specialty Ingredients represent about 30 per cent of products manufactured from New Zealand milk, with a further 13 per cent channelled into our regional consumer businesses.
Fonterra is now reporting its operations across five business segments that reflect our organisational structure. This will also bring more clarity to the reporting of our performance. Our three regional segments are predominantly consumer-focused, while international ingredients business activities are now split into Fonterra Trade & Operations (FTO) and Global Ingredients & Foodservices (GIF). Previously, activities now within FTO or GIF were reported in a Commodities & Ingredients segment.
FTO encompasses New Zealand milk supply and manufacturing, and our global trade and supply chain activities. For the most part, FTO produces and sells Dairy Ingredients. GIF on the other hand, provides high-value dairy solutions for customers globally, with particular concentration in the high-value markets of North Asia, North America and Europe. GIF’s principal focus is on selling value Add Ingredients and Specialty Ingredients.
The rapid rise in global dairy prices is great news in terms of a better Milk Price, but is starting to put some pressure on profits across our FTO and GIF business units. A key profit driver is the gap between prices achieved for higher-value non-powder streams such as cheese and casein, compared with the range of milk powder streams used as the basis for calculation of the Milk Price. Although prices for all dairy products have increased, the recovery to date has been strongest across powders, narrowing the gap with non-powder streams and thus squeezing Fonterra’s profit margins. Margins have also been compressed on some customer contracts signed before the full extent of the recovery in market prices. Margins will restore over the medium-term as market pricing relativities return to more normal levels, but are likely to impact our underlying profit for the 2009/10 year across FTO and GIF combined.
Fonterra Trade & OperationsExternal revenue for FTO for the six months to 31 January 2010 was just over $3.3 billion. Although average US dollar selling prices for key dairy ingredients products were 20-40 per cent lower than a year earlier, higher volumes and foreign exchange hedging gains offset the impact of these lower prices.
In January 2010, our internet-based trading system, globalDairyTrade™ platform reached a milestone when it passed US$1 billion in sales since its
ThE rAPID rISE IN GLOBAL
DAIry PrICES IS GrEAT
NEWS IN TErMS OF A BETTEr
MILK PrICE, BUT IS STArTING
TO PUT SOME PrESSUrE ON
PrOFITS ACrOSS OUr FTO
AND GIF BUSINESS UNITS.

5
A KEy FOCUS FOr FTO IS AN
ONGOING DrIvE TO rEDUCE
PrODUCTION COSTS
ThrOUGh IMPrOvEMENTS
IN MANUFACTUrING AND
SUPPLy ChAIN EFFICIENCy
launch in July 2008. It is now widely recognised as the pre-eminent global market place that discovers a reliable and trusted market reference price for dairy products. In November 2009, Anhydrous Milk Fat (AMF) began to be sold on the platform, with Skim Milk Powder (SMP) following in March 2010. We understand that pricing from our globalDairyTrade™ platform is intended to be used as the settlement benchmark when the New Zealand Exchange (NZX) begins trading a Whole Milk Powder futures contract later this year. Contracts from the globalDairyTrade™ platform are for shipment of product between two and eight months later, so there will always be a lag until pricing changes at monthly trading events are reflected in Fonterra’s sales revenue.
A key focus for FTO is an ongoing drive to reduce production costs through improvements in manufacturing and supply chain efficiency. In September 2009, we commissioned the most efficient powder plant in the world, ED4 at Edendale, Southland. ED4 significantly lowers the cost at this plant of turning milk into final product and has set a new benchmark for our New Zealand manufacturing plants. We also completed construction of our new coolstore at Crawford Street in the Waikato. This coolstore is a key step in further streamlining our supply chain network to reduce our dependence on third-party stores,
while significantly improving efficiencies in inventory management, handling and transportation.
In offshore supply, we announced plans to invest in two more dairy farms in hebei province, China, to continue growing a high quality and secure supply of milk there. Our large pilot farm in the same area has demonstrated that Fonterra can successfully produce New Zealand standard milk in China and we are confident that with further investment in good technology, people and high quality genetics, we can replicate this model on further farms. This will complement our New Zealand milk supply and help us better meet the needs of our key customers, who are increasingly looking for local sourcing capability to supplement New Zealand dairy product imports.
Global Ingredients & FoodservicesExternal revenue of $1.8 billion for GIF was impacted by lower average US dollar selling prices and adverse foreign exchange movements that reduced the value of sales when reported in New Zealand dollars. however sales volumes were higher than the prior corresponding period.
GIF continues to refine its business to focus on the most promising opportunities to build strong customer partnerships and help gain the highest possible value for New Zealand milk products in world markets.

6
fonterra interim report 2010
ChairMan / Ceo reVieW
In December 2009 we announced a plan to expand DMv-Fonterra Excipients (DFE), our 50:50 joint-venture with royal FrieslandCampina, through DFE buying royal FrieslandCampina’s pharmaceutical lactose business and manufacturing unit. In November 2009 we sold our 25 per cent interest in AFF, our UK consumer products joint venture with Arla Foods. Although the joint venture had been successful, it was no longer considered core to our long-term strategy. Fonterra will continue to license the Anchor™ brand and supply New Zealand butter to AFF.
Fonterra’s researchers continue to expand our range of high value protein ingredients, working with customers on uses for end-products. One recent example is a new addition to our PowerProtein™ range for bars and snacks. PowerProtein™ 515 WPC is a whey protein concentrate that delivers improved taste and texture and increased protein levels for nutrition bars.
Australia/New Zealandrevenue for ANZ was flat at $1.5 billion, as higher volumes and foreign exchange translation gains (resulting from a higher Australian dollar against the New Zealand dollar) were offset by the impact of lower dairy prices. Performance of the business was good in the first half and we expect this trend to continue to the full year. That said, we still face some uncertainty regarding the final price
to be paid to Australian farmers supplying milk to Fonterra. Our Australian milk price has risen four times this season in response to global market conditions and the need to remain competitive locally.
Our market shares in Australia have experienced growth in all key categories except cheese, with volume growth especially strong in yoghurt and dairy desserts from the earlier acquisition of the Nestlé™ and Ski™ brand licences. In New Zealand, strong leadership positions were retained across all key categories.
In January 2010, we announced a plan to invest A$11.5 million to increase cheese and whey powder processing capacity in Tasmania, where Fonterra already processes two-thirds of the milk produced.
Asia/Africa, Middle Eastrevenue for Asia/AME was down 2 per cent in local currency terms driven by lower prices offsetting a 5 per cent volume improvement. however, the strength of the New Zealand dollar against most key Asian currencies meant reported revenue for the period was down 15 per cent to $736 million. Although overall performance is being similarly affected by exchange rates, margins have improved, offsetting this impact. Full year normalised profit (excluding one-off items) is expected to be ahead of last year.
We strengthened our business footprint in the Middle East when
OUr MArKET ShArES
IN AUSTrALIA hAvE
EXPErIENCED GrOWTh IN
ALL KEy CATEGOrIES EXCEPT
ChEESE, WITh vOLUME
GrOWTh ESPECIALLy
STrONG IN yOGhUrT
AND DAIry DESSErTS

7
ThE vALUE OF OUr
INvENTOrIES AT 31 JANUAry
2010 WAS $4.2 BILLION,
COMPArED WITh $5.1
BILLION A yEAr EArLIEr
we announced in December 2009 an agreement to purchase the remaining 51 per cent stake in Saudi New Zealand Milk Products, a joint-venture dairy manufacturing facility in Saudi Arabia. By taking full ownership of the factory, we will secure our current manufacturing capacity requirements for the Middle East and facilitate further expansion and investment. The agreement is expected to close in the next year, after securing necessary regulatory approvals.
Latin Americarevenue for Latam was flat at $355 million, as a modest increase in overall prices was offset by slightly lower volumes and adverse foreign exchange rate movements. Latin America revenue represents only our Chilean business Soprole, as we do not consolidate the revenue of our joint venture with Nestlé, Dairy Partners Americas (DPA) into Fonterra’s income statement. Within Soprole, the key high value consumer categories of yoghurts, desserts and mature cheese all showed increased volumes. In the juice and water categories, Soprole is focusing on higher-margin brands. We had been on track to achieve a good profit increase for the full year, but the recent devastating earthquake has raised uncertainty for the second half of the year. DPA continues to perform well with returns in the half year in line with the previous period.
Following the earthquake, it took just over a week to confirm all our 1,800 staff in Chile were safe. Efforts have turned to supporting those staff who have lost homes and need to be relocated. recovery of the business operation is also progressing well with milk being collected, all factories operating to some extent and product moving through distribution to market, albeit with some restrictions. In early March, Fonterra and Soprole together donated $1 million to a telethon held in Chile to raise money for disaster recovery.
BalanCe sheetWe continued to make progress strengthening our balance sheet. Given the highly seasonal nature of our business, the more meaningful balance sheet comparison is with the position at the previous half year, rather than at the most recent annual balance date of 31 July 2009.
The value of our inventories at 31 January 2010 was $4.2 billion, compared with $5.1 billion a year earlier. The decline reflects a return to more normal seasonal inventory levels following the extreme conditions experienced during the previous period in the midst of the global financial crisis. Lower inventory volumes were partially offset by the impact of this season’s stronger forecast Milk Price, which increased the holding cost of inventories.
Total assets were valued at $16.2 billion, down from $18.0 billion at

8
31 January 2009. This principally reflects the impact of lower inventories, as well as a stronger New Zealand currency which has reduced the value of non-New Zealand dollar denominated assets when translated into New Zealand dollars.
Our net interest bearing debt was lowered from $7.4 billion at 31 January 2009 to $5.7 billion. The key drivers of this decline were the lower inventory values and the strengthening of the New Zealand dollar against most of the major currencies where debt has been issued, which resulted in foreign currency debt reducing when converted into New Zealand dollars. We actively manage our borrowings to ensure Fonterra is financed most cost-effectively. An example of this was our decision to raise funds from the New Zealand bond market in early March 2010. Proceeds from the bond issue, which attracted strong interest from investors, are being used to partially replace a 300 million Euro Medium Term Note (EMTN) maturing in April 2010. Initially we considered raising up to $250 million in bonds, but we scaled back to $150 million after we were able to cover part of our financing requirements overseas at a very attractive funding cost.
Our equity position improved after the issue of Co-operative shares worth a net $263 million in January
2010. As a consequence of capital structure changes approved at the Annual Meeting in November 2009, farmer shareholders were given the opportunity during a transition period to adjust their shareholding up or down, to anywhere between 100 and 120 per cent of their current or expected production. Farmers responded well to the transition share issue, despite the difficult financial circumstances many of them were facing. Out of Fonterra’s 10,500 farmer shareholders, 3,461 subscribed for a total of 60 million new shares, while just 59 applied to surrender a total of 1.6 million shares. The transition share issue, together with shares worth a net $150 million issued earlier in the season relating to dry farm conversions, saw Fonterra’s share capital at 31 January 2010 increase to $5.0 billion, compared with $4.6 billion at 31 July 2009 and $4.4 billion at 31 January 2009.
As a consequence of a stronger capital base and lower borrowings, our debt gearing (in terms of net interest bearing debt to net interest bearing debt + equity) at 31 January 2010 was 53.3 per cent, a substantial reduction from 61.5 per cent recorded a year earlier and, as expected, seasonally higher but broadly in line with the previous year-end position of 52.7 per cent at 31 July 2009. We remain focused on our stated gearing ratio target for the end of the 2009/10 year of less than or equal to 50 per cent. We are maintaining tight
OUr EqUITy POSITION
IMPrOvED AFTEr ThE ISSUE
OF CO-OPErATIvE ShArES
WOrTh A NET $263 MILLION
IN JANUAry 2010
fonterra interim report 2010
ChairMan / Ceo reVieW
9
ThE IMPOrTANCE OF
OUr EFFOrTS TO rEDUCE
FONTErrA AND ThE
INDUSTry’S ENvIrONMENTAL
FOOTPrINT WILL BE
rEINFOrCED WITh ThE
FIrST STAGE OF
NEW ZEALAND’S EMISSIONS
TrADING SChEME (ETS)
management of our operational cost structures and capital expenditure and will continue to divest selected non-strategic assets.
Operating cash flows were negative for the half year, with a small net outflow of $129 million. This is to be expected given seasonal factors and the recent rise in dairy prices. The half year includes the peak supply period, where monthly milk payments to farmers are at their highest. Additionally, those payments reflect a full year forecast Milk Price of $5.70 kgMS. As we sell down inventory at higher prices during the second half, we will return to positive operating cash flows.
sUstainaBilityIn March 2010 we announced a new initiative involving working with our farmers to troubleshoot any problems evident within their effluent management systems. This will be undertaken every year on every farm supplying Fonterra in New Zealand. The initiative is part of our commitment to improve environmental performance – not only within our business operations but also in supporting our farmers. The Clean Streams Accord has been a success in lifting performance on-farm, but more needs to be done to improve national compliance rates with dairy effluent regulations. We need to keep pace with the fast-changing public and customer expectations around waste reduction,
energy and resource use and we will be continuing to track our performance and publish it through our Sustainability Indicators.
The importance of our efforts to reduce Fonterra and the industry’s environmental footprint will be reinforced with the first stage of New Zealand’s Emissions Trading Scheme (ETS) covering our fuel use, manufacturing emissions and processing activities from 1 July 2010. Fonterra will face additional annual costs beginning at $25 million and increasing every year, as a result of the ETS first stage, and will continue to pursue savings in areas such as energy use to offset this additional cost. The opening of the New Zealand Greenhouse Gas research Centre at Agresearch’s Grasslands campus will be a focal point for furthering the industry’s research around reducing agricultural emissions, which will be covered by the ETS from 2015.
Alongside our core commitment to sustainability, we have continued to expand our community support programmes with Catchment Care in association with Conservation volunteers, to enhance and protect waterways and wetlands through riparian planting and fencing – with projects now underway in Waikato and Canterbury. Our KickStart™ Breakfast programme is set to be in more than 500 New Zealand Schools by the end of the 2010 school year. The Fonterra Science roadshow

10
continues to run nationally and more than 100 local support programmes focused on environment, education, emergency response, nutrition and wellbeing are ongoing in communities around the world where we operate.
health anD safetyThe tragic loss of one of our people in Australia during the first half of the year and other serious harm incidents across the business overshadowed the generally positive progress we are making in health and safety. Our key lead indicator – Global Framework audit scores – is improving and the two key lag measures, total recordable injury frequency rate (TrIFr) and lost time injury frequency rate (LTIFr) are tracking downwards, but one fatality is one too many. Management has an absolute priority of getting all our people home safely every day by building a stronger safety culture, adopting better systems and processes, and improving plant and equipment design.
CaPital strUCtUre eVolUtionAt the Annual Meeting in November 2009, our farmer shareholders took the first important steps towards strengthening Fonterra’s capital structure and securing the Co-operative’s future in an increasingly competitive and volatile global environment. Steps One and Two of a three-step process of capital structure evolution received almost 90 per cent support from farmers voting at the Annual Meeting.
Under Step One, farmers now have greater flexibility in the number of shares they own: rather than adjusting their shareholding up and down each season strictly in line with milk production, they can hold anywhere between 100 and 120 per cent of their current or expected production. As an incentive for farmers to hold a buffer of “dry” shares in excess of production, any Fonterra profits will now be available to be distributed as a dividend based on shares held, rather than based on milksolids produced.
Step Two involved changing the way Fonterra shares are valued to recognise that the market is restricted to Fonterra farmers only. As this would mean a reduction in the Fair value Share (FvS) price, a transition process was put in place to effectively hold the FvS price at a “Base Price” (currently $4.52 per share) until the valuation on a restricted market basis catches up. In line with the transition process, the Board announced in December 2009 an estimated FvS price for the 2010/11 season of $4.52 per share.
Steps One and Two addressed some of the immediate challenges faced by the Co-operative. By allowing investment in dry shares, we can look to increase our equity base and reduce our debt gearing. By paying dividends on all shares, we go some way to help lower redemption risk, as farmers with excess shares have a financial incentive to hold onto these shares rather than require
MANAGEMENT hAS AN
ABSOLUTE PrIOrITy OF
GETTING ALL OUr PEOPLE
hOME SAFELy EvEry DAy
By BUILDING A STrONGEr
SAFETy CULTUrE
fonterra interim report 2010
ChairMan / Ceo reVieW

11
AChIEvING SUCh
CErTAINTy IS vITAL FOr
FONTErrA TO MAINTAIN
ITS LEADING POSITION
IN ThE INTErNATIONAL
DAIry INDUSTry
the Co-operative to redeem them. however, the Co-operative is still exposed to redemption risk within the current capital structure. Loyal farmer shareholders are penalised when money washes in and out of the Co-operative because, one way or another, they effectively have to fund redemptions.
The third step of capital structure change would remove exposure to redemption risk by moving to a system under which farmers would buy and sell Fonterra shares among themselves, instead of purchasing/redeeming them through the Co-operative. removing the Co-operative’s exposure to redemption risk in this way ensures farmers would retain 100 per cent control and ownership. It would also provide Fonterra with a permanent equity base and certainty about the Co-operative’s level of capital, whatever might happen to milk production in any season. Achieving such certainty is vital for Fonterra to maintain its leading position in the international dairy industry and grow farmer returns from a stable capital base.
We have managed redemption risk within the current capital structure reasonably well so far, largely because milk volume in New Zealand has been steadily growing. This means the impact of redemptions has generally been offset by new capital coming in through conversions and growth milk. But we cannot count on
this volume growth continuing indefinitely. We also need to find better ways to make participation in the Co-operative more accessible – for new farmers wanting to join, and for existing shareholders under financial pressure.
The Board has begun discussions on Step Three with the Fonterra Shareholders’ Council, adopting a similar consultative approach to that successfully followed for Steps One and Two. A critical element of the design of Step Three will be to ensure farmers have confidence they will be able to buy or sell Fonterra shares when they need to, at a real market price. Once we have agreement with Council, we will take Step Three out to consultation with our farmers.
oUtlooKWhile there is still some volatility in global dairy markets, there are recent signs of stability returning. Over the past five months to March 2010, for instance, average selling prices for Whole Milk Powder on the globalDairyTrade™ platform have stayed within a fairly narrow band of around US$3,250 to US$3,600. There is an element of uncertainty as to how supply and demand factors will influence prices over the coming months, but the recent stability means the outlook is positive for the balance of this year and into 2010/11.
Our balance sheet is in solid shape, benefiting from lower debt levels and the capital inflows from the

12
transition share issue. Further improvements in gearing in the second half of the year will primarily arise from our seasonal reduction of inventories and receivables as we sell off our October-November peak production volumes.
As previously announced, we are forecasting a Milk Price for the 2009/10 season of $5.70 per kgMS, substantially higher than the opening forecast of $4.10 per kgMS and the previous season’s $4.72 per kgMS. This forecast is regularly reviewed as we contract more sales of the season’s production. While such a strong increase is sure to be welcomed by all, the magnitude of the rise shows that we are still working within a volatile environment with the potential for further sharp spikes and troughs in market sentiment and pricing.
We also previously announced that the Distributable Profit forecast range for 2009/10 is 40-50 cents per share, with a target dividend range of 20-30 cents per share. This would indicate 10-30 cents per share of Distributable Profit will be retained. We indicated to our farmers last year that we would look more at
retentions as a way of keeping funds within Fonterra and strengthening the balance sheet. however, in setting and applying our dividend policy, we are always conscious of the need to strike the right balance in any given season between retentions and distributions to farmers, taking account of the financial positions of both farmers and the Co-operative.
Based on the current forecast Milk Price and the current target dividend range, 2009/10 farmer cash returns would result in the second highest achieved by Fonterra. It would also mean that the most recent three seasons rank among the top four in terms of total cash returns (Milk Price plus value return/dividend) paid to farmers, in spite of the significant challenges we have encountered during this period.
The Board and management team will remain focused on maximising returns in any given year while ensuring the Co-operative has the necessary strength to pursue profitable opportunities that are aimed at driving the best possible Milk Price and higher farmer returns in the years ahead.
WE NEED TO STrIKE ThE
rIGhT BALANCE BETWEEN
rETENTIONS AND
DISTrIBUTIONS TO FArMErS,
TAKING ACCOUNT OF ThE
FINANCIAL POSITIONS OF BOTh
FArMErS AND ThE CO-OP
fonterra interim report 2010
ChairMan / Ceo reVieW
sir henry Van Der heyDen anDreW ferrier Chairman CEO

13
The capital structure changes approved at the November 2009 Annual Meeting mean some changes to the terms used by Fonterra to describe farmer payments.
The key terms are as follows:
Milk Price: The price paid to farmer shareholders for milk supplied to Fonterra, on a cents per kilogram of milksolids (kgMS) basis.
Distributable Profit: The total profit from Fonterra’s business activities available for distribution to farmer shareholders by way of a dividend, on a cents per share basis.
Dividend: The amount of Distributable Profit actually paid to farmer shareholders in respect of any
From 2010/11, Fonterra’s dividend policy targets a dividend payment ratio of 65-75 per cent of Distributable Profit. This would mean 25-35 per cent of Distributable Profit being retained.
In normal circumstances, the Board will target an interim dividend to be paid in April of around 30 per cent of the then forecast full year dividend, with the remainder being paid as a final dividend in October.
For the 2009/10 year, the Board is forecasting a Distributable Profit of
financial year, expressed on a cents per share basis.
retentions: The amount of Distributable Profit that is not paid to farmer shareholders and is retained within Fonterra’s balance sheet.
value return was previously used to describe the amount of Distributable Profit paid out to farmer shareholders, on a cents per kgMS basis. This term is no longer relevant as profit is now being distributed via dividend payments.
Similarly, Payout is no longer a relevant term because farmer shareholders can now hold both supply-backed and dry shares.
40-50 cents per share and a target dividend range of 20-30 cents per share.
Fonterra no longer issues a specific forecast number for a dividend, as it used to do with the amount available as a value return. We will instead provide shareholders with guidance within a range on the likely level of Distributable Profit and guidance within a range on the likely level of dividend.
Changes to Key finanCial terMs
DiViDenD PoliCy
ProCeDUres PerforMeD By aUDitors
CUrrenCy
The Board has engaged PricewaterhouseCoopers to conduct specific procedures on certain balances in the interim financial
All references in this document to dollar figures ($) are in New Zealand dollars, unless otherwise stated.
statements and report the results of their work to the Directors. These procedures are focused on areas of financial reporting risk.

fonterra co-operative Group LimiteD
14
ConsoliDateD interiM inCoMe stateMent for the siX Months to 31 JanUary 2010
6 Months to31 Jan 2010
6 MONThS TO31 JAN 2009
12 MONThS TO31 JUL 2009
$ MILLION NOTES UnaUDiteD UNAUDITED AUDITED
revenue from the sale of goods 7,738 8,035 16,035
cost of goods sold 2 (6,778) (6,958) (13,217)
gross profit 960 1,077 2,818
other operating income 222 56 119
Selling and marketing expenses (294) (266) (554)
Distribution expenses (237) (223) (481)
administrative expenses (341) (312) (700)
other operating expenses (134) (150) (301)
net foreign exchange (losses)/gains (2) 147 21
operating profit before net finance costs,
equity accounted income and tax 3 174 329 922
finance income 10 28 41
finance costs (182) (396) (489)
net finance costs (172) (368) (448)
Share of profit of equity accounted investees 41 69 129
impairment of equity accounted investees 6 – (62) (61)
Profit/(loss) before tax 43 (32) 542
tax (expense)/credit (36) 31 (109)
Profit/(loss) for the period1 7 (1) 433
Profit/(loss) for the period is attributable to:
Shareholders of the company – – 422
non-controlling interests 7 (1) 11
Profit/(loss) for the period1 7 (1) 433
1 Due to the seasonal nature of fonterra’s business, the final milk price for the season can only be confirmed at the end of the financial year. a small change in milk price could have a material impact on profit/(loss). for the purposes of the interim financial statements, a milk price which results in a nil profit/(loss) attributable to shareholders has been used. at year end, the milk price for the season will be confirmed, and the profit/(loss) attributable to shareholders reported.
the Directors hereby approve and authorise for issue the financial statements for the six months to 31 January 2010 presented on pages 14 to 29. for and on behalf of the Board:
Sir HenrY van Der HeYDen DaviD JackSonchairman Director23 march 2010 23 march 2010
the accompanying notes form part of these consolidated interim financial statements.

15
fonterra co-operative Group LimiteD
ConsoliDateD interiM stateMent of CoMPrehensiVe inCoMe for the siX Months to 31 JanUary 2010
6 Months to31 Jan 2010
6 MONThS TO31 JAN 2009
12 MONThS TO31 JUL 2009
$ MILLION UnaUDiteD UNAUDITED AUDITED
Profit/(loss) for the period 7 (1) 433
cash flow hedges:
– net fair value gains/(losses) 338 (1,665) (803)
– transferred and reported in revenue (432) 764 1,171
– tax credit/(expense) on cash flow hedge transactions 28 164 (110)
net investment hedges:
– net fair value gains/(losses) 52 (230) (6)
– transferred to income statement – – 8
– tax (expense)/credit on net investment hedges (16) 41 (1)
foreign currency translation (losses)/gains attributable
to Shareholders of the company (106) 335 12
foreign currency translation reserve transferred
to income statement 21 20 –
foreign currency translation (losses)/gains attributable
to non-controlling interests (2) 19 5
Share of equity accounted investees reserve movements – (4) –
other comprehensive (expense)/income for the period (117) (556) 276
total comprehensive (expense)/income for the period (110) (557) 709
attributable to:
Shareholders of the company (115) (575) 693
non-controlling interests 5 18 16
total comprehensive (expense)/income for the period (110) (557) 709
the accompanying notes form part of these consolidated interim financial statements.
fonterra co-operative Group LimiteD
16
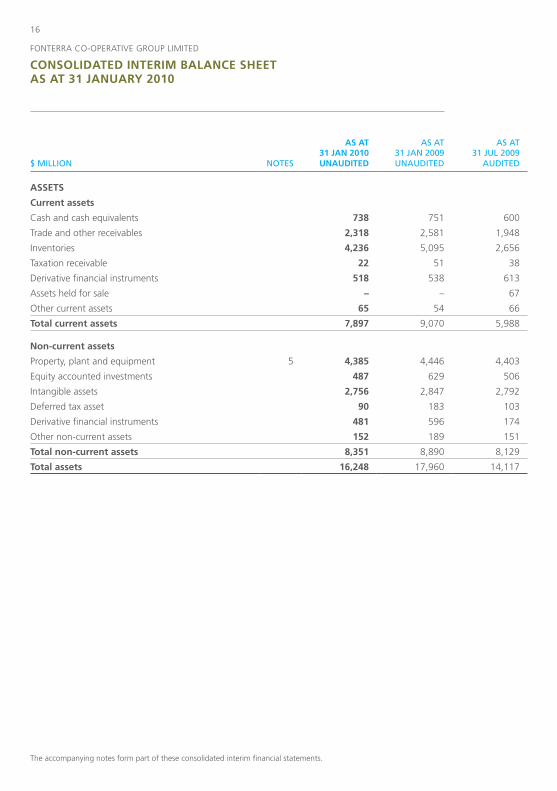
ConsoliDateD interiM BalanCe sheet as at 31 JanUary 2010
as at31 Jan 2010
AS AT31 JAN 2009
AS AT31 JUL 2009
$ MILLION NOTES UnaUDiteD UNAUDITED AUDITED
assets
Current assets
cash and cash equivalents 738 751 600
trade and other receivables 2,318 2,581 1,948
inventories 4,236 5,095 2,656
taxation receivable 22 51 38
Derivative financial instruments 518 538 613
assets held for sale – – 67
other current assets 65 54 66
total current assets 7,897 9,070 5,988
non-current assets
property, plant and equipment 5 4,385 4,446 4,403
equity accounted investments 487 629 506
intangible assets 2,756 2,847 2,792
Deferred tax asset 90 183 103
Derivative financial instruments 481 596 174
other non-current assets 152 189 151
total non-current assets 8,351 8,890 8,129
total assets 16,248 17,960 14,117
the accompanying notes form part of these consolidated interim financial statements.

17
fonterra co-operative Group LimiteD
ConsoliDateD interiM BalanCe sheet (ContinUeD) as at 31 JanUary 2010
as at31 Jan 2010
AS AT31 JAN 2009
AS AT31 JUL 2009
$ MILLION NOTES UnaUDiteD UNAUDITED AUDITED
LIABILITIES
Current liabilities
Bank overdraft 25 79 58
Borrowings 9 1,567 1,890 1,627
trade and other payables 1,245 1,324 1,132
owing to suppliers 2,014 1,806 1,207
taxation payable 36 42 25
Derivative financial instruments 133 2,103 216
provisions 96 129 143
other current liabilities 9 14 6
total current liabilities 5,125 7,387 4,414
non-current liabilities
Borrowings 9 4,882 6,244 4,167
Derivative financial instruments 807 386 322
provisions 121 77 78
Deferred tax liability 235 41 305
other non-current liabilities 24 35 26
total non-current liabilities 6,069 6,783 4,898
total liabilities 11,194 14,170 9,312
EQUITY
co-operative shares 4,970 4,392 4,557
retained earnings (15) 14 26
foreign currency translation reserve (37) 165 12
cash flow hedge reserve 104 (825) 170
total equity attributable to shareholders
of the Company 5,022 3,746 4,765
non-controlling interests 32 44 40
total equity 5,054 3,790 4,805
total liabilities and equity 16,248 17,960 14,117
the accompanying notes form part of these consolidated interim financial statements.

fonterra co-operative Group LimiteD
18
ConsoliDateD interiM stateMent of Changes in eQUity for the siX Months to 31 JanUary 2010
ATTrIBUTABLE TO ShArEhOLDErS OF ThE COMPANy
NON-CONTrOLLING INTErESTS TOTAL EqUITy$ MILLION
CO-OPErATIvE ShArES
rETAINED EArNINGS
FOrEIGN CUrrENCy
TrANSLATION rESErvE
CASh FLOW hEDGE rESErvE TOTAL
Balance at 1 august 2009 4,557 26 12 170 4,765 40 4,805
profit for the period – – – – – 7 7
other comprehensive expense for the period – – (49) (66) (115) (2) (117)
co-operative shares issued 422 – – – 422 – 422
co-operative shares surrendered (9) – – – (9) – (9)
purchase of non-controlling interest – (41) – – (41) (7) (48)
Dividend paid to non-controlling interests – – – – – (6) (6)
Balance at 31 January 2010 (unaudited) 4,970 (15) (37) 104 5,022 32 5,054
Balance at 1 august 2008 4,297 18 (1) (88) 4,226 43 4,269
Loss for the period – – – – – (1) (1)
other comprehensive (expense)/income
for the period – (4) 166 (737) (575) 19 (556)
co-operative shares issued 111 – – – 111 – 111
co-operative shares surrendered (16) – – – (16) – (16)
Dividend paid to non-controlling interests – – – – – (17) (17)
Balance at 31 January 2009 (unaudited) 4,392 14 165 (825) 3,746 44 3,790
Balance at 1 august 2008 4,297 18 (1) (88) 4,226 43 4,269
profit for the period – 422 – – 422 11 433
other comprehensive income for the period – – 13 258 271 5 276
value return paid to Shareholder Suppliers – (591) – – (591) – (591)
tax credit arising on value return paid to
Shareholder Suppliers – 177 – – 177 – 177
co-operative shares issued 766 – – – 766 – 766
co-operative shares surrendered (506) – – – (506) – (506)
Dividend paid to non-controlling interests – – – – – (19) (19)
Balance at 31 July 2009 (audited) 4,557 26 12 170 4,765 40 4,805
the accompanying notes form part of these consolidated interim financial statements.

19
ATTrIBUTABLE TO ShArEhOLDErS OF ThE COMPANy
NON-CONTrOLLING INTErESTS TOTAL EqUITy$ MILLION
CO-OPErATIvE ShArES
rETAINED EArNINGS
FOrEIGN CUrrENCy
TrANSLATION rESErvE
CASh FLOW hEDGE rESErvE TOTAL
Balance at 1 august 2009 4,557 26 12 170 4,765 40 4,805
profit for the period – – – – – 7 7
other comprehensive expense for the period – – (49) (66) (115) (2) (117)
co-operative shares issued 422 – – – 422 – 422
co-operative shares surrendered (9) – – – (9) – (9)
purchase of non-controlling interest – (41) – – (41) (7) (48)
Dividend paid to non-controlling interests – – – – – (6) (6)
Balance at 31 January 2010 (unaudited) 4,970 (15) (37) 104 5,022 32 5,054
Balance at 1 august 2008 4,297 18 (1) (88) 4,226 43 4,269
Loss for the period – – – – – (1) (1)
other comprehensive (expense)/income
for the period – (4) 166 (737) (575) 19 (556)
co-operative shares issued 111 – – – 111 – 111
co-operative shares surrendered (16) – – – (16) – (16)
Dividend paid to non-controlling interests – – – – – (17) (17)
Balance at 31 January 2009 (unaudited) 4,392 14 165 (825) 3,746 44 3,790
Balance at 1 august 2008 4,297 18 (1) (88) 4,226 43 4,269
profit for the period – 422 – – 422 11 433
other comprehensive income for the period – – 13 258 271 5 276
value return paid to Shareholder Suppliers – (591) – – (591) – (591)
tax credit arising on value return paid to
Shareholder Suppliers – 177 – – 177 – 177
co-operative shares issued 766 – – – 766 – 766
co-operative shares surrendered (506) – – – (506) – (506)
Dividend paid to non-controlling interests – – – – – (19) (19)
Balance at 31 July 2009 (audited) 4,557 26 12 170 4,765 40 4,805

fonterra co-operative Group LimiteD
20
ConsoliDateD interiM Cash floW stateMent for the siX Months to 31 JanUary 2010
6 Months to31 Jan 2010
6 MONThS TO31 JAN 2009
12 MONThS TO31 JUL 2009
$ MILLION UnaUDiteD UNAUDITED AUDITED
Cash flows from operating activities
cash inflows 7,416 8,922 16,344
cash outflows (7,545) (8,811) (14,750)
net cash flows from operating activities (129) 111 1,594
Cash flows from investing activities
cash inflows 259 95 128
cash outflows (243) (554) (884)
net cash flows from investing activities 16 (459) (756)
Cash flows from financing activities
cash inflows 2,005 2,458 4,645
cash outflows (1,703) (2,117) (5,574)
net cash flows from financing activities 302 341 (929)
net increase/(decrease) in cash and cash equivalents 189 (7) (91)
cash and cash equivalents at the beginning of the period 542 614 614
effect of exchange rate changes on cash balances (18) 65 19
Cash and cash equivalents at the end of the period 713 672 542
reconciliation of cash and cash equivalents
to the balance sheet
cash and cash equivalents 738 751 600
Bank overdraft (25) (79) (58)
Cash and cash equivalents 713 672 542
reconciliation of profit/(loss) for the period to net cash
flows from operating activities
Profit/(loss) for the period 7 (1) 433
adjustment for non-cash items
Depreciation and amortisation 244 234 497
other non-cash items (227) (291) 17
movements in working capital (979) (1,513) 691
movements in derivative financial instruments 12 1,400 (562)
items classified as investing and financing activities 814 282 518
net cash flows from operating activities (129) 111 1,594
there were no material non-cash transactions during the six months to 31 January 2010, six months to 31 January 2009 or the twelve months to 31 July 2009.
the accompanying notes form part of these consolidated interim financial statements.

21
fonterra co-operative Group LimiteD
notes to the ConsoliDateD interiM finanCial stateMents for the siX Months to 31 JanUary 2010
1. stateMent of signifiCant aCCoUnting PoliCies
a. general informationfonterra co-operative Group Limited (fonterra or the company) is a co-operative company incorporated and domiciled in new Zealand. fonterra is registered under the companies act 1993, and the co-operative companies act 1996, and is an issuer for the purposes of the financial reporting act 1993. fonterra is also required to comply with the Dairy industry restructuring act 2001.
these consolidated interim financial statements of fonterra, as at and for the six months ended 31 January 2010, comprise fonterra and its subsidiaries (together referred to as the Group) and the Group’s equity accounted investees.
the Group is primarily involved in the collection, manufacture and sale of milk and milk derived products and is a profit oriented entity.
at fonterra’s annual meeting on 18 november 2009, shareholders approved changes to the company’s capital structure. as a result of these changes all shares, whether supply backed or not, are now eligible to receive a dividend if declared by the Board. previously, a value return payment was made in respect of supply backed shares only.
b. Basis of Preparationthese consolidated interim financial statements comply with new Zealand Generally accepted accounting practice (nZ Gaap) and have been prepared in accordance with the new Zealand equivalent to international accounting Standard (nZ iaS) 34: interim financial reporting. these consolidated interim financial statements also comply with international accounting Standard (iaS) 34: interim financial reporting. these statements should be read in conjunction with the consolidated financial statements for the twelve months to 31 July 2009.
Due to the seasonal nature of fonterra’s business, the final milk price for the season can only be confirmed at the end of the financial year. a small change in milk price could have a material impact on profit/(loss). for the purposes of the interim financial statements, a milk price which results in a nil profit/(loss) attributable to shareholders has been used. at year end, the final milk price will be confirmed, and the profit/(loss) attributable to shareholders reported.
these interim financial statements are presented in new Zealand dollars ($), which is the company’s functional and presentation currency, and rounded to the nearest million.
c. new accounting Policies and new Zealand international financial reporting standardsexcept for the changes explained below, the accounting policies used are consistent with those used to prepare the consolidated financial statements for the twelve months to 31 July 2009 and the consolidated interim financial statements for the six months to 31 January 2009. the Group has adopted the following new and amended new Zealand equivalents to international financial reporting Standards (nZ ifrS) and nZ iaSs with effect from 1 august 2009:
– nZ ifrS 3 (revised): Business combinations. the revised standard continues to apply the acquisition method to business combinations, but with some significant changes. all payments to purchase a business are to be recorded at fair value at the acquisition date, with contingent payments classified as debt subsequently re-measured through the income statement. in addition, all acquisition related costs are to be expensed. the revised standard has had no material impact on the reported results or financial position of fonterra.
– nZ iaS 1 (revised): presentation of financial Statements. the revised standard requires that a statement of changes in equity be presented as a primary financial statement. as a consequence the capital and reserves note which included all owner changes in equity and was previously presented in the notes to the consolidated financial statements, has been removed and a Statement of changes in equity has been presented as a primary financial statement. as the change in the accounting policy is only presentational, there has been no impact on reported earnings as a result of adoption of this standard.

fonterra co-operative Group LimiteD
22
1. stateMent of signifiCant aCCoUnting PoliCies (ContinUeD)
– nZ iaS 27 (revised): consolidated and separate financial statements. the revised standard requires the effects of all transactions with non-controlling interests to be recorded in equity if there is no change in control and these transactions will no longer result in goodwill or gains and losses. the standard also specifies the method of accounting for situations where control is lost. any remaining interest in the entity is re-measured to fair value and a gain or loss is recognised in the income statement. as a result of the application of the standard, the acquisition of non-controlling interests since 1 august 2009, has resulted in $41 million reduction directly to retained earnings.
d. Comparative figures
the comparative analysis of net finance (costs)/income has been amended to reclassify funding forward points to finance costs from finance income (31 January 2009: $29 million; 31 July 2009: nil). the change in comparative analysis is to provide enhanced comparability with respect to finance income. this has no impact on overall net finance costs for the comparative periods.
2. Cost of gooDs solD
6 Months to31 Jan 2010
6 MONThS TO31 JAN 2009
12 MONThS TO31 JUL 2009
$ MILLION UnaUDiteD UNAUDITED AUDITED
opening inventory 2,656 3,288 3,288
cost of milk including Supplier premiums 5,160 4,640 5,828
other purchases 3,198 4,125 6,757
closing inventory (4,236) (5,095) (2,656)
total cost of goods sold 6,778 6,958 13,217
Due to the seasonal nature of fonterra’s business, the final milk price for the season can only be confirmed at the end of the financial year. a small change in milk price could have a material impact on profit/(loss). for the purposes of the interim financial statements, a milk price which results in a nil profit/(loss) attributable to shareholders has been used. at year end, the milk price for the season will be confirmed, and the profit/(loss) attributable to shareholders reported.
3. oPerating Profit Before net finanCe Costs, eQUity aCCoUnteD inCoMe anD taX
6 Months to31 Jan 2010
6 MONThS TO31 JAN 2009
12 MONThS TO31 JUL 2009
$ MILLION UnaUDiteD UNAUDITED AUDITED
the following items have been included in arriving at operating
profit before net finance costs, equity accounted income and tax:
net gain/(loss) on disposal of investments1 127 (9) (3)
receipt for amendments to equity accounted investee arrangements 43 – –
1 on 19 november 2009, fonterra disposed of its 25% interest in aff p/S. amongst the ongoing arrangements fonterra will continue to licence the anchor brand to aff p/S and will continue to supply butter. the transaction and wider arrangements resulted in a net pre-tax gain of $127 million. the gain forms part of the Global ingredients and foodservices segment.
notes to the ConsoliDateD interiM finanCial stateMents (ContinUeD) for the siX Months to 31 JanUary 2010

23
fonterra co-operative Group LimiteD
4. segMent rePorting
the Group operates predominately in five business segments that are defined by product type and geographical area to reflect how the Group’s operations are managed.
the reportable segments identified below differ from those identified in the Group’s most recent consolidated financial statements for the twelve months to 31 July 2009 and consolidated interim financial statements for the six months to 31 January 2009. this change reflects an enhancement of the Group’s management and reporting structure as viewed by the fonterra executive committee, who are the chief operating decision makers.
the commodities & ingredients segment reported previously is now managed as fonterra trade & operations, Global ingredients & foodservices and corporate & other from a performance perspective. total assets continue to be managed and reported from a commodities & ingredients perspective. in respect of the comparative periods’ results, the commodities & ingredients segment has not been restated to present fonterra trade & operations, Global ingredients & foodservices and corporate & other as the necessary information is not available and the cost to develop it would be excessive.
the ingredient milk product business operated in china is managed and reported within fonterra trade & operations. in the six months to 31 January 2009 this was managed and reported within the asia/ame segment. the 31 January 2009 comparative information has been restated to reflect this change.
transactions between segments are based on estimated market prices.
rEPOrTABLE SEGMENT DESCrIPTION
fonterra trade & operations
includes new Zealand milk Supply, new Zealand manufacturing, Global portfolio optimisation, Global trade (including the china ingredient milk product business) and Global Supply chain
global ingredients & foodservices
includes fonterra ingredients and Specialty operations in north asia, north america and europe (including equity accounted investments) and entities focused on global foodservice and paediatric nutrition
anZ represents fast moving consumer Goods (fmcG) operations in new Zealand (including export to the pacific islands) and all fmcG and ingredient operations in australia (including milk Supply and manufacturing)
asia/aMe represents fmcG operations in asia (excluding north asia), africa, the middle east and china
latam represents operations and equity accounted investments in South america
Corporate & other includes corporate and shared service operations of the Group
notes to the ConsoliDateD interiM finanCial stateMents (ContinUeD) for the siX Months to 31 JanUary 2010

fonterra co-operative Group LimiteD
24
4. segMent rePorting (ContinUeD)
$ MILLION
FONTErrA TrADE &
OPErATIONS
GLOBAL INGrEDIENTS & FOODSErvICES
COrPOrATE & OThEr ANZ ASIA/AME LATAM ELIMINATIONS total groUP
segment revenue
for the 6 months to 31 January 2010 (unaudited)
total external revenue 3,313 1,823 – 1,511 736 355 – 7,738
inter-segment revenue 1,536 1 – 240 – 1 (1,778) –
revenue from the sale of goods 4,849 1,824 – 1,751 736 356 (1,778) 7,738
$ MILLIONCOMMODITIES & INGrEDIENTS ANZ ASIA/AME LATAM ELIMINATIONS total groUP
segment assets
as at 31 January 2010 (unaudited)
total assets 12,403 3,608 1,182 933 (1,878) 16,248
$ MILLIONCOMMODITIES & INGrEDIENTS ANZ ASIA/AME LATAM ELIMINATIONS total groUP
for the 6 months to and as at 31 January 2009 (unaudited)
external revenue 5,306 1,504 867 358 – 8,035
inter-segment revenue 923 461 31 37 (1,452) –
revenue from the sale of goods 6,229 1,965 898 395 (1,452) 8,035
total assets 12,291 3,876 1,456 1,020 (683) 17,960
for the 12 months to and as at 31 July 2009 (audited)
external revenue 10,504 3,116 1,666 749 – 16,035
inter-segment revenue 1,502 702 39 49 (2,292) –
revenue from the sale of goods 12,006 3,818 1,705 798 (2,292) 16,035
total assets 8,734 3,599 1,156 936 (308) 14,117
Due to the seasonal nature of fonterra’s business, the final milk price for the Season can only be confirmed at the end of the financial year. for the purposes of the interim financial statements, a milk price which results in a nil profit/(loss) attributable to shareholders has been used. at year end, the milk price for the season will be confirmed, and the profit/(loss) attributable to shareholders reported.
accordingly, segmental profit analysis is only prepared at the end of the financial year.
notes to the ConsoliDateD interiM finanCial stateMents (ContinUeD) for the siX Months to 31 JanUary 2010

25
4. segMent rePorting (ContinUeD)
$ MILLION
FONTErrA TrADE &
OPErATIONS
GLOBAL INGrEDIENTS & FOODSErvICES
COrPOrATE & OThEr ANZ ASIA/AME LATAM ELIMINATIONS total groUP
segment revenue
for the 6 months to 31 January 2010 (unaudited)
total external revenue 3,313 1,823 – 1,511 736 355 – 7,738
inter-segment revenue 1,536 1 – 240 – 1 (1,778) –
revenue from the sale of goods 4,849 1,824 – 1,751 736 356 (1,778) 7,738
$ MILLIONCOMMODITIES & INGrEDIENTS ANZ ASIA/AME LATAM ELIMINATIONS total groUP
segment assets
as at 31 January 2010 (unaudited)
total assets 12,403 3,608 1,182 933 (1,878) 16,248
$ MILLIONCOMMODITIES & INGrEDIENTS ANZ ASIA/AME LATAM ELIMINATIONS total groUP
for the 6 months to and as at 31 January 2009 (unaudited)
external revenue 5,306 1,504 867 358 – 8,035
inter-segment revenue 923 461 31 37 (1,452) –
revenue from the sale of goods 6,229 1,965 898 395 (1,452) 8,035
total assets 12,291 3,876 1,456 1,020 (683) 17,960
for the 12 months to and as at 31 July 2009 (audited)
external revenue 10,504 3,116 1,666 749 – 16,035
inter-segment revenue 1,502 702 39 49 (2,292) –
revenue from the sale of goods 12,006 3,818 1,705 798 (2,292) 16,035
total assets 8,734 3,599 1,156 936 (308) 14,117
Due to the seasonal nature of fonterra’s business, the final milk price for the Season can only be confirmed at the end of the financial year. for the purposes of the interim financial statements, a milk price which results in a nil profit/(loss) attributable to shareholders has been used. at year end, the milk price for the season will be confirmed, and the profit/(loss) attributable to shareholders reported.
accordingly, segmental profit analysis is only prepared at the end of the financial year.

fonterra co-operative Group LimiteD
26
4. segMent rePorting (ContinUeD)
$ MILLIONCOMMODITIES &
INGrEDIENTS ANZ ASIA/AME LATAM ELIMINATIONStotal
groUP
segment profit
for the 12 months to and as at 31 July 2009 (audited)
Segment operating profit before depreciation, amortisation and non-recurring items 846 322 129 67 (3) 1,361
Depreciation (327) (70) (7) (20) – (424)
amortisation (67) (4) (2) – – (73)
Share of royalty income 6 – – 20 – 26
non-recurring items 35 (8) 5 – – 32
Segment profit before finance costs, equity accounted income and tax 493 240 125 67 (3) 922
Share of profit of equity accounted investees 62 – – 39 – 101
Share of profit of equity accounted investees classified as held for sale 28 – – – – 28
impairment of equity accounted investees 1 – (62) – – (61)
Segment profit before finance costs and tax 584 240 63 106 (3) 990
unallocated finance income 41
unallocated finance costs (489)
unallocated tax income (109)
Profit for the period 433
notes to the ConsoliDateD interiM finanCial stateMents (ContinUeD) for the siX Months to 31 JanUary 2010

27
4. segMent rePorting (ContinUeD)
$ MILLIONCOMMODITIES &
INGrEDIENTS ANZ ASIA/AME LATAM ELIMINATIONStotal
groUP
segment profit
for the 12 months to and as at 31 July 2009 (audited)
Segment operating profit before depreciation, amortisation and non-recurring items 846 322 129 67 (3) 1,361
Depreciation (327) (70) (7) (20) – (424)
amortisation (67) (4) (2) – – (73)
Share of royalty income 6 – – 20 – 26
non-recurring items 35 (8) 5 – – 32
Segment profit before finance costs, equity accounted income and tax 493 240 125 67 (3) 922
Share of profit of equity accounted investees 62 – – 39 – 101
Share of profit of equity accounted investees classified as held for sale 28 – – – – 28
impairment of equity accounted investees 1 – (62) – – (61)
Segment profit before finance costs and tax 584 240 63 106 (3) 990
unallocated finance income 41
unallocated finance costs (489)
unallocated tax income (109)
Profit for the period 433

fonterra co-operative Group LimiteD
28
5. ProPerty, Plant anD eQUiPMent
6 Months to31 Jan 2010
6 MONThS TO31 JAN 2009
12 MONThS TO31 JUL 2009
$ MILLION UnaUDiteD UNAUDITED AUDITED
acquisitions 221 275 597
Disposals (11) (23) (63)
capital commitments 109 324 221
6. iMPairMent of eQUity aCCoUnteD inVestees
6 Months to31 Jan 2010
6 MONThS TO31 JAN 2009
12 MONThS TO31 JUL 2009
$ MILLION UnaUDiteD UNAUDITED AUDITED
impairment of equity accounted investees – (62) (61)
fonterra’s investment in San Lu of $62 million was written down to nil in the six months to 31 January 2009. in addition, in the twelve months to 31 July 2009 a $1 million reversal of a prior impairment was recognised on the disposal of the Group’s interest in Ba’emek.
7. BUsiness CoMBinations
there have been no material business combinations during the six months to 31 January 2010; six months to 31 January 2009: none.
During the twelve months to 31 July 2009, the Group acquired the chilled dairy business of nestlé australia, acquired the australian Ski™ dairy food business and disposed of its western australia ice cream business. none of these transactions, either individually or in total, were considered material enough to require further disclosure. the acquisition of the australian Ski™ dairy food business resulted in a gain on acquisition of $13 million being recognised as the fair value of the net assets purchased were higher than the consideration paid. the gain on acquisition is included within other operating income in the income statement.
8. sUBseQUent eVents
on 4 march 2010 fonterra issued $150 million of six year unsecured fixed rate bonds.
on 23 march 2010 the Board of Directors declared an interim dividend of 8.0 cents per share payable on 20 april 2010 to the shareholders on the share register at 31 march 2010.
there were no other material events subsequent to 31 January 2010, that would impact these financial statements.
notes to the ConsoliDateD interiM finanCial stateMents (ContinUeD) for the siX Months to 31 JanUary 2010

29
fonterra co-operative Group LimiteD
9. BorroWings
6 Months to 31 Jan 2010
6 MONThS TO31 JAN 2009
12 MONThS TO31 JULy 2009
$ MILLION UnaUDiteD UNAUDITED AUDITED
opening balance 5,794 6,553 6,553
new issues
Bank loans 1,445 898 1,264
finance leases 53 22 82
commercial paper 322 729 1,050
retail bonds – – 784
medium term notes – 668 674
1,820 2,317 3,854
repayments
Bank loans (549) (17) (2,100)
finance leases (2) (23) (26)
commercial paper (384) (1,776) (2,492)
medium term notes (35) (57) (297)
(970) (1,873) (4,915)
other movements
amortisation of debt 7 37 50
changes in fair value 24 168 32
changes due to foreign currency translation (226) 932 220
(195) 1,137 302
Closing balance 6,449 8,134 5,794
included within the balance sheet as follows:
current borrowings 1,567 1,890 1,627
non-current borrowings 4,882 6,244 4,167
6,449 8,134 5,794
net interest bearing debt position
total borrowings 6,449 8,134 5,794
cash and cash equivalents (738) (751) (600)
interest bearing advances included in other non-current assets (81) (102) (86)
Bank overdraft 25 79 58
net interest bearing debt 5,655 7,360 5,166
value of derivatives used to manage changes in hedged risks
and other foreign exchange movement on debt 222 (561) 55
economic net interest bearing debt 1 5,877 6,799 5,221
net tangible assets per security
$ per listed debt security on issue 2.55 9.20 2.23
$ per co-operative share on issue 1.71 0.77 1.61
1 economic net interest bearing debt reflects the effect of debt hedging in place at balance date.
notes to the ConsoliDateD interiM finanCial stateMents (ContinUeD) for the siX Months to 31 JanUary 2010

fonterraprivate Bag 92032auckland 1142new ZeaLanD64 9 374 9000 (phone)64 9 374 9001 (fax)
this report is printed on
environmentally responsible
paper manufactured from
farmed trees under the
environmental management
system iSo 14001.