practical steps to improve management information in ... · practical steps to improve management...
TRANSCRIPT

1
Practical Steps to Improve Management Information in Government
An Independent Report by Dr Martin Read CBE
Commissioned by the Minister for the Cabinet Office and Chief Secretary to the Treasury
3rd July 2012

2
Contents
1. Executive Summary ........................................................................................................................................................ 3
2. Background ....................................................................................................................................................................... 5
3. Methodology ...................................................................................................................................................................... 6
4. Context and Relationship of this Report to Other On-going Initiatives ..................................................... 8
5. Main Findings ................................................................................................................................................................ 10
6. Summary of Recommendations .............................................................................................................................. 15
7. Detailed Recommendations ..................................................................................................................................... 16
Annexes Annex 1 Schedule of Selected Independent Reports to Government Citing Management
Information as an Issue ................................................................................................................................ 24
Annex 2 List of Meetings Held by Dr Martin Read .............................................................................................. 26
Annex 3 List of Members of the Senior Management Information Advisory Group .............................. 27
Annex 4 Paper to Efficiency and Reform Board on 26th April 2012 (excluding Annexes) .................. 28
Annex 5 Summary of Feedback from Pilot Consultation .................................................................................. 35
Annex 6 Summary Analysis of Departmental Board Packs ............................................................................. 38
Annex 7 Detailed Analysis of Departmental Board Packs ................................................................................ 40
Annex 8 Proposed New Version of the Quarterly Data Summary................................................................. 41
Annex 9 Pilot Version of the Quarterly Data Summary ..................................................................................... 45
Annex 10 Existing Version of the Quarterly Data Summary .............................................................................. 46
Annex 11 Schedule of Differences between Existing and Proposed New Version of the QDS ............. 47
Annex 12 Schedule of Current Data Being Collected by the Cabinet Office ................................................. 49
Annex 13 List of Initiatives Underway to Improve Operational Management Information ................. 64
Annex 14 Illustrative Departmental Comparison Charts .................................................................................... 65
Annex 15 Screen Shots from the Web Application ................................................................................................ 68
Annex 16 Recommendations on Reducing Data Requests for Property Data............................................. 77

3
1. Executive Summary
It has been recognised for several years that significant savings in public sector expenditure could be achieved if departments placed more focus on the issue of operational efficiency.
To improve operational effectiveness and to hold management to account for efficiency, high quality management information is essential. However, the poor quality of much of the management information available to government has been a recurrent theme of independent reports to government over many years (for examples, see Annex 1).
When the Efficiency and Reform Board (the ERB) was created at the beginning of this Parliament, it recognised that a major improvement in the quality of management information was essential to achieve the government’s objectives. At its meeting in February 2012, the ERB noted that it was taking too long to make tangible progress on this issue and ministers asked me to lead a review to formulate concrete recommendations to deliver short-term results.
My review found widespread agreement that high quality reporting on key cost and operating parameters is crucial. There was also broad consensus on the principles that must be followed to improve the quality of management information available to government.
Specifically, the main findings of my review were:
a) There is general agreement that high quality, consistent and regularly reported data is critical for improving operational efficiency in government.
b) The quality of current internal departmental reporting is variable. Comparison between departments and across common areas of spend and operational performance is difficult.
c) The current QDS is not being used in any meaningful way. Senior leaders do not systematically review and use the QDS, either in departments or in the centre of government.
d) Much data is collected and presented on an inconsistent basis.
e) There is no clear, single point of accountability for departmental management information.
f) There is no quality assurance regime for the data in the QDS.
g) The centre of government lacks a coherent management information strategy. Requests for information are uncoordinated and place an unnecessary burden on departments.
h) The use of technology to automate data collection is generally poor.
i) There is concern about publishing data externally.
The recommendations of my review focus on the immediate steps that should be taken to deliver a step change improvement in the quality of government management information, namely:
QDS reporting should be strengthened and simplified.
Rigorous, clear data standards should be set for the reporting of all common government operations.

4
The most senior Finance Officer in each department should own and be held accountable for departmental management information.
A rigorous quality assurance regime should be put in place to validate the quality of management information reported by departments.
The centre of government needs a capability to provide better and more efficient support to departments and more effective leadership on management information. This should include reporting on comparisons between departments, assisting with technology to automate data collection and exercising control over central requests to departments for information. Much of the reporting and requests for information from departments can and should be rationalised.
Senior ministers and civil service managers, both within departments and at the centre of government, should systematically review management information and use it to challenge performance.
Expenditure data in the QDS should continue to be published regularly. However, the associated performance data should not be published routinely and market sensitive data, such as variance to forecast or budget, should not be published at all.
Departments should determine and report their own departmental specific management information, applying the same principles of reporting, data standards, ownership and quality assurance that are recommended here.
If these proposals are accepted, it is essential that a top-level review process for overseeing their implementation is put in place.
I must stress that there is no “perfect” solution to the implementation of a management information framework across Government. 100% consensus is not possible. However, this is an area where the 80% plus solution will deliver 80% plus of the benefits. Moreover, the production and use of the new QDS will in itself drive improvement in the quality of the data being collected and the use that is made of it. Conversely, a lack of action will put the delivery of this government’s efficiency agenda at risk and significantly weaken efforts to hold senior management in the civil service to account.
The sooner these proposals are implemented, the sooner the public sector will start to secure the very significant benefits that are available to it and have in place a baseline that can be built upon in the years ahead.

5
2. Background
2.1 In May 2010 at the start of this Parliament, UK Gross Domestic Product (GDP) had shrunk by almost 5% in the recession of 2008/9 and public spending made up 47% of GDP, a level that was considered by all major political parties to be unsustainable. The deficit between government revenue and public spending, including debt repayments, was the largest percentage of GDP of any developed country.
2.2 The new coalition government embarked on a programme of spending cuts aiming to reduce this fiscal deficit over the lifetime of the current Parliament. The June 2010 Budget removed £6.2 billion from in-year public spending and the 2010 Spending Review that autumn removed £80 billion from public spending against the level projected by the Office for Budget Responsibility over the lifetime of this Parliament.
2.3 Over the last eight years, successive independent reviews have recognised that significant savings in public sector expenditure could be achieved if departments placed more focus on operational efficiency. In the context of the most significant spending challenge for generations, such savings are more critical than ever.
2.4 With this in mind, the Chief Secretary to the Treasury and the Minister for the Cabinet Office created an Efficiency and Reform Board (ERB) in May 2010 that brought together experts from the private sector and civil service leaders to advise the government on the programme of efficiency and reform that would be necessary to deliver the required spending cuts.
2.5 From the outset, the ERB was mindful that a major improvement in the quality of management information was essential to achieve the government’s objectives. Without improved management information, it would be very hard to deliver the level of savings required whilst protecting critical services at the same time. It would also remain difficult to hold individuals and organisations to account for their operational efficiency.
2.6 At its February 2012 meeting, the ERB noted that despite the large number of initiatives in train, it was taking too long to make tangible progress on improving management information. Ministers asked me to lead a review to formulate concrete recommendations to deliver short-term results.
2.7 This report contains the findings of my review and my recommendations for improving the quality and use of management information in government.

6
3. Methodology
3.1 Extensive consultation and analysis has taken place over the past five months. This included meetings with ministers and senior officials from across departments and the centre of government, senior finance leaders, non-executive directors, the National Audit Office and the Institute for Government. A full schedule of meetings is attached at Annex 2.
3.2 A Senior Management Information Advisory Group (SMAG) was formed to provide guidance and challenge to the work undertaken. This group comprised senior finance leaders, Non-Executive directors and representatives of the Cabinet Office and HM Treasury. Membership of the Senior Management Information Advisory Group is set out in Annex 3.
3.3 Work was also undertaken to understand how this review sits in the context of other on-going reviews. This particularly included Civil Service Reform, the Finance Transformation Project and work to establish the new Implementation Unit. The latter reports to the Chief Secretary to the Treasury and to the Minister for Government Policy on the achievement of Prime Ministerial and Deputy Prime Ministerial priorities.
3.4 The initial part of the review focused on the current QDS. Whilst the existing QDS reporting mechanism represents a ground-breaking precedent in reporting performance for Central Government, it was clear that it suffers from a number of drawbacks, not least that is not being used by senior leaders to review performance. Principles to strengthen and simplify the QDS were put forward and agreed with senior finance leaders, ministers and the Efficiency and Reform Board. For background, the paper approved by the Efficiency and Reform Board on 26th April is attached at Annex 4.
3.5 Following agreement to these principles, all 17 main central government departments were invited to take part in re-piloting a strengthened and simplified QDS. Sue Higgins (Director General Finance at the Department for Communities and Local Government), who leads for the Finance Leadership Group on matters relating to management information, conducted a number of workshops with members of the finance community to gather their views and establish a consensus.
3.6 Feedback from departments was incorporated in a final proposal for the new version of the QDS. Annex 5 provides a summary of the feedback from the pilot. It notes where the feedback has not been incorporated and the basis for that decision.
3.7 An exercise was also carried out to analyse existing Departmental Board reports from just under half of all government departments. This included establishing the extent to which departmental reports already covered the requirements of the new QDS. A summary analysis is provided at Annex 6 and a full analysis is set out in Annex 9.
3.8 The final proposal for the new version of the QDS is attached at Annex 8. The draft sent out for consultation is given at Annex 9. For comparison, the existing QDS is attached at Annex 10 and a gap analysis between the existing version and the final proposal for the new version is given in Annex 11.

7
3.9 In tandem with the piloting of the new QDS, the review also considered what other changes would be required to deliver a sustainable improvement in the quality of government management information. This included investigation of:
the current ownership and quality assurance of management information;
the extent of the information currently being asked of departments by the centre of government and the processes followed to collect it. A full list of the data currently collected is set out in Annex 12. Work was also undertaken in some areas to determine how appropriate and valuable this data actually is;
the various options for publishing QDS data. This included considering which data is made available, in what format and to whom; and
potential improvements to reporting mechanisms for expenditure and performance data. This investigation looked at how better use could be made of technologies to collect data from existing systems and how the information could be more effectively displayed.
3.10 The summary findings and associated recommendations of this review have been widely circulated. They have been endorsed by the Senior Management Information Advisory Group and the Finance Leadership Group1, which has also undertaken the pilot of the new QDS.
1 The Finance Leadership Group is attended by Directors General Finance from the largest government departments.

8
4. Context and Relationship of this Report to Other On-going Initiatives
4.1 A list of the various on-going initiatives relating to management information in government is set out in Annex 13. The relationship of this review to other key initiatives is covered below.
4.2 This review has taken place at the same time as Sir Jeremy Heywood and Sir Bob Kerslake have been considering long-term reform to the civil service. I have worked closely with Sue Higgins and Mark Lowcock2 in shaping the recommendations of my review to ensure that there is full alignment between these two areas of work.
4.3 The most effective way of ensuring that improvements to departmental management information are sustained is to make departments and their boards unambiguously responsible for it. As Mark Lowcock notes: “Putting in place a robust management information system is one of the priority actions in the Civil Service Reform Plan. Ministers and civil service management will only be able to assess departmental improvement if they have improved management information. So management information actions are a critical interdependency between implementing management information actions and other reform priorities, including updating the old Capability Reviews with departmental improvement plans. To sharpen accountability, the civil service reform plan also commits government to a set of supporting actions that include improving the QDS, and a red-tape challenge of data requirements to get rid of unnecessary reporting.”
4.4 Implementing the recommendations of my review will satisfy the management information requirements of the Civil Service Reform programme.
4.5 The Economic Secretary to the Treasury has sponsored a Finance Transformation Programme (FTP) to strengthen financial discipline and put finance at the centre of decision making. The FTP focuses on putting in place incentives for good financial management, driving forward the shared services agenda, developing finance talent and improving management information (the latter led by Sue Higgins).
4.6 Implementing the recommendations of my review will satisfy most of the management information requirements of the FTP. (Other requirements of the Finance Transformation Programme include a move to a common chart of accounts and project OSCAR, which is targeted at replacing the government’s database of public spending).
4.7 My review also coincides with an independent report from the Institute for Government on Management Information in Government. My findings are strongly aligned with the Institute for Government report.
4.8 This review has focused on key common areas of operation that apply to all or most departments. I have deliberately not directed my attention to department-specific areas (such as criminal justice or healthcare metrics). In my view, these are best drawn up by the departments themselves.
2 Permanent Secretary at the Department for International Development and Lead of the Civil Service Reform strand on Systems and Process, which includes work on Management Information.

9
4.9 The Cabinet office through the Implementation Unit is also responsible for the government’s policy performance framework, including the Business Plan structural reform actions, implementation priority reports and input and impact indicators. The policy performance framework will be subject to a separate programme of review between the Cabinet Office and departments, to ensure that it too adheres to good principles of management information, is aligned to the needs of departmental boards and, together with operational management information and Departmental Improvement Plans, is part of a coherent system of government performance and capability measurement. It will be important to ensure on-going alignment between the new QDS and the policy performance framework.
10
5. Main Findings
5.1 There is general agreement that high quality, consistent and regularly reported data is critical for improving operational efficiency in government.
A large majority of those providing input to the review agreed that:
a) regular reporting of management information on principal cost and operating parameters is crucial;
b) this information is essential for setting objectives and holding managers to account. Ministers, senior officials and Non-Executive Directors in departments, and ministers and senior officials at the centre of government must be able to assess how well departments and the public sector in general are performing and to highlight areas where operational effectiveness might be improved;
c) information needs to be collected and published regularly, against consistent standard definitions and in an auditable and transparent manner. It is important that the metrics and their definitions are not subject to constant change so that trends and variances are clearly visible over time;
d) addressing the poor quality of operational reporting is an essential pre-condition for driving the reforms to the public sector that this government seeks to achieve.
5.2 The quality of current internal departmental reporting is variable. Comparison between departments and across common areas of spend and operational performance is difficult.
An analysis of just under half of the total number of departmental board reports reveals that:
a) top level annual budgets are generally set out clearly for the period of the spending review and actual costs are tracked over the year by quarter on a cumulative basis;
b) most departments provide a top level figure for the full year forecast for the current financial year. However, this is not normally split down by quarter nor is any breakdown normally provided for the main components of the forecast;
c) where there are major projects or large amounts of managed expenditure (for example, benefits payments), these are generally identified separately;
d) however, there is little consistency between departments in structure, format, metrics or reporting time periods. It is difficult to compare or identify common themes across departments.
e) few of the reports analysed identify expenditure on common operations such as corporate services, the estate and IT, or on common transactions such as pay, procurement or grants;
f) few of the reports consider efficiency or performance metrics on common operations or transactions. The one common exception is workforce performance metrics (notably sickness absence and staff turnover rates);
g) none of the reports provide comparisons between the current period and the equivalent period in the previous year.

11
One senior finance leader provided feedback that their board would not be interested in seeing any details of expenditure on the department’s £250+ million operational expenditure because these costs are dwarfed by the billions of pounds worth of grants distributed by the department to wider public sector bodies (which are outside the departmental accounting boundary).
This comment reflects a general tendency in departmental reporting not to distinguish clearly between:
expenditure over which there is direct operational control – for example the administration budget for the core activities of a department, where departmental boards have a high level of discretion; and
expenditure over which there is little practical control – for example grants that may be determined by a formula set out in primary legislation.
Figure 1 below details the extent to which the expenditure items and performance metrics included in the proposed new QDS are detailed in each board pack. Further summary analysis can be found in Annex 6 and a detailed analysis is set out in Annex 7.
Figure 1 Analysis of department board reports
5.3 The current QDS is not being used in any meaningful way. Senior leaders do not systematically review and use the QDS, either in departments or in the centre of government.
Whilst the existing Quarterly Data Summary reporting mechanism represents a ground-breaking precedent
for government, it suffers from the following drawbacks:

12
a) the current data presentation is over-complicated and not in a form that is easy for senior officials or
ministers to digest;
b) the current presentation does not facilitate comparison with forecasts, show trends or variances or
provide a format for comparing data between departments;
c) although some elements of the data are common between the QDS and internal reporting, no
departments are using the QDS internally;
d) there are inconsistencies in the extent to which all parts of a department are included, in the timeliness
of data and in the consistent allocation of costs to quarters;
e) there is no flexibility within current arrangements to alter the reporting format to meet the particular
circumstances of a department. For example, all departments are asked to set out their largest grants,
even where these grants are immaterial to the department’s spend.
Senior civil service managers and ministers cited these drawbacks in explaining why they do not use the current QDS as a basis to review performance or to make decisions. The current QDS is not reviewed nor is it used as a source of information to assess personal or organisational performance.
5.4 Much data is collected and presented on an inconsistent basis.
It is not possible for departments to benchmark their performance meaningfully against other departments unless they use common data standards for their management information. This is not generally the case at present. Indeed, there are only limited instances where common data definitions are applied consistently (for example, headcount). Coalescence towards common data standards has been very slow.
It should also be noted that:
presenting some data on a cumulative basis and some on a per quarter basis makes comparisons impossible;
it is difficult to compare data that is prepared on a cash basis (where expenditure is recognised at the point at which money leaves an organisation) with data that is prepared on an accruals basis (where expenditure is recognised at the point at which a commitment is made or at which goods or services are delivered); and
there are inconsistencies in which departmental organisational boundaries are used in different parts of the current QDS. For example, finance data might relate to the entire scope of a department including all Executive Agencies and Arms Length Bodies, whereas other metrics might relate to only certain parts of the department.
All these shortcomings make it near impossible to compare common areas of spend and operational performance across departments.
13
5.5 There is no clear, single point of accountability for departmental management information.
Ownership of management information across government is inconsistent. There is usually no clearly identified single official who is held to account for the quality of all departmental management information.
Without a single point of accountability for data quality, it is inevitable that different approaches will be used and that data will be less reliable.
5.6 There is no quality assurance regime for the data in the QDS.
A rigorous quality assurance regime for management information is essential if it is to be accurate, consistent and comparable between departments.
At present, most management information that is included in the QDS is not subjected to a rigorous quality assurance mechanism. Departmental, and therefore some pan-governmental decisions, are sometimes based on data of unknown calibre. A rigorous quality assurance mechanism is crucial to focus efforts on producing accurate and reliable management information.
5.7 The centre of government lacks a coherent management information strategy. Requests for information are uncoordinated and place an unnecessary burden on departments.
The centre of government does not provide strategic leadership on management information nor does it provide effective coordination on management information across the Cabinet Office, HM Treasury and Downing Street, or between the finance, procurement, HR, IT and property professions.
Some central government teams issue detailed data requests that add no obvious strategic value. For example, it is difficult to see how the previous year’s expenditure on furniture repairs or the number of tea points in each building will deliver the government’s property strategy. Teams (such as procurement) that have significantly scaled back requests for departmental data to a small, focused number of items have reported no negative results.
There is no formal coordination between data requests from the centre of government and this leads to duplication. For example, several different teams in the Cabinet Office ask for similar IT-related data. Tangible evidence of this lack of coordination can be found in the schedule of current Cabinet Office data collections which is attached as Annex 12. The Cabinet Office alone regularly requests over 1,000 individual pieces of data from departments at present. In a review that we carried out in one Cabinet Office area, we concluded that over half of the information being collected added no real value.
Because the centre of government does not assess the cost-benefit trade-off or demonstrate the value of the management information it requests from departments, the quality of data returned by departments is often poor, wastes valuable resource and creates a credibility problem.
Overall, the centre of government does not have sufficient capacity or skilled resource to drive quality management information and there is no single unit that has accountability for owning and maintaining operational data standards. Where new policies are developed, there is no standard process to ensure that management information requirements are considered up front. Too often, management information to track performance is considered only after a policy has been agreed.

14
It is also notable that there is no common IT infrastructure to collect, store, publish or report on the data. Most data collection takes place by professionals in departments manually re-entering data from a management system into a spreadsheet. This is a particularly inefficient and ineffective method of data collection and prone to error.
At present, there is no central capability to produce comparisons of departmental performance.
5.8 The use of technology to automate data collection is generally poor.
Government does not make proper use of new technologies to streamline and automate data input seamlessly from departmental systems or to provide fit for purpose reporting that senior leaders can use to assess performance.
Much data is currently collected using poorly designed spreadsheets. This is a highly inefficient way of managing data collection and storage and liable to error. Data that could be captured once and used multiple times is not being fully leveraged.
Better use of technology would deliver:
greater automation, leading to a dramatic reduction in the burden of responding to central data requests;
improved data quality and assurance through less user and data transfer error;
improved reporting, enabling the centre of government and departments to extract the maximum value from the data collected.
5.9 There is concern about publishing data externally.
There is considerable sensitivity over the issue of publishing performance data externally.
External publication fulfils the wish for total transparency. However publishing management information externally that is used to hold individuals to account for their performance can have perverse consequences. Ill-informed public comment can create a conflicting incentive on departments and reduce the impartiality of reporting and thereby data integrity.
Publishing performance data that is used to manage individuals and departments therefore risks detracting from the principle objectives of focussing on operational management, achieving greater operational understanding and securing improved operational efficiency.
In addition, many data elements included in the proposals are commercially or market- sensitive, notably data on variance to budget or forecasts.
15
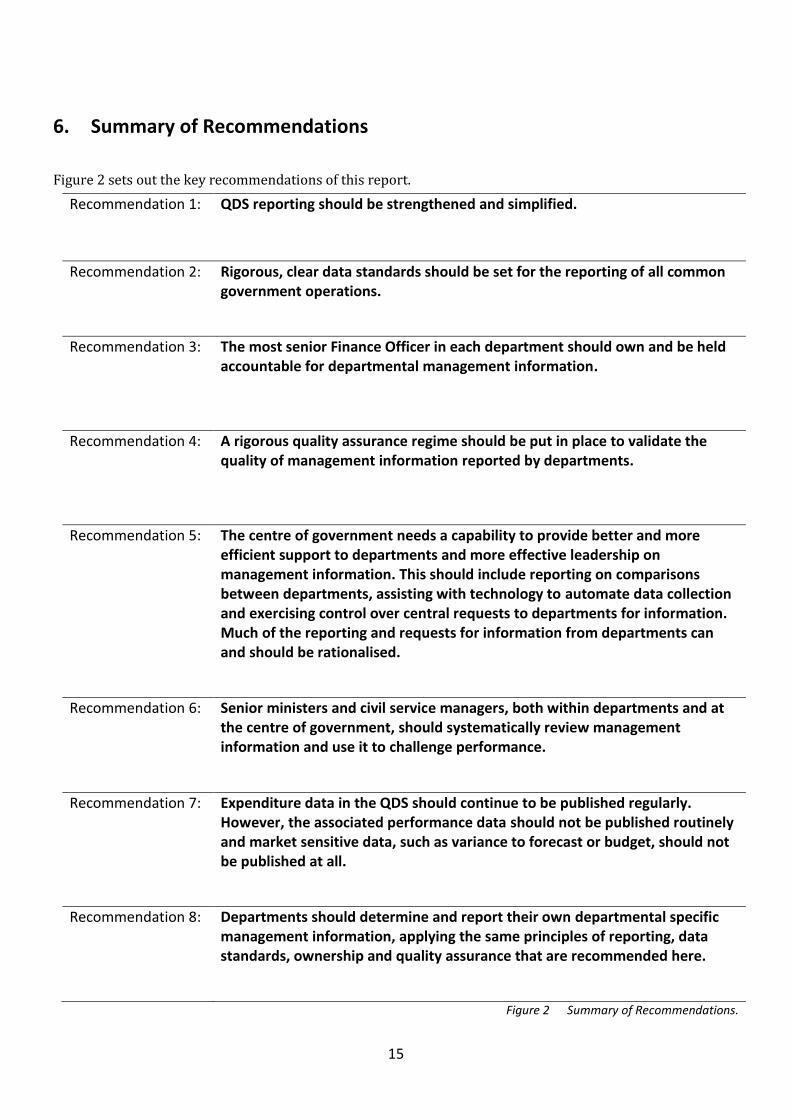
6. Summary of Recommendations
Figure 2 sets out the key recommendations of this report.
Recommendation 1: QDS reporting should be strengthened and simplified.
Recommendation 2: Rigorous, clear data standards should be set for the reporting of all common government operations.
Recommendation 3: The most senior Finance Officer in each department should own and be held accountable for departmental management information.
Recommendation 4: A rigorous quality assurance regime should be put in place to validate the
quality of management information reported by departments.
Recommendation 5: The centre of government needs a capability to provide better and more efficient support to departments and more effective leadership on management information. This should include reporting on comparisons between departments, assisting with technology to automate data collection and exercising control over central requests to departments for information. Much of the reporting and requests for information from departments can and should be rationalised.
Recommendation 6: Senior ministers and civil service managers, both within departments and at the centre of government, should systematically review management information and use it to challenge performance.
Recommendation 7: Expenditure data in the QDS should continue to be published regularly. However, the associated performance data should not be published routinely and market sensitive data, such as variance to forecast or budget, should not be published at all.
Recommendation 8: Departments should determine and report their own departmental specific management information, applying the same principles of reporting, data standards, ownership and quality assurance that are recommended here.
Figure 2 Summary of Recommendations.

16
7. Detailed Recommendations
7.1 QDS reporting should be strengthened and simplified.
The following principles for strengthening and simplifying QDS reporting have been agreed by the Senior Management Information Advisory Group, the Finance Leadership Group and the Efficiency and Reform Board:
a) The new QDS regime should:
i. focus on key common areas of spend that apply to all or most departments;
ii. allow departments some flexibility to focus on areas and organisations that are financially material to them. However, at least three quarters of a department’s spend must be separately set out as line items within each report, and any item for which there is a cabinet-agreed central approach must be included, (e.g. consulting and construction);
iii. include reporting formats that enable Ministers, senior officials and Non-Executive Directors both in departments and in the centre of government to compare overall operational performance across government;
iv. use a comments column to note the reasons for major variances – for example setting out that higher than usual staff turnover arises from a redundancy programme or that estates costs are unchanged because of fixed leases;
v. be implemented in October.
b) The reporting should include trend and variance information. The quarterly metrics should generally compare the actual outturn in a given quarter both with the original budget and with the same period in the previous year. Year to date (YTD) figures should be provided in the same format, as should full year forecasts. Data should be provided for the current quarter, the year to date and the full-year forecast, in a way that allows comparison between the actual or forecast for the period, the actual for the same period in the previous year and the departmental budget.
c) Organisations should provide both absolute £ values and meaningful measures of efficiency (for example, providing both the absolute cost of the corporate functions and the ratio between this cost and headcount). This will facilitate comparisons between departments. Illustrative comparison charts are attached at Annex 14.
d) For Major Projects, departmental reporting should be consistent with the Government Major Projects Portfolio reporting. For the entire departmental portfolio of major projects it should include: the percentage of successful outcomes predicted, the percentage of on time delivery, the percentage of costs within budget, the percentage of benefits on budget, and the churn rates of key personnel. For each major project, it should include:
i. total spend to date;
ii. forecast total cost at completion for the current and previous quarter and originally budgeted total cost at completion;

17
iii. forecast completion date for the current and previous quarter and originally budgeted completion date.
e) The Major Projects Authority should consider extending the Government Major Projects Portfolio data set to include contingency by major project, as at the current and previous quarter and as originally budgeted.
f) In establishing the reporting format for the QDS, data should be provided which focuses on meaningful organisational units.
g) The reporting period should be:
i. quarterly, although it should be noted that a few parameters (for example, the area of the estate) may not change each quarter;
ii. timely, i.e. as close as possible to the end of the quarter to which the data relates.
h) Spend should be ‘cut’ in 3 ways for which there are already common definitions:
i. by budget type (DEL / AME);
ii. by operation type (policy delivery / back office);
iii. by transaction type (procurement / pay / grants).
i) Given the requirement to focus on significant expenditure for each department, there needs to be flexibility in the manner in which the data is presented. Reporting should focus on those items of expenditure that are most material to a department. For example, not all central government organizations run major projects, and for some organizations, grant or AME payments are not significant. Where spend is not material it should be omitted as a line item, although it will always be included within the total expenditure shown on the schedule.
j) All data should correspond as far as possible with existing departmental management accounts which should minimise the burden on departments. The core data set should focus on key data only. If departments cannot produce it, they will need to change their systems to meet the basic common standards. Manual re-working of data is to be avoided.
A draft of the proposed new QDS was successfully piloted by over half of government departments in June. Following feedback from departments, a limited number of revisions were made to the draft.
The new format should be implemented for all core departments from Autumn 2012 and rolled out to all major Arms Length Bodies by the end of 2012/13.
7.2 Rigorous, clear data standards should be set for the reporting of all common government operations.
Management information that is common across departments should be defined clearly and rigorously and these definitions should be applied uniformly across all departments.
18
A clear, rigorous common standard should be developed that specifies central government organisations. For example, there should be a clear definition that is consistently applied that specifies what precise organisational scope is referred to by each of the terms “Department for Transport”, “Department for Transport Corporate Centre”, and “The Department for Transport and its Executive Agencies and Arms Length Bodies”.
It should be clear which departmental Board is accountable for each organisation being considered.
To achieve meaningful comparisons across a range of operational management information, a consistent technical approach to preparing the data is required. This should include ensuring that there:
are clear data standards to underpin each metric used;
is clarity over the organisational scope covered by the data;
are consistent time periods being used to record data;
is clarity over the accounting basis on which the data is prepared.
It is important that the metrics and their definitions are not subject to constant change so that trends and variances are clearly visible over time.
7.3 The most senior Finance Officer in each department should own and be held accountable for departmental management information.
The most senior Finance Officer in each department should be clearly and unambiguously responsible for the quality of the management information that is collected by their department and which relates either to financial figures or to common operations.
This should include information that derives from the finance system and information relating to finance or to common operations that is drawn from other systems and sources in the department.
The most senior Finance Officer should have a personal objective to deliver management information that is of sufficient quality to support the new QDS and the decisions being taken by ministers and senior managers.
7.4 A rigorous quality assurance regime should be put in place to validate the quality of management information reported by departments.
Management information must be subject to a rigorous quality assurance mechanism. Otherwise comparisons between departments will be unreliable and decisions are likely to be taken on the basis of poor quality information.
The most senior finance official in a department should ensure that each process and system that is generating management information has fit for purpose internal controls to assure the production of high quality data.
19
Periodic reviews of the integrity and quality of departmental management information should be carried out by the departmental internal audit function. This should be clearly specified within a departmental internal control or governance statement and satisfy central best practice standards. A significant proportion of a department’s systems and processes producing management information should be audited by the department’s internal audit function once each year.
Internal Audit reports should be shared with and reviewed by the departmental Accounting Officer, senior Finance Official and Audit Chair, and with the Cabinet Office.
A table should be included within each department’s published accounts setting out the outturn for the year including summary totals for RDEL, CDEL and AME, the total cost of running the estate, the total cost of running IT, the total cost of corporate services, the total cost of policy delivery, the total expenditure on pay, the total expenditure on procurement, the total expenditure on grants and the total expenditure on each of the department’s major projects. This table should be audited by the National Audit Office.
The centre of government should:
a) produce clear guidelines that can be applied across government on best practice in internal process controls, standards on how internal audit should be conducted and on what data to include in the annual report;
b) conduct a small sample of reviews of data systems using an external auditor. Each department should reasonably expect a material proportion of its spend and activity to be checked by an external auditor once every three years;
c) publish a compendium report setting out the percentage of each department's data that has been reviewed by internal and external auditors and the quality of that data. This should provide an input to finance directors' annual appraisals.
7.5 The centre of government needs a capability to provide better and more efficient support to departments and more effective leadership on management information. This should include reporting on comparisons between departments, assisting with technology to automate data collection and exercising control over central requests to departments for information. Much of the reporting and requests for information from departments can and should be rationalised.
A unit should be established in the centre of government that is staffed by appropriately skilled professionals and can:
a) set management information strategy and data standards;
b) collate data once on behalf of all the centre of government, and report on that data;
c) provide advice on the management information impact of new operational policies, and on how performance against new policies can be tracked using operational management information;
d) use available technologies to streamline and automate data collection;
e) control and rationalise the various requests to departments from central government units;
f) act as a ‘gateway’ so that data collected once can be used multiple times;
g) provide ministers and senior civil service leaders with tools that enable them to view government expenditure data easily (images from a pilot web application are provided at Annex 15);
h) provide ministers and senior civil service leaders with charts that allow them to compare performance across departments, (see the charts proposed which are attached as Annex 14).

20
Urgent consideration should be given to how this unit reports into HM Treasury and Cabinet Office ministers.
The number of items of data collected by central government should be rationalised. For example, this review has investigated the data requirements for property and proposes that the exercises detailed at Annex 16 should be dropped with immediate effect, taking property data requirements from 266 items down to less than 100.
All other areas should be subject to a similar one-off ‘Red-Tape Challenge’ exercise to do away with needless or low value data requests. This exercise needs to scrutinise for each area:
a) whether all current data requests are genuinely required;
b) whether alternative sources can be used to satisfy management needs;
c) whether the method of collection could be automated or otherwise made simpler;
d) whether there are opportunities to generate greater value from existing data;
e) whether the resource required in the centre and in departments to fulfil the data requests is proportionate and appropriate.
This Red Tape Challenge exercise should complete in Autumn 2012 with the objective of bringing down the quantity of data collected by more than half.
7.6 Senior ministers and civil service managers, both within departments and at the centre of government, should systematically review management information and use it to challenge performance.
The purpose of collecting management information is to improve ministers’ and managers’ understanding of operational performance and efficiency and assist with better decision-making by senior leaders in departments and at the centre of government.
The comparative analysis charts that accompany the new format Quarterly Data Summaries (see Annex 14) should be circulated to departmental boards and Non-Executive Directors each quarter. Departmental boards and Non-Executive Directors should commission the new central unit if they have further requirements.
The comparative analysis charts should also be used by the Chief Secretary and the Minister for the Cabinet Office in their bilateral meetings with Secretaries of State, and made available to the Prime Minister, Deputy Prime Minister and Chancellor upon request. The Head of the Civil Service and the Cabinet Secretary should use the comparative analysis charts in their bilateral conversations with permanent secretaries.
Consideration should be given to incorporating the expenditure data and comparative analysis into the Prime Minister’s Web Application.
7.7 Expenditure data in the QDS should continue to be published regularly. However, the associated performance data should not be published routinely and market sensitive data, such as variance to forecast or budget, should not be published at all.
There is general interest amongst commentators and the wider public to understand how government spends taxpayers’ money. However, there has not been widespread interest in the current QDS reporting, probably because it is difficult to understand.

21
The existing public reporting should be discontinued. The Implementation Unit should advise on how departments should publish their impact and input indicators. The Cabinet Office should work with HM Treasury to develop a web-based application to set out government spending. This should set each department’s expenditure in the context of Total Managed Expenditure. It should allow interested parties to investigate and compare items of expenditure reported in the QDS.
Performance ratios should not be published routinely and variance to forecast or budget information should not be published at all.
In view of the sensitivity of total full-year expenditure forecasts, these forecasts should only appear on QDS documents with a restricted circulation. Unrestricted circulation QDS documents should show full year forecasts only for areas of common operations and not the overall totals.
The recommendations in this section need to be reviewed and confirmed by government experts on the Freedom of Information Act.
7.8 Departments should determine and report their own departmental specific management information, applying the same principles of reporting, data standards, ownership and quality assurance that are recommended here.
This review has focussed on key common metrics that apply to all or most departments. It has not considered departmental-specific management information (such as criminal justice or healthcare metrics).
Departments should develop similar approaches to specific departmental management information.
In several cases, Non-Executive Directors are already working with departments to improve the quality of department-specific management information and this work should be taken to a successful completion.
Department-specific management information should be brought into QDS reporting downstream.

22
Annexes
Annex 1 Schedule of Selected Independent Reports to Government Citing Management Information as an Issue ................................................................................................................................ 24
Annex 2 List of Meetings Held by Dr Martin Read .............................................................................................. 26
Annex 3 List of Members of the Senior Management Information Advisory Group .............................. 27
Annex 4 Paper to Efficiency and Reform Board on 26th April 2012 (excluding Annexes) .................. 28
Annex 5 Summary of Feedback from Pilot Consultation .................................................................................. 35
Annex 6 Summary Analysis of Departmental Board Packs ............................................................................. 38
Annex 7 Detailed Analysis of Departmental Board Packs ................................................................................ 40
Annex 8 Proposed New Version of the Quarterly Data Summary................................................................. 41
Annex 9 Pilot Version of the Quarterly Data Summary ..................................................................................... 45
Annex 10 Existing Version of the Quarterly Data Summary .............................................................................. 46
Annex 11 Schedule of Differences between Existing and Proposed New Version of the QDS ............. 47
Annex 12 Schedule of Current Data Being Collected by the Cabinet Office ................................................. 49
Annex 13 List of Initiatives Underway to Improve Operational Management Information ................. 64
Annex 14 Illustrative Departmental Comparison Charts .................................................................................... 65
Annex 15 Screen Shots from the Web Application ................................................................................................ 68
Annex 16 Recommendations on Reducing Data Requests for Property Data............................................. 77

23
Annex 1 Schedule of Selected Independent Reports to Government Citing Management Information as an Issue
Independent Reports to Government
- In his 2004 Efficiency Review Sir Peter Gershon found: “Strong financial management is essential to the efficient use of resources and a pre-requisite to the successful delivery of major efficiency programmes…. As a priority, I recommend that the financial management of government departments be strengthened…”
- In his 2009 Operational Efficiency Programme Report , Dr Martin Read found: “lack of management information on public sector expenditure… makes it hard to identify what the costs of these operations actually are.”
- In his 2009 report into Government Procurement Martin Jay found: “Departments do not maintain commercial management information in an accurate or consistent way… Maintenance of these data is a basic hygiene factor for good financial management; the taxpayer should expect government to be able to explain what it spends, and with whom.”
- In his 2010 Efficiency Review Sir Phillip Greene found: “Inefficiency and waste of Government spending is… due mainly to very poor data… Data is very poor and often inaccurate… The quality of data provided by departments is inconsistent – there needs to be a central mandate to provide accurate timely data.”
- In his 2012 Government Lead Non-Exec Annual Report Lord Browne found: “While business planning is improving, it can be better connected with performance information, risk management and financial metrics. To make most effective use of Board members’ time it is vital that there is an emphasis on enabling decisions rather than presenting data “for information”. There has been progress towards establishing a common way of measuring key government information, but further improvements are necessary to ensure that centrally-collected management information is relevant, not unduly burdensome, and enables comparison across Departments and transparency of key performance data.”
- In their 2012 report, Improving decision making in Whitehall The Institute for Government found: effective use of management information, highlighted the fact that ”the historic weakness of Whitehall in producing and using such management information (MI) remains a focus of concern for bodies like the National Audit Office (NAO). The absence of such information and analysis is particularly striking to those from a commercial background, such as the new non-executives on departmental boards.”
NAO reports to central government:
- The effectiveness of internal audit in central government, 2012, which found: “Our value-for-money studies, such as the procurement of Type 45 destroyers and the development of new fire and rescue regional control centres, have identified many instances where there has been poor value for money because core systems have not provided sufficiently realistic, robust or comprehensive information to allow effective oversight and decision-making. In many cases these weaknesses have not been identified by internal audit.”
- The GPC, 2012, which found: “Some departments have inadequate management information and cannot monitor Government Procurement Card use effectively. This presents a further weakness in departmental controls. Without accurate data, departments cannot monitor adherence to policies, assess exposure to risk, or review whether controls meet business need.”

24
- Efficiency and reform in Government corporate functions through shared service centres, 2012, found: “Most shared service customers do not have adequate information on costs, performance and benefits to make informed decisions.”
- Committee of Public Accounts conclusions and recommendations, 2008, found: “Government lacks reliable information on the cost of corporate services. Departmental management boards should receive clear information on the cost and performance of their corporate services (finance, procurement, human resources and facilities management) so that they can consider the contribution these services make to key business objectives and whether they are providing value for money.”
- Cost reduction in central government: summary of progress, 2012, found: “Departments do not have good enough information on devolved bodies’ costs and performance to secure value for money when funding is reduced.”
- Improving the efficiency of central government office property, 2012, found “Centralised information on property is not designed to allow departments to manage their estate collectively or to market the estate to potential tenants and buyers.” And also “Weaknesses in the central information on the office estate make it difficult to trace the falling size and cost savings achieved accurately.”
- Option Appraisal: Making informed decisions in Government, 2011, found: “Without high quality
information government will not be well placed to respond to the immediate challenge of cuts to funding and longer-term challenges of providing sustainable high-quality public services and creating the right climate for economic growth.”
- Progress in improving financial management in government, 2010, found: “It remains unusual for departments to have good information on the unit costs of outputs, measures of productivity or the value of outcomes, especially where outcomes cross departmental boundaries. Many strategies, business plans, resource allocations and performance reporting frameworks do not clearly link together. Without information on costs and benefits, departments do not have a sound basis for making fully informed choices about what activities to stop, to change, and to continue, as they were asked to do in the Spending Review.” And “While there has been progress since 2008, there is scope for further improvement in financial data presented to departmental Boards to inform decision-making.”
- Managing financial resources to deliver better public services, 2008, found: “Departments could do more to link improved financial management information to information about the quality of public services being delivered. If departments know exactly what has been spent on what programmes and to what effect, they will be better able to assess whether they are achieving value for money and engage more intelligently with delivery partners. Most departments are not sufficiently well placed to do this as they have made limited progress in integrating financial and operational performance information. More than half of departments still report financial and operational performance information to the Board separately. Non-Executive Directors in our workshops expressed frustration that it is not routine for key decisions to be based on a comprehensive assessment of both financial management information and data on service performance.”
- Performance Frameworks and Board Reporting, 2009, found: “Organisations need to devote more attention to data quality, and improve its presentation, to support decision-making. Routine validation of the data systems underpinning Government priorities regularly highlights poor data quality and our follow-up work provided several examples of frameworks operating with little attention to the quality of the measures used to populate them. Presenting performance data in context generates performance information. For example, by presenting measures against benchmarks Boards can compare performance and judge value for money. Our review of Board reports showed that they often lacked clarity and would benefit from a more analytical explanatory commentary.”

25
Annex 2 List of Meetings Held by Dr Martin Read
Rt Hon Danny Alexander MP, Chief Secretary to the Treasury
Lord Browne of Madingley, Government Lead Non-Executive Director, Lead Non-Executive Director at the Cabinet Office and member of the Efficiency and Reform Board
Will Cavendish, Head of the Implementation Unit, Cabinet Office
Katharine Davidson, Director of Strategy and Management Information, Cabinet Office
Melanie Dawes, Permanent Secretary, Cabinet Office
Lindsey Fussell, Head of Financial Management, HM Treasury
Gerry Grimstone, Lead Non-Executive Director, Ministry of Defence
Rt Hon Phillip Hammond MP, Secretary of State for Defence
Sir Jeremy Heywood, Cabinet Secretary
Sue Higgins, Finance Director General, Department of Communities and Local Government and Finance Leadership Group lead on Management Information
Lin Homer, Permanent Secretary at HM Revenue and Customs
Sir Bob Kerslake, Head of the Civil Service
Mark Lowcock, Permanent Secretary at the Department for International Development and lead for the Civil Service Reform work on systems and processes
Julian Macrae, Director of the Institute for Government
Bruce Mann, Finance Director, Cabinet Office
Rt Hon Francis Maude MP, Minister for the Cabinet Office
Claire Moriarty, Finance Director General and Acting Permanent Secretary, Department for Transport, and Finance Leadership Group lead on ERG and Business Plans
Amyas Morse, Comptroller and Auditor General and Head of the National Audit Office
Phil Pavitt, Chief Information Officer, HMRC
David Pitchford, Head of the Major Projects Authority, Cabinet Office
Lord Sainsbury, Founder, the Institute for Government
Ed Smith, Former COO, Price Waterhouse Coopers, Non-Executive Director at the Department for Transport, with numerous non-executive board positions across the public sector
Jon Thomson, Finance Director General, Ministry of Defence
Ian Watmore, Permanent Secretary, Cabinet Office
Sharon White, Director General, Public Spending, HM Treasury

26
Annex 3 List of Members of the Senior Management Information Advisory Group
Chairman: Martin Read, Non-Executive Director, Efficiency and Reform Board
Members:
Sue Higgins, Director General, Finance and Corporate Services, Communities and Local Government
Clare Moriarty, Finance Director General, Department for Transport
Jon Thomson, Finance Director General, Ministry of Defence
Felicity Harvey, Director, Performance and Reform Unit, Her Majesty’s Treasury
Ed Smith, Non-Executive Director, Department for Transport
Lindsey Fussell, Director, Financial Management and Reporting, Her Majesty’s Treasury
Secretary: Carl Meewezen, Deputy Director, Performance and Management Information, Cabinet Office
27
Annex 4 Paper to Efficiency and Reform Board on 26th April 2012 (excluding Annexes)
The Annexes mentioned here are not included.
Improving Government Management Information Reporting – Proposed Approach and Implementation
Efficiency and Reform Board Away Day Paper for Pre Reading
Author: Dr Martin Read
1. Issue and background
It has been recognised for several years that significant savings in public sector expenditure could be achieved if departments placed more focus on the issue of operational efficiency.
When the Efficiency and Reform Board (ERB) was created at the beginning of this Parliament it recognised that a major improvement in the quality of government’s operational management information was essential to achieve this objective.
At its meeting in February the ERB noted that a large number of initiatives were in train to improve management information (for further details see Annex A) but that it is taking too long to make tangible progress on this issue. It was agreed that these initiatives need to be joined up and brought to a conclusion.
Ministers invited me to chair an advisory group to formulate concrete recommendations to deliver short-term results. It was agreed that this issue would be revisited in more detail at the ERB Away Day, planned for late April.
2. Update on Progress
Since the February meeting, I have worked through a schedule of meetings with senior ministers and officials to gauge what consensus exists on management information reporting in government. A full schedule of meetings is attached at Annex B. I have also chaired the inaugural meeting of the Senior Management Information Advisory Group to consider early stage proposals for a replacement to the existing reporting formats. There is general consensus that:
a) regular reporting of management information on principle cost and operating parameters is crucial;
b) this information is essential for setting objectives and holding people to account. Departmental
ministers, senior officials and Non-Executive Directors, and ministers and senior departmental
officials in central departments must be able to assess how well departments and the public sector
28
in general are performing and to highlight areas where operational effectiveness might be
improved;
c) information needs to be collected and published regularly, against consistent standard definitions
and in an auditable and transparent manner. It is important that the metrics and their definitions
are not subject to constant change so that trends and variances are clearly visible over time;
d) although the current reporting through the Quarterly Data Summaries (QDS) has set a ground
breaking precedent for government, it suffers from the following drawbacks:
i. the current data presentation is over-complicated and not in a form that is easy for senior
officials or ministers to digest;
ii. although elements of the data are common between the QDS and internal reporting, no
departments are using the QDS internally;
iii. the current presentation does not facilitate comparison with forecasts, show trends or
variances, or provide a format for comparing data between departments;
iv. there are inconsistencies in the extent to which all parts of a department are included, in the
timeliness of data and in the consistent allocation of costs to quarters.
e) addressing the poor quality of operational reporting is an essential pre-condition for driving the
reforms to the public sector that this government seeks to achieve.
3. Proposed approach
The proposed approach, which was endorsed at the Senior Management Information Advisory Group meeting on the 27th March, is to: a. agree a format for regular reporting that will:
i. be implemented in July (within three months of it being agreed);
ii. enable Ministers, senior officials and Non-Executive Directors to compare overall operational
performance across government;
iii. provide a streamlined and simplified replacement for the QDS.
b. focus on key common metrics that apply to all or most departments. I do not propose to cover
department-specific metrics (such as criminal justice or healthcare metrics). These are best drafted by
the departments themselves. I understand that department-specific metrics are being reviewed by
the Implementation Unit and I propose that they be brought into the reporting downstream;
c. Include trend and variance information. The quarterly metrics should generally compare the actual
outturn in a given quarter both with the original budget and with the same period in the previous
year. Year to date figures should be provided in the same format, as should full year forecasts;
d. provide both absolute £ values and meaningful measures of efficiency (for example, providing both
the absolute cost of the corporate functions and the ratio between this cost and headcount). This will
facilitate comparisons between departments;

29
e. for Major Projects, show:
i. total spend to date;
ii. forecast total cost at completion for the current and previous quarter and originally budgeted
total cost at completion;
iii. forecast completion date for the current and previous quarter and originally budgeted
completion date;
iv. contingency as at the current and previous quarter and as originally budgeted.
f. establish a reporting format that:
i. has a core, common data set;
ii. is based on a standard reporting dashboard that covers all totals but which allows
departments flexibility to focus on areas where they have the majority of their spend;
iii. includes reporting formats that allow comparison across departments; and
iv. uses a comments column to note the reasons for major variances – for example setting out
that higher than usual staff turnover arises from a redundancy programme or that estates
costs are unchanged because of fixed leases.
g. ensure that rigorous, clear definitions exist for each operational parameter and reporting entity that
can be consistently applied to achieve comparability;
h. establish a meaningful review mechanism that will enable departmental ministers, senior officials and
non-executive directors, and ministers and senior officials in central departments, to compare overall
operational performance across government, seek explanations for major variances, and hold
departments and individuals to account; and
i. agree a mechanism for assuring data integrity, for example making it subject to audit.
4. Main features of the proposed reporting format
In establishing the reporting format described above, the following design principles are proposed:
a. Data will be provided:
i. which focuses on meaningful organisational units;
ii. in a manner that always tallies back to totals sourced in the management accounts;
iii. quarterly;
iv. for the current quarter, the year to date (YTD) and the full-year forecast;
v. in a way that allows comparison between the actual or forecast for the period, the actual for
the same period in the previous year and the departmental budget;
vi. in a timely fashion, and as close as possible to the end of the quarter to which it relates.
It should be noted that a few parameters (for example the area of the estate) may not change each quarter.

30
b. Spend should be ‘cut’ in 3 ways, for which there are already common definitions:
i. by budget type (DEL / AME);
ii. by operation type (Policy Delivery / Back Office); and
iii. by transaction type (procurement / pay / grants).
c. The top level reports should include information on Major Projects as reported by departments to the
Major Projects Authority.
d. Within the overall totals of departmental expenditure, reporting should focus on:
i. Large areas of spend that are financially material. The objective is that at least three quarters
of a department’s spend is separately set out within each report;
ii. Spend where there is a cabinet agreed central approach (e.g. consulting, construction).
e. Given the requirement to focus on significant expenditure for each department, there needs to be
flexibility in the manner in which the data is presented. Reporting should focus on those items of
expenditure that are most material to a department. For example, not all central government
organizations run major projects, and for some organizations, grant or AME payments are not
significant. Where spend is not material it should be omitted as a line item, although it will always be
included within the total expenditure shown on the schedule.
f. There is considerable sensitivity over the issue of publishing data externally. External publication
fulfils the wish for total transparency. However, publishing data externally leads to ill-informed
comment and detracts from the principle objectives of focusing on operational management,
achieving greater operational understanding, and securing improved operational efficiency. My
review concentrates on the data required by departments, their boards and the centre of
government for the purposes of good, transparent management. External publication and issues
arising from the Freedom of Information Act need to be considered separately by ministers.
g. All data should correspond as far as possible with existing departmental management accounts and in
order to try to this should minimise any burden on departments. However it is key data that is being
required and if departments cannot produce it, they will need to change their systems to meet the
basic common standards. Manual re-working of data is to be avoided.
5. Proposals for comparing data between departments
a. Much of the value from this initiative will be derived through being able to make meaningful
comparisons between departments in common areas of activity. This will enable government to:
i. identify anomalies and discrepancies between departments;
ii. seek explanations for differences. For example, are there good reasons for a particular
department to have much higher corporate costs per head than other, apparently similar,
departments?

31
iii. use comparisons as a tool to improve operational effectiveness; and
iv. hold individuals to account for their performance.
b. It is proposed that efficiency and statistical comparison charts are compiled centrally and circulated
to operational departments and their boards as well as central departments. These charts will include
most of the key parameters set out on the right hand side of the proposed new QDS.
c. It may be appropriate to include private sector data in some of the efficiency and statistical
comparison charts.
6. Illustrative revised Quarterly Data Summaries and Efficiency and Statistical Comparison Charts
Annex C is an illustrative new version QDS.
i. The stacked bars on the left hand side of the page enable the reader to understand the
context of the expenditure shown in the schedule in relation to overall government spending.
ii. It may be possible to include data not just from central government departments, but also
their Arms Length Bodies (ALBs). For example, the Arts Council might complete a QDS setting
out how their £388m funding is spent.
iii. The right hand side of the page shows key efficiency and statistical comparison data.
iv. The chart includes some blanks where data on department-specific measures (such as criminal
justice and healthcare) will be added at a later date.
v. The section at the bottom of the page covers any Major Projects in the department.
Annex D is an illustrative efficiency and statistical comparison chart which compares performance in the current quarter with the same quarter for last year.
Both Annex C and Annex D will continue to be developed and refined with senior finance leaders.
Annex E sets out the major differences between the existing QDS and the current draft new QDS
7. Proposed Implementation Plan
A two phase implementation approach is proposed.
Phase 1 will focus on agreeing:
i. the common data structure
ii. a small suite of reports to present the data
iii. a proposed mechanism whereby officials, ministers and Non-Executive Directors review the
data and take follow up action as appropriate.
This phase has been, and will continue to be, carried out taking in wide consultation with finance and operations experts across government, with senior ministers and officials and with the ER Board.
Consultation will include:
32
i. a due diligence exercise with department Finance Directors to identify where any proposed data cannot be immediately collected from existing departmental systems, and the related resource requirements to collect it;
ii. further engagement with departmental Non-Executive Directors to streamline these proposals with work that they may have already carried out within their departments.
This phase is well underway and is targeted to complete in June.
Phase 2 will focus on implementation. This will include establishing:
i. clear data definitions for all of the proposed measures;
ii. a common quality assurance mechanism;
iii. identification of the data collection exercises this system will replace and which can therefore
be discontinued;
iv. a pilot exercise for all major departments, taking into account resourcing requirements related
to year-end close.
Separately, ministers need to consider whether any information is published externally and how the Freedom of Information Act ought to be taken into account.
Subject to the agreement of ministers, it is proposed that this phase be complete by July.
I stress that there is no “perfect” solution to the implementation of an management information framework across Government. 100% consensus is not possible. However, this is without doubt an area where the 80% plus solution will deliver 80% plus of the benefits. The sooner we can finalise the 80% plus solution, and get it implemented, the sooner we can start securing the very significant benefits that are available and provide a baseline we can build on in the years ahead. With this in mind, I would be grateful for any further thoughts on these proposals and it would be helpful if any comments could be channelled through Carl Meewezen at the Cabinet Office. His e-mail address is: [email protected]
MP Read
23rd April 2012

33

34
Annex 5 Summary of Feedback from Pilot Consultation
This summary of the pilot feedback examines responses received from departments who chose to participate in the pilot exercise. The full details are attached provided at Annex 7.
The feedback has been categorised into seven main areas below.
The categories are:
1. Purpose of the exercise
2. Clarity of guidelines
3. Technical issues with the pro-forma
4. Consistency of data definitions and other over-lap issues
5. Availability of Data
6. Organisational scope of coverage
7. Detailed definitions of metrics.
This summary explores those areas and sets out proposals to address the concerns raised.
1. Purpose of the Exercise
Despite strong engagement with senior leaders in government and general consensus on the principles to be applied in the refresh of QDS, it became apparent over the pilot that working level colleagues in the performance management profession were not expecting the pilot and did not understand the intended purposes. In some cases there were low levels of commitment to the principles of the pilot.
Going forward it will be important to explain clearly to all colleagues why this work is important.
This will require leadership from the centre of government and from senior finance leaders within departments.
2. Clarity of the Guidelines
Several of the departments reported difficulties with completing the pro-forma due to unclear guidelines or ambiguity around how specific data items are to be defined.
To overcome this, a much more detailed instruction pack will be created, with comprehensive and focussed instructions on how to complete the pro-forma.

35
Work is also underway with a number of the service leads within the Cabinet Office to make sure stronger data definitions are in place. This should enable the production of a glossary section with any instruction pack to ensure clarity for the refreshed QDS.
All the detailed feedback provided will be addressed in the new guidelines.
3. Technical Issues with the pro-forma
Much department feedback related to cosmetic or technical issues with the pro-forma itself.
Specific requests included:
i. greater automation, for example to derive totals using formulae rather than requiring departments to complete themselves;
ii. more consistency to ensure that cell formatting reflects the type of data requested;
iii. fewer coloured cells so that charts are easier to read when printed in grey scale or black and white.
All of the detailed feedback has been addressed in the proposed new version of the pro-forma.
4. Consistency of Data definitions and overlap with other data collections
Departments reported two distinct issues with data availability:
i) First, departments reiterated the need to align the data collected through this process with other data collection exercises, for example through COINS/OSCAR, so that the data is consistent in structure and format with what is collected elsewhere;
ii) Secondly, departments reiterated the need to avoid duplication of data requests – so that data that it is already being input into OSCAR or COINS should not be duplicated in this exercise.
To address this feedback, the data definitions have been matched back to the Common Chart of Accounts to ensure that wherever possible the data elements have identical definitions.
Work is on-going with the OSCAR implementation team to ensure that wherever possible, information that has already been drawn from department accounts will not be duplicated but reused.
There is consensus that the only automated mechanism to draw data from department finance systems should be OSCAR.
5. Availability of data
Quantitative feedback shows that in some cases, departments did not hold data of the type requested against particular metrics. The ‘heat map’ chart in Annex 7 summarises where departments were unable to provide data against specific metrics.
It is clear from this consultation that although all departments have budget, forecast and actuals information in detail about finance data by quarter, the same is not true of detailed performance information.

36
To address this feedback, we are proposing extending the definition of the budget column for the performance metrics to allow departments to include an aspiration for the year instead of a quarterly budget.
6. Organisational Scope
A number of departments queried the organisational scope of the data being requested.
To address this feedback, as the new version is rolled out there will be a structured series of discussions with Finance Directors and Spending Teams to establish the precise organisational boundaries to be covered.
7. Detail of metrics
Some limited additional feedback has been received from central teams to revise the performance metrics proposed for their areas and ensure that there is complete consistency between this and other data gathering exercises, and eliminate any duplication.
Particular feedback was given on the Major Projects area was to bring this completely into line with the government Major Projects Portfolio reporting.
In almost all cases this feedback has been incorporated. In a limited number of cases, it was felt that too much detail was being requested, and these requests have not been incorporated.
Next steps
These limited changes have been made to the refreshed QDS.
The new proposals are intended to be implemented in autumn 2012. The new arrangements will include a control mechanism to ensure that:
a) changes to definitions and metrics are kept to a minimum to ensure consistency over time; however,
b) feedback is taken periodically on how the new QDS can be continually improved better to meet requirements of the centre and of departments.

37
Annex 6 Summary Analysis of Departmental Board Packs
Board reports reviewed: HO, CO, DCMS, DWP, DfT, BIS, DFID.
Board Analysis Headline Findings
All reports provide analysis of total budgets against forecast. Less detail was available for organisational breakdown and no department provided any comparison to the previous year. Variance to budget metrics have been provided but there is little other operational performance reporting.
Top level budgetary breakdowns:
a) All departments provided high-level breakdown of their total departmental budget splitting out resource and capital department expenditure (RDEL and CDEL) and expenditure outside their own budget but managed by the department (AME).
b) This information was provided on an annual and cumulative quarterly basis but not split out into absolute quarterly figures.
c) All departments considered actual cumulative year to date outturn against an original budget or forecast. The information reported is cumulative YTD against FY Forecasts rather than separate quarters and the variance between the two was highlighted.
d) Board reports focus on meeting budgets at the highest level, with variance against forecast included in all of the board reports sampled.
e) The board reports are more forward looking than the proposed QDS with annual forecasts for each year of the remaining period of SR.
f) None of the departments provided any comparison to the previous year.
g) In 83% of the board reports sampled RDEL is broken down into main programme areas; by policy area or departmental family.
h) 43% of departments disaggregated their AME by key areas of expenditure. Where departments have large AME expenditure e.g. DWP and DfT, there is detailed analysis of the key areas of spend.
i) There is little consistent breakdown of budget by transaction or expenditure area. No department provided a breakdown of their budget by pay, procurement and grants. DfT and CO provide procurement expenditure relating to the CO Spending Controls.
j) 57% of departments provided financial information on major projects.
Operational Performance
All departments provided variance to budget metrics which were consistent throughout the reports, and where budgets were disaggregated by programme area, the variance to budget was also reported.
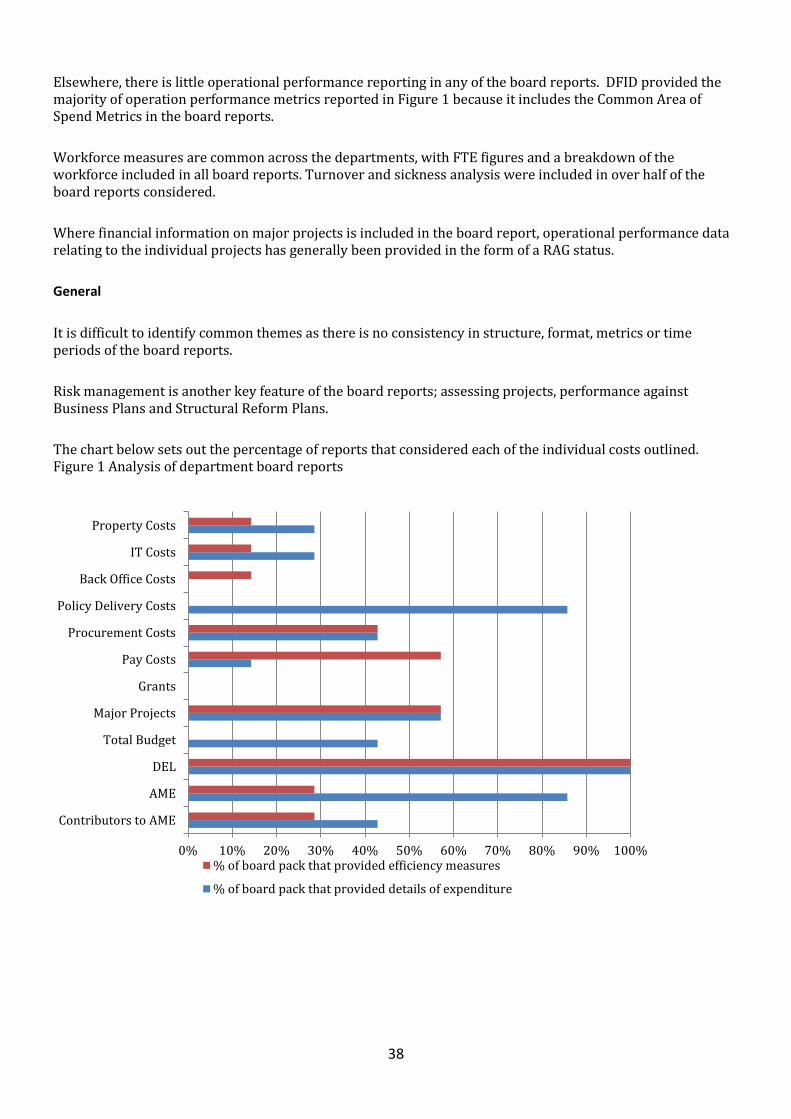
38
Elsewhere, there is little operational performance reporting in any of the board reports. DFID provided the majority of operation performance metrics reported in Figure 1 because it includes the Common Area of Spend Metrics in the board reports.
Workforce measures are common across the departments, with FTE figures and a breakdown of the workforce included in all board reports. Turnover and sickness analysis were included in over half of the board reports considered.
Where financial information on major projects is included in the board report, operational performance data relating to the individual projects has generally been provided in the form of a RAG status.
General
It is difficult to identify common themes as there is no consistency in structure, format, metrics or time periods of the board reports.
Risk management is another key feature of the board reports; assessing projects, performance against Business Plans and Structural Reform Plans.
The chart below sets out the percentage of reports that considered each of the individual costs outlined. Figure 1 Analysis of department board reports
0% 10% 20% 30% 40% 50% 60% 70% 80% 90% 100%
Contributors to AME
AME
DEL
Total Budget
Major Projects
Grants
Pay Costs
Procurement Costs
Policy Delivery Costs
Back Office Costs
IT Costs
Property Costs
% of board pack that provided efficiency measures
% of board pack that provided details of expenditure
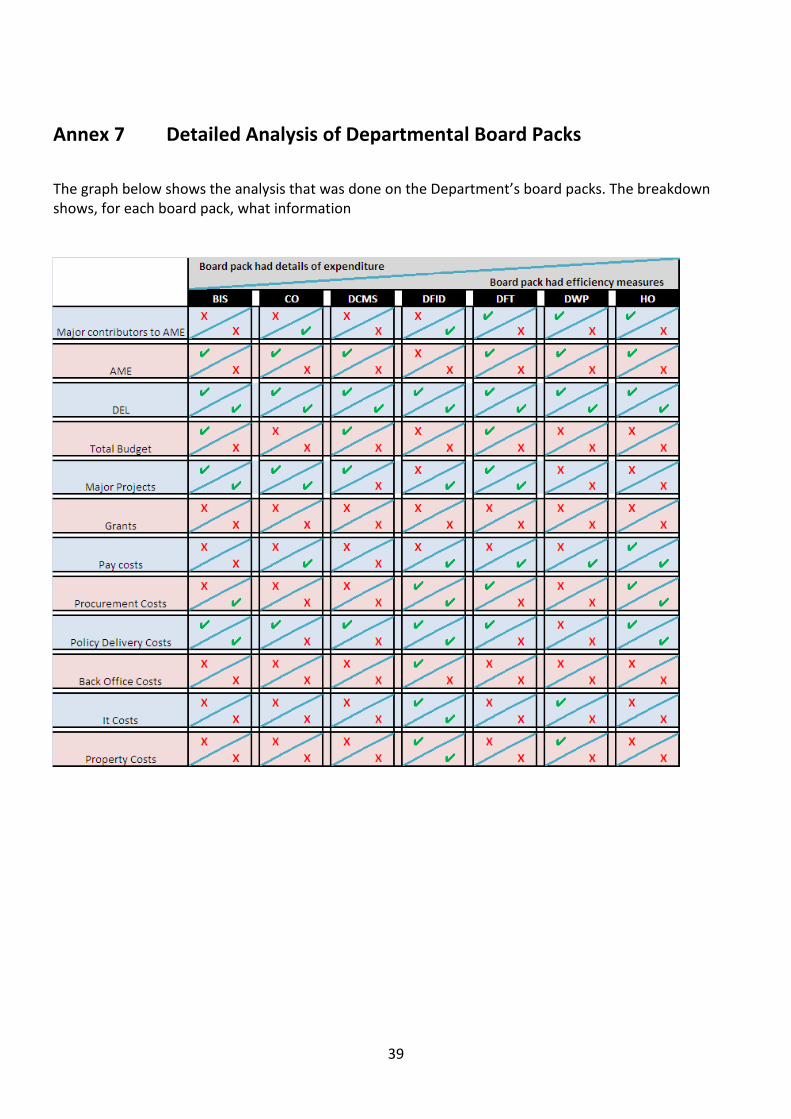
39
Annex 7 Detailed Analysis of Departmental Board Packs
The graph below shows the analysis that was done on the Department’s board packs. The breakdown shows, for each board pack, what information

40
Annex 8 Proposed New Version of the Quarterly Data Summary
(This diagram is included in larger size on the following page.)

41
Annex 10 – New format QDS (2)

42
New version QDS (3)

43
Annex 9 Pilot Version of the Quarterly Data Summary

44
Annex 10 Existing Version of the Quarterly Data Summary

45
Annex 11 Schedule of Differences between Existing and Proposed New Version of the QDS
This analysis sets out the chief differences between the current version of QDS and the new proposals.
Area Current QDS Proposed New Version
Organisational Scope
Organisational scope varies across the measures reported on within most departments.
Organisational scope will be clearly defined at the outset and apply across the entire data set.
Data assurance Quality assurance varies, and data does not tally back to totals sourced in the management accounts.
All data will tally back to totals sourced in the management accounts and where possible OSCAR
Period covered Data is provided for the current period only. There is some variation in the period for which data is provided.
Data will be provided for the current period, the year to date and the full year forecast.
Points of comparison
The only point of comparison is the previous period.
Data will be compared to the budget, the same period in the previous year or and end of year target.
Statistical reporting
There are no statistical reports provided to compare departments across common areas of activity.
Data for common areas of activity will be provided in standard analytical reports that compare departments.
Efficiency metrics
The report principally contains absolute measures rather than efficiency ratios.
The report will set out major areas of spend and provide common efficiency ratios.
Scale of data The current QDS covers over 100 measures, providing current and previous quarter data for each.
The new draft will cover around 40 measures, but provide more detail on each (instead of the previous quarter, it will provide details for the same quarter last year and the budget, i.e. two points of comparison instead of one.)
Flexibility in application
The current QDS requires all departments to complete identical data for all common areas of spend
The new draft asks departments to set out the majority of their spend, and spend that is subject to central policy control with the objective of covering three quarters of a department’s overall expenditure.

46
Annex 12 Schedule of Current Data Being Collected by the Cabinet Office
This table lists all the regular data requests that are currently being issued by the Cabinet Office.
Area Data Field Data collection title Frequency of the data collection
Civil Service Talent What is your assessment of the strength of the talent pipeline in your Department in terms of succession up to: Permanent Secretary Talent Management Information Quarterly
Civil Service Talent What is your assessment of the strength of the talent pipeline in your Department in terms of succession up to: Director General Talent Management Information Quarterly
Civil Service Talent What is your assessment of the strength of the talent pipeline in your Department in terms of succession up to: Director Talent Management Information Quarterly
Civil Service Talent Please provide numbers of Star Performers at Deputy Director level. (Further information maybe requested following TRB discussion). Talent Management Information Quarterly
Civil Service Talent Critical Posts: Which are your critical posts at DG and Director level and are there any concerns about retention or succession for any of these posts? (These may be posts listed in Annex G, if so please state refer to Annex G)
Talent Management Information Quarterly
Civil Service Talent What actions are underway, or needed, to address any general or specific concerns in the talent pipeline? Talent Management Information Quarterly
Civil Service Talent Are there any other issues regarding the talent pipeline (e.g. diversity)? Talent Management Information Quarterly
Civil Service Talent What DG and Director posts are likely to become vacant during the next 12 months? Does the Department have the necessary skills to meet foreseeable future requirements?
Talent Management Information Quarterly
Civil Service Talent Do you currently have surplus Directors/Directors General? If so, please specify names and posts formerly held. Talent Management Information Quarterly
Civil Service Talent Which posts are likely to be affected by the further restructuring in the SCS? Talent Management Information Quarterly
Civil Service Talent Please specify any exits anticipated over the next 12 months. When exits occur through the year, please could you inform Paulette Riddell ([email protected])
Talent Management Information Quarterly
Civil Service Talent Please specify what, If any, external market scanning/external talent identification you are undertaking. Talent Management Information Quarterly
Civil Service Talent Name and job title: Top Team Biographies Transactional
Civil Service Talent Date of birth: Top Team Biographies Transactional
Civil Service Talent Salary: Top Team Biographies Transactional
Civil Service Talent Start date and route to current post (managed move/service wide trawl): Top Team Biographies Transactional
Civil Service Talent Civil Service start date and level at entry: Top Team Biographies Transactional
Civil Service Talent Responsibility for (include finance and resource managed): Top Team Biographies Transactional
Civil Service Talent Key skills/experience required for the role: Top Team Biographies Transactional
Civil Service Talent Type of role Top Team Biographies Transactional
Civil Service Talent Previous experience Top Team Biographies Transactional
Civil Service Talent Names and job titles of direct reports: Top Team Biographies Transactional
Civil Service Talent Likely successor(s) and readiness to this post: Top Team Biographies Transactional
Civil Service Talent Strengths: Top Team Biographies Transactional
Civil Service Talent Development areas: Top Team Biographies Transactional
Civil Service Talent Suggestions for next posts: Top Team Biographies Transactional
Civil Service Talent Likely timing of next move: Top Team Biographies Transactional
Civil Service Talent Posts that are critical to delivering above priorities Talent Management Information Quarterly
Civil Service Talent Current post holder and date to post Talent Management Information Quarterly
Civil Service Talent Expected date for re-appointment Talent Management Information Quarterly
Civil Service Talent Process of appointment Talent Management Information Quarterly
Construction Sector Regular forward construction pipeline data Quarterly
Construction Sub-Sector Regular forward construction pipeline data Quarterly
Construction Sub-Group Regular forward construction pipeline data Quarterly
Construction Project / programme name Regular forward construction pipeline data Quarterly
Construction Description / purpose Regular forward construction pipeline data Quarterly
Construction Region Regular forward construction pipeline data Quarterly
Construction Postcode or OS Grid Reference Regular forward construction pipeline data Quarterly
Construction Asset Ownership Regular forward construction pipeline data Quarterly
Construction Economically regulated asset # Regular forward construction pipeline data Quarterly
Construction Funding Source(s) Regular forward construction pipeline data Quarterly
Construction Scheme Status Regular forward construction pipeline data Quarterly
Construction Planned construction start date Regular forward construction pipeline data Quarterly
Construction Date in service Regular forward construction pipeline data Quarterly
Construction On schedule Regular forward construction pipeline data Quarterly
Construction Total capex cost all funding (£m) Regular forward construction pipeline data Quarterly
Construction Total capex cost publicly funded, if different (£m) Regular forward construction pipeline data Quarterly
Construction 2011/12 (£m) Regular forward construction pipeline data Quarterly
Construction 2012/13 (£m) Regular forward construction pipeline data Quarterly
Construction 2013/14 (£m) Regular forward construction pipeline data Quarterly
Construction 2014/15 (£m) Regular forward construction pipeline data Quarterly
Construction 2015 to 2020 (£m)# Regular forward construction pipeline data Quarterly
Construction Beyond 2020 (£m)# Regular forward construction pipeline data Quarterly
Construction Costs status Regular forward construction pipeline data Quarterly
Construction Basis of costs Regular forward construction pipeline data Quarterly
Construction Base year Regular forward construction pipeline data Quarterly
Construction Significant land related costs (£m) Regular forward construction pipeline data Quarterly
Construction Finance costs where privately funded e.g. PFI (£m) Regular forward construction pipeline data Quarterly
Construction FM or other significant 'non-construction' related costs (£m) Regular forward construction pipeline data Quarterly
Construction Planned Procurement Route Regular forward construction pipeline data Quarterly
Construction Expiry date for existing frameworks Regular forward construction pipeline data Quarterly
Construction Procuring Authority (if not department or agency stated above) Regular forward construction pipeline data Quarterly
Construction Public source for further project details Regular forward construction pipeline data Quarterly
Construction Data source(s) Regular forward construction pipeline data Quarterly
Construction Notes (including details where "other" given in response to earlier questions) Regular forward construction pipeline data Quarterly
Construction Project Types Construction cost benchmarks (general update) and cost reductions (achieved October 2011 to March 2012)
Six monthly collection (Sep/Oct and Mar/Apr) for internal/programme progress reporting, with annual publication (Mar/Apr)
Construction Project Subtypes Construction cost benchmarks (general update) and cost reductions (achieved October 2011 to March 2012)
Six monthly collection (Sep/Oct and Mar/Apr) for internal/programme progress reporting, with annual publication (Mar/Apr)
Construction Benchmarks Construction cost benchmarks (general update) and cost reductions (achieved October 2011 to March 2012)
Six monthly collection (Sep/Oct and Mar/Apr) for internal/programme progress reporting, with annual publication (Mar/Apr)
Construction Units (£/m2; £/home) Construction cost benchmarks (general update) and cost reductions (achieved October 2011 to March 2012)
Six monthly collection (Sep/Oct and Mar/Apr) for internal/programme progress reporting, with annual publication (Mar/Apr)
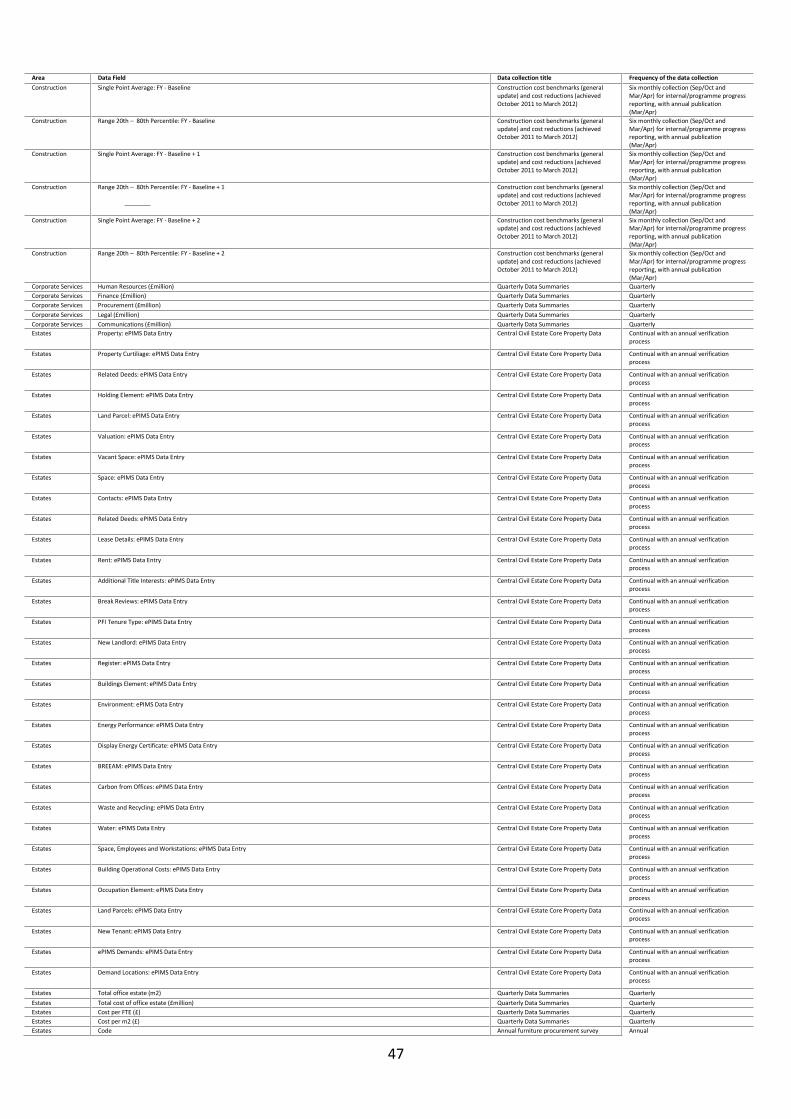
47
Area Data Field Data collection title Frequency of the data collection
Construction Single Point Average: FY - Baseline Construction cost benchmarks (general update) and cost reductions (achieved October 2011 to March 2012)
Six monthly collection (Sep/Oct and Mar/Apr) for internal/programme progress reporting, with annual publication (Mar/Apr)
Construction Range 20th – 80th Percentile: FY - Baseline Construction cost benchmarks (general update) and cost reductions (achieved October 2011 to March 2012)
Six monthly collection (Sep/Oct and Mar/Apr) for internal/programme progress reporting, with annual publication (Mar/Apr)
Construction Single Point Average: FY - Baseline + 1 Construction cost benchmarks (general update) and cost reductions (achieved October 2011 to March 2012)
Six monthly collection (Sep/Oct and Mar/Apr) for internal/programme progress reporting, with annual publication (Mar/Apr)
Construction Range 20th – 80th Percentile: FY - Baseline + 1 Construction cost benchmarks (general update) and cost reductions (achieved October 2011 to March 2012)
Six monthly collection (Sep/Oct and Mar/Apr) for internal/programme progress reporting, with annual publication (Mar/Apr)
Construction Single Point Average: FY - Baseline + 2 Construction cost benchmarks (general update) and cost reductions (achieved October 2011 to March 2012)
Six monthly collection (Sep/Oct and Mar/Apr) for internal/programme progress reporting, with annual publication (Mar/Apr)
Construction Range 20th – 80th Percentile: FY - Baseline + 2 Construction cost benchmarks (general update) and cost reductions (achieved October 2011 to March 2012)
Six monthly collection (Sep/Oct and Mar/Apr) for internal/programme progress reporting, with annual publication (Mar/Apr)
Corporate Services Human Resources (£million) Quarterly Data Summaries Quarterly
Corporate Services Finance (£million) Quarterly Data Summaries Quarterly
Corporate Services Procurement (£million) Quarterly Data Summaries Quarterly
Corporate Services Legal (£million) Quarterly Data Summaries Quarterly
Corporate Services Communications (£million) Quarterly Data Summaries Quarterly
Estates Property: ePIMS Data Entry Central Civil Estate Core Property Data Continual with an annual verification process
Estates Property Curtiliage: ePIMS Data Entry Central Civil Estate Core Property Data Continual with an annual verification process
Estates Related Deeds: ePIMS Data Entry Central Civil Estate Core Property Data Continual with an annual verification process
Estates Holding Element: ePIMS Data Entry Central Civil Estate Core Property Data Continual with an annual verification process
Estates Land Parcel: ePIMS Data Entry Central Civil Estate Core Property Data Continual with an annual verification process
Estates Valuation: ePIMS Data Entry Central Civil Estate Core Property Data Continual with an annual verification process
Estates Vacant Space: ePIMS Data Entry Central Civil Estate Core Property Data Continual with an annual verification process
Estates Space: ePIMS Data Entry Central Civil Estate Core Property Data Continual with an annual verification process
Estates Contacts: ePIMS Data Entry Central Civil Estate Core Property Data Continual with an annual verification process
Estates Related Deeds: ePIMS Data Entry Central Civil Estate Core Property Data Continual with an annual verification process
Estates Lease Details: ePIMS Data Entry Central Civil Estate Core Property Data Continual with an annual verification process
Estates Rent: ePIMS Data Entry Central Civil Estate Core Property Data Continual with an annual verification process
Estates Additional Title Interests: ePIMS Data Entry Central Civil Estate Core Property Data Continual with an annual verification process
Estates Break Reviews: ePIMS Data Entry Central Civil Estate Core Property Data Continual with an annual verification process
Estates PFI Tenure Type: ePIMS Data Entry Central Civil Estate Core Property Data Continual with an annual verification process
Estates New Landlord: ePIMS Data Entry Central Civil Estate Core Property Data Continual with an annual verification process
Estates Register: ePIMS Data Entry Central Civil Estate Core Property Data Continual with an annual verification process
Estates Buildings Element: ePIMS Data Entry Central Civil Estate Core Property Data Continual with an annual verification process
Estates Environment: ePIMS Data Entry Central Civil Estate Core Property Data Continual with an annual verification process
Estates Energy Performance: ePIMS Data Entry Central Civil Estate Core Property Data Continual with an annual verification process
Estates Display Energy Certificate: ePIMS Data Entry Central Civil Estate Core Property Data Continual with an annual verification process
Estates BREEAM: ePIMS Data Entry Central Civil Estate Core Property Data Continual with an annual verification process
Estates Carbon from Offices: ePIMS Data Entry Central Civil Estate Core Property Data Continual with an annual verification process
Estates Waste and Recycling: ePIMS Data Entry Central Civil Estate Core Property Data Continual with an annual verification process
Estates Water: ePIMS Data Entry Central Civil Estate Core Property Data Continual with an annual verification process
Estates Space, Employees and Workstations: ePIMS Data Entry Central Civil Estate Core Property Data Continual with an annual verification process
Estates Building Operational Costs: ePIMS Data Entry Central Civil Estate Core Property Data Continual with an annual verification process
Estates Occupation Element: ePIMS Data Entry Central Civil Estate Core Property Data Continual with an annual verification process
Estates Land Parcels: ePIMS Data Entry Central Civil Estate Core Property Data Continual with an annual verification process
Estates New Tenant: ePIMS Data Entry Central Civil Estate Core Property Data Continual with an annual verification process
Estates ePIMS Demands: ePIMS Data Entry Central Civil Estate Core Property Data Continual with an annual verification process
Estates Demand Locations: ePIMS Data Entry Central Civil Estate Core Property Data Continual with an annual verification process
Estates Total office estate (m2) Quarterly Data Summaries Quarterly
Estates Total cost of office estate (£million) Quarterly Data Summaries Quarterly
Estates Cost per FTE (£) Quarterly Data Summaries Quarterly
Estates Cost per m2 (£) Quarterly Data Summaries Quarterly
Estates Code Annual furniture procurement survey Annual

48
Area Data Field Data collection title Frequency of the data collection
Estates ALB Annual furniture procurement survey Annual
Estates No of items purchased (last financial year) Annual furniture procurement survey Annual
Estates Total Spend on purchased Items (last financial year) Annual furniture procurement survey Annual
Estates Total annual spend on adaptations to or renovations of existing furniture (last financial year) Annual furniture procurement survey Annual
Estates Number of items moved and re-used (excluding adaptations and renovations) (last financial year) Annual furniture procurement survey Annual
Estates Number of items disposed of (last financial year) Annual furniture procurement survey Annual
Estates Total Spend Annual furniture procurement survey Annual
Estates Comments Annual furniture procurement survey Annual
Estates Supplier (drop down list) FM Annual Data Return Annual
Estates Type of Contract (drop down list) FM Annual Data Return Annual
Estates Description e.g. Cleaning, Security FM Annual Data Return Annual
Estates Start Date FM Annual Data Return Annual
Estates End Date FM Annual Data Return Annual
Estates Working out FM Annual Data Return Annual
Estates Contract Status Expired/Live FM Annual Data Return Annual
Estates Comments re contract FM Annual Data Return Annual
Estates No of Occupations Covered FM Annual Data Return Annual
Estates Annual Contract Cost FM Annual Data Return Annual
Estates Coverage FM Annual Data Return Annual
Estates Address details required FM Annual Data Return Annual
Estates Have you attached complete property level list? (yes/no drop down list) FM Annual Data Return Annual
Estates CA2 Unitary Charge FM Annual Data Return Annual
Estates CB Adaptation & Equipment Other FM Annual Data Return Annual
Estates CC1 Service Charge FM Annual Data Return Annual
Estates CC2 Insurance FM Annual Data Return Annual
Estates CC3 Internal Repairs & Maintenance FM Annual Data Return Annual
Estates CC4 M&E Repairs & Maintenance FM Annual Data Return Annual
Estates CC5 External & Structural Repair & Maintenance FM Annual Data Return Annual
Estates CC6 Minor Improvement FM Annual Data Return Annual
Estates CC7 Internal Moves FM Annual Data Return Annual
Estates CC9 Security FM Annual Data Return Annual
Estates CC10 Cleaning FM Annual Data Return Annual
Estates CC11 Waste Disposal FM Annual Data Return Annual
Estates CC12 Internal Plants & Decoration FM Annual Data Return Annual
Estates CC13 Grounds Maintenance FM Annual Data Return Annual
Estates CC Building Operation Other FM Annual Data Return Annual
Estates CD2 Catering FM Annual Data Return Annual
Estates CD3 Reception Services FM Annual Data Return Annual
Estates CD4 Messenger/ Courier Services FM Annual Data Return Annual
Estates CD5 Post Room/ Internal Distribution FM Annual Data Return Annual
Estates CD6 Reprographics FM Annual Data Return Annual
Estates CD7 Disaster Recovery FM Annual Data Return Annual
Estates CD8 Transport FM Annual Data Return Annual
Estates CD Business Support Other FM Annual Data Return Annual
Estates CE1a Real Estate Management inhouse FM Annual Data Return Annual
Estates CE1b Real Estate Management outsourced FM Annual Data Return Annual
Estates CE2a Facilities Management inhouse FM Annual Data Return Annual
Estates CE2b Facilities Management outsourced FM Annual Data Return Annual
Estates CE3a Project Management inhouse FM Annual Data Return Annual
Estates CE3b Project Management outsourced FM Annual Data Return Annual
Estates CE4a Other Management inhouse FM Annual Data Return Annual
Estates CE4b Other Management outsourced FM Annual Data Return Annual
Estates Total Expenditure 10/11 FM Annual Data Return Annual
Estates Variance to Contract FM Annual Data Return Annual
Estates CA3 Acquisition, Disposal & Removal FM Annual Data Return Annual
Estates CA8 Marketing & Promotion FM Annual Data Return Annual
Estates CB1 Fit Out & Improvement FM Annual Data Return Annual
Estates CB2 Furniture & Equipment FM Annual Data Return Annual
Estates CC8 Reinstatement FM Annual Data Return Annual
Estates CC14 Water & Sewerage FM Annual Data Return Annual
Estates CC15 Energy FM Annual Data Return Annual
Estates CD1 Telephone FM Annual Data Return Annual
Estates CD9 Archiving FM Annual Data Return Annual
Estates No of jobs FM Annual Data Return Annual
Estates Job Title FM Annual Data Return Annual
Estates Salary FM Annual Data Return Annual
Estates Pay Band/Grade FM Annual Data Return Annual
Estates % of role FM FM Annual Data Return Annual
Estates FM Cost FM Annual Data Return Annual
Estates Department FM Annual Data Return Annual
Estates Property Centre FM Annual Data Return Annual
Estates Total Role FTE FM Annual Data Return Annual
Estates 1. Please select the departmental family which the organisation you work for sits under. Property Asset Management Community Survey
Infrequent
Estates 2. Please state the name(s) of the organisations you are responsible for within your departmental family. Property Asset Management Community Survey
Infrequent
Estates 3. Please select the level of responsibility as defined by the PAM competency framework. Property Asset Management Community Survey
Infrequent
Estates 4. Please specify your Property Asset Management work stream. Property Asset Management Community Survey
Infrequent
Estates 5. Please state as a percentage your typical level of engagement in Property Asset Management. Property Asset Management Community Survey
Infrequent
Estates 6. Please state the percentage breakdown of your workload between the Office and Specialist estate. Property Asset Management Community Survey
Infrequent
Estates 7. How long have you been in your current role within Property Asset Management? Property Asset Management Community Survey
Infrequent
Estates 8. Please indicate the length of time in your career that you have spent in Property Asset Management. Property Asset Management Community Survey
Infrequent
Estates 9. Please select the option most relevant to you. Definitions are as follows:- Property Asset Management Community Survey
Infrequent
Estates 10. Do you hold a PAM related academic qualification? Property Asset Management Community Survey
Infrequent
Estates 11. Please select the professional bodies of which you are a member. Property Asset Management Community Survey
Infrequent
Estates 12. Please indicate your own suggestions for areas of self development. Property Asset Management Community Survey
Infrequent
Estates 1. Internal fabric Benchmarking Programme Annual
Estates 2. Mechanical & electrical plant Benchmarking Programme Annual
Estates 3. External fabric Benchmarking Programme Annual
Estates 4. Internal fabric Benchmarking Programme Annual
Estates 5. Mechanical & electrical plant Benchmarking Programme Annual
Estates 6. External fabric Benchmarking Programme Annual
Estates 7. Number of inbound calls to helpdesks / requests to a facilities manager regarding complaints / problems reported by the building's users? Benchmarking Programme Annual
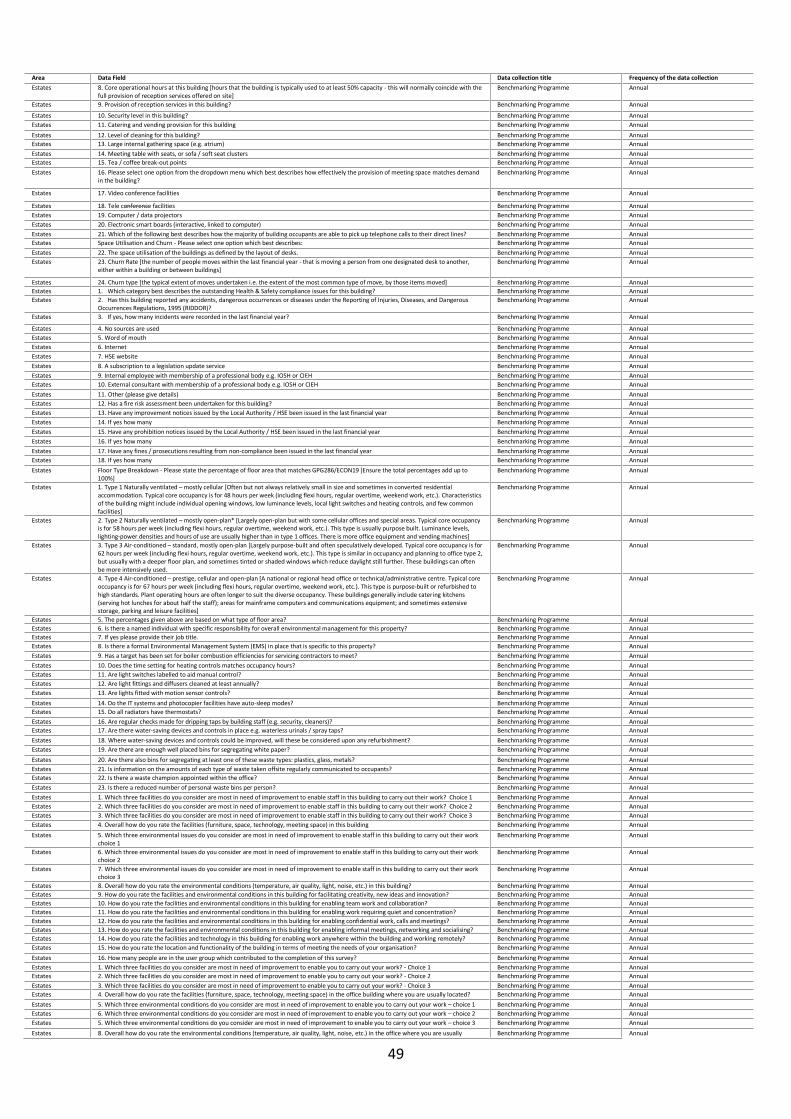
49
Area Data Field Data collection title Frequency of the data collection
Estates 8. Core operational hours at this building [hours that the building is typically used to at least 50% capacity - this will normally coincide with the full provision of reception services offered on site]
Benchmarking Programme Annual
Estates 9. Provision of reception services in this building? Benchmarking Programme Annual
Estates 10. Security level in this building? Benchmarking Programme Annual
Estates 11. Catering and vending provision for this building Benchmarking Programme Annual
Estates 12. Level of cleaning for this building? Benchmarking Programme Annual
Estates 13. Large internal gathering space (e.g. atrium) Benchmarking Programme Annual
Estates 14. Meeting table with seats, or sofa / soft seat clusters Benchmarking Programme Annual
Estates 15. Tea / coffee break-out points Benchmarking Programme Annual
Estates 16. Please select one option from the dropdown menu which best describes how effectively the provision of meeting space matches demand in the building?
Benchmarking Programme Annual
Estates 17. Video conference facilities Benchmarking Programme Annual
Estates 18. Tele conference facilities Benchmarking Programme Annual
Estates 19. Computer / data projectors Benchmarking Programme Annual
Estates 20. Electronic smart boards (interactive, linked to computer) Benchmarking Programme Annual
Estates 21. Which of the following best describes how the majority of building occupants are able to pick up telephone calls to their direct lines? Benchmarking Programme Annual
Estates Space Utilisation and Churn - Please select one option which best describes: Benchmarking Programme Annual
Estates 22. The space utilisation of the buildings as defined by the layout of desks. Benchmarking Programme Annual
Estates 23. Churn Rate [the number of people moves within the last financial year - that is moving a person from one designated desk to another, either within a building or between buildings]
Benchmarking Programme Annual
Estates 24. Churn type [the typical extent of moves undertaken i.e. the extent of the most common type of move, by those items moved] Benchmarking Programme Annual
Estates 1. Which category best describes the outstanding Health & Safety compliance issues for this building? Benchmarking Programme Annual
Estates 2. Has this building reported any accidents, dangerous occurrences or diseases under the Reporting of Injuries, Diseases, and Dangerous Occurrences Regulations, 1995 (RIDDOR)?
Benchmarking Programme Annual
Estates 3. If yes, how many incidents were recorded in the last financial year? Benchmarking Programme Annual
Estates 4. No sources are used Benchmarking Programme Annual
Estates 5. Word of mouth Benchmarking Programme Annual
Estates 6. Internet Benchmarking Programme Annual
Estates 7. HSE website Benchmarking Programme Annual
Estates 8. A subscription to a legislation update service Benchmarking Programme Annual
Estates 9. Internal employee with membership of a professional body e.g. IOSH or CIEH Benchmarking Programme Annual
Estates 10. External consultant with membership of a professional body e.g. IOSH or CIEH Benchmarking Programme Annual
Estates 11. Other (please give details) Benchmarking Programme Annual
Estates 12. Has a fire risk assessment been undertaken for this building? Benchmarking Programme Annual
Estates 13. Have any improvement notices issued by the Local Authority / HSE been issued in the last financial year Benchmarking Programme Annual
Estates 14. If yes how many Benchmarking Programme Annual
Estates 15. Have any prohibition notices issued by the Local Authority / HSE been issued in the last financial year Benchmarking Programme Annual
Estates 16. If yes how many Benchmarking Programme Annual
Estates 17. Have any fines / prosecutions resulting from non-compliance been issued in the last financial year Benchmarking Programme Annual
Estates 18. If yes how many Benchmarking Programme Annual
Estates Floor Type Breakdown - Please state the percentage of floor area that matches GPG286/ECON19 [Ensure the total percentages add up to 100%]
Benchmarking Programme Annual
Estates 1. Type 1 Naturally ventilated – mostly cellular [Often but not always relatively small in size and sometimes in converted residential accommodation. Typical core occupancy is for 48 hours per week (including flexi hours, regular overtime, weekend work, etc.). Characteristics of the building might include individual opening windows, low luminance levels, local light switches and heating controls, and few common facilities]
Benchmarking Programme Annual
Estates 2. Type 2 Naturally ventilated – mostly open-plan* [Largely open-plan but with some cellular offices and special areas. Typical core occupancy is for 58 hours per week (including flexi hours, regular overtime, weekend work, etc.). This type is usually purpose built. Luminance levels, lighting-power densities and hours of use are usually higher than in type 1 offices. There is more office equipment and vending machines]
Benchmarking Programme Annual
Estates 3. Type 3 Air-conditioned – standard, mostly open-plan [Largely purpose-built and often speculatively developed. Typical core occupancy is for 62 hours per week (including flexi hours, regular overtime, weekend work, etc.). This type is similar in occupancy and planning to office type 2, but usually with a deeper floor plan, and sometimes tinted or shaded windows which reduce daylight still further. These buildings can often be more intensively used.
Benchmarking Programme Annual
Estates 4. Type 4 Air-conditioned – prestige, cellular and open-plan [A national or regional head office or technical/administrative centre. Typical core occupancy is for 67 hours per week (including flexi hours, regular overtime, weekend work, etc.). This type is purpose-built or refurbished to high standards. Plant operating hours are often longer to suit the diverse occupancy. These buildings generally include catering kitchens (serving hot lunches for about half the staff); areas for mainframe computers and communications equipment; and sometimes extensive storage, parking and leisure facilities]
Benchmarking Programme Annual
Estates 5. The percentages given above are based on what type of floor area? Benchmarking Programme Annual
Estates 6. Is there a named individual with specific responsibility for overall environmental management for this property? Benchmarking Programme Annual
Estates 7. If yes please provide their job title. Benchmarking Programme Annual
Estates 8. Is there a formal Environmental Management System (EMS) in place that is specific to this property? Benchmarking Programme Annual
Estates 9. Has a target has been set for boiler combustion efficiencies for servicing contractors to meet? Benchmarking Programme Annual
Estates 10. Does the time setting for heating controls matches occupancy hours? Benchmarking Programme Annual
Estates 11. Are light switches labelled to aid manual control? Benchmarking Programme Annual
Estates 12. Are light fittings and diffusers cleaned at least annually? Benchmarking Programme Annual
Estates 13. Are lights fitted with motion sensor controls? Benchmarking Programme Annual
Estates 14. Do the IT systems and photocopier facilities have auto-sleep modes? Benchmarking Programme Annual
Estates 15. Do all radiators have thermostats? Benchmarking Programme Annual
Estates 16. Are regular checks made for dripping taps by building staff (e.g. security, cleaners)? Benchmarking Programme Annual
Estates 17. Are there water-saving devices and controls in place e.g. waterless urinals / spray taps? Benchmarking Programme Annual
Estates 18. Where water-saving devices and controls could be improved, will these be considered upon any refurbishment? Benchmarking Programme Annual
Estates 19. Are there are enough well placed bins for segregating white paper? Benchmarking Programme Annual
Estates 20. Are there also bins for segregating at least one of these waste types: plastics, glass, metals? Benchmarking Programme Annual
Estates 21. Is information on the amounts of each type of waste taken offsite regularly communicated to occupants? Benchmarking Programme Annual
Estates 22. Is there a waste champion appointed within the office? Benchmarking Programme Annual
Estates 23. Is there a reduced number of personal waste bins per person? Benchmarking Programme Annual
Estates 1. Which three facilities do you consider are most in need of improvement to enable staff in this building to carry out their work? Choice 1 Benchmarking Programme Annual
Estates 2. Which three facilities do you consider are most in need of improvement to enable staff in this building to carry out their work? Choice 2 Benchmarking Programme Annual
Estates 3. Which three facilities do you consider are most in need of improvement to enable staff in this building to carry out their work? Choice 3 Benchmarking Programme Annual
Estates 4. Overall how do you rate the facilities (furniture, space, technology, meeting space) in this building Benchmarking Programme Annual
Estates 5. Which three environmental issues do you consider are most in need of improvement to enable staff in this building to carry out their work choice 1
Benchmarking Programme Annual
Estates 6. Which three environmental issues do you consider are most in need of improvement to enable staff in this building to carry out their work choice 2
Benchmarking Programme Annual
Estates 7. Which three environmental issues do you consider are most in need of improvement to enable staff in this building to carry out their work choice 3
Benchmarking Programme Annual
Estates 8. Overall how do you rate the environmental conditions (temperature, air quality, light, noise, etc.) in this building? Benchmarking Programme Annual
Estates 9. How do you rate the facilities and environmental conditions in this building for facilitating creativity, new ideas and innovation? Benchmarking Programme Annual
Estates 10. How do you rate the facilities and environmental conditions in this building for enabling team work and collaboration? Benchmarking Programme Annual
Estates 11. How do you rate the facilities and environmental conditions in this building for enabling work requiring quiet and concentration? Benchmarking Programme Annual
Estates 12. How do you rate the facilities and environmental conditions in this building for enabling confidential work, calls and meetings? Benchmarking Programme Annual
Estates 13. How do you rate the facilities and environmental conditions in this building for enabling informal meetings, networking and socialising? Benchmarking Programme Annual
Estates 14. How do you rate the facilities and technology in this building for enabling work anywhere within the building and working remotely? Benchmarking Programme Annual
Estates 15. How do you rate the location and functionality of the building in terms of meeting the needs of your organisation? Benchmarking Programme Annual
Estates 16. How many people are in the user group which contributed to the completion of this survey? Benchmarking Programme Annual
Estates 1. Which three facilities do you consider are most in need of improvement to enable you to carry out your work? - Choice 1 Benchmarking Programme Annual
Estates 2. Which three facilities do you consider are most in need of improvement to enable you to carry out your work? - Choice 2 Benchmarking Programme Annual
Estates 3. Which three facilities do you consider are most in need of improvement to enable you to carry out your work? - Choice 3 Benchmarking Programme Annual
Estates 4. Overall how do you rate the facilities (furniture, space, technology, meeting space) in the office building where you are usually located? Benchmarking Programme Annual
Estates 5. Which three environmental conditions do you consider are most in need of improvement to enable you to carry out your work – choice 1 Benchmarking Programme Annual
Estates 6. Which three environmental conditions do you consider are most in need of improvement to enable you to carry out your work – choice 2 Benchmarking Programme Annual
Estates 5. Which three environmental conditions do you consider are most in need of improvement to enable you to carry out your work – choice 3 Benchmarking Programme Annual
Estates 8. Overall how do you rate the environmental conditions (temperature, air quality, light, noise, etc.) in the office where you are usually Benchmarking Programme Annual
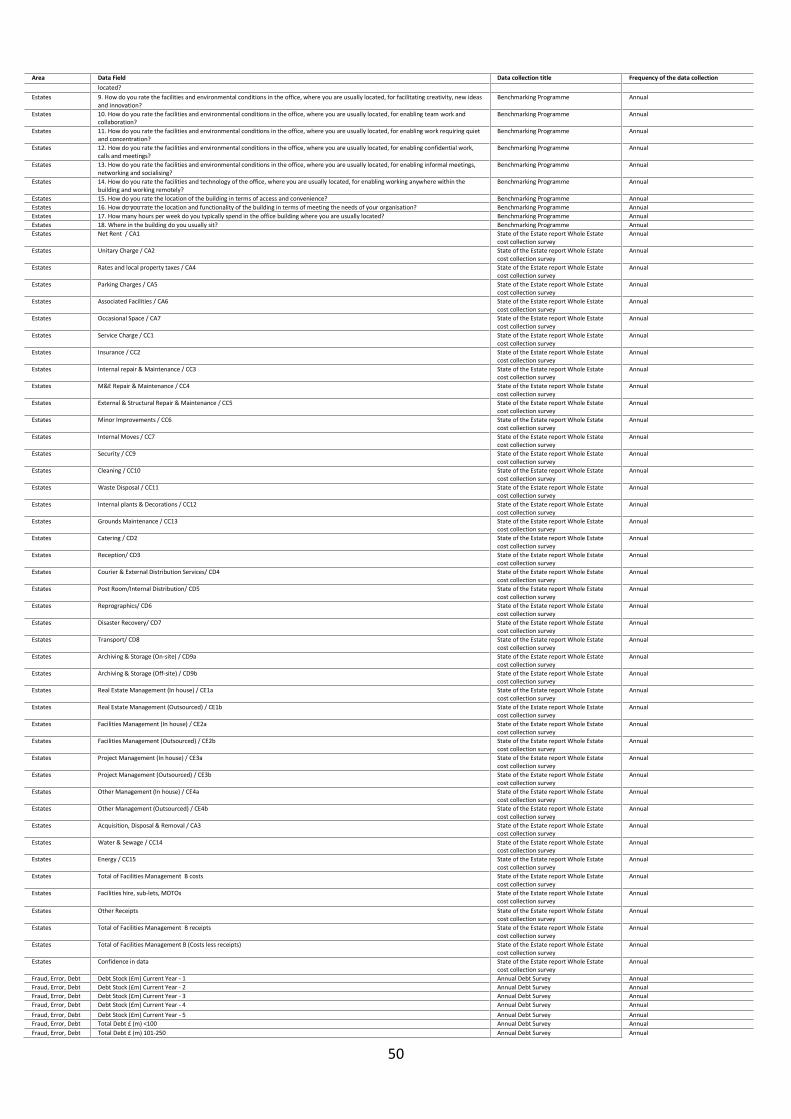
50
Area Data Field Data collection title Frequency of the data collection
located?
Estates 9. How do you rate the facilities and environmental conditions in the office, where you are usually located, for facilitating creativity, new ideas and innovation?
Benchmarking Programme Annual
Estates 10. How do you rate the facilities and environmental conditions in the office, where you are usually located, for enabling team work and collaboration?
Benchmarking Programme Annual
Estates 11. How do you rate the facilities and environmental conditions in the office, where you are usually located, for enabling work requiring quiet and concentration?
Benchmarking Programme Annual
Estates 12. How do you rate the facilities and environmental conditions in the office, where you are usually located, for enabling confidential work, calls and meetings?
Benchmarking Programme Annual
Estates 13. How do you rate the facilities and environmental conditions in the office, where you are usually located, for enabling informal meetings, networking and socialising?
Benchmarking Programme Annual
Estates 14. How do you rate the facilities and technology of the office, where you are usually located, for enabling working anywhere within the building and working remotely?
Benchmarking Programme Annual
Estates 15. How do you rate the location of the building in terms of access and convenience? Benchmarking Programme Annual
Estates 16. How do you rate the location and functionality of the building in terms of meeting the needs of your organisation? Benchmarking Programme Annual
Estates 17. How many hours per week do you typically spend in the office building where you are usually located? Benchmarking Programme Annual
Estates 18. Where in the building do you usually sit? Benchmarking Programme Annual
Estates Net Rent / CA1 State of the Estate report Whole Estate cost collection survey
Annual
Estates Unitary Charge / CA2 State of the Estate report Whole Estate cost collection survey
Annual
Estates Rates and local property taxes / CA4 State of the Estate report Whole Estate cost collection survey
Annual
Estates Parking Charges / CA5 State of the Estate report Whole Estate cost collection survey
Annual
Estates Associated Facilities / CA6 State of the Estate report Whole Estate cost collection survey
Annual
Estates Occasional Space / CA7 State of the Estate report Whole Estate cost collection survey
Annual
Estates Service Charge / CC1 State of the Estate report Whole Estate cost collection survey
Annual
Estates Insurance / CC2 State of the Estate report Whole Estate cost collection survey
Annual
Estates Internal repair & Maintenance / CC3 State of the Estate report Whole Estate cost collection survey
Annual
Estates M&E Repair & Maintenance / CC4 State of the Estate report Whole Estate cost collection survey
Annual
Estates External & Structural Repair & Maintenance / CC5 State of the Estate report Whole Estate cost collection survey
Annual
Estates Minor Improvements / CC6 State of the Estate report Whole Estate cost collection survey
Annual
Estates Internal Moves / CC7 State of the Estate report Whole Estate cost collection survey
Annual
Estates Security / CC9 State of the Estate report Whole Estate cost collection survey
Annual
Estates Cleaning / CC10 State of the Estate report Whole Estate cost collection survey
Annual
Estates Waste Disposal / CC11 State of the Estate report Whole Estate cost collection survey
Annual
Estates Internal plants & Decorations / CC12 State of the Estate report Whole Estate cost collection survey
Annual
Estates Grounds Maintenance / CC13 State of the Estate report Whole Estate cost collection survey
Annual
Estates Catering / CD2 State of the Estate report Whole Estate cost collection survey
Annual
Estates Reception/ CD3 State of the Estate report Whole Estate cost collection survey
Annual
Estates Courier & External Distribution Services/ CD4 State of the Estate report Whole Estate cost collection survey
Annual
Estates Post Room/Internal Distribution/ CD5 State of the Estate report Whole Estate cost collection survey
Annual
Estates Reprographics/ CD6 State of the Estate report Whole Estate cost collection survey
Annual
Estates Disaster Recovery/ CD7 State of the Estate report Whole Estate cost collection survey
Annual
Estates Transport/ CD8 State of the Estate report Whole Estate cost collection survey
Annual
Estates Archiving & Storage (On-site) / CD9a State of the Estate report Whole Estate cost collection survey
Annual
Estates Archiving & Storage (Off-site) / CD9b State of the Estate report Whole Estate cost collection survey
Annual
Estates Real Estate Management (In house) / CE1a State of the Estate report Whole Estate cost collection survey
Annual
Estates Real Estate Management (Outsourced) / CE1b State of the Estate report Whole Estate cost collection survey
Annual
Estates Facilities Management (In house) / CE2a State of the Estate report Whole Estate cost collection survey
Annual
Estates Facilities Management (Outsourced) / CE2b State of the Estate report Whole Estate cost collection survey
Annual
Estates Project Management (In house) / CE3a State of the Estate report Whole Estate cost collection survey
Annual
Estates Project Management (Outsourced) / CE3b State of the Estate report Whole Estate cost collection survey
Annual
Estates Other Management (In house) / CE4a State of the Estate report Whole Estate cost collection survey
Annual
Estates Other Management (Outsourced) / CE4b State of the Estate report Whole Estate cost collection survey
Annual
Estates Acquisition, Disposal & Removal / CA3 State of the Estate report Whole Estate cost collection survey
Annual
Estates Water & Sewage / CC14 State of the Estate report Whole Estate cost collection survey
Annual
Estates Energy / CC15 State of the Estate report Whole Estate cost collection survey
Annual
Estates Total of Facilities Management B costs State of the Estate report Whole Estate cost collection survey
Annual
Estates Facilities hire, sub-lets, MOTOs State of the Estate report Whole Estate cost collection survey
Annual
Estates Other Receipts State of the Estate report Whole Estate cost collection survey
Annual
Estates Total of Facilities Management B receipts State of the Estate report Whole Estate cost collection survey
Annual
Estates Total of Facilities Management B (Costs less receipts) State of the Estate report Whole Estate cost collection survey
Annual
Estates Confidence in data State of the Estate report Whole Estate cost collection survey
Annual
Fraud, Error, Debt Debt Stock (£m) Current Year - 1 Annual Debt Survey Annual
Fraud, Error, Debt Debt Stock (£m) Current Year - 2 Annual Debt Survey Annual
Fraud, Error, Debt Debt Stock (£m) Current Year - 3 Annual Debt Survey Annual
Fraud, Error, Debt Debt Stock (£m) Current Year - 4 Annual Debt Survey Annual
Fraud, Error, Debt Debt Stock (£m) Current Year - 5 Annual Debt Survey Annual
Fraud, Error, Debt Total Debt £ (m) <100 Annual Debt Survey Annual
Fraud, Error, Debt Total Debt £ (m) 101-250 Annual Debt Survey Annual
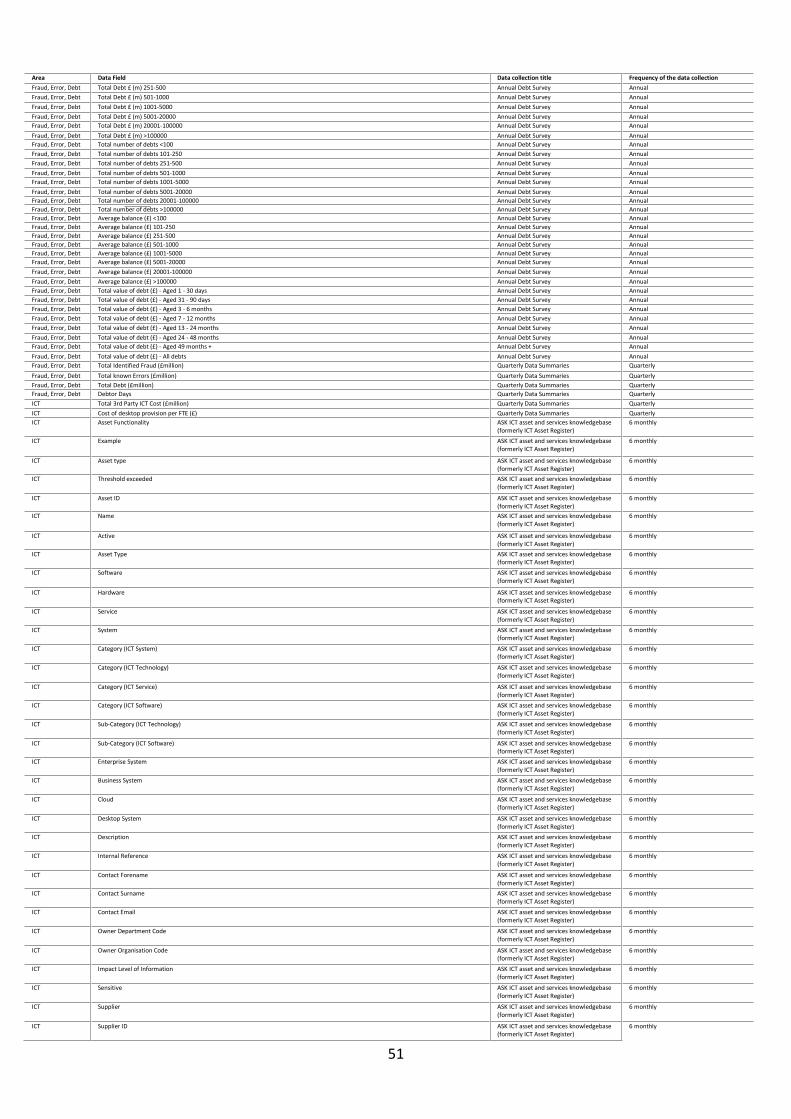
51
Area Data Field Data collection title Frequency of the data collection
Fraud, Error, Debt Total Debt £ (m) 251-500 Annual Debt Survey Annual
Fraud, Error, Debt Total Debt £ (m) 501-1000 Annual Debt Survey Annual
Fraud, Error, Debt Total Debt £ (m) 1001-5000 Annual Debt Survey Annual
Fraud, Error, Debt Total Debt £ (m) 5001-20000 Annual Debt Survey Annual
Fraud, Error, Debt Total Debt £ (m) 20001-100000 Annual Debt Survey Annual
Fraud, Error, Debt Total Debt £ (m) >100000 Annual Debt Survey Annual
Fraud, Error, Debt Total number of debts <100 Annual Debt Survey Annual
Fraud, Error, Debt Total number of debts 101-250 Annual Debt Survey Annual
Fraud, Error, Debt Total number of debts 251-500 Annual Debt Survey Annual
Fraud, Error, Debt Total number of debts 501-1000 Annual Debt Survey Annual
Fraud, Error, Debt Total number of debts 1001-5000 Annual Debt Survey Annual
Fraud, Error, Debt Total number of debts 5001-20000 Annual Debt Survey Annual
Fraud, Error, Debt Total number of debts 20001-100000 Annual Debt Survey Annual
Fraud, Error, Debt Total number of debts >100000 Annual Debt Survey Annual
Fraud, Error, Debt Average balance (£) <100 Annual Debt Survey Annual
Fraud, Error, Debt Average balance (£) 101-250 Annual Debt Survey Annual
Fraud, Error, Debt Average balance (£) 251-500 Annual Debt Survey Annual
Fraud, Error, Debt Average balance (£) 501-1000 Annual Debt Survey Annual
Fraud, Error, Debt Average balance (£) 1001-5000 Annual Debt Survey Annual
Fraud, Error, Debt Average balance (£) 5001-20000 Annual Debt Survey Annual
Fraud, Error, Debt Average balance (£) 20001-100000 Annual Debt Survey Annual
Fraud, Error, Debt Average balance (£) >100000 Annual Debt Survey Annual
Fraud, Error, Debt Total value of debt (£) - Aged 1 - 30 days Annual Debt Survey Annual
Fraud, Error, Debt Total value of debt (£) - Aged 31 - 90 days Annual Debt Survey Annual
Fraud, Error, Debt Total value of debt (£) - Aged 3 - 6 months Annual Debt Survey Annual
Fraud, Error, Debt Total value of debt (£) - Aged 7 - 12 months Annual Debt Survey Annual
Fraud, Error, Debt Total value of debt (£) - Aged 13 - 24 months Annual Debt Survey Annual
Fraud, Error, Debt Total value of debt (£) - Aged 24 - 48 months Annual Debt Survey Annual
Fraud, Error, Debt Total value of debt (£) - Aged 49 months + Annual Debt Survey Annual
Fraud, Error, Debt Total value of debt (£) - All debts Annual Debt Survey Annual
Fraud, Error, Debt Total Identified Fraud (£million) Quarterly Data Summaries Quarterly
Fraud, Error, Debt Total known Errors (£million) Quarterly Data Summaries Quarterly
Fraud, Error, Debt Total Debt (£million) Quarterly Data Summaries Quarterly
Fraud, Error, Debt Debtor Days Quarterly Data Summaries Quarterly
ICT Total 3rd Party ICT Cost (£million) Quarterly Data Summaries Quarterly
ICT Cost of desktop provision per FTE (£) Quarterly Data Summaries Quarterly
ICT Asset Functionality ASK ICT asset and services knowledgebase (formerly ICT Asset Register)
6 monthly
ICT Example ASK ICT asset and services knowledgebase (formerly ICT Asset Register)
6 monthly
ICT Asset type ASK ICT asset and services knowledgebase (formerly ICT Asset Register)
6 monthly
ICT Threshold exceeded ASK ICT asset and services knowledgebase (formerly ICT Asset Register)
6 monthly
ICT Asset ID ASK ICT asset and services knowledgebase (formerly ICT Asset Register)
6 monthly
ICT Name ASK ICT asset and services knowledgebase (formerly ICT Asset Register)
6 monthly
ICT Active ASK ICT asset and services knowledgebase (formerly ICT Asset Register)
6 monthly
ICT Asset Type ASK ICT asset and services knowledgebase (formerly ICT Asset Register)
6 monthly
ICT Software ASK ICT asset and services knowledgebase (formerly ICT Asset Register)
6 monthly
ICT Hardware ASK ICT asset and services knowledgebase (formerly ICT Asset Register)
6 monthly
ICT Service ASK ICT asset and services knowledgebase (formerly ICT Asset Register)
6 monthly
ICT System ASK ICT asset and services knowledgebase (formerly ICT Asset Register)
6 monthly
ICT Category (ICT System) ASK ICT asset and services knowledgebase (formerly ICT Asset Register)
6 monthly
ICT Category (ICT Technology) ASK ICT asset and services knowledgebase (formerly ICT Asset Register)
6 monthly
ICT Category (ICT Service) ASK ICT asset and services knowledgebase (formerly ICT Asset Register)
6 monthly
ICT Category (ICT Software) ASK ICT asset and services knowledgebase (formerly ICT Asset Register)
6 monthly
ICT Sub-Category (ICT Technology) ASK ICT asset and services knowledgebase (formerly ICT Asset Register)
6 monthly
ICT Sub-Category (ICT Software) ASK ICT asset and services knowledgebase (formerly ICT Asset Register)
6 monthly
ICT Enterprise System ASK ICT asset and services knowledgebase (formerly ICT Asset Register)
6 monthly
ICT Business System ASK ICT asset and services knowledgebase (formerly ICT Asset Register)
6 monthly
ICT Cloud ASK ICT asset and services knowledgebase (formerly ICT Asset Register)
6 monthly
ICT Desktop System ASK ICT asset and services knowledgebase (formerly ICT Asset Register)
6 monthly
ICT Description ASK ICT asset and services knowledgebase (formerly ICT Asset Register)
6 monthly
ICT Internal Reference ASK ICT asset and services knowledgebase (formerly ICT Asset Register)
6 monthly
ICT Contact Forename ASK ICT asset and services knowledgebase (formerly ICT Asset Register)
6 monthly
ICT Contact Surname ASK ICT asset and services knowledgebase (formerly ICT Asset Register)
6 monthly
ICT Contact Email ASK ICT asset and services knowledgebase (formerly ICT Asset Register)
6 monthly
ICT Owner Department Code ASK ICT asset and services knowledgebase (formerly ICT Asset Register)
6 monthly
ICT Owner Organisation Code ASK ICT asset and services knowledgebase (formerly ICT Asset Register)
6 monthly
ICT Impact Level of Information ASK ICT asset and services knowledgebase (formerly ICT Asset Register)
6 monthly
ICT Sensitive ASK ICT asset and services knowledgebase (formerly ICT Asset Register)
6 monthly
ICT Supplier ASK ICT asset and services knowledgebase (formerly ICT Asset Register)
6 monthly
ICT Supplier ID ASK ICT asset and services knowledgebase (formerly ICT Asset Register)
6 monthly

52
Area Data Field Data collection title Frequency of the data collection
ICT Supplier Name ASK ICT asset and services knowledgebase (formerly ICT Asset Register)
6 monthly
ICT SupplierType ASK ICT asset and services knowledgebase (formerly ICT Asset Register)
6 monthly
ICT SupplierPrivate ASK ICT asset and services knowledgebase (formerly ICT Asset Register)
6 monthly
ICT SupplierDepartmentCode ASK ICT asset and services knowledgebase (formerly ICT Asset Register)
6 monthly
ICT SupplierOrganisationCode ASK ICT asset and services knowledgebase (formerly ICT Asset Register)
6 monthly
ICT Date Live Service ASK ICT asset and services knowledgebase (formerly ICT Asset Register)
6 monthly
ICT Lifespan ASK ICT asset and services knowledgebase (formerly ICT Asset Register)
6 monthly
ICT Public Sector Service ASK ICT asset and services knowledgebase (formerly ICT Asset Register)
6 monthly
ICT Internal Support Service ASK ICT asset and services knowledgebase (formerly ICT Asset Register)
6 monthly
ICT ProductName/Model ASK ICT asset and services knowledgebase (formerly ICT Asset Register)
6 monthly
ICT Product Make/Manufacturer ASK ICT asset and services knowledgebase (formerly ICT Asset Register)
6 monthly
ICT Product Version ASK ICT asset and services knowledgebase (formerly ICT Asset Register)
6 monthly
ICT ICT Cost ASK ICT asset and services knowledgebase (formerly ICT Asset Register)
6 monthly
ICT Commercial Officer Email ASK ICT asset and services knowledgebase (formerly ICT Asset Register)
6 monthly
ICT Cost ID ASK ICT asset and services knowledgebase (formerly ICT Asset Register)
6 monthly
ICT CostTypeX ASK ICT asset and services knowledgebase (formerly ICT Asset Register)
6 monthly
ICT Indirect Non-attributal ASK ICT asset and services knowledgebase (formerly ICT Asset Register)
6 monthly
ICT In-direct semi-attributable ASK ICT asset and services knowledgebase (formerly ICT Asset Register)
6 monthly
ICT Direct Fixed Cost ASK ICT asset and services knowledgebase (formerly ICT Asset Register)
6 monthly
ICT Direct Variable Cost ASK ICT asset and services knowledgebase (formerly ICT Asset Register)
6 monthly
ICT CostFrequencyX ASK ICT asset and services knowledgebase (formerly ICT Asset Register)
6 monthly
ICT CostAmountX ASK ICT asset and services knowledgebase (formerly ICT Asset Register)
6 monthly
ICT CostPrecisionX ASK ICT asset and services knowledgebase (formerly ICT Asset Register)
6 monthly
ICT CostVariableX ASK ICT asset and services knowledgebase (formerly ICT Asset Register)
6 monthly
ICT ICT Contract ASK ICT asset and services knowledgebase (formerly ICT Asset Register)
6 monthly
ICT ICT Contract Sensitive? ASK ICT asset and services knowledgebase (formerly ICT Asset Register)
6 monthly
ICT Commercial Officer Email ASK ICT asset and services knowledgebase (formerly ICT Asset Register)
6 monthly
ICT ContractID ASK ICT asset and services knowledgebase (formerly ICT Asset Register)
6 monthly
ICT ContractName ASK ICT asset and services knowledgebase (formerly ICT Asset Register)
6 monthly
ICT Contract Reference ASK ICT asset and services knowledgebase (formerly ICT Asset Register)
6 monthly
ICT ContractDepartmentCode ASK ICT asset and services knowledgebase (formerly ICT Asset Register)
6 monthly
ICT ContractOrganisationCode ASK ICT asset and services knowledgebase (formerly ICT Asset Register)
6 monthly
ICT ContractProcurementCategory ASK ICT asset and services knowledgebase (formerly ICT Asset Register)
6 monthly
ICT Procurement Category - ICT Hardware ASK ICT asset and services knowledgebase (formerly ICT Asset Register)
6 monthly
ICT Procurement Category - Networking ASK ICT asset and services knowledgebase (formerly ICT Asset Register)
6 monthly
ICT Procurement Category - ICT Services ASK ICT asset and services knowledgebase (formerly ICT Asset Register)
6 monthly
ICT Procurement Category - Telecoms ASK ICT asset and services knowledgebase (formerly ICT Asset Register)
6 monthly
ICT Procurement Category - Software ASK ICT asset and services knowledgebase (formerly ICT Asset Register)
6 monthly
ICT ContractProcurementSubCategory ASK ICT asset and services knowledgebase (formerly ICT Asset Register)
6 monthly
ICT Procurement Sub-category (ICT Hardware) Computer Components ASK ICT asset and services knowledgebase (formerly ICT Asset Register)
6 monthly
ICT Procurement Sub-category (ICT Hardware) Computer Peripherals ASK ICT asset and services knowledgebase (formerly ICT Asset Register)
6 monthly
ICT Procurement Sub-category (ICT Hardware) Processing Units ASK ICT asset and services knowledgebase (formerly ICT Asset Register)
6 monthly
ICT Procurement Sub-category (ICT Hardware) Storage and Reader Devices ASK ICT asset and services knowledgebase (formerly ICT Asset Register)
6 monthly
ICT Procurement Sub-category (Networking) Network Cables ASK ICT asset and services knowledgebase (formerly ICT Asset Register)
6 monthly
ICT Procurement Sub-category (Networking) Network Equipment ASK ICT asset and services knowledgebase (formerly ICT Asset Register)
6 monthly
ICT Procurement Sub-category (Networking) Networking Systems ASK ICT asset and services knowledgebase (formerly ICT Asset Register)
6 monthly
ICT Procurement Sub-category (ICT Services) ICT Installation ASK ICT asset and services knowledgebase (formerly ICT Asset Register)
6 monthly
ICT Procurement Sub-category (ICT Services) ICT Repair and Maintenance ASK ICT asset and services knowledgebase (formerly ICT Asset Register)
6 monthly
ICT Procurement Sub-category (ICT Services) ICT Support Services ASK ICT asset and services knowledgebase (formerly ICT Asset Register)
6 monthly
ICT Procurement Sub-category (ICT software) Application Software ASK ICT asset and services knowledgebase (formerly ICT Asset Register)
6 monthly
ICT Procurement Sub-category (ICT software) Operating Software ASK ICT asset and services knowledgebase (formerly ICT Asset Register)
6 monthly

53
Area Data Field Data collection title Frequency of the data collection
ICT Procurement Sub-category (Telecoms) Telecoms Equipment ASK ICT asset and services knowledgebase (formerly ICT Asset Register)
6 monthly
ICT Procurement Sub-category (Telecoms) Telecoms Facilities and Services ASK ICT asset and services knowledgebase (formerly ICT Asset Register)
6 monthly
ICT Procurement Sub-category (Telecoms) Telecoms Systems ASK ICT asset and services knowledgebase (formerly ICT Asset Register)
6 monthly
ICT ContractStartDate ASK ICT asset and services knowledgebase (formerly ICT Asset Register)
6 monthly
ICT ContractEndDate ASK ICT asset and services knowledgebase (formerly ICT Asset Register)
6 monthly
ICT ContractRenewalDate ASK ICT asset and services knowledgebase (formerly ICT Asset Register)
6 monthly
ICT Contract Amount ASK ICT asset and services knowledgebase (formerly ICT Asset Register)
6 monthly
ICT ICT Licence ASK ICT asset and services knowledgebase (formerly ICT Asset Register)
6 monthly
ICT LicenceID ASK ICT asset and services knowledgebase (formerly ICT Asset Register)
6 monthly
ICT LicenceName ASK ICT asset and services knowledgebase (formerly ICT Asset Register)
6 monthly
ICT Description ASK ICT asset and services knowledgebase (formerly ICT Asset Register)
6 monthly
ICT Licence Model Type ASK ICT asset and services knowledgebase (formerly ICT Asset Register)
6 monthly
ICT Re-usableSystem ASK ICT asset and services knowledgebase (formerly ICT Asset Register)
6 monthly
ICT Re-usableSystemCategory ASK ICT asset and services knowledgebase (formerly ICT Asset Register)
6 monthly
ICT Solution ASK ICT asset and services knowledgebase (formerly ICT Asset Register)
6 monthly
ICT Managed service ASK ICT asset and services knowledgebase (formerly ICT Asset Register)
6 monthly
ICT Lessons learned ASK ICT asset and services knowledgebase (formerly ICT Asset Register)
6 monthly
ICT Pattern ASK ICT asset and services knowledgebase (formerly ICT Asset Register)
6 monthly
ICT Re-UsableSystemFurtherInformation ASK ICT asset and services knowledgebase (formerly ICT Asset Register)
6 monthly
ICT ChangedByUserID ASK ICT asset and services knowledgebase (formerly ICT Asset Register)
6 monthly
ICT ChangedDate ASK ICT asset and services knowledgebase (formerly ICT Asset Register)
6 monthly
ICT Number of users ASK ICT asset and services knowledgebase (formerly ICT Asset Register)
6 monthly
ICT Number of units ASK ICT asset and services knowledgebase (formerly ICT Asset Register)
6 monthly
ICT Precision on number of users ASK ICT asset and services knowledgebase (formerly ICT Asset Register)
6 monthly
ICT Accredited Security Level ASK ICT asset and services knowledgebase (formerly ICT Asset Register)
6 monthly
ICT Provision ASK ICT asset and services knowledgebase (formerly ICT Asset Register)
6 monthly
ICT Cloud ASK ICT asset and services knowledgebase (formerly ICT Asset Register)
6 monthly
ICT In-house ASK ICT asset and services knowledgebase (formerly ICT Asset Register)
6 monthly
ICT Outsourced ASK ICT asset and services knowledgebase (formerly ICT Asset Register)
6 monthly
ICT Shared service ASK ICT asset and services knowledgebase (formerly ICT Asset Register)
6 monthly
ICT Managed Service ASK ICT asset and services knowledgebase (formerly ICT Asset Register)
6 monthly
ICT Ownership ASK ICT asset and services knowledgebase (formerly ICT Asset Register)
6 monthly
ICT User ID ASK ICT asset and services knowledgebase (formerly ICT Asset Register)
6 monthly
ICT No of users (licences held) ASK ICT asset and services knowledgebase (formerly ICT Asset Register)
6 monthly
ICT Precision on number of licences held ASK ICT asset and services knowledgebase (formerly ICT Asset Register)
6 monthly
ICT No of users (licences used) ASK ICT asset and services knowledgebase (formerly ICT Asset Register)
6 monthly
ICT Precision on number of licences used ASK ICT asset and services knowledgebase (formerly ICT Asset Register)
6 monthly
ICT Licence Held/Used Calculation Method ASK ICT asset and services knowledgebase (formerly ICT Asset Register)
6 monthly
ICT Customisation ASK ICT asset and services knowledgebase (formerly ICT Asset Register)
6 monthly
ICT ICT Costs ASK ICT asset and services knowledgebase (formerly ICT Asset Register)
6 monthly
ICT Category (ICT Service) ASK ICT asset and services knowledgebase (formerly ICT Asset Register)
6 monthly
ICT Enterprise System ASK ICT asset and services knowledgebase (formerly ICT Asset Register)
6 monthly
ICT Business System ASK ICT asset and services knowledgebase (formerly ICT Asset Register)
6 monthly
ICT Desktop System ASK ICT asset and services knowledgebase (formerly ICT Asset Register)
6 monthly
ICT Sub-Category (ICT Service) ASK ICT asset and services knowledgebase (formerly ICT Asset Register)
6 monthly
ICT Sub-Category (ICT System) ASK ICT asset and services knowledgebase (formerly ICT Asset Register)
6 monthly
ICT Product ASK ICT asset and services knowledgebase (formerly ICT Asset Register)
6 monthly
ICT ProductName ASK ICT asset and services knowledgebase (formerly ICT Asset Register)
6 monthly
ICT ProductID ASK ICT asset and services knowledgebase (formerly ICT Asset Register)
6 monthly
ICT Description ASK ICT asset and services knowledgebase (formerly ICT Asset Register)
6 monthly
ICT AssetType ASK ICT asset and services knowledgebase (formerly ICT Asset Register)
6 monthly
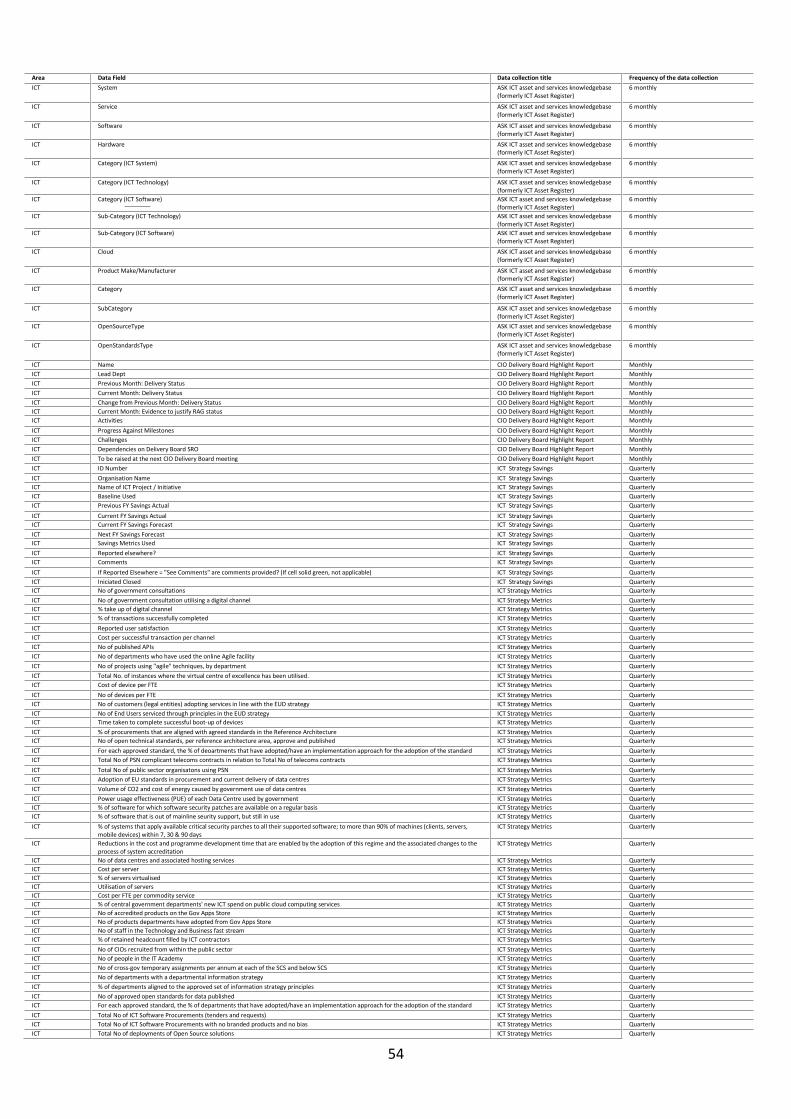
54
Area Data Field Data collection title Frequency of the data collection
ICT System ASK ICT asset and services knowledgebase (formerly ICT Asset Register)
6 monthly
ICT Service ASK ICT asset and services knowledgebase (formerly ICT Asset Register)
6 monthly
ICT Software ASK ICT asset and services knowledgebase (formerly ICT Asset Register)
6 monthly
ICT Hardware ASK ICT asset and services knowledgebase (formerly ICT Asset Register)
6 monthly
ICT Category (ICT System) ASK ICT asset and services knowledgebase (formerly ICT Asset Register)
6 monthly
ICT Category (ICT Technology) ASK ICT asset and services knowledgebase (formerly ICT Asset Register)
6 monthly
ICT Category (ICT Software) ASK ICT asset and services knowledgebase (formerly ICT Asset Register)
6 monthly
ICT Sub-Category (ICT Technology) ASK ICT asset and services knowledgebase (formerly ICT Asset Register)
6 monthly
ICT Sub-Category (ICT Software) ASK ICT asset and services knowledgebase (formerly ICT Asset Register)
6 monthly
ICT Cloud ASK ICT asset and services knowledgebase (formerly ICT Asset Register)
6 monthly
ICT Product Make/Manufacturer ASK ICT asset and services knowledgebase (formerly ICT Asset Register)
6 monthly
ICT Category ASK ICT asset and services knowledgebase (formerly ICT Asset Register)
6 monthly
ICT SubCategory ASK ICT asset and services knowledgebase (formerly ICT Asset Register)
6 monthly
ICT OpenSourceType ASK ICT asset and services knowledgebase (formerly ICT Asset Register)
6 monthly
ICT OpenStandardsType ASK ICT asset and services knowledgebase (formerly ICT Asset Register)
6 monthly
ICT Name CIO Delivery Board Highlight Report Monthly
ICT Lead Dept CIO Delivery Board Highlight Report Monthly
ICT Previous Month: Delivery Status CIO Delivery Board Highlight Report Monthly
ICT Current Month: Delivery Status CIO Delivery Board Highlight Report Monthly
ICT Change from Previous Month: Delivery Status CIO Delivery Board Highlight Report Monthly
ICT Current Month: Evidence to justify RAG status CIO Delivery Board Highlight Report Monthly
ICT Activities CIO Delivery Board Highlight Report Monthly
ICT Progress Against Milestones CIO Delivery Board Highlight Report Monthly
ICT Challenges CIO Delivery Board Highlight Report Monthly
ICT Dependencies on Delivery Board SRO CIO Delivery Board Highlight Report Monthly
ICT To be raised at the next CIO Delivery Board meeting CIO Delivery Board Highlight Report Monthly
ICT ID Number ICT Strategy Savings Quarterly
ICT Organisation Name ICT Strategy Savings Quarterly
ICT Name of ICT Project / Initiative ICT Strategy Savings Quarterly
ICT Baseline Used ICT Strategy Savings Quarterly
ICT Previous FY Savings Actual ICT Strategy Savings Quarterly
ICT Current FY Savings Actual ICT Strategy Savings Quarterly
ICT Current FY Savings Forecast ICT Strategy Savings Quarterly
ICT Next FY Savings Forecast ICT Strategy Savings Quarterly
ICT Savings Metrics Used ICT Strategy Savings Quarterly
ICT Reported elsewhere? ICT Strategy Savings Quarterly
ICT Comments ICT Strategy Savings Quarterly
ICT If Reported Elsewhere = "See Comments" are comments provided? (If cell solid green, not applicable) ICT Strategy Savings Quarterly
ICT Iniciated Closed ICT Strategy Savings Quarterly
ICT No of government consultations ICT Strategy Metrics Quarterly
ICT No of government consultation utilising a digital channel ICT Strategy Metrics Quarterly
ICT % take up of digital channel ICT Strategy Metrics Quarterly
ICT % of transactions successfully completed ICT Strategy Metrics Quarterly
ICT Reported user satisfaction ICT Strategy Metrics Quarterly
ICT Cost per successful transaction per channel ICT Strategy Metrics Quarterly
ICT No of published APIs ICT Strategy Metrics Quarterly
ICT No of departments who have used the online Agile facility ICT Strategy Metrics Quarterly
ICT No of projects using "agile" techniques, by department ICT Strategy Metrics Quarterly
ICT Total No. of instances where the virtual centre of excellence has been utilised. ICT Strategy Metrics Quarterly
ICT Cost of device per FTE ICT Strategy Metrics Quarterly
ICT No of devices per FTE ICT Strategy Metrics Quarterly
ICT No of customers (legal entities) adopting services in line with the EUD strategy ICT Strategy Metrics Quarterly
ICT No of End Users serviced through principles in the EUD strategy ICT Strategy Metrics Quarterly
ICT Time taken to complete successful boot-up of devices ICT Strategy Metrics Quarterly
ICT % of procurements that are aligned with agreed standards in the Reference Architecture ICT Strategy Metrics Quarterly
ICT No of open technical standards, per reference architecture area, approve and published ICT Strategy Metrics Quarterly
ICT For each approved standard, the % of deoartments that have adopted/have an implementation approach for the adoption of the standard ICT Strategy Metrics Quarterly
ICT Total No of PSN complicant telecoms contracts in relation to Total No of telecoms contracts ICT Strategy Metrics Quarterly
ICT Total No of public sector organisatons using PSN ICT Strategy Metrics Quarterly
ICT Adoption of EU standards in procurement and current delivery of data centres ICT Strategy Metrics Quarterly
ICT Volume of CO2 and cost of energy caused by government use of data centres ICT Strategy Metrics Quarterly
ICT Power usage effectiveness (PUE) of each Data Centre used by government ICT Strategy Metrics Quarterly
ICT % of software for which software security patches are available on a regular basis ICT Strategy Metrics Quarterly
ICT % of software that is out of mainline seurity support, but still in use ICT Strategy Metrics Quarterly
ICT % of systems that apply available critical security parches to all their supported software; to more than 90% of machines (clients, servers, mobile devices) within 7, 30 & 90 days
ICT Strategy Metrics Quarterly
ICT Reductions in the cost and programme development time that are enabled by the adoption of this regime and the associated changes to the process of system accreditation
ICT Strategy Metrics Quarterly
ICT No of data centres and associated hosting services ICT Strategy Metrics Quarterly
ICT Cost per server ICT Strategy Metrics Quarterly
ICT % of servers virtualised ICT Strategy Metrics Quarterly
ICT Utilisation of servers ICT Strategy Metrics Quarterly
ICT Cost per FTE per commodity service ICT Strategy Metrics Quarterly
ICT % of central government departments' new ICT spend on public cloud computing services ICT Strategy Metrics Quarterly
ICT No of accredited products on the Gov Apps Store ICT Strategy Metrics Quarterly
ICT No of products departments have adopted from Gov Apps Store ICT Strategy Metrics Quarterly
ICT No of staff in the Technology and Business fast stream ICT Strategy Metrics Quarterly
ICT % of retained headcount filled by ICT contractors ICT Strategy Metrics Quarterly
ICT No of CIOs recruited from within the public sector ICT Strategy Metrics Quarterly
ICT No of people in the IT Academy ICT Strategy Metrics Quarterly
ICT No of cross-gov temporary assignments per annum at each of the SCS and below SCS ICT Strategy Metrics Quarterly
ICT No of departments with a departmental information strategy ICT Strategy Metrics Quarterly
ICT % of departments aligned to the approved set of information strategy principles ICT Strategy Metrics Quarterly
ICT No of approved open standards for data published ICT Strategy Metrics Quarterly
ICT For each approved standard, the % of departments that have adopted/have an implementation approach for the adoption of the standard ICT Strategy Metrics Quarterly
ICT Total No of ICT Software Procurements (tenders and requests) ICT Strategy Metrics Quarterly
ICT Total No of ICT Software Procurements with no branded products and no bias ICT Strategy Metrics Quarterly
ICT Total No of deployments of Open Source solutions ICT Strategy Metrics Quarterly

55
Area Data Field Data collection title Frequency of the data collection
ICT Take up by departments of the guidance on accessing the internet and social media channels ICT Strategy Metrics Quarterly
ICT No of verified official government social media accounts ICT Strategy Metrics Quarterly
ICT Total No of reusable assets contributed ICT Strategy Metrics Quarterly
ICT Total No of assets contributed by organisations ICT Strategy Metrics Quarterly
ICT Total No of instances of reuse ICT Strategy Metrics Quarterly
ICT Total No of shared services and solutions ICT Strategy Metrics Quarterly
ICT No of licences defined as "held" in the asset and services register ICT Strategy Metrics Quarterly
ICT No of licences defined as "used" in the asset and services register ICT Strategy Metrics Quarterly
ICT Total spend under management on ICT comon goods and services ICT Strategy Metrics Quarterly
ICT No of ICT contracts with a lifetime value greater than £100m ICT Strategy Metrics Quarterly
ICT Time to deliver ICT procurements ICT Strategy Metrics Quarterly
ICT No of active ICT procurements ICT Strategy Metrics Quarterly
Major Projects Overall Delivery Confidence Assessment for Project Government Major Projects Portfolio (GMPP)
Quarterly
Major Projects Risk Level for Project Government Major Projects Portfolio (GMPP)
Quarterly
Major Projects Project - Budgeted Spend - RDEL Government Major Projects Portfolio (GMPP)
Quarterly
Major Projects Project - Forecast Spend - RDEL Government Major Projects Portfolio (GMPP)
Quarterly
Major Projects Project - Budgeted Spend - CDEL Government Major Projects Portfolio (GMPP)
Quarterly
Major Projects Project - Forecast Spend - CDEL Government Major Projects Portfolio (GMPP)
Quarterly
Major Projects Project - Actual Spend - RDEL Government Major Projects Portfolio (GMPP)
Quarterly
Major Projects Project - Actual Spend - CDEL Government Major Projects Portfolio (GMPP)
Quarterly
Major Projects Project - Budgeted Financial Benefits Government Major Projects Portfolio (GMPP)
Quarterly
Major Projects Project - Actual Financial Benefits Government Major Projects Portfolio (GMPP)
Quarterly
Major Projects Project - Net Present Value Government Major Projects Portfolio (GMPP)
Quarterly
Major Projects Project - Whole life cost total (including non-Government spend) Government Major Projects Portfolio (GMPP)
Quarterly
Major Projects Milestone - Title / Description Government Major Projects Portfolio (GMPP)
Quarterly
Major Projects Milestone - Planned Date / Baseline Government Major Projects Portfolio (GMPP)
Quarterly
Major Projects Milestone - Last Approved Date Government Major Projects Portfolio (GMPP)
Quarterly
Major Projects Milestone - Current Forecast Government Major Projects Portfolio (GMPP)
Quarterly
Major Projects Milestone - Completion Date Government Major Projects Portfolio (GMPP)
Quarterly
Major Projects £m whole life cost of ALL major projects Quarterly Data Summaries Quarterly
Major Projects £m cost for each of top 5 Major Projects Quarterly Data Summaries Quarterly
People Days Lost: by Region Sickness absence quarterly (rolling annual position)
People Total Days Lost (12 month period): by Region Sickness absence quarterly (rolling annual position)
People Total Staff Years: by Region Sickness absence quarterly (rolling annual position)
People AWDL: by Region Sickness absence quarterly (rolling annual position)
People Total Staff Employed in Period (Headcount): by Region Sickness absence quarterly (rolling annual position)
People Total Staff Employed in Period with No Absence (Headcount): by Region Sickness absence quarterly (rolling annual position)
People Days Lost (Short Term): by Gender Sickness absence quarterly (rolling annual position)
People Days Lost (Long Term): by Gender Sickness absence quarterly (rolling annual position)
People Total Days Lost (12 month period): by Gender Sickness absence quarterly (rolling annual position)
People Total Staff Years: by Gender Sickness absence quarterly (rolling annual position)
People AWDL: by Gender Sickness absence quarterly (rolling annual position)
People Total Staff Employed in Period (Headcound): by Gender Sickness absence quarterly (rolling annual position)
People Total Staff Employed in Period with No Absence (Headcound): by Gender Sickness absence quarterly (rolling annual position)
People % Staff with No Sick Leave: by Gender Sickness absence quarterly (rolling annual position)
People Days Lost (Short Term): by Age Group Sickness absence quarterly (rolling annual position)
People Days Lost (Long Term): by Age Group Sickness absence quarterly (rolling annual position)
People Total Days Lost (12 month period): by Age Group Sickness absence quarterly (rolling annual position)
People Total Staff Years: by Age Group Sickness absence quarterly (rolling annual position)
People AWDL: by Age Group Sickness absence quarterly (rolling annual position)
People Total Staff Employed in Period (Headcount): by Age Group Sickness absence quarterly (rolling annual position)
People Total Staff Employed in Period with No Absence (Headcount): by Age Group Sickness absence quarterly (rolling annual position)
People Days Lost (Short Term): by Sickness Absence Reason Sickness absence quarterly (rolling annual position)
People Days Lost (Long Term): by Sickness Absence Reason Sickness absence quarterly (rolling annual position)
People Total Days Lost (12 month period): by Sickness Absence Reason Sickness absence quarterly (rolling annual position)
People AA/AO Headcount Monthly Workforce Management Information Collection
Monthly
People AA/AO Full-time equivalent Monthly Workforce Management Information Collection
Monthly
People EO Headcount Monthly Workforce Management Information Collection
Monthly
People EO Full-time equivalent Monthly Workforce Management Information Collection
Monthly
People SEO/HEO Headcount Monthly Workforce Management Information Collection
Monthly
People SEO/HEO Full-time equivalent Monthly Workforce Management Information Collection
Monthly
People Grade 6/7 Headcount Monthly Workforce Management Information Collection
Monthly
People Grade 6/8 Full-time equivalent Monthly Workforce Management Information Collection
Monthly
People SCS level Headcount Monthly Workforce Management Information Collection
Monthly
People SCS level Full-time equivalent Monthly Workforce Management Information Collection
Monthly
People Other, unknown, or unspecified Headcount Monthly Workforce Management Information Collection
Monthly
People Other, unknown, or unspecified Full-time equivalent Monthly Workforce Management Information Collection
Monthly
People Total Employees Headcount Monthly Workforce Management Information Collection
Monthly
People Total Employees Full-time equivalent Monthly Workforce Management Information Collection
Monthly
People Agency staff (clerical/admin) Headcount Monthly Workforce Management Information Collection
Monthly
People Agency staff (clerical/admin) Full-time equivalent Monthly Workforce Management Information Collection
Monthly
People Interim managers Headcount Monthly Workforce Management Information Collection
Monthly
People Interim managers Full-time equivalent Monthly Workforce Management Information Collection
Monthly
People Specialist Contractors Headcount Monthly Workforce Management Information Collection
Monthly
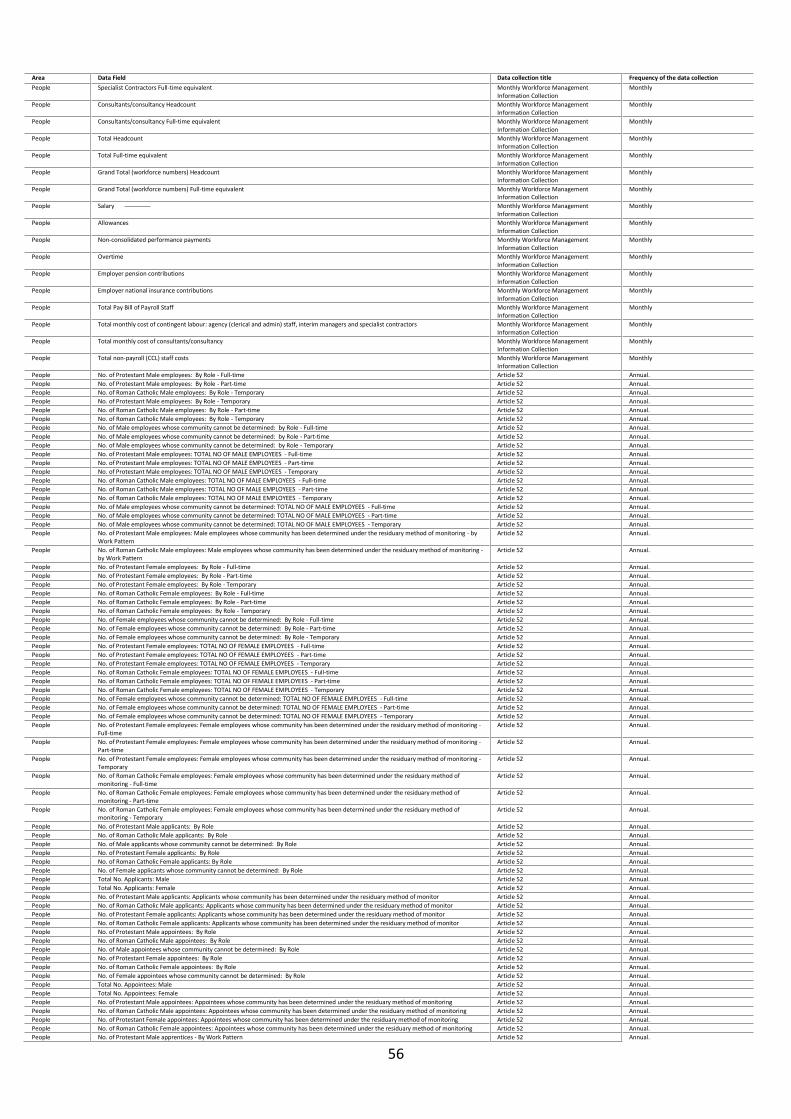
56
Area Data Field Data collection title Frequency of the data collection
People Specialist Contractors Full-time equivalent Monthly Workforce Management Information Collection
Monthly
People Consultants/consultancy Headcount Monthly Workforce Management Information Collection
Monthly
People Consultants/consultancy Full-time equivalent Monthly Workforce Management Information Collection
Monthly
People Total Headcount Monthly Workforce Management Information Collection
Monthly
People Total Full-time equivalent Monthly Workforce Management Information Collection
Monthly
People Grand Total (workforce numbers) Headcount Monthly Workforce Management Information Collection
Monthly
People Grand Total (workforce numbers) Full-time equivalent Monthly Workforce Management Information Collection
Monthly
People Salary Monthly Workforce Management Information Collection
Monthly
People Allowances Monthly Workforce Management Information Collection
Monthly
People Non-consolidated performance payments Monthly Workforce Management Information Collection
Monthly
People Overtime Monthly Workforce Management Information Collection
Monthly
People Employer pension contributions Monthly Workforce Management Information Collection
Monthly
People Employer national insurance contributions Monthly Workforce Management Information Collection
Monthly
People Total Pay Bill of Payroll Staff Monthly Workforce Management Information Collection
Monthly
People Total monthly cost of contingent labour: agency (clerical and admin) staff, interim managers and specialist contractors Monthly Workforce Management Information Collection
Monthly
People Total monthly cost of consultants/consultancy Monthly Workforce Management Information Collection
Monthly
People Total non-payroll (CCL) staff costs Monthly Workforce Management Information Collection
Monthly
People No. of Protestant Male employees: By Role - Full-time Article 52 Annual.
People No. of Protestant Male employees: By Role - Part-time Article 52 Annual.
People No. of Roman Catholic Male employees: By Role - Temporary Article 52 Annual.
People No. of Protestant Male employees: By Role - Temporary Article 52 Annual.
People No. of Roman Catholic Male employees: By Role - Part-time Article 52 Annual.
People No. of Roman Catholic Male employees: By Role - Temporary Article 52 Annual.
People No. of Male employees whose community cannot be determined: by Role - Full-time Article 52 Annual.
People No. of Male employees whose community cannot be determined: by Role - Part-time Article 52 Annual.
People No. of Male employees whose community cannot be determined: by Role - Temporary Article 52 Annual.
People No. of Protestant Male employees: TOTAL NO OF MALE EMPLOYEES - Full-time Article 52 Annual.
People No. of Protestant Male employees: TOTAL NO OF MALE EMPLOYEES - Part-time Article 52 Annual.
People No. of Protestant Male employees: TOTAL NO OF MALE EMPLOYEES - Temporary Article 52 Annual.
People No. of Roman Catholic Male employees: TOTAL NO OF MALE EMPLOYEES - Full-time Article 52 Annual.
People No. of Roman Catholic Male employees: TOTAL NO OF MALE EMPLOYEES - Part-time Article 52 Annual.
People No. of Roman Catholic Male employees: TOTAL NO OF MALE EMPLOYEES - Temporary Article 52 Annual.
People No. of Male employees whose community cannot be determined: TOTAL NO OF MALE EMPLOYEES - Full-time Article 52 Annual.
People No. of Male employees whose community cannot be determined: TOTAL NO OF MALE EMPLOYEES - Part-time Article 52 Annual.
People No. of Male employees whose community cannot be determined: TOTAL NO OF MALE EMPLOYEES - Temporary Article 52 Annual.
People No. of Protestant Male employees: Male employees whose community has been determined under the residuary method of monitoring - by Work Pattern
Article 52 Annual.
People No. of Roman Catholic Male employees: Male employees whose community has been determined under the residuary method of monitoring - by Work Pattern
Article 52 Annual.
People No. of Protestant Female employees: By Role - Full-time Article 52 Annual.
People No. of Protestant Female employees: By Role - Part-time Article 52 Annual.
People No. of Protestant Female employees: By Role - Temporary Article 52 Annual.
People No. of Roman Catholic Female employees: By Role - Full-time Article 52 Annual.
People No. of Roman Catholic Female employees: By Role - Part-time Article 52 Annual.
People No. of Roman Catholic Female employees: By Role - Temporary Article 52 Annual.
People No. of Female employees whose community cannot be determined: By Role - Full-time Article 52 Annual.
People No. of Female employees whose community cannot be determined: By Role - Part-time Article 52 Annual.
People No. of Female employees whose community cannot be determined: By Role - Temporary Article 52 Annual.
People No. of Protestant Female employees: TOTAL NO OF FEMALE EMPLOYEES - Full-time Article 52 Annual.
People No. of Protestant Female employees: TOTAL NO OF FEMALE EMPLOYEES - Part-time Article 52 Annual.
People No. of Protestant Female employees: TOTAL NO OF FEMALE EMPLOYEES - Temporary Article 52 Annual.
People No. of Roman Catholic Female employees: TOTAL NO OF FEMALE EMPLOYEES - Full-time Article 52 Annual.
People No. of Roman Catholic Female employees: TOTAL NO OF FEMALE EMPLOYEES - Part-time Article 52 Annual.
People No. of Roman Catholic Female employees: TOTAL NO OF FEMALE EMPLOYEES - Temporary Article 52 Annual.
People No. of Female employees whose community cannot be determined: TOTAL NO OF FEMALE EMPLOYEES - Full-time Article 52 Annual.
People No. of Female employees whose community cannot be determined: TOTAL NO OF FEMALE EMPLOYEES - Part-time Article 52 Annual.
People No. of Female employees whose community cannot be determined: TOTAL NO OF FEMALE EMPLOYEES - Temporary Article 52 Annual.
People No. of Protestant Female employees: Female employees whose community has been determined under the residuary method of monitoring - Full-time
Article 52 Annual.
People No. of Protestant Female employees: Female employees whose community has been determined under the residuary method of monitoring - Part-time
Article 52 Annual.
People No. of Protestant Female employees: Female employees whose community has been determined under the residuary method of monitoring - Temporary
Article 52 Annual.
People No. of Roman Catholic Female employees: Female employees whose community has been determined under the residuary method of monitoring - Full-time
Article 52 Annual.
People No. of Roman Catholic Female employees: Female employees whose community has been determined under the residuary method of monitoring - Part-time
Article 52 Annual.
People No. of Roman Catholic Female employees: Female employees whose community has been determined under the residuary method of monitoring - Temporary
Article 52 Annual.
People No. of Protestant Male applicants: By Role Article 52 Annual.
People No. of Roman Catholic Male applicants: By Role Article 52 Annual.
People No. of Male applicants whose community cannot be determined: By Role Article 52 Annual.
People No. of Protestant Female applicants: By Role Article 52 Annual.
People No. of Roman Catholic Female applicants: By Role Article 52 Annual.
People No. of Female applicants whose community cannot be determined: By Role Article 52 Annual.
People Total No. Applicants: Male Article 52 Annual.
People Total No. Applicants: Female Article 52 Annual.
People No. of Protestant Male applicants: Applicants whose community has been determined under the residuary method of monitor Article 52 Annual.
People No. of Roman Catholic Male applicants: Applicants whose community has been determined under the residuary method of monitor Article 52 Annual.
People No. of Protestant Female applicants: Applicants whose community has been determined under the residuary method of monitor Article 52 Annual.
People No. of Roman Catholic Female applicants: Applicants whose community has been determined under the residuary method of monitor Article 52 Annual.
People No. of Protestant Male appointees: By Role Article 52 Annual.
People No. of Roman Catholic Male appointees: By Role Article 52 Annual.
People No. of Male appointees whose community cannot be determined: By Role Article 52 Annual.
People No. of Protestant Female appointees: By Role Article 52 Annual.
People No. of Roman Catholic Female appointees: By Role Article 52 Annual.
People No. of Female appointees whose community cannot be determined: By Role Article 52 Annual.
People Total No. Appointees: Male Article 52 Annual.
People Total No. Appointees: Female Article 52 Annual.
People No. of Protestant Male appointees: Appointees whose community has been determined under the residuary method of monitoring Article 52 Annual.
People No. of Roman Catholic Male appointees: Appointees whose community has been determined under the residuary method of monitoring Article 52 Annual.
People No. of Protestant Female appointees: Appointees whose community has been determined under the residuary method of monitoring Article 52 Annual.
People No. of Roman Catholic Female appointees: Appointees whose community has been determined under the residuary method of monitoring Article 52 Annual.
People No. of Protestant Male apprentices - By Work Pattern Article 52 Annual.

57
Area Data Field Data collection title Frequency of the data collection
People No. of Roman Catholic Male apprentices - By Work Pattern Article 52 Annual.
People No. of Male apprentices whose community cannot be determined - By Work Pattern Article 52 Annual.
People No. of Protestant Female apprentices - By Work Pattern Article 52 Annual.
People No. of Roman Catholic Female apprentices - By Work Pattern Article 52 Annual.
People No. of Female apprentices whose community cannot be determined - By Work Pattern Article 52 Annual.
People No. of Female promotees whose community cannot be determined: By Role Article 52 Annual.
People No. of Male promotees whose community cannot be determined: By Role Article 52 Annual.
People No. of Protestant Female promotees: By Role Article 52 Annual.
People No. of Protestant Male promotees: By Role Article 52 Annual.
People No. of Roman Catholic Female promotees: By Role Article 52 Annual.
People No. of Roman Catholic Male promotees: By Role Article 52 Annual.
People Total No. Promotees: Male Article 52 Annual.
People Total No. Promotees: Female Article 52 Annual.
People No. of Female leavers whose community cannot be determined: By Role Article 52 Annual.
People No. of Male leavers whose community cannot be determined: By Role Article 52 Annual.
People No. of Protestant Female leavers: By Role Article 52 Annual.
People No. of Protestant Male leavers: By Role Article 52 Annual.
People No. of Roman Catholic Female leavers: By Role Article 52 Annual.
People No. of Roman Catholic Male leavers: By Role Article 52 Annual.
People Total No. Leavers: Male Article 52 Annual.
People Total No. Leavers: Female Article 52 Annual.
People Total employed - Headcount Workforce Projections Annual.
People Total employed - FTE Workforce Projections Annual.
People Movements in from a Civil Service organisation - Headcount Workforce Projections Annual.
People Movements in from an NDPB or Public Corporation* - Headcount Workforce Projections Annual.
People New recruits from outside of the Civil Service/NDPB/Public Corporation* group - Headcount Workforce Projections Annual.
People Total Inflows - Headcount Workforce Projections Annual.
People Movements in from a Civil Service organisation - FTE Workforce Projections Annual.
People Movements in from an NDPB or Public Corporation* - FTE Workforce Projections Annual.
People New recruits from outside of the Civil Service/NDPB/Public Corporation* group - FTE Workforce Projections Annual.
People Total Inflows - FTE Workforce Projections Annual.
People Voluntary paid exits - Headcount Workforce Projections Annual.
People Compulsory paid exits - Headcount Workforce Projections Annual.
People Movements into Mutuals, Social Enterprises or Joint Venture Partnerships - Headcount Workforce Projections Annual.
People All other exits from the Civil Service/NDPB/Public Corporation* group - Headcount Workforce Projections Annual.
People Movements to a Civil Service organisation - Headcount Workforce Projections Annual.
People Movements to a NDPB or public corporation* - Headcount Workforce Projections Annual.
People Total Outflows - Headcount Workforce Projections Annual.
People Voluntary paid exits - FTE Workforce Projections Annual.
People Compulsory paid exits - FTE Workforce Projections Annual.
People Movements into Mutuals, Social Enterprises or Joint Venture Partnerships - FTE Workforce Projections Annual.
People All other exits from the Civil Service/NDPB/Public Corporation* group - FTE Workforce Projections Annual.
People Movements to a Civil Service organisation - FTE Workforce Projections Annual.
People Movements to a NDPB or public corporation* - FTE Workforce Projections Annual.
People Total Outflows - FTE Workforce Projections Annual.
People Total Cost of Paid Exits Workforce Projections Annual.
People Movements in from the Civil Service/NDPB/Public Corporation* group: by Grade Level - Headcount Workforce Projections Annual.
People New recruit from outside of the Civil Service/NDPB/Public Corporation* group: by Grade Level - Headcount Workforce Projections Annual.
People Movements to the Civil Service/NDPB/Public Corporation* group: by Grade Level - Headcount Workforce Projections Annual.
People Exits from the Civil Service/NDPB/Public Corporation group: by Grade Level - Headcount Workforce Projections Annual.
People Movements in from the Civil Service/NDPB/Public Corporation* group: by Grade Level - FTE Workforce Projections Annual.
People New recruit from outside of the Civil Service/NDPB/Public Corporation* group: by Grade Level - FTE Workforce Projections Annual.
People Movements to the Civil Service/NDPB/Public Corporation* group: by Grade Level - FTE Workforce Projections Annual.
People Exits from the Civil Service/NDPB/Public Corporation* group: by Grade Level - FTE Workforce Projections Annual.
People Movements in from the Civil Service/NDPB/Public Corporation* group: by Region - Headcount Workforce Projections Annual.
People New recruit from outside of the Civil Service/NDPB/Public Corporation* group: by Region - Headcount Workforce Projections Annual.
People Movements to the Civil Service/NDPB/Public Corporation* group: by Region - Headcount Workforce Projections Annual.
People Exits from the Civil Service/NDPB/Public Corporation group: by Region - Headcount Workforce Projections Annual.
People Movements in from the Civil Service/NDPB/Public Corporation* group: by Region - FTE Workforce Projections Annual.
People New recruit from outside of the Civil Service/NDPB/Public Corporation* group: by Region - FTE Workforce Projections Annual.
People Movements to the Civil Service/NDPB/Public Corporation* group: by Region - FTE Workforce Projections Annual.
People Exits from the Civil Service/NDPB/Public Corporation* group: by Region - FTE Workforce Projections Annual.
People Movements in from the Civil Service/NDPB/Public Corporation* group: by Gender - Headcount Workforce Projections Annual.
People New recruit from outside of the Civil Service/NDPB/Public Corporation* group: by Gender - Headcount Workforce Projections Annual.
People Movements to the Civil Service/NDPB/Public Corporation* group: by Gender - Headcount Workforce Projections Annual.
People Exits from the Civil Service/NDPB/Public Corporation group: by Gender - Headcount Workforce Projections Annual.
People Movements in from the Civil Service/NDPB/Public Corporation* group: by Gender - FTE Workforce Projections Annual.
People New recruit from outside of the Civil Service/NDPB/Public Corporation* group: by Gender - FTE Workforce Projections Annual.
People Movements to the Civil Service/NDPB/Public Corporation* group: by Gender - FTE Workforce Projections Annual.
People Exits from the Civil Service/NDPB/Public Corporation* group: by Gender - FTE Workforce Projections Annual.
People Movements in from the Civil Service/NDPB/Public Corporation* group: by Ethnicity - Headcount Workforce Projections Annual.
People New recruit from outside of the Civil Service/NDPB/Public Corporation* group: by Ethnicity - Headcount Workforce Projections Annual.
People Movements to the Civil Service/NDPB/Public Corporation* group: by Ethnicity - Headcount Workforce Projections Annual.
People Exits from the Civil Service/NDPB/Public Corporation group: by Ethnicity - Headcount Workforce Projections Annual.
People Movements in from the Civil Service/NDPB/Public Corporation* group: by Ethnicity - FTE Workforce Projections Annual.
People New recruit from outside of the Civil Service/NDPB/Public Corporation* group: by Ethnicity - FTE Workforce Projections Annual.
People Movements to the Civil Service/NDPB/Public Corporation* group: by Ethnicity - FTE Workforce Projections Annual.
People Exits from the Civil Service/NDPB/Public Corporation* group: by Ethnicity - FTE Workforce Projections Annual.
People Movements in from the Civil Service/NDPB/Public Corporation* group: by Disability - Headcount Workforce Projections Annual.
People New recruit from outside of the Civil Service/NDPB/Public Corporation* group: by Disability - Headcount Workforce Projections Annual.
People Movements to the Civil Service/NDPB/Public Corporation* group: by Disability - Headcount Workforce Projections Annual.
People Exits from the Civil Service/NDPB/Public Corporation group: by Disability - Headcount Workforce Projections Annual.
People Movements in from the Civil Service/NDPB/Public Corporation* group: by Disability - FTE Workforce Projections Annual.
People New recruit from outside of the Civil Service/NDPB/Public Corporation* group: by Disability - FTE Workforce Projections Annual.
People Movements to the Civil Service/NDPB/Public Corporation* group: by Disability - FTE Workforce Projections Annual.
People Exits from the Civil Service/NDPB/Public Corporation* group: by Disability - FTE Workforce Projections Annual.
People Movements in from the Civil Service/NDPB/Public Corporation* group: by Age Group - Headcount Workforce Projections Annual.
People New recruit from outside of the Civil Service/NDPB/Public Corporation* group: by Age Group - Headcount Workforce Projections Annual.
People Movements to the Civil Service/NDPB/Public Corporation* group: by Age Group - Headcount Workforce Projections Annual.
People Exits from the Civil Service/NDPB/Public Corporation group: by Age Group - Headcount Workforce Projections Annual.
People Movements in from the Civil Service/NDPB/Public Corporation* group: by Age Group - FTE Workforce Projections Annual.
People New recruit from outside of the Civil Service/NDPB/Public Corporation* group: by Age Group - FTE Workforce Projections Annual.
People Movements in from the Civil Service/NDPB/Public Corporation* group: by Age Group - Headcount Workforce Projections Annual.
People Organisational Change Workforce Projections Annual.
People Organsational Type Workforce Projections Annual.
People Total Employed - Headcount Workforce Projections Annual.
People Total Employed - FTE Workforce Projections Annual.
People Movements in from a Civil Service organisation - Headcount Workforce Projections Annual.
People Movements in from an NDPB or Public Corporation* - Headcount Workforce Projections Annual.
People New recruits from outside of the Civil Service/NDPB/Public Corporation* group - Headcount Workforce Projections Annual.
People Total Inflows - Headcount Workforce Projections Annual.
People Movements in from a Civil Service organisation - FTE Workforce Projections Annual.
People Movements in from an NDPB or Public Corporation* - FTE Workforce Projections Annual.
People New recruits from outside of the Civil Service/NDPB/Public Corporation* group - FTE Workforce Projections Annual.
People Total Inflows - FTE Workforce Projections Annual.
People Voluntary paid exits - Headcount Workforce Projections Annual.
People Compulsory paid exits - Headcount Workforce Projections Annual.
People Movements into Mutuals, Social Enterprises or Joint Venture Partnerships - Headcount Workforce Projections Annual.
People All other exits from the Civil Service/NDPB/Public Corporation* group - Headcount Workforce Projections Annual.
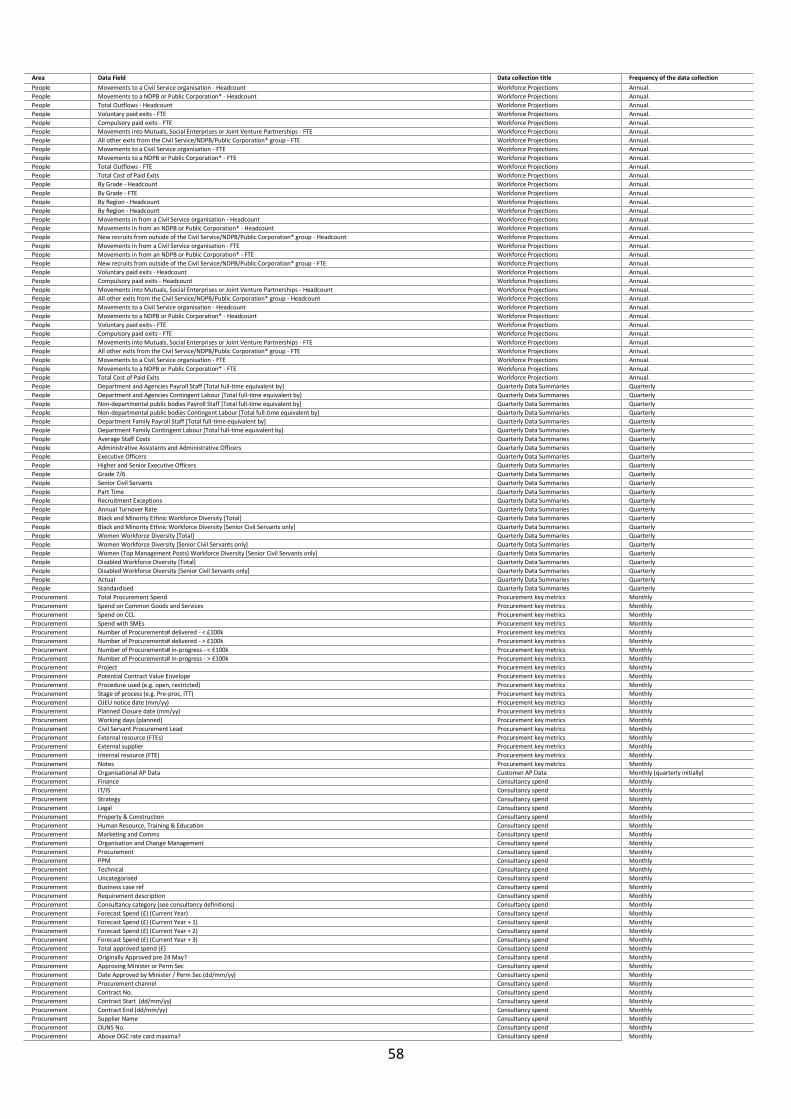
58
Area Data Field Data collection title Frequency of the data collection
People Movements to a Civil Service organisation - Headcount Workforce Projections Annual.
People Movements to a NDPB or Public Corporation* - Headcount Workforce Projections Annual.
People Total Outflows - Headcount Workforce Projections Annual.
People Voluntary paid exits - FTE Workforce Projections Annual.
People Compulsory paid exits - FTE Workforce Projections Annual.
People Movements into Mutuals, Social Enterprises or Joint Venture Partnerships - FTE Workforce Projections Annual.
People All other exits from the Civil Service/NDPB/Public Corporation* group - FTE Workforce Projections Annual.
People Movements to a Civil Service organisation - FTE Workforce Projections Annual.
People Movements to a NDPB or Public Corporation* - FTE Workforce Projections Annual.
People Total Outflows - FTE Workforce Projections Annual.
People Total Cost of Paid Exits Workforce Projections Annual.
People By Grade - Headcount Workforce Projections Annual.
People By Grade - FTE Workforce Projections Annual.
People By Region - Headcount Workforce Projections Annual.
People By Region - Headcount Workforce Projections Annual.
People Movements in from a Civil Service organisation - Headcount Workforce Projections Annual.
People Movements in from an NDPB or Public Corporation* - Headcount Workforce Projections Annual.
People New recruits from outside of the Civil Service/NDPB/Public Corporation* group - Headcount Workforce Projections Annual.
People Movements in from a Civil Service organisation - FTE Workforce Projections Annual.
People Movements in from an NDPB or Public Corporation* - FTE Workforce Projections Annual.
People New recruits from outside of the Civil Service/NDPB/Public Corporation* group - FTE Workforce Projections Annual.
People Voluntary paid exits - Headcount Workforce Projections Annual.
People Compulsory paid exits - Headcount Workforce Projections Annual.
People Movements into Mutuals, Social Enterprises or Joint Venture Partnerships - Headcount Workforce Projections Annual.
People All other exits from the Civil Service/NDPB/Public Corporation* group - Headcount Workforce Projections Annual.
People Movements to a Civil Service organisation - Headcount Workforce Projections Annual.
People Movements to a NDPB or Public Corporation* - Headcount Workforce Projections Annual.
People Voluntary paid exits - FTE Workforce Projections Annual.
People Compulsory paid exits - FTE Workforce Projections Annual.
People Movements into Mutuals, Social Enterprises or Joint Venture Partnerships - FTE Workforce Projections Annual.
People All other exits from the Civil Service/NDPB/Public Corporation* group - FTE Workforce Projections Annual.
People Movements to a Civil Service organisation - FTE Workforce Projections Annual.
People Movements to a NDPB or Public Corporation* - FTE Workforce Projections Annual.
People Total Cost of Paid Exits Workforce Projections Annual.
People Department and Agencies Payroll Staff [Total full-time equivalent by] Quarterly Data Summaries Quarterly
People Department and Agencies Contingent Labour [Total full-time equivalent by] Quarterly Data Summaries Quarterly
People Non-departmental public bodies Payroll Staff [Total full-time equivalent by] Quarterly Data Summaries Quarterly
People Non-departmental public bodies Contingent Labour [Total full-time equivalent by] Quarterly Data Summaries Quarterly
People Department Family Payroll Staff [Total full-time equivalent by] Quarterly Data Summaries Quarterly
People Department Family Contingent Labour [Total full-time equivalent by] Quarterly Data Summaries Quarterly
People Average Staff Costs Quarterly Data Summaries Quarterly
People Administrative Assistants and Administrative Officers Quarterly Data Summaries Quarterly
People Executive Officers Quarterly Data Summaries Quarterly
People Higher and Senior Executive Officers Quarterly Data Summaries Quarterly
People Grade 7/6 Quarterly Data Summaries Quarterly
People Senior Civil Servants Quarterly Data Summaries Quarterly
People Part Time Quarterly Data Summaries Quarterly
People Recruitment Exceptions Quarterly Data Summaries Quarterly
People Annual Turnover Rate Quarterly Data Summaries Quarterly
People Black and Minority Ethnic Workforce Diversity [Total] Quarterly Data Summaries Quarterly
People Black and Minority Ethnic Workforce Diversity [Senior Civil Servants only] Quarterly Data Summaries Quarterly
People Women Workforce Diversity [Total] Quarterly Data Summaries Quarterly
People Women Workforce Diversity [Senior Civil Servants only] Quarterly Data Summaries Quarterly
People Women (Top Management Posts) Workforce Diversity [Senior Civil Servants only] Quarterly Data Summaries Quarterly
People Disabled Workforce Diversity [Total] Quarterly Data Summaries Quarterly
People Disabled Workforce Diversity [Senior Civil Servants only] Quarterly Data Summaries Quarterly
People Actual Quarterly Data Summaries Quarterly
People Standardised Quarterly Data Summaries Quarterly
Procurement Total Procurement Spend Procurement key metrics Monthly
Procurement Spend on Common Goods and Services Procurement key metrics Monthly
Procurement Spend on CCL Procurement key metrics Monthly
Procurement Spend with SMEs Procurement key metrics Monthly
Procurement Number of Procurements# delivered - < £100k Procurement key metrics Monthly
Procurement Number of Procurements# delivered - > £100k Procurement key metrics Monthly
Procurement Number of Procurements# in-progress - < £100k Procurement key metrics Monthly
Procurement Number of Procurements# in-progress - > £100k Procurement key metrics Monthly
Procurement Project Procurement key metrics Monthly
Procurement Potential Contract Value Envelope Procurement key metrics Monthly
Procurement Procedure used (e.g. open, restricted) Procurement key metrics Monthly
Procurement Stage of process (e.g. Pre-proc, ITT) Procurement key metrics Monthly
Procurement OJEU notice date (mm/yy) Procurement key metrics Monthly
Procurement Planned Closure date (mm/yy) Procurement key metrics Monthly
Procurement Working days (planned) Procurement key metrics Monthly
Procurement Civil Servant Procurement Lead Procurement key metrics Monthly
Procurement External resource (FTEs) Procurement key metrics Monthly
Procurement External supplier Procurement key metrics Monthly
Procurement Internal resource (FTE) Procurement key metrics Monthly
Procurement Notes Procurement key metrics Monthly
Procurement Organisational AP Data Customer AP Data Monthly (quarterly initially)
Procurement Finance Consultancy spend Monthly
Procurement IT/IS Consultancy spend Monthly
Procurement Strategy Consultancy spend Monthly
Procurement Legal Consultancy spend Monthly
Procurement Property & Construction Consultancy spend Monthly
Procurement Human Resource, Training & Education Consultancy spend Monthly
Procurement Marketing and Comms Consultancy spend Monthly
Procurement Organisation and Change Management Consultancy spend Monthly
Procurement Procurement Consultancy spend Monthly
Procurement PPM Consultancy spend Monthly
Procurement Technical Consultancy spend Monthly
Procurement Uncategorised Consultancy spend Monthly
Procurement Business case ref Consultancy spend Monthly
Procurement Requirement description Consultancy spend Monthly
Procurement Consultancy category (see consultancy definitions) Consultancy spend Monthly
Procurement Forecast Spend (£) (Current Year) Consultancy spend Monthly
Procurement Forecast Spend (£) (Current Year + 1) Consultancy spend Monthly
Procurement Forecast Spend (£) (Current Year + 2) Consultancy spend Monthly
Procurement Forecast Spend (£) (Current Year + 3) Consultancy spend Monthly
Procurement Total approved spend (£) Consultancy spend Monthly
Procurement Originally Approved pre 24 May? Consultancy spend Monthly
Procurement Approving Minister or Perm Sec Consultancy spend Monthly
Procurement Date Approved by Minister / Perm Sec (dd/mm/yy) Consultancy spend Monthly
Procurement Procurement channel Consultancy spend Monthly
Procurement Contract No. Consultancy spend Monthly
Procurement Contract Start (dd/mm/yy) Consultancy spend Monthly
Procurement Contract End (dd/mm/yy) Consultancy spend Monthly
Procurement Supplier Name Consultancy spend Monthly
Procurement DUNS No. Consultancy spend Monthly
Procurement Above OGC rate card maxima? Consultancy spend Monthly
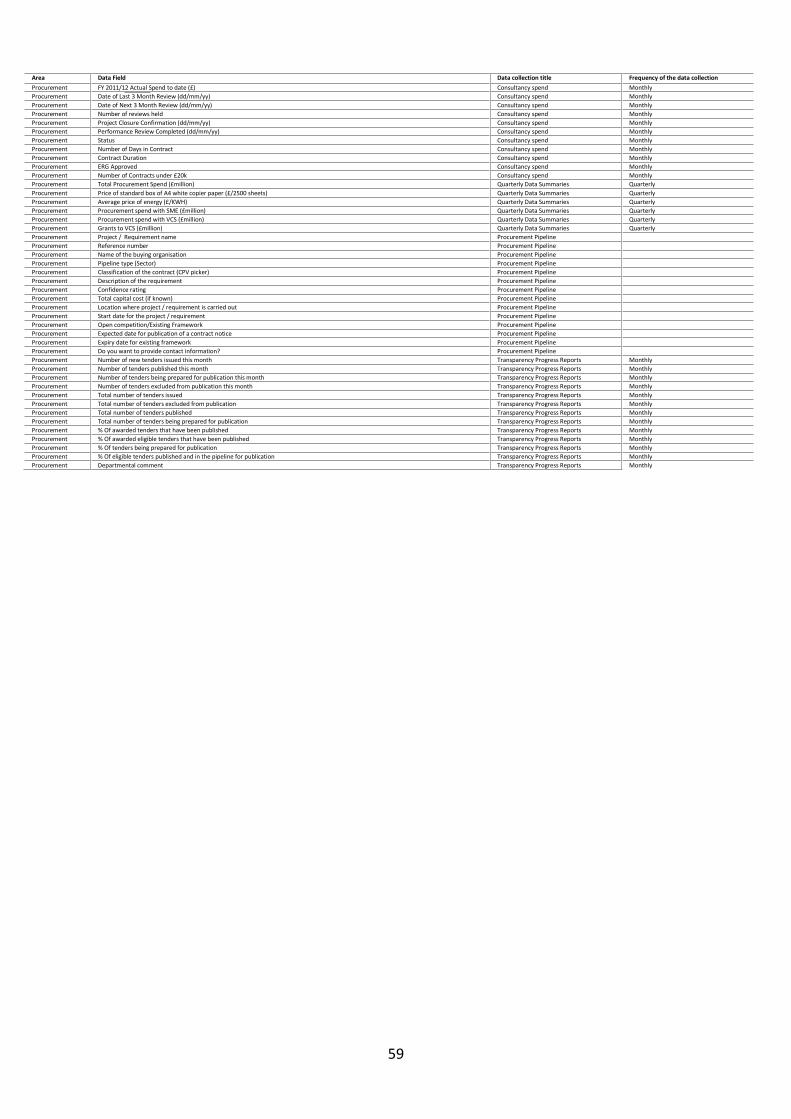
59
Area Data Field Data collection title Frequency of the data collection
Procurement FY 2011/12 Actual Spend to date (£) Consultancy spend Monthly
Procurement Date of Last 3 Month Review (dd/mm/yy) Consultancy spend Monthly
Procurement Date of Next 3 Month Review (dd/mm/yy) Consultancy spend Monthly
Procurement Number of reviews held Consultancy spend Monthly
Procurement Project Closure Confirmation (dd/mm/yy) Consultancy spend Monthly
Procurement Performance Review Completed (dd/mm/yy) Consultancy spend Monthly
Procurement Status Consultancy spend Monthly
Procurement Number of Days in Contract Consultancy spend Monthly
Procurement Contract Duration Consultancy spend Monthly
Procurement ERG Approved Consultancy spend Monthly
Procurement Number of Contracts under £20k Consultancy spend Monthly
Procurement Total Procurement Spend (£million) Quarterly Data Summaries Quarterly
Procurement Price of standard box of A4 white copier paper (£/2500 sheets) Quarterly Data Summaries Quarterly
Procurement Average price of energy (£/KWH) Quarterly Data Summaries Quarterly
Procurement Procurement spend with SME (£million) Quarterly Data Summaries Quarterly
Procurement Procurement spend with VCS (£million) Quarterly Data Summaries Quarterly
Procurement Grants to VCS (£million) Quarterly Data Summaries Quarterly
Procurement Project / Requirement name Procurement Pipeline
Procurement Reference number Procurement Pipeline
Procurement Name of the buying organisation Procurement Pipeline
Procurement Pipeline type (Sector) Procurement Pipeline
Procurement Classification of the contract (CPV picker) Procurement Pipeline
Procurement Description of the requirement Procurement Pipeline
Procurement Confidence rating Procurement Pipeline
Procurement Total capital cost (if known) Procurement Pipeline
Procurement Location where project / requirement is carried out Procurement Pipeline
Procurement Start date for the project / requirement Procurement Pipeline
Procurement Open competition/Existing Framework Procurement Pipeline
Procurement Expected date for publication of a contract notice Procurement Pipeline
Procurement Expiry date for existing framework Procurement Pipeline
Procurement Do you want to provide contact information? Procurement Pipeline
Procurement Number of new tenders issued this month Transparency Progress Reports Monthly
Procurement Number of tenders published this month Transparency Progress Reports Monthly
Procurement Number of tenders being prepared for publication this month Transparency Progress Reports Monthly
Procurement Number of tenders excluded from publication this month Transparency Progress Reports Monthly
Procurement Total number of tenders issued Transparency Progress Reports Monthly
Procurement Total number of tenders excluded from publication Transparency Progress Reports Monthly
Procurement Total number of tenders published Transparency Progress Reports Monthly
Procurement Total number of tenders being prepared for publication Transparency Progress Reports Monthly
Procurement % Of awarded tenders that have been published Transparency Progress Reports Monthly
Procurement % Of awarded eligible tenders that have been published Transparency Progress Reports Monthly
Procurement % Of tenders being prepared for publication Transparency Progress Reports Monthly
Procurement % Of eligible tenders published and in the pipeline for publication Transparency Progress Reports Monthly
Procurement Departmental comment Transparency Progress Reports Monthly

60
Annex 13 List of Initiatives Underway to Improve Operational Management Information
Discussions at ER Board Management information has been a topic at the following ER Board meetings:
- January 2011
- December 2011
- February 2012.
Work in train Work currently in train to improve Management Information includes:
- ‘Strand 5’ of the Civil Service Reform work programme, focusing on systems, processes and
management information;
- The Finance Leadership Group’s Finance Transformation Programme, incorporating:
o Clear Line of Sight – a project to simplify the public spending framework.
o Project OSCAR - to replace the public spending database, providing departments and the
centre with a single version of the truth.
o The Common Chart of Accounts (COA) – which aims for all departments to use the same
CoA on their internal finance systems.
o Whole of Government Accounts - producing a set of consolidated financial statements for
the whole of the UK public sector, which looks and feels like a set of private sector
accounts
o Better spending control - covering incentives and penalties to encourage better quality
spending data, and to improve the monthly dashboard that goes to the Chief Secretary.
- The Management Information working group of Non-Executive Directors
- The Institute for Government study on Management Information
- The ER Board sponsored joint work between HMT and Cabinet Office to establish an management
information Strategy for the Centre of Government
- Projects to release data under the Transparency agenda.
61
Annex 14 Illustrative Departmental Comparison Charts
The charts in this annex have been created using illustrative data.
They do not represent real departmental performance figures
The figures overleaf provide are examples of the illustrative comparison charts that will be created with the data provided through the refreshed QDS. The charts below should be generated for all the performance metrics in the new QDS and circulated to departments and the centre of government.
These charts are intended to create a mechanism to discuss points of comparison where it is reasonable to draw comparisons. For example, where departments have similar types of operations it may be reasonable to draw comparisons between salary cost.
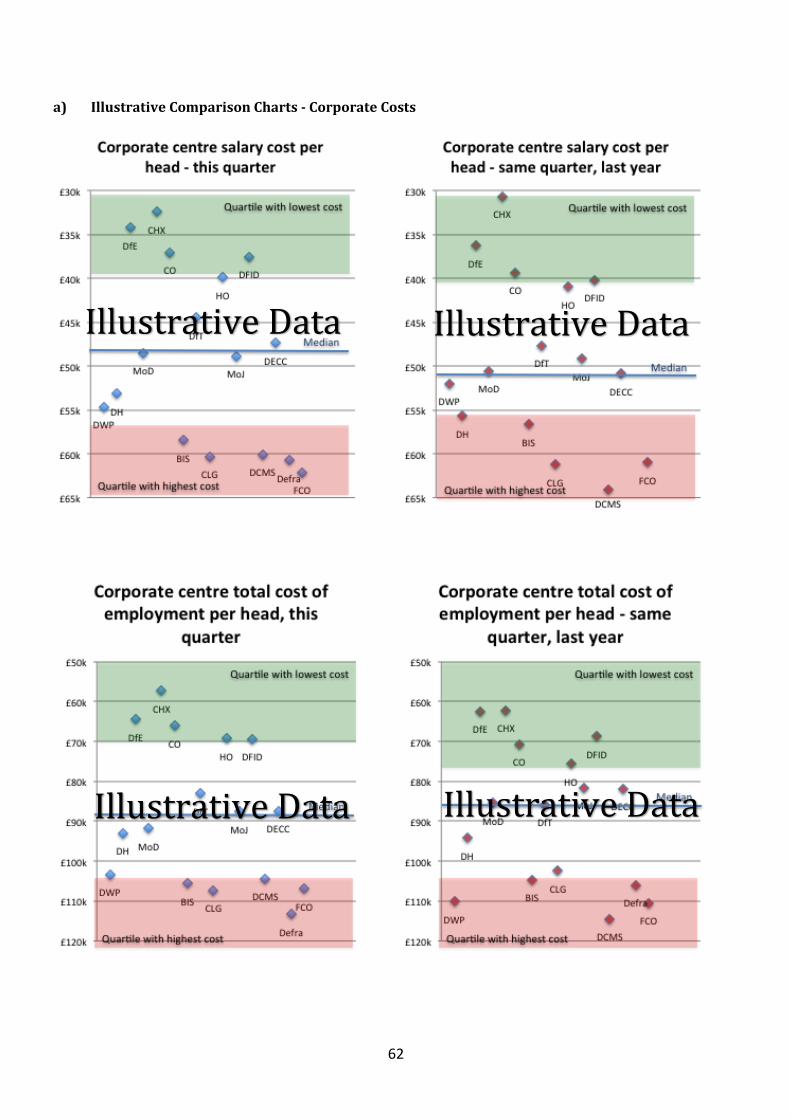
62
a) Illustrative Comparison Charts - Corporate Costs
Illustrative Data Illustrative Data
Illustrative Data Illustrative Data

63
b) Illustrative Comparison Charts – Personnel
Illustrative Data
Illustrative Data Illustrative Data
Illustrative Data

64
Annex 15 Screen Shots from the Web Application
A web application has been developed to allow the public to view a detailed breakdown of government spending. The data used will be a combination of statistics from Public Expenditure Statistical Analyses, QDS and other government sources.
The following screenshots give some examples of the scope and format of the data accessible to the public.
S1. This page will allow users to view historical government spending; different sections represent individual departments.

65
S2. Users will be able to view the breakdown of spending in a number of formats. The following slides show spending by individual departments in the area and bar chart formats.

66
S3. On each webpage the figures represented will be displayed in a list below the chart.

67
S4. For each department the application will allow spending to be broken down into Annually Managed Expenditure (AME) and organisation’s own budgets (DEL), These charts will also be available in the three different formats; area, bar and doughnut.

68
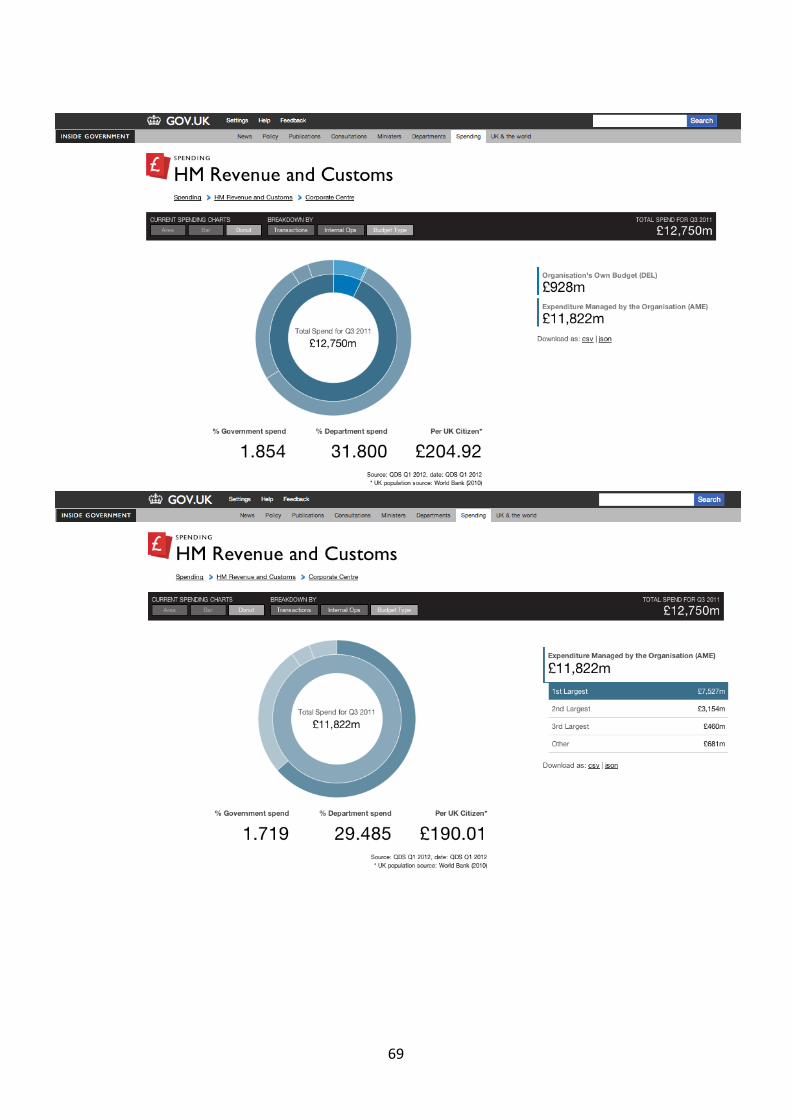
69

70
S5. Some aspects of spend can be broken down further; the slides below show more detailed costs for HMRC.
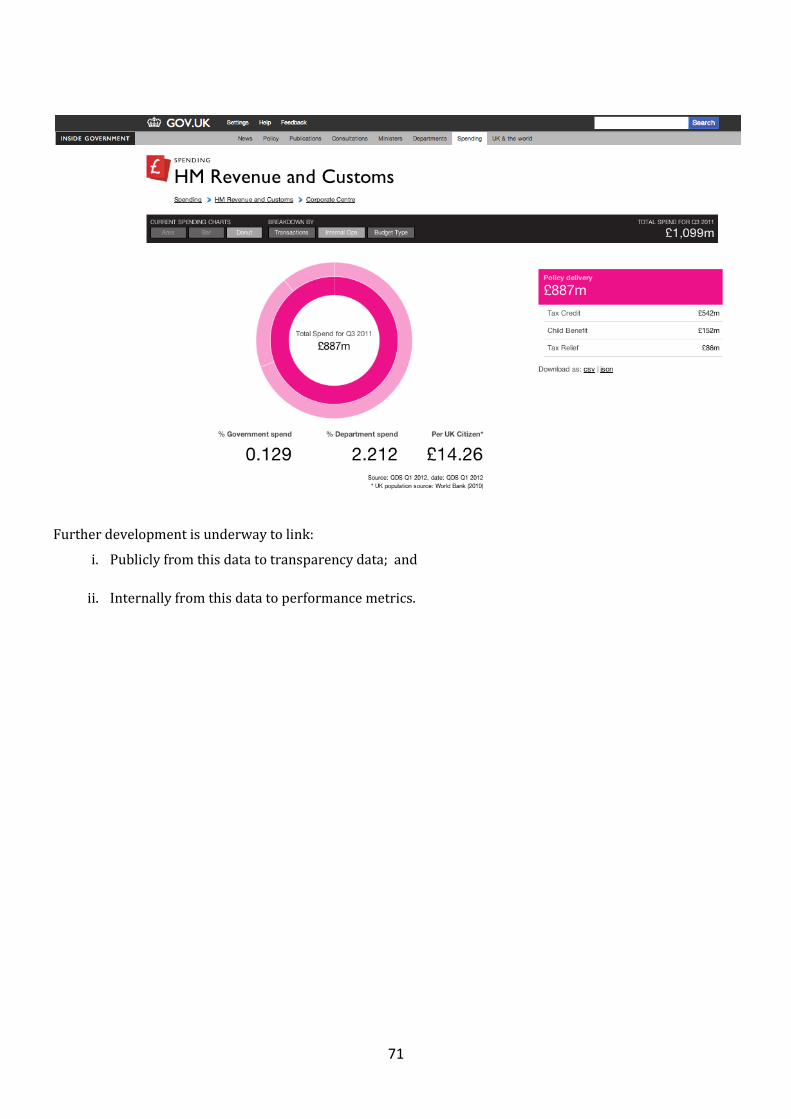
71
Further development is underway to link:
i. Publicly from this data to transparency data; and
ii. Internally from this data to performance metrics.

72
Annex 16 Recommendations on Reducing Data Requests for Property Data
Government Property Unit Data Review: Initial Data Item Rationalisation Recommendations*. *Subject to final challenge The Government Property Unit currently require 266 data items to be supplied by departments and their ALBs. 181 (68%) of these data items are required at a building occupation level. As well as underpinning the operational work of GPU these data items underpin the four estates key performance indicators included in the Quarterly Data Summary (Size of the Office Estate, Cost of the Office Estate, cost (£) per m2 and m2 per FTE). The remaining 85 (32%) are made up of procurement / contractual and property community data items. Recommendations In summary, the following detailed recommendations will reduce the number of data items required by GPU from 266 to 75. A reduction of 72%. This is significant in an area of mature data capture processes and requirement. Of the remaining 75 data items, 67 (89%) are occupational level data items which only require entry once / are updated infrequently (e.g. property address details, net internal area, lease expiries etc.) 8 (11%) require annual update. And 9 (12%) will require quarterly update to support QDS updates. Detailed recommendations 1. GPU should move to a core requirement of up to 75 items (depending on tenure type) which will support
its key operational work and management information outputs (management of National Property Controls, Government Estate Rationalisation, core benchmarking, State of the Estate Report).
2. The surveys that form part of the benchmarking survey (user, house committee, building conditional) should not form part of the core requirement. Instead forming part of a suite of tools that departments can choose to draw on if they find them of value.
3. The Facilities Management team should move to a contract information survey of 7 items to build their
contract landscape and fulfil contracts pipeline commitment. Additional granular level FM detail should either be obtained through GPU core requirement or “Deep Dive” on supplier data as conducted by other areas.
4. The FM team should stop the survey of FM FTEs (5 items) as it is not core to their delivery. 5. The annual Furniture Procurement Survey should be discontinued. This will result in a reduction of 9 data
items. The data collected through this survey should be replaced through use of Government Procurement Service and Greening Government data collected by Defra / Cabinet Office.
6. The Property Asset Management Community Survey has recently been conducted and will not be
required again for at least two years. Therefore these 12 items should be dropped from GPU future requirement. When there is requirement to refresh this information a voluntary online survey of the PAM Community should be considered.