prayatni soewondo and marisa handajani files/s3-prayatni soewondo... · prayatni soewondo and...
TRANSCRIPT
Prayatni Soewondo and Marisa Handajani [email protected]
Environmental Engineering Program
Faculty of Civil and Environmental Engineering
Institut Teknologi Bandung January 2012

Introduction Current
Situation
Future
Developments Conclusions
1 3 2 4
2
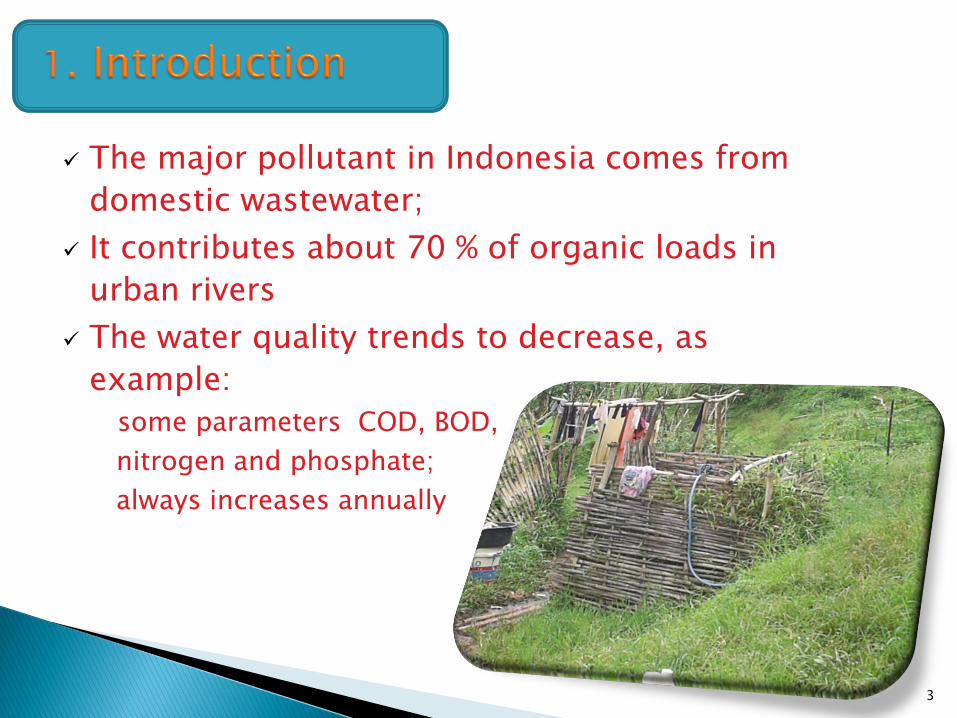
The major pollutant in Indonesia comes from
domestic wastewater;
It contributes about 70 % of organic loads in
urban rivers
The water quality trends to decrease, as
example:
some parameters COD, BOD,
nitrogen and phosphate;
always increases annually
3

0
50
100
150
200
250
300
350
400
450
500
St 1
B
St 2 St 3 St 4 St 5 St 6 St 7 St 8 St 9
Station
BO
D C
on
cen
trati
on
, m
g/L
BOD (Sem 2 2002)
BOD (Sem 2 2003)
BOD (Sem 2 2004)
BOD (Sem 2 2005)
Depth: 0.2 m
0
5
10
15
20
25
30
35
40
45
50
St 1B St 2 St 3 St 4 St 5 St 6 St 7 St 8 St 9
Station
BO
D C
on
cen
trati
on
, m
g/L
BOD (Sem 1 2002)BOD (Sem 1 2003)BOD (Sem 1 2004)BOD (Sem 1 2005)
Depth: 0.2 m
Variation of BOD concentration in surface water of Saguling Dam on Semester I (April-May) and Semester II (October-November), 2002-2005 (Soewondo, 2006a and 2006b)
636,5 - 643 m
613,35 – 629,01 m
4
(Semester I) (Semester II)

5
0
50
100
150
200
250
300
350
Aprl
02
Nov
02
May
03
Oct
03
May
04
Oct
04
Aprl
05
Nov
05
May
06
Nov
06
Apr
07
Time
CO
D a
nd
BO
D c
on
cen
trat
ion
,
mg
/L
COD
BOD
The concentration of BOD and COD in Citarum river, Nanjung during wet and dry seasons, 2002-2007

The population is around 237.5 million (BPS, 2010)
The population lives : 42 % in urban area and 58 % in rural area (BPS, 2010)
Basic facilities of sanitation : 69.51 % in urban area and 33.96 % in rural area (Bappenas, 2009)
Most of the people in Indonesia build their basic infrastructure of sanitation by self-supporting means.
In national scale, only 51.19 % of population has basic sanitation facilities (Bappenas, 2009)
6

0
10
20
30
40
50
60
70
80
90
100
Urban Rural
Areas
Ac
ce
ss
ibilit
y t
o f
ac
ilit
y o
f d
om
es
tic
wa
ste
wa
ter,
%
Communal (%) Private (%) Without facilities (%)
0%
10%
20%
30%
40%
50%
60%
70%
80%
Pelita III Pelita IV Pelita V Pelita VI
Five-Year Development
Investm
en
t, %
Sanitation
Wastewater
The accessibility of basic sanitation in Indonesia, 2000
Source: National Action Plan, 2003
The investment of five-year development in Indonesia for sanitation (include water supply) and infrastructure of wastewater
7

Served Population
Served Area Capacity and
Efficiency WWTP No City Population (person)
Served Area (Ha) Person % Ha % m3/day % Eff
Art of treatment
(1) (2) (3) (4) (5) (6) (7) (8) (9) (10) (11)
1 Balikpapan 436.029 50.331 7.764 1,8 40 0,1 800 tad ExAE
2 Banjarmasin 579.362 7.200 50 0,0 20 0,3 500 93,3 RBC
3 Bandung 2.250.000 16.729 420.000 18,7 6.000 35,9 243.000 91,7 S.POND 4 Cirebon 269.478 3.736 60.000 22,3 120 3,2 13.500 Tad S.POND 5 Denpasar (*) 459.384 23.653 181.600 35,2 1.655 7,0 51.000 Tad AELGN 6 Jakarta 9.175.600 65.570 1.659.000 20,3 6.260 9,6 462.600 66,7 AELGN 7 Medan 1.974.300 26.500 51.000 2,6 450 1,7 30.000 Tad UASB
8 Prapat (*) 10.000 192,1 10.500 105,0 71,6 37,27 2.010 85,0 AELGN 9 Surakarta 539.387 4.404 4.000 0,7 60 1,4 2.000 95,8 AELGN 10 Tangerang 1.320.600 18.378 45.700 3,5 82 0,4 5.500 Tad OXD
11 Yogyakarta 906.237 20.304 60.726 6,7 1.220 6 15.500 87,9 OXL
12 Total 17.910.377 236.805 2.489.940 13.9 15.977 6.75 826.410
Profile of Domestic Wastewater Treatment in Indonesia (2000)
8

Wastewater Treatment Plant in
Jakarta (a), Bandung (b) dan Medan (c)
(a) (b)
( c )

Current Zone Delineation in Bandung by Sanitation System Mode
Public sewerage (Zone A & A’): 39.7 km2 (23%)
Individual septic tank (Zone B): 37.1 km2 (22%)
Public sewerage (Zone A & A’): 39.7 km2 (23%)
Individual septic tank (Zone B): 37.1 km2 (22%)
Other on-site (soak-pit) (Zone C): 76.9 km2 (46%)
Communal treatment (Zone D): 3.1 km2 (2%)
Direct discharge to the nearest river (Zone E): 10.9 km2 (7%)Total 167.8 km2 (100%)
Zone
Source: Suharyanto, 2011 10

Septic Tank
Septic Tank
Septic Tank
Soak Pit
WWTP
CBSS
C
Sewerage systemCity Core Area
On-site systemAdjacent Area
A
A′
B
C
D
E
groundwater
gray water
wet day overflowInterceptor
New
ly I
nst
alle
d I
nter
cep
tor
Existing Sewer & Interceptor to WWTP
Newly Installed Sewer & Interceptor to WWTP
Legend:
Mode I
Mode III
Mode I
Mode VI Mode II←VIMode V←VI
Mode II←VI
Mode V←IV
Mode II←IV
Mode II←III
Mode IV
Mode III
Mode V
Mode II←III
Future Sanitation Modal Shifts in Bandung
Mode II
Mode V
Source: Suharyanto, 2011 11

No. Parameters Rainy
Seasons
Dry
Seasons Stream Standard*
1 TDS 88-389 143-378 1000 mg/l
2 TSS 98-200 18-102 50 mg/l
3 pH 7,16-7,50 6,43-7,06 6 – 9
4 BOD 80-180 61,7-187 50 mg/l
5 COD 102-345 128-706 100 mg/l
6 TOC 7,63-50,43 16,09-64,5 -
7 Nitrite 0-0,03 0-0,03 1 mg/l
8 Nitratq 1,41-25,32 1,89-24,4 10 mg/l
9 Amonium 0,51-8,65 4,66-9,62 0,51 mg/l
10 NTK 11,5-21,2 22,167-34,398 -
11 Total Phosphate 4,3-10,5 1,1-3,502 5 mg/l
12 Oil & Grease 7,6-15,1 5,3-15,1 10 mg/l
13 MBAS 0,03-2,7 2,464-7,315
0,5 mg/l *) PP 82, 2001
Source: Debora, Setyawan and Soewondo, 2009
Ratio BOD/COD: Rainy seasons : 0.43-0.86 Dry seasons : 0.21-0.68

As example :
MCK= Mandi, Cuci dan Kakus (Bath, wash and water closet) around Bandung and Tangerang
13
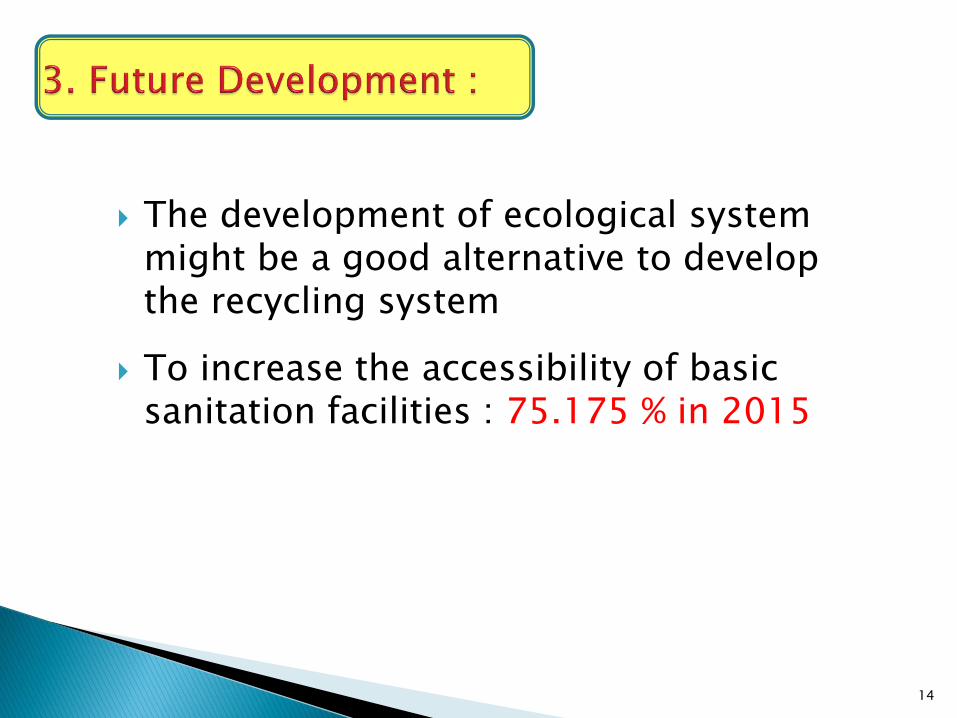
The development of ecological system might be a good alternative to develop the recycling system
To increase the accessibility of basic sanitation facilities : 75.175 % in 2015
14

15
How to manage the wastewater from home industry ???
Location of Slaughtering Houses and Tofu Industries Near Bandung

16
Two Stages of Wastewater Treatment Using Modifications of Anaerobic Baffled Reactor and Constructed Wetland to Treat Slaughtering Houses and Tofu Industries
Inlet
Anaerobic Baffled Rea c tor
Outlet
Wetland reactor
i n
l e t
Ga
s out let
2 2
o u
t l e
t 8 7
. 5
7
7
7
7
. 5
8 3 3
4 0
1
2
2 5
Sa
mp lin g
poi nts
3
Med ia Filte
r Batu apu
ng
Out

17
The efficiency of COD removal
in ABR and WR during the
experiments
WR1 WR2 WR3 WR4
WR1 WR2 WR3 WR4
Influent
Effluent
0
100
200
300
400
500
600
700
800
0 5 10 15 20 25 30 35 40 45 50 55 60 65 70 75
Time, day
Co
ncen
trati
on
of
CO
D,
mg
/L
Influent ABR2 Effluent ABR2 Effluent WR2
ABR2: 2 d
WR2: 5 d
ABR2: 2 d
WR2: 5 d
ABR2: 1 d
WR2: 3 d
ABR2: 1 d
WR2: 3 d

18
How to manage
the domestic wastewater ???
• Decentralized system less investment
• Ecological system
• Water scarcity recycling system
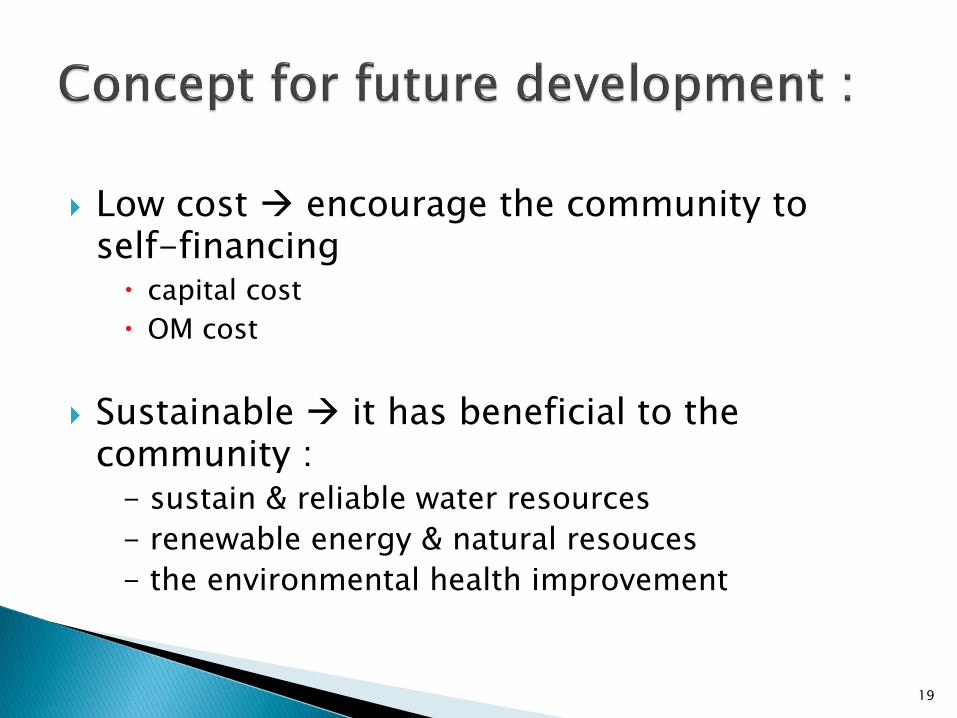
Low cost encourage the community to self-financing capital cost
OM cost
Sustainable it has beneficial to the community : - sustain & reliable water resources
- renewable energy & natural resouces
- the environmental health improvement
19

Increase access to domestic wastewater services, both on-site and off-site, in urban and rural areas;
Increase financial capacities for wastewater infrastructure developments, both on-site and off-site, and also recover treatment cost to insure services;
Increase societies contribution on developing housing effluent of domestic wastewater treatment system;
Increase the work of wastewater treatment institution and separate function between regulator and operator;
Develop regulation and apply treatments according to enacted guidelines.
20

Almost half of the Indonesian populations have no accessibility to wastewater facilities, which can potentially pollute the body of water.
By increasing both systems (on site and off site), the degradation of raw water quality can be reduced.
The development of technology can play a key role in improving these facilities.
Participation of the community is also very important to be concerned about.
21

22
Thank You for Your Attention
Bandung City by night@ Best Photographers