precast segmental double-t girder systems for multi-span ... · pdf fileprecast segmental...
TRANSCRIPT
Precast Segmental Double-T Girder Systems for
Multi-span Highway Overpass Bridges
by
Jeffrey Stuart Smith
A thesis submitted in conformity with the requirements for the degree of Master of Applied Science
Graduate Department of Civil Engineering University of Toronto
© Jeffrey Stuart Smith (2012)

ii
Precast Segmental Double-T Girder Systems for
Multi-span Highway Overpass Bridges
Jeffrey Stuart Smith
Master of Applied Science
Graduate Department of Civil Engineering University of Toronto
2012
Abstract
An alternative structural system for short span bridges is presented: a precast segmental double-T
with external, unbonded post-tensioning tendons. Single-span designs from 20 to 45 m long
show that the system can be implemented over a wide range of spans and that the system’s
sensitivity to post-tensioning losses reported in previous literature can be reduced by aligning the
prestressing force more concentrically.
Designs for multi-span bridges using this system are presented using simply supported spans
connected by thin flexible linking slabs made of ultra high-performance fibre-reinforced concrete
and using sections made fully continuous over intermediate supports.
A simplified method of geometry control is presented to facilitate the proper alignment of precast
segments without the use of match casting.
The precast segmental double-T bridge is compared to sixteen existing slab on girder bridges and
found to be a competitive alternative in terms of material use, cost, construction schedule, and
aesthetic merit.

iii
Acknowledgments
Funding for this research has been provided by the National Science and Engineering Research
Council and by McCormick Rankin Corporation.
My interest in bridges has grown from a curiosity when I first began my studies for this degree to
a passion today. Professor Paul Gauvreau has kindled what was once a small spark into a hearty
fire. He has also taught me to take the time to do things thoroughly, neatly, and with style, and
how to comport myself as a designer.
Doug Dixon has been a mentor to me for the past ten years. His ability to stay calm and
approachable while being extremely productive and industrious is inspiring. His confidence in
me has been an encouragement throughout my career.
Bob Stofko and the rest of my friends at McCormick Rankin have supported me in my return to
university and for that I thank them.
Various colleagues at the University of Toronto have helped me in the writing of this thesis.
Eileen Li graciously provided me with all the information I required to start my research on the
double-T bridge that she originally developed. Negar Elhami Khorasani showed me the ropes
(strands?) of unbonded tendon analysis. Jason Salonga walked me through some concepts
related to ultra high performance fibre-reinforced concrete and passed on some great ideas for
sophisticated ways of presenting data. Andrew Lehan has been a great sounding board and
friend to talk shop with over a couple of pints. Nick Zwerling has been a friend and insightful
Devil’s advocate in the office. Coffee breaks wouldn’t have been the same without David
Johnson.
The myriad formalities and bureaucratic requirements of academic life have all passed relatively
smoothly thanks to the smiling administrative staff of the Civil Engineering Department: Alison
Morley, Shayni Clarke, Colin Anderson, Colleen Kelly, and Nelly Pietropaolo.

iv
Matt Mitrovich, my good friend, provided valuable insight and comforting common sense from a
practicing structural engineer.
Earla and Stuart Smith, my parents, have given me so much. They are always supportive. They
are always loving. I hope I have made them proud.
Throughout the writing of this thesis, Bo Cheyne, my wife, has offered support and insight from
one who has been here before. Her love, encouragement, and strength inspire me to be my best.

v
Table of Contents
Acknowledgments .......................................................................................................................... iii
Table of Contents ............................................................................................................................ v
List of Tables .................................................................................................................................. x
List of Figures ............................................................................................................................... xii
List of Symbols ........................................................................................................................... xvii
List of Appendices ....................................................................................................................... xxi
Chapter 1 Highway Overpasses: Current Practice and an Alternative ........................................... 1
1.1 Current Practice .................................................................................................................. 1
1.2 The Precast Segmental Double-T – An Improved and Constructible Alternative .............. 3
1.3 Thesis Overview ................................................................................................................. 4
Chapter 2 Design Parameters .......................................................................................................... 5
2.1 The Precast Segmental Double-T Base Concept ................................................................ 5
2.2 Material Properties .............................................................................................................. 8
2.3 Construction Sequence and Resulting Load Cases ............................................................. 8
2.4 Design Criteria .................................................................................................................. 10
2.4.1 Serviceability Limit States .................................................................................... 10
2.4.1.1 The No Tension Criterion ....................................................................... 10
2.4.1.2 The Linear Elastic Criterion ................................................................... 10
2.4.2 Ultimate Limit States ............................................................................................ 11
2.5 Conclusions ....................................................................................................................... 11

vi
Chapter 3 Versatility of the Double-T Base Concept for Simply Supported Spans ..................... 12
3.1 Extensions of Previous Work ............................................................................................ 12
3.1.1 Application to a Range of Spans ........................................................................... 12
3.1.2 Variability of Post-tensioning Force ..................................................................... 13
3.1.3 Reduction of Sensitivity to Post-tensioning Force ................................................ 13
3.2 Modifications to the Double-T Base Concept .................................................................. 16
3.3 Validation – Parametric Studies ........................................................................................ 19
3.3.1 Loads and Load Cases .......................................................................................... 19
3.3.1.1 Dead and Superimposed Dead Loads ..................................................... 20
3.3.1.2 Live Loads .............................................................................................. 20
3.3.1.3 Live Load Distribution ........................................................................... 20
3.3.2 Analysis Under Serviceability Limit States .......................................................... 27
3.3.2.1 Bounds for Stage I Tendons ................................................................... 28
3.3.2.2 Bounds for Stage II Tendons .................................................................. 28
3.3.3 Analysis at Ultimate Limit State ........................................................................... 33
3.3.4 Combining Serviceability Limit States and Ultimate Limit States Results .......... 38
3.3.5 Results of Parametric Study .................................................................................. 41
3.3.6 Selection of Section Depths and Midspan Tendon Eccentricities ........................ 46
3.3.7 Preliminary Post-tensioning Anchorage Considerations ...................................... 46
3.3.8 Suggested Post-tensioning Arrangements ............................................................. 47
3.3.9 Post-tensioning Details ......................................................................................... 48
3.3.9.1 Transition from Wide to Thin Webs....................................................... 48
3.3.9.2 Number of Segments .............................................................................. 49
3.3.9.3 End Diaphragm Location........................................................................ 49
3.3.10 Finalised Preliminary Concepts ............................................................................ 50
3.4 Conclusions ....................................................................................................................... 51

vii
Chapter 4 Application of the Precast Segmental Double-T to Multi-span Structures .................. 58
4.1 Motivation to Apply Double-T to Multi-span Structures ................................................. 58
4.1.1 Traditional Solution – Expansion Joints ............................................................... 58
4.2 Simply Supported Spans with Linking Slabs .................................................................... 59
4.2.1 Linking Slabs ........................................................................................................ 59
4.2.1.1 Axial or Flexural Members? ................................................................... 60
4.2.2 Design Criteria ...................................................................................................... 62
4.2.3 Preliminary Design ............................................................................................... 63
4.2.4 Demand | Imposed Rotations ................................................................................ 64
4.2.5 Ultra High-performance Fibre-reinforced Concrete ............................................. 65
4.2.5.1 Cracking Behaviour in Fibre-reinforced Concrete ................................. 66
4.2.5.2 Suitability and Local Use ....................................................................... 67
4.2.6 Maximum strains in University of Toronto Ultra High-performance Fibre-reinforced concrete ................................................................................................ 69
4.2.7 Finalised Preliminary Concepts ............................................................................ 75
4.3 Spans Made Continuous Over Supports ........................................................................... 82
4.3.1 Design Criteria ...................................................................................................... 82
4.3.2 Preliminary Design ............................................................................................... 83
4.3.3 Demand | Imposed Moments ................................................................................ 84
4.3.3.1 Dead and Superimposed Dead Loads ..................................................... 84
4.3.3.2 Live Loads .............................................................................................. 84
4.3.3.3 Temperature Effects ............................................................................... 86
4.3.3.4 Secondary Moment due to Prestress ....................................................... 86
4.3.4 Capacity | Serviceability Limit State .................................................................... 87
4.3.5 Capacity | Ultimate Limit State Analysis .............................................................. 90
viii
4.3.6 Detailed Design ..................................................................................................... 91
4.3.6.1 Diaphragm Location ............................................................................... 91
4.3.7 Losses .................................................................................................................... 93
4.3.7.1 Friction ................................................................................................... 94
4.3.7.2 Anchorage Slip ....................................................................................... 94
4.3.7.3 Creep ....................................................................................................... 95
4.3.7.4 Shrinkage ................................................................................................ 96
4.3.7.5 Relaxation ............................................................................................... 96
4.3.7.6 Total Loss Summary ............................................................................... 96
4.3.8 Finalised Preliminary Concepts ............................................................................ 97
4.4 Conclusions ....................................................................................................................... 98
Chapter 5 Geometry Control during Precasting of Segments ..................................................... 102
5.1 Motivation to Eliminate Match Casting .......................................................................... 102
5.2 Match Casting ................................................................................................................. 103
5.3 Current Precasting Practice ............................................................................................. 103
5.4 Formwork for Segmental Double-T ................................................................................ 104
5.5 Application of Current Tolerances to Segmental Double-T ........................................... 104
5.5.1 First Correction – Global Realignment ............................................................... 106
5.5.2 Second Correction – Measurement and Correction ............................................ 108
5.6 Conclusions ..................................................................................................................... 109
ix
Chapter 6 Comparison of Double-T and Conventional Systems ................................................ 110
6.1 Motivation to Compare these Parameters ....................................................................... 110
6.2 Material Use Efficiency – Double-T Variants Compared to One Another .................... 110
6.3 Material Use and Cost Efficiency – Double-T System Compared to Conventional System ............................................................................................................................. 113
6.3.1 Conventional Bridge Data Collection ................................................................. 113
6.3.2 Material Use Comparison ................................................................................... 113
6.3.3 Cost Comparison ................................................................................................. 116
6.4 Scheduling and Logistics – Double-T Systems Compared to Conventional System ..... 118
6.4.1 Construction Staging for Flexible Linking Slab Alternative .............................. 118
6.4.2 Construction Staging for Continuous Alternative ............................................... 119
6.4.3 Scheduling Comparison ...................................................................................... 119
6.4.3.1 Comparison of Real Continuous and Simply-supported Systems ........ 122
6.4.3.2 Comparison of Simply-supported Systems Built on Falsework and Built on an Erection Girder .................................................................. 122
6.4.4 Logistics Comparison ......................................................................................... 123
6.5 Application of the Double-T System to Overpasses | Safety, Serviceability, and Economy ......................................................................................................................... 124
6.6 Application of the Double-T System to Overpasses | Elegance ..................................... 124
6.7 Adoption of the Double-T System in Ontario ................................................................. 126
6.8 Conclusions ..................................................................................................................... 127
Chapter 7 Conclusions ................................................................................................................ 129
Bibliography ............................................................................................................................... 131
Appendices

x
List of Tables
Table 2.1 – Assumed material properties ....................................................................................... 8
Table 3.1 – Comparison of live loads derived using two methods ............................................... 27
Table 3.2 – Range of bridge variants that satisfy all SLS and ULS criteria ................................. 41
Table 3.3 – Permissible range of variation from nominal post-tensioning force .......................... 42
Table 3.4 – Selected double-T variants for further study ............................................................. 46
Table 3.5 – Feasible and constructible bridge variants ................................................................. 48
Table 3.6 – Location of web width transition ............................................................................... 49
Table 3.7 – Segment divisions ...................................................................................................... 49
Table 4.1 – Rotations imposed on linking slab due to service live loads ..................................... 65
Table 4.2 – University of Toronto ultra high-performance fibre-reinforced concrete composition
(adapted from Habel et al., 2008) ................................................................................................. 68
Table 4.3 – University of Toronto ultra high-performance fibre-reinforced concrete properties
(adapted from Habel et al., 2008) ................................................................................................. 68
Table 4.4 – Flexible linking slab dimensions ............................................................................... 73
Table 4.5 – Selected short elastomeric bearings for two-span system ......................................... 74
Table 4.6 – Selected tall elastomeric bearings for abutments of four-span system ...................... 75
Table 4.7 – Tendon details for continuous configurations ........................................................... 83
Table 4.8 – Reinforcing steel requirements to resist transverse tension in diaphragms ............... 93
Table 4.9 – Tendons stresses after all losses | σp,final as a fraction of fpu, (with an assumed jacking
stress of 0.800fpu) .......................................................................................................................... 97

xi
Table 5.1 – Total horizontal misalignment of single span due to compounding geometry error 106
Table 5.2 – Total vertical misalignment of single span due to compounding geometry error ... 106
Table 5.3 – Alignment errors after segment placement .............................................................. 107
Table 5.4 – Alignment errors after segment placement with compensatory adjustments .......... 109
Table 6.1 – Segmental double-T mock unit costs (adapted from Li, 2010) ............................... 116
Table 6.2 – Construction schedules for various alternative methods | two 40-m spans ............. 120
Table 6.3 – Construction schedules for various alternative methods | four 40-m spans ............. 120
Table 6.4 – Overall comparison of construction methods .......................................................... 121
Table 6.5 – Comparison of construction schedules between continuous and simply-supported
double-T options ......................................................................................................................... 122
Table 6.6 – Comparison of construction schedules between simply-supported double-T
constructed on falsework and constructed on erection girder ..................................................... 123
Table 6.7 – Comparison of construction schedules between precast segmental double-T and
conventional precast girder with cast-in-place deck slab ........................................................... 123

xii
List of Figures
Figure 1.1 – Example of a typical overpass structure in Ontario (Iroquois Cranberry Marsh Road
Bridge over Highway 400, Ontario, taken by P. Gauvreau) ........................................................... 1
Figure 1.2 – Transverse live load sharing in (a) a slab-on-girder system with (b) infinitely
flexible deck slab and (c) infinitely stiff deck slab ......................................................................... 2
Figure 1.3 – The double-T base concept | 1:500 (adapted from Li, 2010) .................................... 4
Figure 2.1 – The double-T base concept | 1:500 (adapted from Li, 2010) .................................... 6
Figure 2.2 – External tendon layout in plan | 1:200 ........................................................................ 6
Figure 2.3 – Assumed material stress-strain relationships for (a) concrete, (b) reinforcing steel,
and (c) post-tensioning steel ........................................................................................................... 8
Figure 3.1 – Limits on post-tensioning force and the areas that dictate them .............................. 14
Figure 3.2 – Concrete stress sensitivity to level of prestress for double-T base concept (adapted
from Li, 2010) ............................................................................................................................... 15
Figure 3.3 – Parameters changed to create bridge variants for parametric study ......................... 17
Figure 3.4 – Seventy-three bridge variants for parametric study .................................................. 18
Figure 3.5 – Transformation of (a) asymmetric load into (b) pure symmetric and (c) pure
antisymmetric components ........................................................................................................... 21
Figure 3.6 – Dimensions used to calculate the torsional constant ................................................ 22
Figure 3.7 – Parameters used to calculate the twist due to warping ............................................. 23
Figure 3.8 – Live loads used in analysis for parametric study ...................................................... 26
Figure 3.9 – Explanatory Plot – amounts of post-tensioning satisfying serviceability limit state
criteria for a 36.6-m span .............................................................................................................. 30

xiii
Figure 3.10 – Amounts of post-tensioning satisfying serviceability limit state criteria for 2000-
mm-deep spans of (a) 20 m, (b) 25 m, (c) 30 m, (d) 36.6 m, (e) 40 m, and (f) 45 m ................... 31
Figure 3.11 – Amounts of post-tensioning satisfying serviceability limit state criteria for
(respectively) section depths and spans of (a) 1095 mm, 20 m; (b) 1365 mm, 25 m; (c) 1640 mm,
30 m; (d) 2000 mm, 36.6 m (duplicate of Figure 3.10d); (e) 2185 mm, 40 m; (f) 2460 mm, 45 m
....................................................................................................................................................... 32
Figure 3.12 – Bilinear concrete stress-strain curve for 70-MPa concrete (adapted from CEB-FIB,
2010) ............................................................................................................................................. 33
Figure 3.13 – Equivalent loading after tendon removal ............................................................... 34
Figure 3.14 – Strain and stress profiles for (a) cracking moment, (b) ‘linear elastic’ moment, and
(c) ultimate moment ...................................................................................................................... 34
Figure 3.15 – (a) Dead, superimposed dead, live, and prestress loads and (b) resulting schematic
bending moment diagram ............................................................................................................. 35
Figure 3.16 – Scaled bending moment diagram ........................................................................... 35
Figure 3.17 – (a) Significant points on bending moment diagram and (b) corresponding concrete
strains at level of prestress ............................................................................................................ 35
Figure 3.18 – Elongation of tendon due to deformation ............................................................... 36
Figure 3.19 – Elongation of tendon due to force .......................................................................... 36
Figure 3.20 – Elongation of tendon due to deformation plotted with elongation due to force when
tendons are assumed to yield and actually (a) do yield or (b) do not yield .................................. 36
Figure 3.21 – (a) Result of second iteration and (b) interpolation of actual stress in tendon ....... 37
Figure 3.22 – Amounts of post-tensioning satisfying both serviceability and ultimate limit state
criteria for 2000-mm-deep spans of (a) 20 m, (b) 25 m, (c) 30 m, (d) 36.6 m, (e) 40 m, and (f) 45
m ................................................................................................................................................... 39

xiv
Figure 3.23 – Amounts of post-tensioning satisfying both serviceability and ultimate limit state
criteria for (respectively) section depths and spans of (a) 1095 mm, 20 m; (b) 1365 mm, 25 m;
(c) 1640 mm, 30 m; (d) 2000 mm, 36.6 m (duplicate of Figure 3.22d); (e) 2185 mm, 40 m; (f)
2460 mm, 45 m ............................................................................................................................. 40
Figure 3.24 – Amounts of post-tensioning satisfying both serviceability and ultimate limit state
criteria for varying span lengths for 2000-mm-deep sections with a midspan tendon eccentricity
of (a) 1000 mm, (b) 1075 mm, (c) 1150 mm, (d) 1225 mm, (e) 1300 mm, and (f) 1367 mm ..... 45
Figure 3.25 – Anchorage spiral footprints for required number of strands for spans of: (a) 20 m,
(b) 25 m, (c) 30 m, (d) 36.6 m, and (e) 40 m and 45 m | 1:100 .................................................... 47
Figure 3.26 – Determination of location of web width transition ................................................. 48
Figure 3.27 – Design considerations for end diaphragm placement | 1:100 ................................. 50
Figure 3.28 – Conceptual design of precast segmental double-T for 20-m spans ........................ 52
Figure 3.29 – Conceptual design of precast segmental double-T for 25-m spans ........................ 53
Figure 3.30 – Conceptual design of precast segmental double-T for 30-m spans ........................ 54
Figure 3.31 – Conceptual design of precast segmental double-T for 36.6-m spans ..................... 55
Figure 3.32 – Conceptual design of precast segmental double-T for 40-m spans ........................ 56
Figure 3.33 – Conceptual design of precast segmental double-T for 45-m spans ........................ 57
Figure 4.1 – Effect of support conditions on linking slab behaviour with (a) two roller supports,
(b) two pin/hinge supports, and (c) one of each type of support (adapted from Okeil and ElSafty,
2005) ............................................................................................................................................. 61
Figure 4.2 – Effect of distance between neutral axes on linking slab behaviour with (a) lower
neutral axis and (b) higher neutral axis (adapted from Okeil and ElSafty, 2005) ........................ 62
Figure 4.3 – Parameters to be designed for linking slab ............................................................... 64

xv
Figure 4.4 – (a) Strain hardening and (b) strain softening fibre-reinforced concrete stress-strain
relationships (adapted from Habel, 2004) ..................................................................................... 67
Figure 4.5 – Schematic of test setup for University of Toronto UHPFRC beam modulus of
rupture tests ................................................................................................................................... 69
Figure 4.6 – Results of University of Toronto UHPFRC beam modulus of rupture tests ............ 70
Figure 4.7 – Assumed strains in extreme tensile fibres of University of Toronto UHPFRC beams
....................................................................................................................................................... 71
Figure 4.8 – Maximum extreme fibre strains in University of Toronto UHPFRC beam modulus
of rupture tests ............................................................................................................................... 72
Figure 4.9 – Maximum tensile strains in flexible linking slabs as a function of (a) length, with
constant thickness of 100 mm, and (b) thickness, with constant length of 400 mm .................... 73
Figure 4.10 – Configurations of flexible linking slabs and bearings for (a) two- and (b) four-span
bridges ........................................................................................................................................... 74
Figure 4.11 – Conceptual design of flexible linking slab for adjacent 20-m spans ...................... 76
Figure 4.12 – Conceptual design of flexible linking slab for adjacent 25-m spans ...................... 77
Figure 4.13 – Conceptual design of flexible linking slab for adjacent 30-m spans ...................... 78
Figure 4.14 – Conceptual design of flexible linking slab for adjacent 36.6-m spans ................... 79
Figure 4.15 – Conceptual design of flexible linking slab for adjacent 40-m spans ...................... 80
Figure 4.16 – Conceptual design of flexible linking slab for adjacent 45-m spans ...................... 81
Figure 4.17 – Continuous double-T pier segment ........................................................................ 83
Figure 4.18 – Temperature differentials and resulting imposed moments in continuous system . 86
Figure 4.19 – Positive moment serviceability limit state analysis for two 45-m spans ................ 88
Figure 4.20 – Negative moment serviceability limit state analysis for two 45-m spans .............. 89
xvi
Figure 4.21 – Truss models for alternative layouts for diaphragm with (a) bearings under webs,
(b) bearings inclined inward, and (c) bearings shifted inward ...................................................... 92
Figure 4.22 – Proposed diaphragm design | 1:100 ........................................................................ 93
Figure 4.23 – Conceptual design of continuous configuration for adjacent 20-m spans .............. 99
Figure 4.24 – Conceptual design of continuous configuration for adjacent 36.6-m spans ......... 100
Figure 4.25 – Conceptual design of continuous configuration for adjacent 45-m spans ............ 101
Figure 5.1 – Match casting (adapted from Interactive Design Systems, 2005) .......................... 103
Figure 5.2 – Exaggerated alignment effect of differences in vertex length for a bridge segment
..................................................................................................................................................... 105
Figure 5.3 – Alignment error after segment placement .............................................................. 107
Figure 6.1 – Effective depth versus span length of double-T bridges ........................................ 111
Figure 6.2 – Post-tensioning use versus span length of double-T bridges .................................. 112
Figure 6.3 – Span-to-depth ratio versus span length of double-T and conventional bridges ..... 114
Figure 6.4 – Effective depth versus span length of double-T and conventional bridges ............ 115
Figure 6.5 – Post-tensioning use versus span length of double-T and conventional bridges ..... 115
Figure 6.6 – Unit cost of bridge superstructure versus span length of double-T and conventional
bridges ......................................................................................................................................... 117
Figure 6.7 – Visual comparison of (a) continuous, (b) simply-supported segmental double-T, and
(c) conventional options .............................................................................................................. 125
Figure 6.8 – Visual comparison of (a) double-T and (b) conventional precast girder options ... 128

xvii
List of Symbols
α angle of deviation of tendon
γc density of concrete in kg/m3
ΔH displacement of top of deck over a hinge or pin support
ΔLp elongation of post-tensioning tendons
ΔLpd elongation of post-tensioning tendons due to global deformation of structure
ΔLpf elongation of post-tensioning tendons due to change in force in tendon
ΔR displacement of top of deck over a roller support
εav average strain in the extreme tensile layer of concrete
εbot strain in the extreme bottom layer of concrete
εcp strain in the concrete at the height of the prestressing steel
εcp,cr strain in the concrete at the height of the prestressing steel at a section at the cracking moment
εcp,le strain in the concrete at the height of the prestressing steel at a section at the maximum moment resulting from a stress profile entirely within the linear elastic portion of a bilinear stress-strain relationship
εcp,r strain in the concrete at the height of the prestressing steel at a section at the maximum moment
εcr strain in the concrete at the extreme compressive fibre at a section at the cracking moment
εle strain in the concrete at the extreme compressive fibre at a section at the maximum moment resulting from a stress profile entirely within the linear elastic portion of a bilinear stress-strain relationship
εmax maximum strain in the extreme tensile layer of concrete
εr strain in the concrete at the extreme compressive fibre at a section at the maximum moment
θ angle of twist
θSV angle of twist due to St. Venant torsion
θW angle of twist due to warping torsion

xviii
μ coefficient of friction between post-tensioning tendons and ducts
σbot,mid stress in the extreme bottom layer of concrete at midspan
σp stress in post-tensioning tendons
σp1 initial assumed value of stress in post-tensioning tendons for ultimate limit state analysis
σp2 second assumed value of stress in post-tensioning tendons for ultimate limit state analysis
σp3 final assumed value of stress in post-tensioning tendons for ultimate limit state analysis
σp,final stress in post-tensioning tendons after all losses
σtop,dev stress in extreme top layer of concrete at the location of the deviators
an height from neutral axis of full section to mid-height of deck slab
b width of deck slab
b0 distance between webs, centre to centre
bw width of web
CR prestress losses due to creep
CGS centre of gravity of prestressing steel
df diameter of fibre
DL dead load
e transverse eccentricity of applied load
E modulus of elasticity
etendon,mid tendon eccentricity at midspan
Ec modulus of elasticity of concrete
Ep modulus of elasticity of prestressing steel
Es modulus of elasticity of passive reinforcing steel
f΄c compressive strength of concrete

xix
fcds stress in concrete at the centre of gravity of the tendons at sections of maximum moment due to the sum of the effects of prestressing, the self-weight of the member, and subsequently added loads, at the time of transfer of forces to the concrete
fcir stress in concrete at the centre of gravity of the tendons at sections of maximum moment due to the sum of the effects of prestressing and the self-weight of the member at the time of transfer of forces to the concrete
fcr tensile cracking strength of concrete
fpu ultimate strength of prestressing steel
fpy yield strength of prestressing steel, equal to 0.9fpu
fsj stress in post-tensioning tendons at the time of jacking
fst stress in post-tensioning tendons at the time of transfer
fy yield strength of passive reinforcing steel
Fm amplification factor applied to transversely eccentric loads to account for increased effects on one web
FR prestress losses due to friction
G shear modulus
h0 height to mid-height of deck deck slab
Ic moment of inertia of concrete section
In moment of inertia of one web
J polar moment of inertia
k ratio of St. Venant torsion to warping torsion at a transverse section
K torsional constant
Kcr factor for calculating prestress loss due to creep of concrete
lf length of fibre
L span length
LL live load
Mcr cracking moment of concrete section
Mle maximum moment resulting from a stress profile entirely within the linear elastic portion of a bilinear stress-strain relationship

xx
Mmax maximum imposed moment on a structure
Mr ultimate moment resistance of concrete section
MSD,mid moment due to superimposed dead load at midspan
Ns number of segments
P force in post-tensioning tendons
P128 days force in Stage 1 tendons 28 days after jacking
P1f force in Stage 1 tendons after all losses
P1j force in Stage 1 tendons at the time of jacking
P2f force in Stage 2 tendons after all losses
P2j force in Stage 2 tendons at the time of jacking
Q symmetric component of transversely eccentric load
QW antisymmetric component of transversely eccentric load
REL2 prestress losses due to relaxation of strands after transfer of forces to the concrete
RH relative humidity
SDL superimposed dead load
SH prestress losses due to shrinkage
t0 thickness of deck slab
T total transverse torsion in structure
TSV transverse St. Venant torsion in structure
TW transverse warping torsion in structure
vi length of vertex of segment i
wv deflection of one web due to transversely eccentric load

xxi
List of Appendices
Appendix A – Live Load Sharing and Grillage Models
Appendix B – Parametric Study
Appendix C – Flexible Linking Slabs
Appendix D – Continuous Configuration Design
Appendix E – Geometry Control Calculations
Appendix F – Existing Bridge Comparison
Appendix G – Schedule Comparison

1
Chapter 1 Highway Overpasses: Current Practice and an Alternative
1.1 Current Practice
In Ontario, as in many other Canadian provinces and American states, typical short-span
highway overpasses are constructed by erecting precast, pretensioned concrete I-girders and
pouring a cast-in-place concrete deck slab on top. The deck slab is made composite with the
girders once it cures. This type of bridge can be a single- or multi-span structure, with spans
ranging from around 20 to 45 m. A typical example of such a bridge is shown in Figure 1.1
below.
Figure 1.1 – Example of a typical overpass structure in Ontario (Iroquois Cranberry
Marsh Road Bridge over Highway 400, Ontario, taken by P. Gauvreau)

Chapter 1 Highway Overpasses: Current Practice and an Alternative
2
Despite its ubiquity, this widely used structural system has several shortcomings.
First, it makes relatively inefficient use of concrete because it does not take full advantage of
load sharing between girders. This is because this system is relatively flexible in the transverse
direction. The results of this property are illustrated in Figure 1.2, in which (a) a load is applied
with a transverse eccentricity to a bridge cross-section and the resulting deformation is shown for
(b) an infinitely stiff (rigid) and (c) an infinitely flexible deck slab. In the case of a rigid deck
slab, loads are distributed to every girder transversely. In the case of an infinitely flexible deck
slab, no sharing of load occurs and a girder must resist the entirety of a load applied directly
above it. The current system of cast-in-place deck slabs on precast girders acts somewhere
between the infinitely flexible deck slab model shown in Figure 1.2c and its opposite shown in
Figure 1.2b. To compensate for the transverse flexibility of the deck slab, girders are spaced
relatively close together in conventional design, i.e., about 2 to 3 m centre-to-centre, resulting in
the use of a large amount of concrete in the superstructure cross-section compared to alternatives
as discussed in the following section.
(a) (b) (c)
Figure 1.2 – Transverse live load sharing in (a) a slab-on-girder system with (b) infinitely
flexible deck slab and (c) infinitely stiff deck slab
A second shortcoming associated with the current system results from the fact that the concrete
deck slab is cast-in-place. The pouring of concrete components onsite for bridges is a major
contributor to the overall time they take to construct and open to traffic. For conventional
bridges, forming, placing of steel, tying of steel, curing, and stripping of the concrete deck slab
take up a considerable portion of the overall schedule.
A third, related, shortcoming is the potential for concrete quality problems due to the variable
quality of cast-in-place concrete. This variability can lead to regions of concrete in the deck slab
with relatively high permeability. Once cracks form in the deck slab, the penetrability of these
areas increases greatly. This facilitates the penetration of water and dissolved deicing chemicals
which can accelerate the deterioration of reinforcing steel within the deck slab and necessitate

Chapter 1 Highway Overpasses: Current Practice and an Alternative
3
multiple repairs within the design life of the structure. It is accepted policy that the bridge deck
slab will require replacement 30 to 40 years after it is constructed. This increases the life-cycle
cost of the bridge and can be very expensive when bridge user costs are considered.
A fourth shortcoming is that the deck slab and girders of this system shrink at different rates
because they are comprised of concretes of two different types and ages. The girders shrink less
than the deck slab and so they restrain it continuously in the longitudinal direction. This
restrained deformation leads to transverse cracking of the deck slab, often full-depth (Newhouse,
2005).
An alternative system that addresses the deficiencies listed above would be of significant benefit
to bridge owners across North America, most of which are publicly funded. Cast-in-place slab
on girder bridges comprise 41 % of all bridges in the United States (extrapolated from FHWA,
2010). Because so many highway overpass structures are constructed in North America every
year, the benefits of any improvement to durability or structural efficiency gained through the
design and construction of an alternative structural system would multiply significantly.
1.2 The Precast Segmental Double-T – An Improved and Constructible Alternative
The precast segmental double-T concept with external, unbonded post-tensioning presented by
Li (2010) is a good alternative to the conventional system. The general arrangement of this
bridge is shown in Figure 1.3 below. Li (2010) demonstrated that loads in this system are shared
efficiently between the two webs and designed the system with a concrete cross-sectional area of
4.74 m2. This is less than a comparable bridge designed using the conventional multiple girder
system, which had a concrete cross-sectional area of 6.49 m2. Furthermore, the system can be
constructed more quickly than a conventional bridge because its deck slab is monolithically
precast with the rest of the cross-section and does not need to cure onsite. It is also more durable
than a conventional deck slab because it is transversely post-tensioned and composed of precast
concrete, which is more consistently of high quality than cast-in-place concrete.
This thesis builds in several directions upon the work conducted by Li (2010) and provides a
body of knowledge necessary to facilitate the adoption of this system by designers by addressing

Chapter 1 Highway Overpasses: Current Practice and an Alternative
4
five associated key issues: (1) it validates Li’s design for a range of span lengths used in highway
overpasses, (2) it demonstrates that it is possible to reduce the system’s sensitivity to post-
tensioning losses, (3) it presents designs using the precast segmental double-T system for multi-
span bridges without the use of expansion joints, (4) it shows that the onerous technical
requirements of conventional match casting can be relaxed for short spans built using this
method, and (5) it shows that the system is competitive with conventional systems by comparing
material use, cost, scheduling, and aesthetic criteria.
Figure 1.3 – The double-T base concept | 1:500 (adapted from Li, 2010)
1.3 Thesis Overview
The chapters of this thesis present work which reinforces the arguments made above and address
the five issues already mentioned. Chapter 2 describes the base concept developed by Li (2010)
and presents the design criteria and material properties used in subsequent analysis. Chapter 3
presents the results of a parametric study in which the viability of the base concept presented in
Chapter 2 was checked for spans of 20 to 45 m and also discusses a way to reduce the original
system’s sensitivity to post-tensioning losses. Chapter 4 describes and analyses various options
for converting the double-T concepts validated in Chapter 3 into multi-span systems. Chapter 5
demonstrates how match casting is not necessary for the construction of the segmental double-T
when used for typical overpasses. Chapter 6 discusses a study of existing conventional short-
span bridges and a comparison of them to the double-T concepts designed in Chapter 3. Chapter
7 presents the conclusions of this thesis.
ELEVATION
TENDONS
TENDONANCHORAGES
TENDONANCHORAGES
TENDONS
TENDONS
CROSS-SECTIONAT MIDSPAN
PLAN
CDEVIATION
LCSUPPORT
L CMIDSPAN
L CDEVIATION
L CSUPPORT
L
C WEBL
C WEBL
C BRIDGEL
11300 14000 1130036600
138007900
2000
2950 2950

5
Chapter 2 Design Parameters
This chapter provides a brief summary of the precast segmental double-T with external,
unbonded tendons designed by Li (2010). Throughout this thesis, this 36.6-m-long, 2000-mm-
deep bridge will be referred to as the base concept following the convention laid out by Li
(2010). This chapter describes the original double-T design of Li (2010) and presents the
material properties, load cases, and design criteria used in that design. These parameters are
used in all subsequent design through the rest of this thesis, except where noted.
2.1 The Precast Segmental Double-T Base Concept
The precast segmental double-T designed in Li (2010) previously shown in Chapter 1 is repeated
below as Figure 2.1. This bridge is 36.6 m long, with a constant depth of 2000 mm, for a span-
to-depth ratio of 18.3:1. Each segment of 13.8-m-wide deck is precast monolithically with the
webs as part of the whole cross-section and carries three 3600-mm-wide traffic lanes, two 1200-
mm-wide shoulders, and barrier walls on either side. Match casting is used in the precasting.
The bridge is longitudinally post-tensioned using six tendons containing a total of 156 strands. It
is transversely post-tensioned with tendons of four strands each, spaced at 933 mm
longitudinally. All strands used have a diameter of 15 mm.
Chapter 2 Design Parameters
6
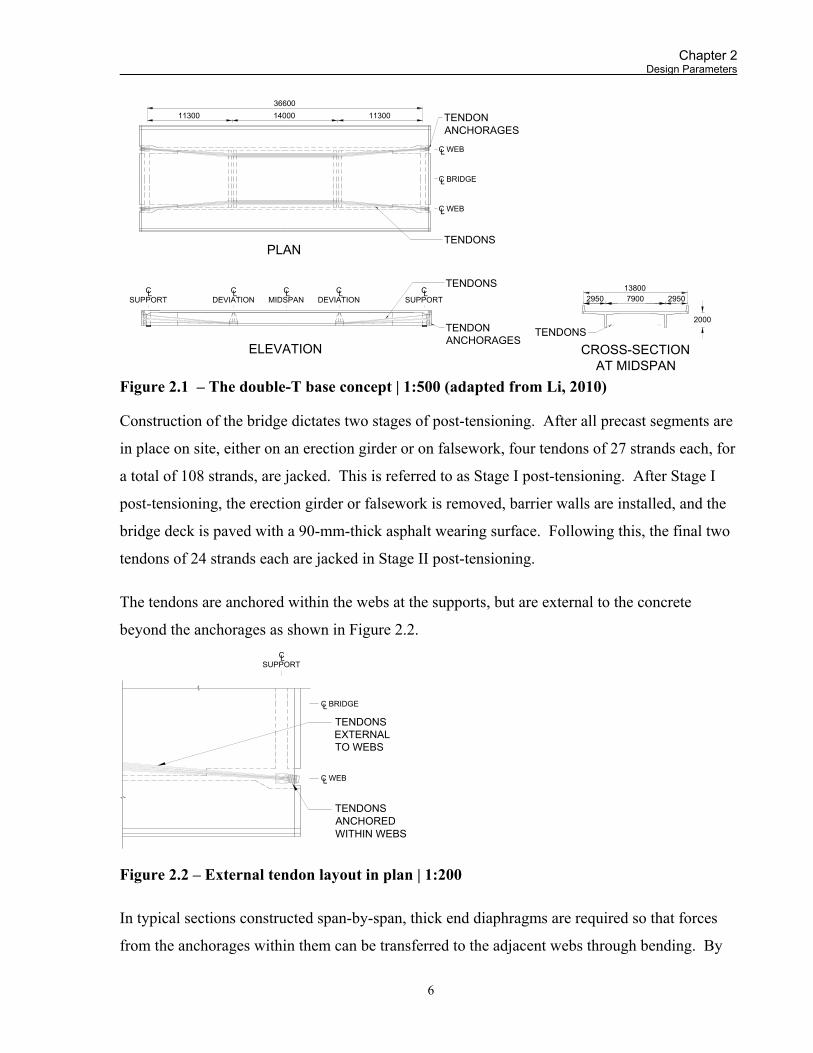
Figure 2.1 – The double-T base concept | 1:500 (adapted from Li, 2010)
Construction of the bridge dictates two stages of post-tensioning. After all precast segments are
in place on site, either on an erection girder or on falsework, four tendons of 27 strands each, for
a total of 108 strands, are jacked. This is referred to as Stage I post-tensioning. After Stage I
post-tensioning, the erection girder or falsework is removed, barrier walls are installed, and the
bridge deck is paved with a 90-mm-thick asphalt wearing surface. Following this, the final two
tendons of 24 strands each are jacked in Stage II post-tensioning.
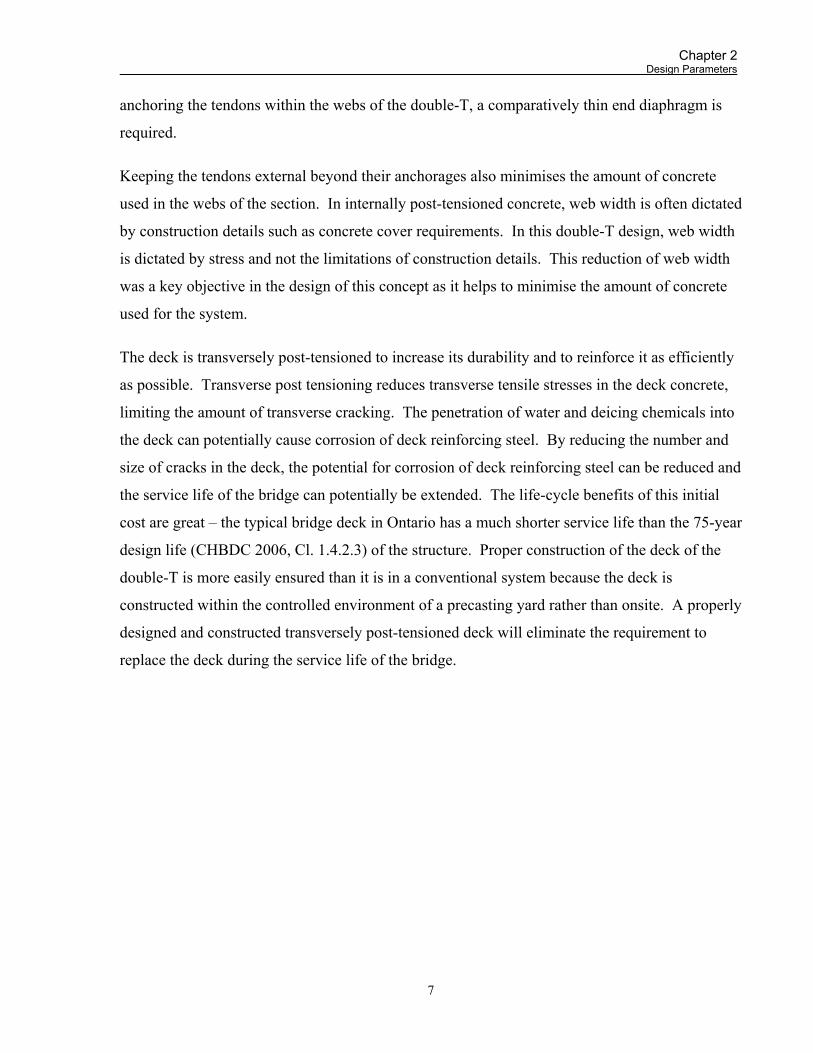
The tendons are anchored within the webs at the supports, but are external to the concrete
beyond the anchorages as shown in Figure 2.2.
Figure 2.2 – External tendon layout in plan | 1:200
In typical sections constructed span-by-span, thick end diaphragms are required so that forces
from the anchorages within them can be transferred to the adjacent webs through bending. By
ELEVATION
TENDONS
TENDONANCHORAGES
TENDONANCHORAGES
TENDONS
TENDONS
CROSS-SECTIONAT MIDSPAN
PLAN
CDEVIATION
LCSUPPORT
L CMIDSPAN
L CDEVIATION
L CSUPPORT
L
C WEBL
C WEBL
C BRIDGEL
11300 14000 1130036600
138007900
2000
2950 2950
C WEBL
C BRIDGEL
CSUPPORT
L
TENDONSANCHOREDWITHIN WEBS
TENDONSEXTERNALTO WEBS
Chapter 2 Design Parameters
7
anchoring the tendons within the webs of the double-T, a comparatively thin end diaphragm is
required.
Keeping the tendons external beyond their anchorages also minimises the amount of concrete
used in the webs of the section. In internally post-tensioned concrete, web width is often dictated
by construction details such as concrete cover requirements. In this double-T design, web width
is dictated by stress and not the limitations of construction details. This reduction of web width
was a key objective in the design of this concept as it helps to minimise the amount of concrete
used for the system.
The deck is transversely post-tensioned to increase its durability and to reinforce it as efficiently
as possible. Transverse post tensioning reduces transverse tensile stresses in the deck concrete,
limiting the amount of transverse cracking. The penetration of water and deicing chemicals into
the deck can potentially cause corrosion of deck reinforcing steel. By reducing the number and
size of cracks in the deck, the potential for corrosion of deck reinforcing steel can be reduced and
the service life of the bridge can potentially be extended. The life-cycle benefits of this initial
cost are great – the typical bridge deck in Ontario has a much shorter service life than the 75-year
design life (CHBDC 2006, Cl. 1.4.2.3) of the structure. Proper construction of the deck of the
double-T is more easily ensured than it is in a conventional system because the deck is
constructed within the controlled environment of a precasting yard rather than onsite. A properly
designed and constructed transversely post-tensioned deck will eliminate the requirement to
replace the deck during the service life of the bridge.

Chapter 2 Design Parameters
8
2.2 Material Properties
The following properties were assumed for all design and analysis in this thesis and are identical
to those assumed in Li (2010).
Table 2.1 – Assumed material properties
Material Strength Modulus of Elasticity
Concrete Specified Compressive Strength, f΄c = 70 MPa
Tensile Strength, 0.4 = 3.35 MPa 6900 /2300 .
= 36 250 MPa
Reinforcing Steel Yield Strength, fy = 400 MPa Es = 200 000 MPa
Post-tensioning Tendons
Specified Tensile Strength, fpu = 1860 MPa Yield Strength (design value), fpy = 0.90fpu = 1674 MPa
Ep = 200 000 MPa
More specifically, the following idealised stress-strain relationships were assumed for all design
and analysis in this thesis, again identical to those found in Li (2010). Exceptions to this are the
properties of fibre-reinforced concretes described in Section 4.2.5.
(a) (b) (c)
Figure 2.3 – Assumed material stress-strain relationships for (a) concrete, (b) reinforcing
steel, and (c) post-tensioning steel
2.3 Construction Sequence and Resulting Load Cases
Post-tensioning tendons are stressed in a staged manner for the double-T base concept proposed
by Li (2010 because it is such a lightweight structure. This staging prevents unstable failure of
the system in negative flexure and minimises the duration over which temporary support, in the
form of either falsework or an erection girder, is required. This minimisation is accomplished
by stressing enough tendons to enable the structure to support itself and construction loads as
soon as possible during construction. The following general stages of construction occur onsite:
stress
f'c
ε'c strain
1Ec
0.6f'c
εsy εpy
stress
strain
stress
strain
fy
1Es
1Es
f = 0.9fpy pu

Chapter 2 Design Parameters
9
(1) Temporary supports (falsework or an erection girder) are constructed,
(2) Concrete segments cast offsite are placed sequentially on the temporary support,
(3) All post-tensioning tendons are inserted in ducts,
(4) Stage I tendons are jacked,
(5) Temporary supports are removed,
(6) Barrier walls are installed on the deck,
(7) A wearing surface is placed on the deck, and
(8) Stage II tendons are jacked.
Were it possible in a particular situation to leave the temporary support in place for the duration
of construction, then step (4) could be omitted and all tendons could be stressed at the end of
construction in step (8). In the construction of highway overpasses, however, this luxury is
rarely available and two stages of stressing are usually required. This shortcut would also
require that temporary supports be made strong enough to support the superimposed dead loads
of a wearing surface and barrier walls. The two stages dictate that post-tensioning tendons be
proportioned such that (a) the prestressing force induced by the Stage II tendons is great enough
to resist positive bending induced by loads on the structure and (b) the prestressing force induced
by the Stage I tendons is small enough that the section does not fail by hogging upward unstably
(a “pop up” failure).
The staging described above dictates that the structure be analysed for four load cases. The load
cases, originally summarised in Li (2010), are as follows:
“After Stage I” – After Stage I tendons are jacked and the falsework supporting the
superstructure is removed. In this case, the dead load of the precast segments and the initial
jacking force of the Stage I tendons (DL + P1j) are applied to the structure.
“After Barriers and Wearing Surface” – After barriers and wearing surface have been added.
At this point, the Stage I tendons have undergone some losses. In this case, the dead load of
the precast segments, the superimposed dead load of the barriers and the wearing surface, and
the prestressing force of the Stage I tendons after 28 days of losses (DL + SDL + P128 days)
are applied to the structure.

Chapter 2 Design Parameters
10
“After Stage II” – After Stage II tendons are jacked. In this case, the initial jacking force of
the Stage II tendons in addition to all loads applied during load case “After Barriers and
Wearing Surface” (DL + SDL + P128 days + P2j) are applied to the structure.
“Service Life” – During the service life of the bridge, after the tendons have undergone all
losses. In this case, in addition to live load, the dead load of the precast segments, the
superimposed dead load of the barriers and the wearing surface, and the prestressing force of
all tendons after all losses (DL + SDL + P1f + P2f + LL) are applied to the structure.
2.4 Design Criteria
2.4.1 Serviceability Limit States
There are two major criteria considered at serviceability limit states for analysis of the segmental
double-T base concept.
2.4.1.1 The No Tension Criterion
All bridge concepts considered in this thesis are precast segmental and have no bonded steel
across any joints. To ensure that segment separation is avoided, no longitudinal tensile stresses
are permitted in the concrete. This criterion adheres to the limitation given in Clause 8.8.4.6(b)
of the CHBDC (2006). This criterion is only applied to the concrete in the longitudinal direction.
Transversely, the concrete is permitted to go into tension but is limited to stresses below its
cracking strength of 3.35 MPa.
2.4.1.2 The Linear Elastic Criterion
In all sectional analysis conducted under serviceability limit state conditions, concrete has been
assumed to be linear elastic. To ensure that this assumption remains valid, concrete compressive
stresses have been limited to 0.6f΄c = 42 MPa. This assumption has been made not only during
construction and transfer, as specified in Cl. 8.8.4.6(a)(i) of the CHBDC (2006), but also during
the entire service life of the structure. In conventional concrete bridge systems, concrete stresses
usually remain well below this limit under service conditions and so this check is not considered
in their analysis. In the design of the double-T, however, an attempt has been made to use the

Chapter 2 Design Parameters
11
concrete as efficiently as possible and so higher compressive stresses are to be expected and this
additional check is thus prudent.
2.4.2 Ultimate Limit States
The double-T system has failed at ultimate limit states once any concrete reaches its crushing
strain.
2.5 Conclusions
This chapter has described the double-T base concept and described the parameters to be used in
the designs and discussion that follow in subsequent chapters, beginning in Chapter 3 with a
validation of the versatility of the double-T base concept.

12
Chapter 3 Versatility of the Double-T Base Concept for
Simply Supported Spans
3.1 Extensions of Previous Work
This chapter presents an extension of previous work conducted by Li (2010) on the base concept
of the segmental double-T with external, unbonded post-tensioning and addresses two related
issues. Li’s design concept was for a single span length and was not applied to other span
lengths. Li also noted that her concept was sensitive to the amount of post-tensioning losses.
This chapter addresses these two limitations of the original design.
3.1.1 Application to a Range of Spans
Li (2010) presented a design for the double-T base concept that was both thorough and sound.
This design was for a 36.6-m (120-ft) span only, though, and no additional concepts were
presented for longer or shorter spans. Since this span lies somewhere in the middle of the
common range of short spans (20 to 45 m) for highway overpass structures, the double-T base
concept may be a viable option for this type of bridge. Subsequent sections of this chapter
present an investigation into the feasibility of similar segmental double-T bridges of varying
lengths to verify this hypothesis.
Chapter 3 Versatility of the Double-T Base Concept for Simply Supported Spans
13
3.1.2 Variability of Post-tensioning Force
The amount of force in post-tensioning tendons in service is never as great as the force used to
stress the tendons and decreases over the age of a structure. This difference in force is due to
many phenomena, all of which are generally called post-tensioning losses. These losses can
occur directly after stressing of tendons through phenomena such as anchor set and friction
between the tendons and the duct, or during the service of the tendons through phenomena such
as creep, shrinkage, and relaxation. For the double-T bridges with external, unbonded tendons
considered in this thesis, time dependent phenomena such as creep and shrinkage can be
controlled to a degree by proper curing technique and limits on when stressing occurs, e.g., Stage
I tendons should be stressed no earlier than 28 days after casting. Even with such controls,
however, some variability exists in how shrinkage and creep affect post-tensioning losses. Also,
the double-T base concept bridge is not monolithically poured as one piece. It is segmentally
cast in 14 different pours. Casting conditions affecting creep and shrinkage can vary between
segments, and of course, not all segments will be the same age at the time of tendon stressing, so
there will be some variability in material properties between segments.
This variability means that designers can make predictions about post-tensioning losses given
existing models, but they cannot know with certainty what the final stress in post-tensioning
tendons will be in a given structure after all losses have occurred. To deal with this uncertainty,
designers typically calculate a nominal tendon stress after all losses based on existing models and
design using that value. For certain applications, variations of actual tendons stress above or
below the nominal tendon stress can have adverse impacts and upper and lower limits on tendon
stress exist beyond which a given design is no longer valid. Primarily because it is such a
lightweight structure, the segmental double-T with external, unbonded tendons is such a system
and for the base concept described by Li (2010), the lower and upper limits on tendon stress are
close to one another, making the system sensitive to the amount of post-tensioning losses it
experiences. Details on these limits and this sensitivity are presented in the following section.
3.1.3 Reduction of Sensitivity to Post-tensioning Force
Li notes that a significant limitation to the double-T base concept is that the upper and lower
limits on tendon stress are quite close to one another and so the design is sensitive to the amount
Chapter 3 Versatility of the Double-T Base Concept for Simply Supported Spans
14
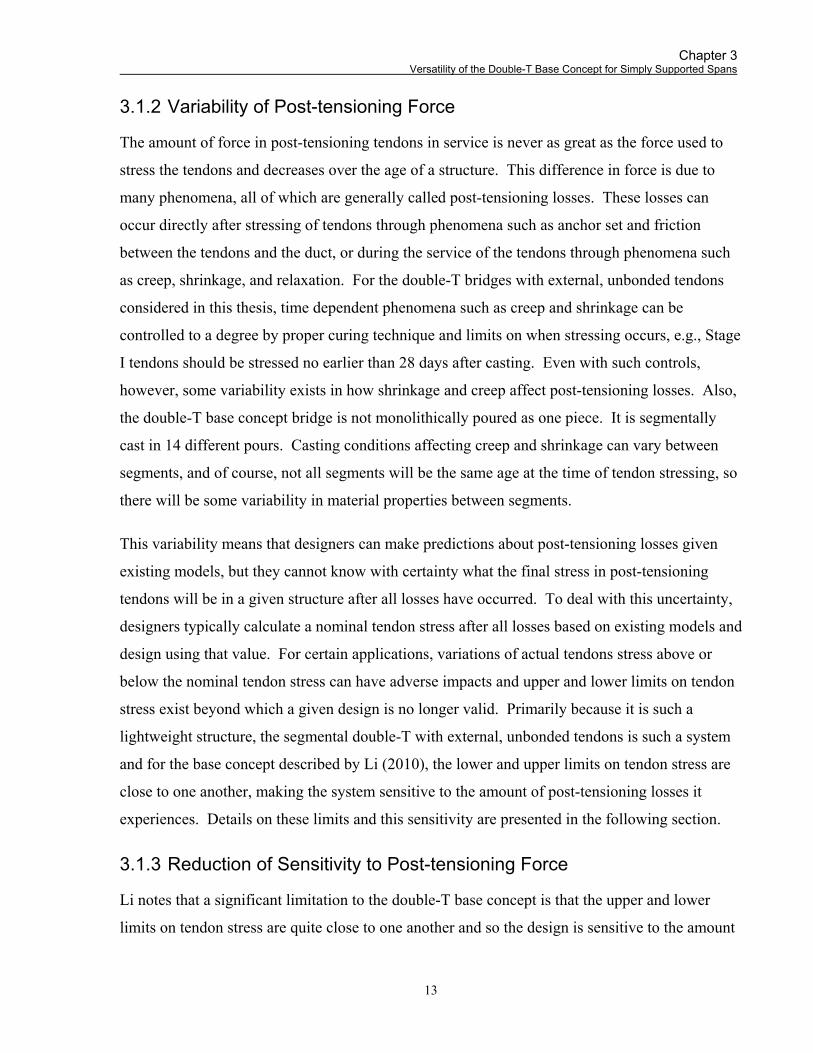
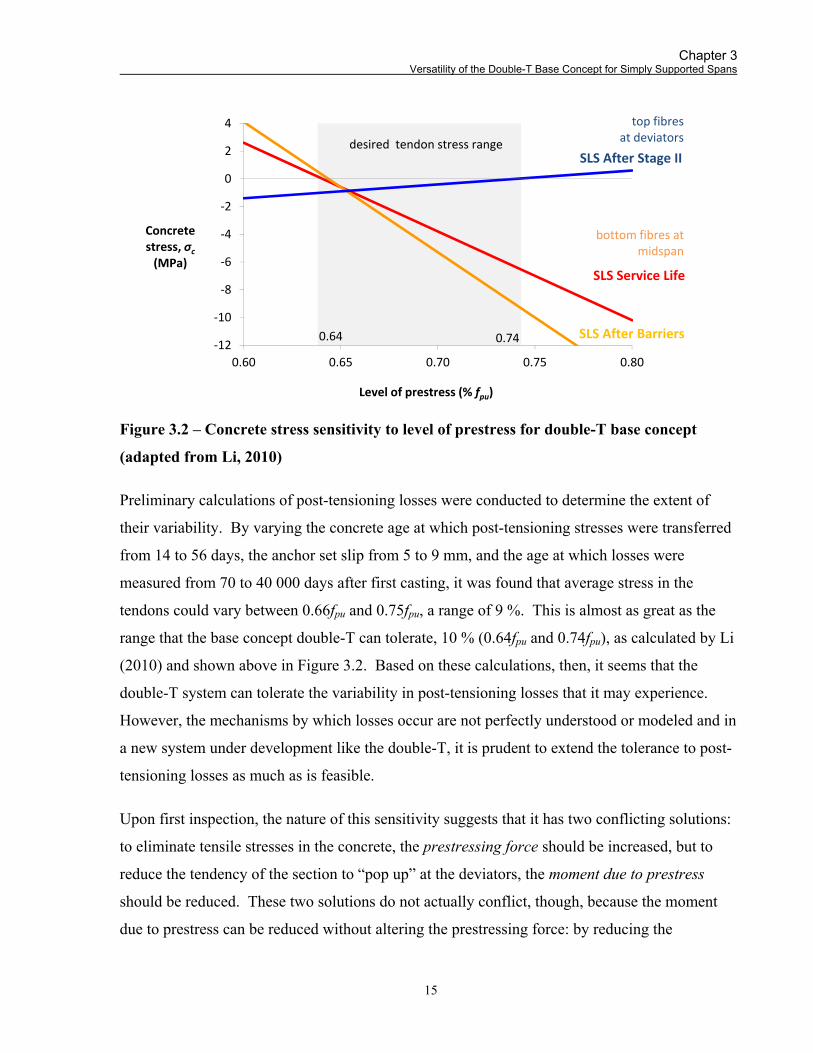
of post-tensioning losses that it experiences. The post-tensioning force after losses must be kept
between lower and upper limits so that stresses in the extreme fibres of concrete are limited
under various serviceability limit state load cases. The upper limit prevents tensile stresses in the
top fibres at the deviators and high compressive stresses in the bottom fibres at midspan. The
lower limit prevents tensile stresses in the bottom fibres at midspan. These locations are
illustrated in the schematic elevation views of the bridge presented in Figure 3.1.
Figure 3.1 – Limits on post-tensioning force and the areas that dictate them
The lower limit noted by Li for the post-tensioning stress after losses is approximately 0.64fpu. If
the stress in the tendons falls below this level for the SLS load case After Barriers (after the
Stage I tendons have been jacked and the barriers and wearing surface have been installed, as
described in Section 2.3) or for SLS load case Service Life (when the bridge is in service, as
described in Section 2.3), then tensile stresses are developed in the bottom fibres of concrete at
midspan, a situation that fails to meet the design criteria for segmental construction described in
Section 2.4.1.1.
The upper limit for the post-tensioning stress after losses is approximately 0.74fpu. If the stress in
the tendons does not fall below this limit after losses for load case After Stage II at SLS (when
the Stage II tendons are jacked, as described in Section 2.3), then tensile stresses are developed
in the top fibres of concrete at the deviators which, for segmental construction, would result in
the structure hogging up unstably. This condition occurs because the structure is relatively light.
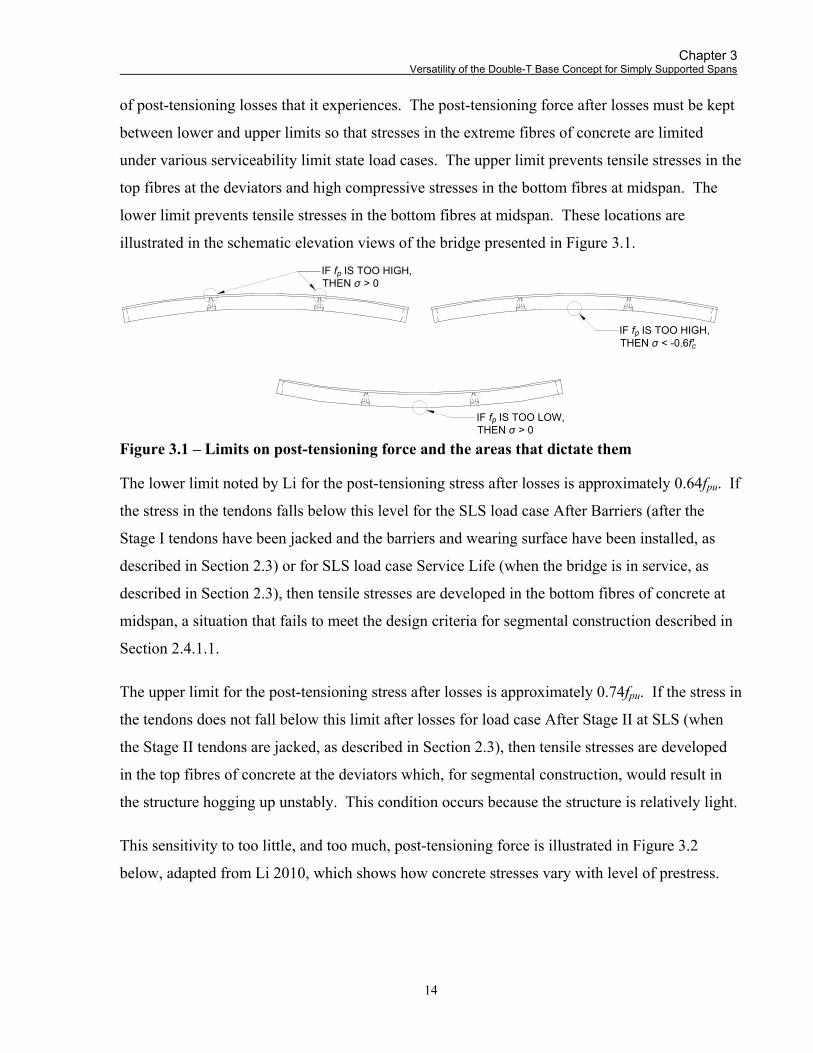
This sensitivity to too little, and too much, post-tensioning force is illustrated in Figure 3.2
below, adapted from Li 2010, which shows how concrete stresses vary with level of prestress.
IF f IS TOO LOW,THEN σ > 0
p
IF f IS TOO HIGH,THEN σ > 0
p
IF f IS TOO HIGH,THEN σ < -0.6f'
pc
Chapter 3 Versatility of the Double-T Base Concept for Simply Supported Spans
15
Figure 3.2 – Concrete stress sensitivity to level of prestress for double-T base concept
(adapted from Li, 2010)
Preliminary calculations of post-tensioning losses were conducted to determine the extent of
their variability. By varying the concrete age at which post-tensioning stresses were transferred
from 14 to 56 days, the anchor set slip from 5 to 9 mm, and the age at which losses were
measured from 70 to 40 000 days after first casting, it was found that average stress in the
tendons could vary between 0.66fpu and 0.75fpu, a range of 9 %. This is almost as great as the
range that the base concept double-T can tolerate, 10 % (0.64fpu and 0.74fpu), as calculated by Li
(2010) and shown above in Figure 3.2. Based on these calculations, then, it seems that the
double-T system can tolerate the variability in post-tensioning losses that it may experience.
However, the mechanisms by which losses occur are not perfectly understood or modeled and in
a new system under development like the double-T, it is prudent to extend the tolerance to post-
tensioning losses as much as is feasible.
Upon first inspection, the nature of this sensitivity suggests that it has two conflicting solutions:
to eliminate tensile stresses in the concrete, the prestressing force should be increased, but to
reduce the tendency of the section to “pop up” at the deviators, the moment due to prestress
should be reduced. These two solutions do not actually conflict, though, because the moment
due to prestress can be reduced without altering the prestressing force: by reducing the
0
0.5
1
1.5
2
2.5
3
3.5
4
‐12
‐10
‐8
‐6
‐4
‐2
0
2
4
0.60 0.65 0.70 0.75 0.80
Concretestress, σc
(MPa)
Level of prestress (% fpu)
desired tendon stress rangeSLS After Stage II
SLS Service Life
SLS After Barriers
bottom fibres at midspan
top fibresat deviators
0.64 0.74

Chapter 3 Versatility of the Double-T Base Concept for Simply Supported Spans
16
eccentricity of the tendons. It is hypothesised then, that the sensitivity of the section can be
reduced by increasing the prestressing force while reducing the eccentricity of the tendons at
midspan. To validate this supposition, the following discussion presents an investigation of the
sectional behaviour of the double-T with varying amounts of post-tensioning applied at varying
eccentricities.
3.2 Modifications to the Double-T Base Concept
To investigate the solutions proposed in Section 3.1 above, modifications were made to the
double-T base concept while holding other dimensions and parameters constant.
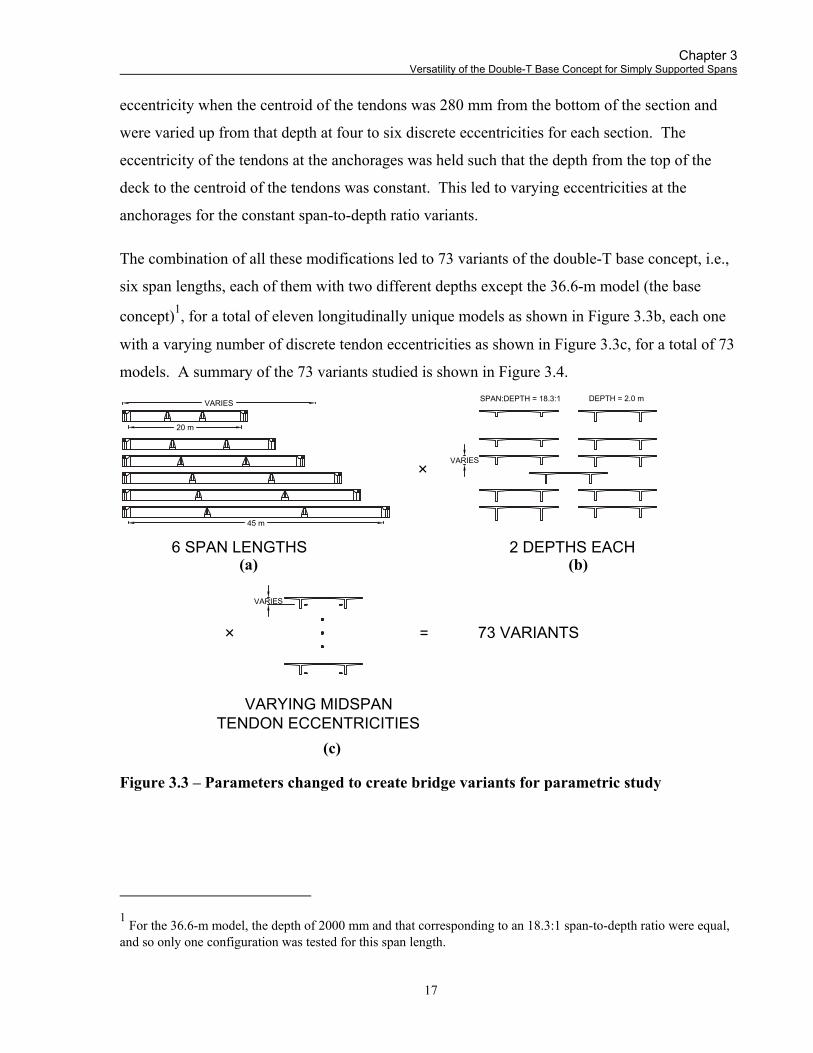
To investigate the versatility of the design over a range of spans, six discrete span lengths were
chosen: 20, 25, 30, 36.6 (the base concept), 40, 45 m. As illustrated in Figure 3.3, these spans
were dimensioned in two ways: in one, all cross-sectional dimensions of the base concept were
maintained; in the other, the depth of the webs was varied so that the span-to-depth ratio of the
base concept, 18.3:1, was maintained for all six span lengths.
The distance between the supports and the deviators was varied such that the deviators were at a
distance from the supports of 0.31 times the span length, the same ratio used for the base
concept. This ratio was used for all spans except the 20-m span, for which the deviators were
positioned at 0.35 times the span length (6.9 m from the supports). This exception was made to
ensure that the deviators did not interfere with the spread of anchorage forces over the width of
the deck. The region over which this spreading of forces was assumed to occur was half the
deck width, or 6.9 m, as described by Li (2010), and so the deviators were shifted to this distance
from the supports.
The midspan tendon eccentricity of the tendons of the base concept was chosen by Li such that
the tendons were as low as possible at midspan following conventional practice (Li, 2010). To
investigate options for reducing the eccentricity of the tendons, discrete midspan eccentricities
were chosen based on the depth of each section. For the six 2000-mm-deep sections, eight
eccentricities were used: 1000, 1075, 1150, 1225, 1300, 1325, 1350, and 1367 mm (the base
concept). The five constant span-to-depth ratio sections each had different section depths, and so
the eccentricities chosen for each section were different: they were chosen based on a maximum
Chapter 3 Versatility of the Double-T Base Concept for Simply Supported Spans
17
VARIES
VARIES
VARIES
6 SPAN LENGTHS 2 DEPTHS EACH
VARYING MIDSPANTENDON ECCENTRICITIES
×
× 73 VARIANTS=
20 m
45 m
SPAN:DEPTH = 18.3:1 DEPTH = 2.0 m
eccentricity when the centroid of the tendons was 280 mm from the bottom of the section and
were varied up from that depth at four to six discrete eccentricities for each section. The
eccentricity of the tendons at the anchorages was held such that the depth from the top of the
deck to the centroid of the tendons was constant. This led to varying eccentricities at the
anchorages for the constant span-to-depth ratio variants.
The combination of all these modifications led to 73 variants of the double-T base concept, i.e.,
six span lengths, each of them with two different depths except the 36.6-m model (the base
concept)1, for a total of eleven longitudinally unique models as shown in Figure 3.3b, each one
with a varying number of discrete tendon eccentricities as shown in Figure 3.3c, for a total of 73
models. A summary of the 73 variants studied is shown in Figure 3.4.
(a) (b) (c)
Figure 3.3 – Parameters changed to create bridge variants for parametric study
1 For the 36.6-m model, the depth of 2000 mm and that corresponding to an 18.3:1 span-to-depth ratio were equal,
and so only one configuration was tested for this span length.

Chapter 3 Versatility of the Double-T Base Concept for Simply Supported Spans
18
Figure 3.4 – Seventy-three bridge variants for parametric study
280 | 613
343 | 550
393 | 500
443 | 450
493 | 400
297 |1350
322 |1325
347 |1300
422 |1225
497 |1150
572 |1075
647 |1000
280 | 846
326 | 800
376 | 750
426 | 700
476| 650
280 |1076
306 |1050
356 |1000
406 | 950
456 | 900
280 |1513
343 |1450
393 |1400
426 |1367
280 |1726
306 |1700
356 |1650
406 |1600
456 |1550
280 |1367
297 |1350
322 |1325
347 |1300
422 |1225
497 |1150
572 |1075
647 |1000
280 |1367
297 |1350
322 |1325
347 |1300
422 |1225
497 |1150
572 |1075
647 |1000
280 |1367
297 |1350
322 |1325
347 |1300
422 |1225
497 |1150
572 |1075
647 |1000
280 |1367
297 |1350
322 |1325
347 |1300
422 |1225
497 |1150
572 |1075
647 |1000
280 |1367
297 |1350
322 |1325
347 |1300
422 |1225
497 |1150
572 |1075
647 |1000
280 |1367
526| 600
DEPTH (mm)HEIGHT TO NEUTRAL AXIS (mm)
CROSS-SECTIONAL AREA OF CONCRETE (m )MOMENT OF INERTIA OF SECTION (m )
CENTRE OF GRAVITY OF PRESTRESSING STEEL AT SUPPORTSHEIGHT (mm) | ECCENTRICITY (mm)
CENTRE OF GRAVITY OF PRESTRESSING STEEL AT MIDSPANHEIGHT (mm) | ECCENTRICITY (mm)
SPAN (m)
4
2
25
30
36.6
40
1095893
4.2020.180
502 | 391
200016474.7411.065
925 | 722
218517934.8511.384
1110 | 6832000
16474.7411.065
925 | 722
246020065.0151.963
1385 | 621
200016474.7411.065
925 | 722
20
136511264.3630.342
640 | 486
164013564.5270.590
743 | 613
200016474.7411.065
925 | 722
200016474.7411.065
925 | 722
200016474.7411.065
925 | 722
45

Chapter 3 Versatility of the Double-T Base Concept for Simply Supported Spans
19
3.3 Validation – Parametric Studies
Each of the 73 variants of the double-T base concept described above, i.e., each combination of
span length, section depth, and midspan tendon eccentricity, was analysed to determine a viable
range of post-tensioning forces that would allow the structure to resist serviceability and ultimate
limit state load cases. This range was determined for two main purposes: (1) to demonstrate
feasible variants of the base concept design and (2) to find variants of the base concept that
would be less sensitive to the amount of post-tensioning losses. A system that could tolerate a
larger range of valid post-tensioning forces, expressed as a numbers of strands, is a system that
can tolerate a larger variation in post-tensioning losses for a fixed number of strands.
Generally, the ranges were determined as follows. For each combination of span length and
section depth, loads were applied, with live loads amplified to account for uneven load sharing
between webs as described below. A sectional analysis was performed under SLS conditions. In
this analysis, the number of strands was varied to find upper and lower bounds at which SLS
limits were reached. These limits formed a bounding range on the number of tendons that works
for each combination of span length, section depth, and midspan tendon eccentricity. This valid
range of number of strands was further limited for each combination of span length, section
depth, and midspan tendon eccentricity by setting another lower limit that satisfied ULS criteria.
By combining the ranges of valid numbers of strands for each discrete midspan tendon
eccentricity, an envelope for each combination of span length and section depth was drawn that
described all valid combinations of midspan tendon eccentricity and number of post-tensioning
tendons. The remainder of this section provides a more detailed description of the process
described above.
3.3.1 Loads and Load Cases
For this parametric study, the load cases of concern were After Stage I, After Barriers, and
Service Life as defined in detail in Section 2.3. Only these three cases were considered because
the original sensitivity of the base concept described in Section 3.1.2 is bounded by them. The
load case After Stage I corresponds to the conditions under which the structure could be subject
to tensile stresses in its top fibres at the deviators, potentially causing joints between segments to

Chapter 3 Versatility of the Double-T Base Concept for Simply Supported Spans
20
open. Load cases After Barriers and Service Life correspond to conditions under which the
bridge would not satisfy SLS criteria in positive bending at midspan.
3.3.1.1 Dead and Superimposed Dead Loads
As part of the parametric study, each span was loaded according to the Canadian Highway
Bridge Design Code (CHBDC) (CSA, 2006). Dead and superimposed dead loads were
multiplied by a load factor of 1.00 for the serviceability limit state. At the ultimate limit state,
the weight of the precast concrete girder was multiplied by a load factor of 1.10, the weight of
the cast-in-place concrete barriers by 1.20, and that of the asphalt wearing surface by a load
factor of 1.50.
3.3.1.2 Live Loads
A two-stage process was followed to determine the live load case causing the most severe
effects. First, for each span length, flexural responses to both the CL-625 truck and lane loads
were determined. Second, as the CHBDC specifies for a deck width of 13.2 m, responses under
live loads in both two and three design lanes were considered. These design lanes were loaded
under truck and lane loads and then analysed for the effects of eccentric loads as described in
Section 3.3.1.3 below.
To account for the statistical unlikelihood of all lanes being occupied by traffic at once, multi-
lane loading reduction factors specified in the CHBDC were applied to all live loads.
To account for the increased vertical loads applied by vehicles travelling over uneven surfaces,
the dynamic load allowance specified in the CHBDC was also applied to the CL-625 truck loads,
but not to the lane loads.
3.3.1.3 Live Load Distribution
Transversely asymmetric loads on a bridge deck induce torsion in the structure. Box girders and
other closed sections resist torsion loads as St. Venant torsion, that is, through a closed shear
flow. Open sections like the double-T resist torsion loads through a combination of St. Venant
torsion and differential web bending or warping. To account for the additional web bending
caused by transversely eccentric live loads, a modification of the method laid out by Menn

Chapter 3 Versatility of the Double-T Base Concept for Simply Supported Spans
21
(1990), described in detail below, was used. Li (2010) notes that this method is conservative
when compared to a grillage model analysis. To reduce this conservatism, grillage models were
created and analysed for 20-, 36.6-, and 45-m spans. The amount that Menn’s method over-
predicted bending moments relative to the grillage models was calculated and a reduction factor
was interpolated for span lengths in between these spans. A more detailed description of this
entire process for determining live loads follows.
As stated above, open sections like the double-T resist torsion loads, T, through a combination of
St. Venant torsion, TSV, and differential web bending or warping, TW. The relationship of these
torsions at any longitudinal point, x, is:
(3.1)
Warping induces bending on one side of the structure which is greater than that which would be
induced were equivalent symmetric loading applied to the structure. When considering warping,
it is convenient to break down asymmetric loads into a pure symmetric and a pure antisymmetric
component as shown in Figure 3.5. In a system with two webs such as the double-T, the
symmetric component causes equal positive bending of both webs; the antisymmetric component
causes additional positive bending in the web on the side of the eccentricity and reduced bending
in the other web (Menn 1990).
(a) (b) (c)
Figure 3.5 – Transformation of (a) asymmetric load into (b) pure symmetric and (c) pure
antisymmetric components
When analysing the flexural response of each web, the additional bending due to torsion must be
added to the demand on one web. The ratio of torsion resisted as St. Venant torsion, TSV, to that
resisted as warping, TW, can be assumed to be a constant, k, along the length of a member (Menn
1990), that is,
(3.2)
Q
=
Q/2Q/2
+
Q/2 Q/2

Chapter 3 Versatility of the Double-T Base Concept for Simply Supported Spans
22
To determine the constant, k, for a given span, a simple compatibility condition is introduced: at
any given section along the length of the span, the longitudinal twist due to St. Venant torsion,
θSV, is equal to that due to warping, θW, that is,
(3.3)
An expression for θSV at a length, L, along the member can be derived from the fundamental
mechanics equation:
(3.4)
or
(3.5)
Where G is the shear modulus of the material, which Menn (1990) approximates as 0.4E. For
irregular sections like bridge superstructures, the polar moment of inertia, J, should be replaced
by the torsional constant, K. For non-circular members, the torsional constant is normally
calculated as the sum of moments of inertia of the section about two perpendicular axes. For a
double-T girder, Menn (1990) recommends that K be approximated as:
(3.6)
Where t0 is the thickness of the slab, b is the deck width, bw is the width of the webs, and h0 is the
height to the centre of the deck slab. These dimensions are illustrated in Figure 3.6. The
variable thickness of the deck slab of the double-T is ignored.
Figure 3.6 – Dimensions used to calculate the torsional constant
If the pure antisymmetric component of the load causing the twist is considered as two point
loads, each equal to QW, acting at midspan, one upward at one web, the other downward at the
other, an expression for θSV is obtained:
h0h
bw b0
b
t0

Chapter 3 Versatility of the Double-T Base Concept for Simply Supported Spans
23
(3.7)
The twist due to warping, θW, can be calculated from the section geometry when the webs deflect
in opposite directions due to the asymmetric component of the eccentric load as illustrated in
Figure 3.7.
Figure 3.7 – Parameters used to calculate the twist due to warping
Given the parameters above and assuming the twist is a small angle, θW is calculated as:
(3.8)
Where wv is the deflection of one web subjected to the asymmetric component of the eccentric
load at a given cross-section. When this asymmetric component is a point load of Qw at
midspan, wv is expressed as:
(3.9)
Where In is the moment of inertia of one of the webs and the associated tributary slab of the
double-T and is given in Menn (1990) as:
1 1 (3.10)
And an is the distance from the middle of the top slab to the neutral axis of the full section and is
given by:
(3.11)
Where all dimensions are as shown in Figure 3.6 and Figure 3.7 above.
QW
θW
wv
QW
wv
b0
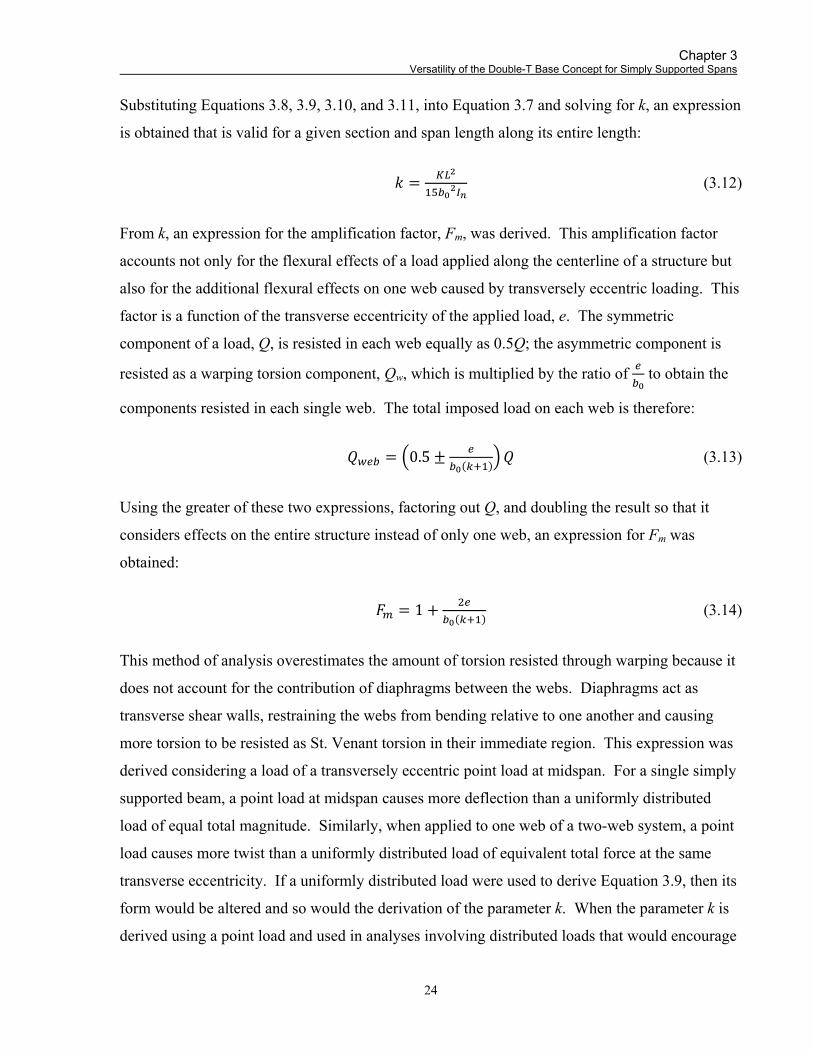
Chapter 3 Versatility of the Double-T Base Concept for Simply Supported Spans
24
Substituting Equations 3.8, 3.9, 3.10, and 3.11, into Equation 3.7 and solving for k, an expression
is obtained that is valid for a given section and span length along its entire length:
(3.12)
From k, an expression for the amplification factor, Fm, was derived. This amplification factor
accounts not only for the flexural effects of a load applied along the centerline of a structure but
also for the additional flexural effects on one web caused by transversely eccentric loading. This
factor is a function of the transverse eccentricity of the applied load, e. The symmetric
component of a load, Q, is resisted in each web equally as 0.5Q; the asymmetric component is
resisted as a warping torsion component, Qw, which is multiplied by the ratio of to obtain the
components resisted in each single web. The total imposed load on each web is therefore:
0.5 (3.13)
Using the greater of these two expressions, factoring out Q, and doubling the result so that it
considers effects on the entire structure instead of only one web, an expression for Fm was
obtained:
1 (3.14)
This method of analysis overestimates the amount of torsion resisted through warping because it
does not account for the contribution of diaphragms between the webs. Diaphragms act as
transverse shear walls, restraining the webs from bending relative to one another and causing
more torsion to be resisted as St. Venant torsion in their immediate region. This expression was
derived considering a load of a transversely eccentric point load at midspan. For a single simply
supported beam, a point load at midspan causes more deflection than a uniformly distributed
load of equal total magnitude. Similarly, when applied to one web of a two-web system, a point
load causes more twist than a uniformly distributed load of equivalent total force at the same
transverse eccentricity. If a uniformly distributed load were used to derive Equation 3.9, then its
form would be altered and so would the derivation of the parameter k. When the parameter k is
derived using a point load and used in analyses involving distributed loads that would encourage

Chapter 3 Versatility of the Double-T Base Concept for Simply Supported Spans
25
more load sharing between webs, it leads to conservatively high additional loads on individual
webs. The reduction factors calculated based on the grillage models analysed for 20-, 36.6-, and
45-m spans eliminated this conservatism.
Considered simply as a two-dimensional system, the bending response of the overall section is
greater for the higher magnitude load of three loaded lanes rather than two. When the transverse
eccentricity of the loads is considered, however, the warping induced by two eccentric loaded
lanes is greater than that induced by three. This creates uncertainty when determining by
inspection which load case causes the greatest flexure in a single web. Because of this
uncertainty, the effects of both cases: two lanes loaded eccentrically and three lanes loaded
eccentrically, were calculated. Once the most severe case was determined, the live load demand
on the web on the side of the eccentricity was applied to both webs and the full-width structure
was analysed under this condition. A summary of the derived live loads used in analysis of the
eleven concrete variants is shown in Figure 3.8.

Figure 3.8 – Live loads used in analysis for parametric study
3164 | 3271
25
30
36.6
40
45
SPAN(m)
1095
2185
2460
20
1365
1640
2000
2835 | 28264219 | 4362
3780 | 3768
1.72861.1911
5469 | 5655
4502 | 44885025 | 51954901 | 4885
1.57831.1517
4994 | 5163
4353 | 43394859 | 50234474 | 4460
4852 | 4075
2000
4371 | 36896769 | 5433
5828 | 4918
1.70611.1852
8277 | 6952
6907 | 58297667 | 64397457 | 6293
1.60701.1595
7796 | 6548
6757 | 57037501 | 63007024 | 5928
6725 | 6196
2000
6126 | 55228966 | 8262
8168 | 7363
1.68051.1785
11301|10413
9626 | 867710561| 973610295| 9280
1.62671.1644
10939|10079
9511 | 857310440| 96209966 | 8983
8952 | 75908442 | 7174
11936|1012011256| 9566
1.64331.1687
14711|12472
13155|1117913950|1182713873|11789
10100| 8713
2000 9704 | 834313466|11617
12938|11125
1.62301.1634
16392|14141
15053|1294215667|1351515749|13541
1.64941.1703
16658|14371
15760|1359616005|13762
10775|10205
2000 10996|1003314366|13606
14662|13378
1.59261.1554
|16252
16940|1545616599|15721
1.65691.1723
15142|13019
2000
DEPTH(mm)
LIVE LOAD DEMANDON ONE WEB
AT MIDSPAN (kN-m) | AT DEVIATORS (kN-m)
2 x CL-625 TRUCKLOADING
2 x CL-W LANE3 x CL-625 TRUCK
3 x CL-W LANE
MENN AMPLIFICATIONm
AMPLIFIED DEMANDAT MIDSPAN (kN-m) | AT DEVIATORS (kN-m)
MOSTSEVERE
CASE
FACTOR, F
3164 | 32712835 | 2826
4219 | 43623780 | 3768
4852 | 40754371 | 3689
6769 | 54335828 | 4918
6725 | 61966126 | 5522
8966 | 82628168 | 7363
10100| 87139704 | 8343
13466|1161712938|11125
10775|1020510996|10033
14366|1360614662|13378
17513|
17188|1568316842|15951
|1690818220|
GRILLAGE REDUCTIONFACTOR
4663 | 4821
7081 | 5947
9660 | 8901
12479|10580
13810|11914
|1351014558|
0.8526
0.8555
0.8548
0.8483
0.8425
0.8315
LIVE LOAD(kN-m)
0.8526
0.8555
0.8548
0.8425
0.8315
4258 | 4402
6670 | 5602
9351 | 8616
14035|12108
|1405615146|
26
C
hapter 3
Versatility of the D
ouble-T B
ase Concept for S
imply S
upported Spa
ns

Chapter 3 Versatility of the Double-T Base Concept for Simply Supported Spans
27
The live load sharing model described above was chosen because it simplified the analysis of the
44 live load cases presented in Figure 3.8 above. However, Menn’s equations are conservative
for all cases studied and overpredict moment demand. This was demonstrated by Li (2010) and
can be seen when comparing the loads obtained from this method to a more detailed analysis of a
36.6-m-long span with a depth of 2000 mm and a midspan tendon eccentricity of 1367 mm.
Using the modified Menn analysis, the maximum midspan live load demand was 14 711 kNm or
7355 kNm for a single web. For the exact same bridge variant, a grillage analysis results in a
maximum live load of only 6240 kNm for a single web. This conservative over-prediction varies
with span length and so to reduce the live load moments calculated above, the results of three
representative grillage models (for the 20-, 36.6-, and 45-m spans) were used. The maximum
bending moments due to live load were calculated based on the results of these analyses and, as
expected, found to be less than those predicted by the modified Menn method. The ratio
between these grillage live loads and the Menn live loads was calculated for 20-, 36.6-, and 45-m
spans and interpolated for 25-, 30-, and 40-m spans to develop live load reduction factors to be
used in all subsequent analysis. A summary of these reduction factors and their derivation is
shown in Table 3.1.
Table 3.1 – Comparison of live loads derived using two methods
Span (m)
Unfactored live load based on Reduction
factor (grillage/Menn)
Calculated or interpolated
Menn’s modified model (kNm)
Grillage model (kNm)
20 5655 4821 0.8526 Calculated 25 8277 7080 0.8555 Interpolated 30 11 301 9659 0.8548 Interpolated
36.6 14 711 12 479 0.8483 Calculated 40 16 392 13 810 0.8425 Interpolated 45 17 513 14 558 0.8315 Calculated
3.3.2 Analysis Under Serviceability Limit States
The 73 structures were analysed through simple sectional analysis at midspan and at the
centerline of the deviators. No tensile stresses were permitted in the concrete as described in
Section 2.4.1.1. Concrete in compression was assumed to remain linear elastic up to 0.6f΄c
(42 MPa) as described in Section 2.4.1.2. Stress in the tendons was assumed to remain constant

Chapter 3 Versatility of the Double-T Base Concept for Simply Supported Spans
28
for each analysis, regardless of member deflection under serviceability limit states. This is
reasonable because member deflections, which dictate tendon stress, are minimal under SLS
conditions. For each load case, however, the constant stress in the tendons was assumed at a
different level to reflect the expected amount of post-tensioning losses for that particular case,
e.g., stress in the tendons after barriers were installed was assumed to be 0.74fpu, whereas it was
assumed to be 0.67fpu during the service life of the bridge.
The three criteria presented in Section 3.1.2 set upper and lower bounds on the amount of post-
tensioning steel that can be used for each bridge variant.
3.3.2.1 Bounds for Stage I Tendons
The Stage I longitudinal post-tensioning force and as an extension, the number of Stage I
tendons, was limited by the lower bound and two upper bounds noted above. The lower bound
was to ensure that the structure resisted loading under SLS load case After Barriers and that the
stresses in the bottom fibres of the concrete at midspan remained compressive. There were two
upper bounds on the Stage I post-tensioning, both applied based on load case After Stage I at
SLS. One bound ensured that the stress in the top fibres at the deviators remained compressive.
The other, which governed for longer spans only, ensured that the concrete in the section at
midspan remained entirely linear elastic, that is, compressive stresses were limited to 0.6f΄c, or
42 MPa. When converting the limits on the prestressing force to a number of strands, the stress
in the tendons for these load cases was assumed to be 0.74fpu, as corresponds to losses calculated
by Li (2010) for these stages of construction.
3.3.2.2 Bounds for Stage II Tendons
The Stage II longitudinal post-tensioning force was also limited by a lower bound and two upper
bounds. The lower bound was to ensure that the structure resisted loading under SLS load case
Service Life and that the stresses in the bottom fibres of the concrete at midspan remained
compressive. As with the Stage I tendons, there were also two upper bounds on the Stage II
post-tensioning, both applied based on SLS load case After Stage II: one ensured that the stress
in the top fibres at the deviators remained compressive, the other, which governed for longer
spans only, ensured that the concrete in the section at midspan remained entirely linearly elastic,
that is, compressive stresses were limited to 0.6f΄c, or 42 MPa. When converting the limits on
Chapter 3 Versatility of the Double-T Base Concept for Simply Supported Spans
29
the prestressing force to a number of strands, the stress in the tendons for the lower bound was
assumed to be 0.67fpu and for the upper bounds was assumed to be 0.74fpu. These stresses are
conservative and appropriate for SLS load cases Service Life and After Stage II, respectively.
The application of these bounds yields two ranges of possible amounts of post-tensioning for
each combination of span length and tendon eccentricity. These ranges can be represented
graphically as shown in the example in Figure 3.9. This sample figure helps to explain Figure
3.10 and Figure 3.11, presentations of the actual results of the serviceability limit state analyses.
Each of these figures represents possible numbers of strands for a given span length and depth
over the studied range of eccentricities. For example, reading from Figure 3.10c, for a bridge
variant that is 2000 mm deep and 30 m long, with a midspan tendon eccentricity of 1150 mm, the
number of total strands can vary from 120 to 156.
These ranges are only based on serviceability limit state criteria. To validate options within
these ranges, combinations of span length, eccentricity, and number of strands were checked at
the ultimate limit state as described in the following section.

Figure 3.9 – Explanatory Plot – amounts of post-tensioning satisfying serviceability limit state criteria for a 36.6-m span
0
25
50
75
100
125
150
175
200
225
250
275
300
950 1000 1050 1100 1150 1200 1250 1300 1350 1400
Number of
15‐mm
strands
Tendon eccentricity at midspan (mm)
maximum for SLS 1A such thatthere is no tension
in top fibres at deviatorsmaximum for SLS 1A such that concrete remains linear‐elasticin bottom fibres at midspan
minimum for SLS 1B such thatthere is no tension
in bottom fibres at midspan
minimum for SLS 1D such thatthere is no tension
in bottom fibres at midspan
maximum for SLS 1C such thatthere is no tension in top fibres at deviators
maximum for SLS 1C such thatconcrete remains linear‐elasticin bottom fibres at midspan
Valid Amounts ofPost‐tensioning for Stage II
Valid Amounts ofPost‐tensioning for Stage I
Scope of Study
The blue shaded region represents valid numbers of total strands (Stage I plus Stage II) that would satisfy all applicable SLS criteria.
The red shaded region represents valid numbers of Stage I strands that would satisfy all applicable SLS criteria.
σtop, dev < 0
σbot, mid < 0
σtop, dev < 0
σbot, mid < 0
σbot, mid > ‐0.6f'c
σbot, mid > ‐0.6f'c
30
C
hapter 3
Versatility of the D
ouble-T B
ase Concept for S
imply S
upported Spa
ns

(a) (b) (c)
(d) (e) (f)
Figure 3.10 – Amounts of post-tensioning satisfying serviceability limit state criteria for 2000-mm-deep spans of (a) 20 m,
(b) 25 m, (c) 30 m, (d) 36.6 m, (e) 40 m, and (f) 45 m
0
25
50
75
100
125
150
175
200
225
250
275
300
325
350
950 1000 1050 1100 1150 1200 1250 1300 1350 1400
Numberof
15‐mm
strands
Tendon eccentricity at midspan (mm)
maximum for SLS 1A | σtop, dev < 0
maximum for SLS 1A | σbot, mid > ‐42 MPa
minimum for SLS 1B | σbot, mid < 0
minimum for SLS 1D | σbot, mid < 0
maximum for SLS 1C | σtop, dev < 0
maximum for SLS 1C | σbot, mid > ‐42 MPa
Stage II
Stage I
0
25
50
75
100
125
150
175
200
225
250
275
300
325
350
950 1000 1050 1100 1150 1200 1250 1300 1350 1400
Numberof
15‐mmstrands
Tendon eccentricity at midspan (mm)
maximum for SLS 1A | σtop, dev < 0
maximum for SLS 1A | σbot, mid > ‐42 MPa
minimum for SLS 1B | σbot, mid < 0
minimum for SLS 1D | σbot, mid < 0
maximum for SLS 1C | σtop, dev < 0
maximum for SLS 1C | σbot, mid > ‐42 MPa
Stage II
Stage I
0
25
50
75
100
125
150
175
200
225
250
275
300
325
350
950 1000 1050 1100 1150 1200 1250 1300 1350 1400
Tendon eccentricity at midspan (mm)
maximum for SLS 1A | σtop, dev < 0
maximum for SLS 1A | σbot, mid > ‐42 MPa
minimum for SLS 1B | σbot, mid < 0
minimum for SLS 1D | σbot, mid < 0
maximum for SLS 1C | σtop, dev < 0maximum for SLS 1C | σbot, mid > ‐42 MPa
Stage II
Stage I
0
25
50
75
100
125
150
175
200
225
250
275
300
325
350
950 1000 1050 1100 1150 1200 1250 1300 1350 1400
Tendon eccentricity at midspan (mm)
maximum for SLS 1A | σtop, dev < 0
maximum for SLS 1A | σbot, mid > ‐42 MPa
minimum for SLS 1B | σbot, mid < 0
minimum for SLS 1D | σbot, mid < 0
maximum for SLS 1C | σtop, dev < 0
maximum for SLS 1C | σbot, mid > ‐42 MPa
Stage II
Stage I
C
hapter 3
Versatility of the D
ouble-T B
ase Concept for S
imply S
upported Spa
ns
31

(a) (b) (c)
(d) (e) (f)
Figure 3.11 – Amounts of post-tensioning satisfying serviceability limit state criteria for (respectively) section depths and spans
of (a) 1095 mm, 20 m; (b) 1365 mm, 25 m; (c) 1640 mm, 30 m; (d) 2000 mm, 36.6 m (duplicate of Figure 3.10d);
(e) 2185 mm, 40 m; (f) 2460 mm, 45 m
0
25
50
75
100
125
150
175
200
225
250
275
300
325
350
350 400 450 500 550 600 650
Number of
15‐mm
strands
Tendon eccentricity at midspan (mm)
maximum for SLS 1A | σtop, dev < 0
maximum for SLS 1A | σbot, mid > ‐42 MPa
minimum for SLS 1B | σbot, mid < 0
minimum for SLS 1D | σbot, mid < 0
maximum for SLS 1C | σtop, dev < 0
maximum for SLS 1C | σbot, mid > ‐42 MPa
Stage II
Stage I
0
25
50
75
100
125
150
175
200
225
250
275
300
325
350
550 600 650 700 750 800 850 900
Tendon eccentricity at midspan (mm)
maximum for SLS 1A | σtop, dev < 0
maximum for SLS 1A | σbot, mid > ‐42 MPa
minimum for SLS 1B | σbot, mid < 0
minimum for SLS 1D | σbot, mid < 0
maximum for SLS 1C | σtop, dev < 0
maximum for SLS 1C | σbot, mid > ‐42 MPa
Stage II
Stage I
0
25
50
75
100
125
150
175
200
225
250
275
300
325
350
850 900 950 1000 1050 1100 1150
Tendon eccentricity at midspan (mm)
maximum for SLS 1A | σtop, dev < 0
maximum for SLS 1A | σbot, mid > ‐42 MPa
minimum for SLS 1B | σbot, mid < 0
minimum for SLS 1D | σbot, mid < 0
maximum for SLS 1C | σtop, dev < 0
maximum for SLS 1C | σbot, mid > ‐42 MPa
Stage II
Stage I
0
25
50
75
100
125
150
175
200
225
250
275
300
325
350
950 1000 1050 1100 1150 1200 1250 1300 1350 1400
Numberof
15‐mm
strands
Tendon eccentricity at midspan (mm)
maximum for SLS 1A | σtop, dev < 0
maximum for SLS 1A | σbot, mid > ‐42 MPa
minimum for SLS 1B | σbot, mid < 0
minimum for SLS 1D | σbot, mid < 0
maximum for SLS 1C | σtop, dev < 0
maximum for SLS 1C | σbot, mid > ‐42 MPa
Stage II
Stage I
0
25
50
75
100
125
150
175
200
225
250
275
300
325
350
1300 1350 1400 1450 1500 1550 1600
Tendon eccentricity at midspan (mm)
maximum for SLS 1A | σtop, dev < 0
maximum for SLS 1A | σbot, mid > ‐42 MPa
minimum for SLS 1B | σbot, mid < 0
minimum for SLS 1D | σbot, mid < 0
maximum for SLS 1C | σtop, dev < 0
maximum for SLS 1C | σbot, mid > ‐42 MPa
Stage II
Stage I
0
25
50
75
100
125
150
175
200
225
250
275
300
325
350
1500 1550 1600 1650 1700 1750 1800
Tendon eccentricity at midspan (mm)
maximum for SLS 1A | σtop, dev < 0
maximum for SLS 1A | σbot, mid > ‐42 MPa
minimum for SLS 1B | σbot, mid < 0
minimum for SLS 1D | σbot, mid < 0
maximum for SLS 1C | σtop, dev < 0
maximum for SLS 1C | σbot, mid > ‐42 MPa
Stage II
Stage I
32
C
hapter 3
Versatility of the D
ouble-T B
ase Concept for S
imply S
upported Spa
ns

Chapter 3 Versatility of the Double-T Base Concept for Simply Supported Spans
33
3.3.3 Analysis at Ultimate Limit State
There is a fundamental difference between the analysis of prestressed members with
conventional bonded tendons and those with unbonded tendons. The elongation of bonded
tendons due to member deformation at any point along the tendon is identical to the strain in the
concrete section immediately adjacent to that point and can be readily obtained from an analysis
of the concrete section. This is not true of members with unbonded tendons. Because unbonded
tendons are only connected to the concrete at their anchorages, the strain they undergo at any
particular cross-section is not necessarily equal to that of the adjacent concrete. The strain in
these tendons can conservatively be assumed to be constant between anchorages, but overall
elongation must be calculated through an integration of the states of strain at all cross-sections
along the length of the member.
For serviceability limit states, the stress in the tendons is conservatively assumed not to change
under loading. For ultimate limit states, however, this assumption is unreasonable. The
following iterative procedure is followed to determine the ultimate bending capacity of the
system and the corresponding force in the tendon. This iterative procedure is based on the
compatibility condition that the elongation of the tendon due to force in the tendon is equal to
that due to deformation of the structure. An alternative way of looking at this condition is that
the elongation of the tendon must be equal to the elongation of the duct that surrounds it.
For this analysis, the bilinear stress-strain curves for concrete found in the CEB-FIB Draft Model
Code (2010) and shown in Figure 3.12 is used.
Figure 3.12 – Bilinear concrete stress-strain curve for 70-MPa concrete (adapted from
CEB-FIB, 2010)
1. Remove the tendon from the concrete structure shown in Figure 3.13a and apply
equivalent anchorage and deviator forces to the structure as shown in Figure 3.13b.
stress
f' = 70 MPac
0.0027strain0.0020

Chapter 3 Versatility of the Double-T Base Concept for Simply Supported Spans
34
(a) (b)
Figure 3.13 – Equivalent loading after tendon removal
2. The forces shown in Figure 3.13b vary with the force in the tendons. Assume initially
that the stress in the tendons, σp1, is equal to the yield stress of the tendons, 0.90fpu.
For the given axial compressive force due to prestress and using the bilinear stress-strain
curve for concrete shown in Figure 3.12 determine the three values of moment for the
concrete section described by the strain and stress profiles in Figure 3.14: the cracking
moment, Mcr; the moment at which strain in the extreme compression fibre is equal to
0.0020, Mle; and the ultimate moment, Mr.
(a) (b) (c)
Figure 3.14 – Strain and stress profiles for (a) cracking moment, (b) ‘linear elastic’
moment, and (c) ultimate moment
Also determine corresponding values of strain in the concrete at the level of prestress, εcp.
3. The system is loaded with dead, superimposed dead, and live loads as shown in Figure
3.15a, resulting in a bending moment diagram similar in shape to that shown in Figure
3.15b.
εcr fcr
σ = f' = 70 MPa
εcp,cr
c
Mcr
εcp,le εcp,r
Mle Mrε = 0.0020le σ = f' = 70 MPacε = 0.0027r

Chapter 3 Versatility of the Double-T Base Concept for Simply Supported Spans
35
εcp,le
MrMleMcr
MleMcr
εcp,r
Mmax
(a) (b)
Figure 3.15 – (a) Dead, superimposed dead, live, and prestress loads and (b) resulting
schematic bending moment diagram
Scale the resulting bending moment diagram linearly such that the maximum imposed
moment is equal to the ultimate moment that the section can resist, i.e., Mmax = Mr. as
shown in Figure 3.16.
Figure 3.16 – Scaled bending moment diagram
4. On the resulting scaled bending moment diagram, plot Mcr, Mle, and Mr as shown in
Figure 3.17a. Draw corresponding plots of strain in the concrete at the level of prestress,
εcp as shown in Figure 3.17b.
(a) (b) Figure 3.17 – (a) Significant points on bending moment diagram and (b) corresponding
concrete strains at level of prestress
Mr
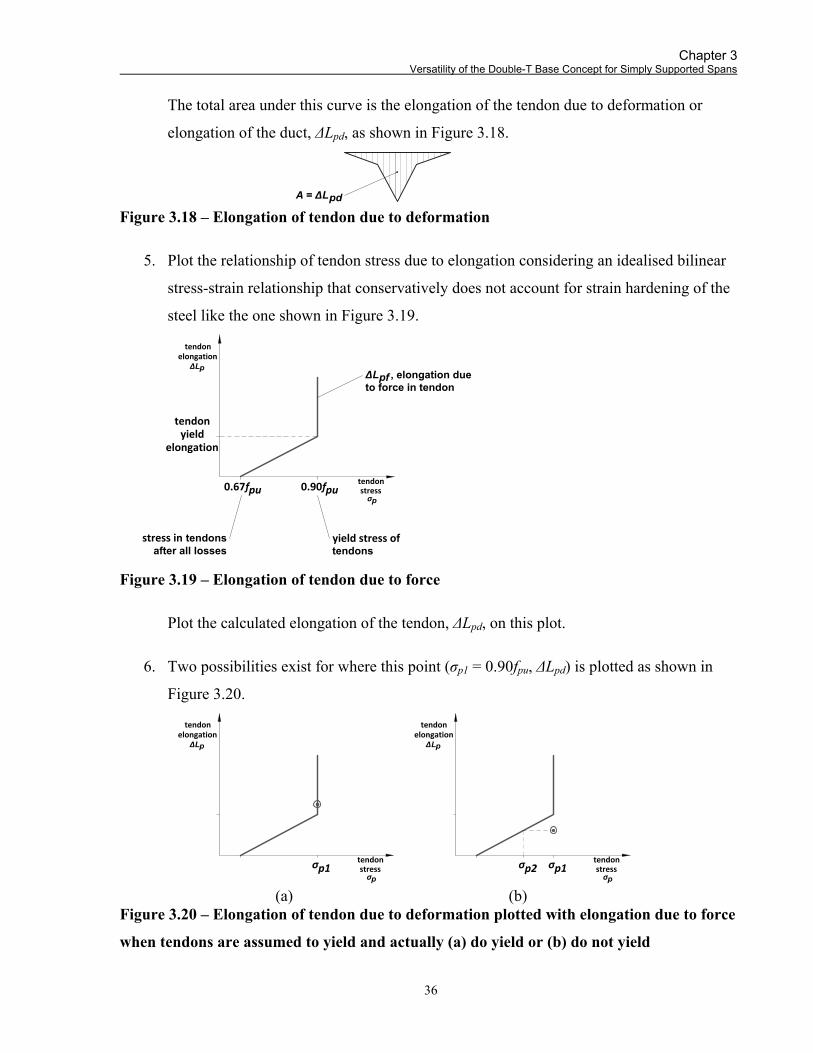
Chapter 3 Versatility of the Double-T Base Concept for Simply Supported Spans
36
The total area under this curve is the elongation of the tendon due to deformation or
elongation of the duct, ΔLpd, as shown in Figure 3.18.
Figure 3.18 – Elongation of tendon due to deformation
5. Plot the relationship of tendon stress due to elongation considering an idealised bilinear
stress-strain relationship that conservatively does not account for strain hardening of the
steel like the one shown in Figure 3.19.
Figure 3.19 – Elongation of tendon due to force
Plot the calculated elongation of the tendon, ΔLpd, on this plot.
6. Two possibilities exist for where this point (σp1 = 0.90fpu, ΔLpd) is plotted as shown in
Figure 3.20.
(a) (b) Figure 3.20 – Elongation of tendon due to deformation plotted with elongation due to force
when tendons are assumed to yield and actually (a) do yield or (b) do not yield
A = ΔLpd
tendonelongation
ΔLp
tendonstress
pσ
tendonyield
elongation
0.67fpu 0.90fpu
ΔL , elongation dueto force in tendon
pf
yield stress oftendons
stress in tendonsafter all losses
σp2
tendonelongation
ΔLp
tendonstresspσ
tendonelongation
ΔLp
tendonstresspσ
σp1σp1
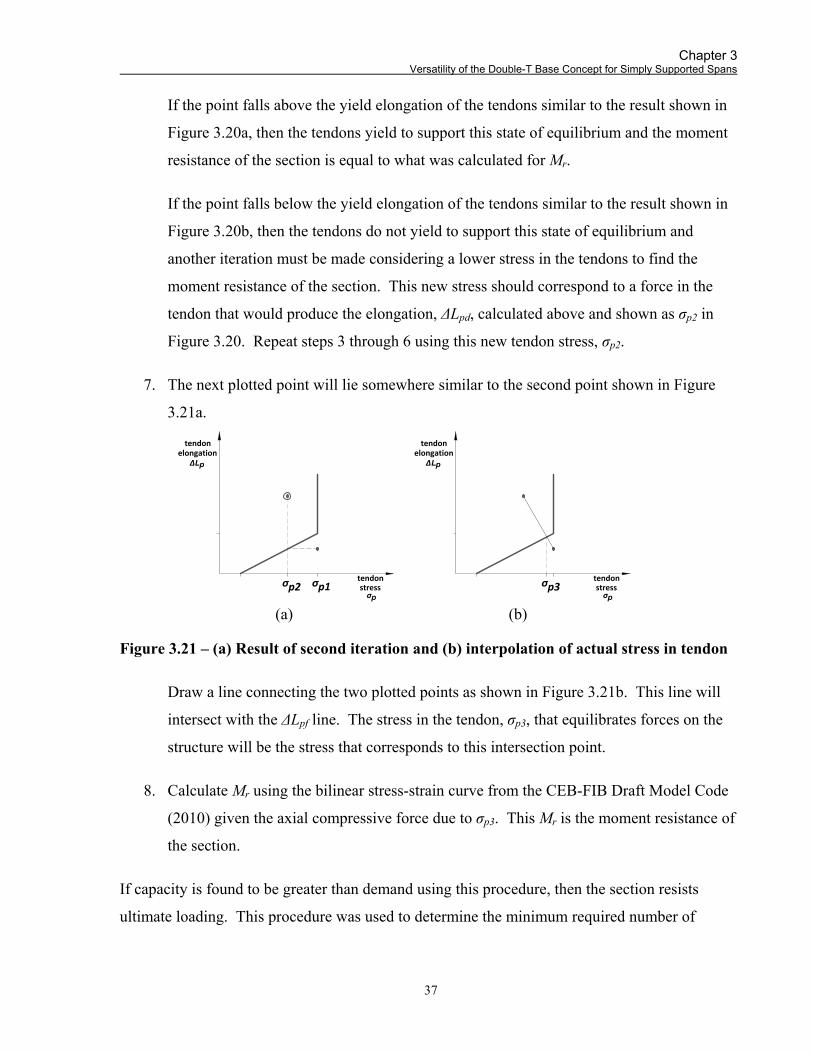
Chapter 3 Versatility of the Double-T Base Concept for Simply Supported Spans
37
If the point falls above the yield elongation of the tendons similar to the result shown in
Figure 3.20a, then the tendons yield to support this state of equilibrium and the moment
resistance of the section is equal to what was calculated for Mr.
If the point falls below the yield elongation of the tendons similar to the result shown in
Figure 3.20b, then the tendons do not yield to support this state of equilibrium and
another iteration must be made considering a lower stress in the tendons to find the
moment resistance of the section. This new stress should correspond to a force in the
tendon that would produce the elongation, ΔLpd, calculated above and shown as σp2 in
Figure 3.20. Repeat steps 3 through 6 using this new tendon stress, σp2.
7. The next plotted point will lie somewhere similar to the second point shown in Figure
3.21a.
(a) (b)
Figure 3.21 – (a) Result of second iteration and (b) interpolation of actual stress in tendon
Draw a line connecting the two plotted points as shown in Figure 3.21b. This line will
intersect with the ΔLpf line. The stress in the tendon, σp3, that equilibrates forces on the
structure will be the stress that corresponds to this intersection point.
8. Calculate Mr using the bilinear stress-strain curve from the CEB-FIB Draft Model Code
(2010) given the axial compressive force due to σp3. This Mr is the moment resistance of
the section.
If capacity is found to be greater than demand using this procedure, then the section resists
ultimate loading. This procedure was used to determine the minimum required number of
σp2 σp3
tendonelongation
ΔLp
tendonstresspσ
tendonelongation
ΔLp
tendonstresspσ
σp1
Chapter 3 Versatility of the Double-T Base Concept for Simply Supported Spans
38
tendons to resist ultimate loading for each combination of span length, section depth, and
midspan tendon eccentricity.
3.3.4 Combining Serviceability Limit States and Ultimate Limit States Results
In order to create envelopes of valid bridge variants, and hence, determine the limits on the
feasibility of this bridge type, a plot of the minimum number of tendons for each variant that
satisfied ultimate limit state criteria was overlaid on the envelopes of serviceability limit state
criteria. The envelopes of valid amounts of Stage II post-tensioning are the overlap of the two
areas of valid variants meeting all serviceability and ultimate limit state criteria. Figure 3.22 and
Figure 3.23 below show the overlap of serviceability and ultimate limit state results. The feasible
amounts of post-tensioning strands are shown as shaded areas on these plots. For example, for a
40-m-long, 2000-mm-deep double-T bridge, Figure 3.22e shows that with tendons at a midspan
eccentricity of 1150 mm, the number of Stage I strands that could be used varies from 132 to 184
and the number of total strands ranges from 198 to 238.
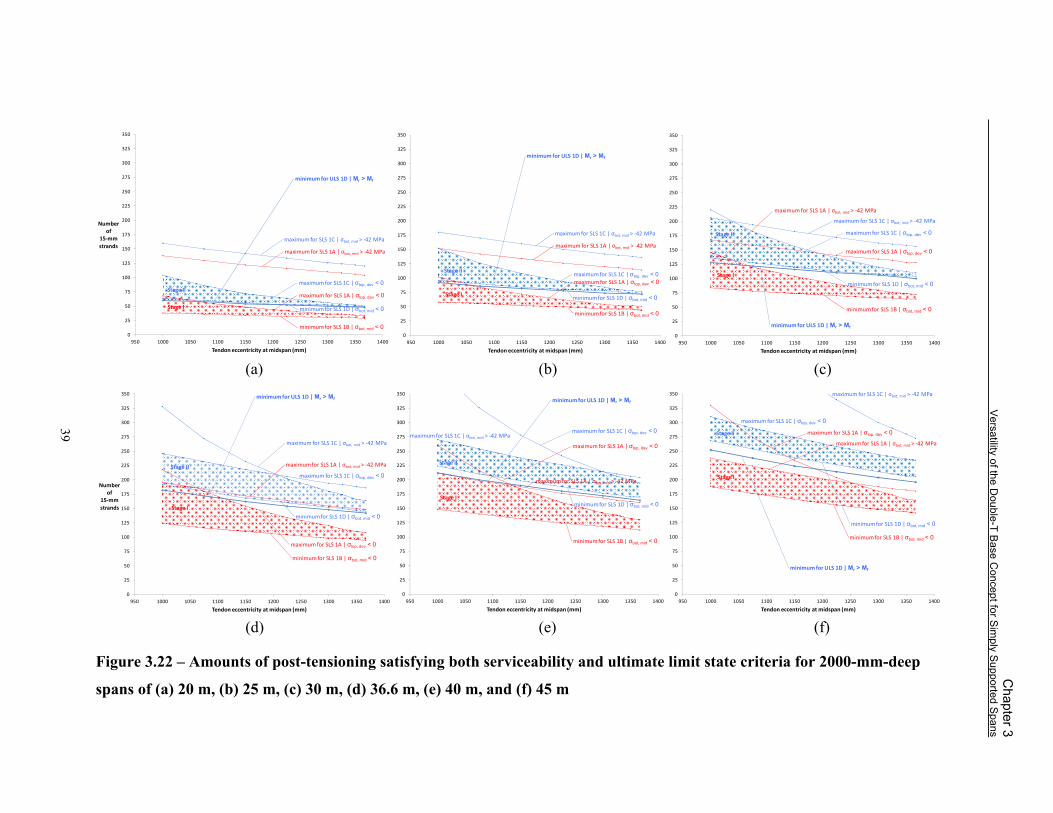
(a) (b) (c)
(d) (e) (f)
Figure 3.22 – Amounts of post-tensioning satisfying both serviceability and ultimate limit state criteria for 2000-mm-deep
spans of (a) 20 m, (b) 25 m, (c) 30 m, (d) 36.6 m, (e) 40 m, and (f) 45 m
0
25
50
75
100
125
150
175
200
225
250
275
300
325
350
950 1000 1050 1100 1150 1200 1250 1300 1350 1400
Numberof
15‐mmstrands
Tendon eccentricity at midspan (mm)
maximum for SLS 1A | σtop, dev < 0
maximum for SLS 1A | σbot, mid > ‐42 MPa
minimum for SLS 1B | σbot, mid < 0
minimum for SLS 1D | σbot, mid < 0
maximum for SLS 1C | σtop, dev < 0
maximum for SLS 1C | σbot, mid > ‐42 MPa
Stage II
Stage I
minimum for ULS 1D | Mr > Mf
0
25
50
75
100
125
150
175
200
225
250
275
300
325
350
950 1000 1050 1100 1150 1200 1250 1300 1350 1400
Numberof
15‐mmstrands
Tendon eccentricity at midspan (mm)
maximum for SLS 1A | σtop, dev < 0
maximum for SLS 1A | σbot, mid > ‐42 MPa
minimum for SLS 1B | σbot, mid < 0
minimum for SLS 1D | σbot, mid < 0
maximum for SLS 1C | σtop, dev < 0
maximum for SLS 1C | σbot, mid > ‐42 MPa
Stage II
Stage I
minimum for ULS 1D | Mr > Mf
0
25
50
75
100
125
150
175
200
225
250
275
300
325
350
950 1000 1050 1100 1150 1200 1250 1300 1350 1400
Tendon eccentricity at midspan (mm)
maximum for SLS 1A | σtop, dev < 0
maximum for SLS 1A | σbot, mid > ‐42 MPa
minimum for SLS 1B | σbot, mid < 0
minimum for SLS 1D | σbot, mid < 0
maximum for SLS 1C | σtop, dev < 0maximum for SLS 1C | σbot, mid > ‐42 MPa
Stage II
Stage I
minimum for ULS 1D | Mr > Mf
0
25
50
75
100
125
150
175
200
225
250
275
300
325
350
950 1000 1050 1100 1150 1200 1250 1300 1350 1400
Tendon eccentricity at midspan (mm)
maximum for SLS 1A | σtop, dev < 0
maximum for SLS 1A | σbot, mid > ‐42 MPa
minimum for SLS 1B | σbot, mid < 0
minimum for SLS 1D | σbot, mid < 0
maximum for SLS 1C | σtop, dev < 0
maximum for SLS 1C | σbot, mid > ‐42 MPa
Stage II
Stage I
minimum for ULS 1D | Mr > Mf
39
C
hapter 3
Versatility of the D
ouble-T B
ase Concept for S
imply S
upported Spa
ns

(a) (b) (c)
(d) (e) (f)
Figure 3.23 – Amounts of post-tensioning satisfying both serviceability and ultimate limit state criteria for (respectively)
section depths and spans of (a) 1095 mm, 20 m; (b) 1365 mm, 25 m; (c) 1640 mm, 30 m; (d) 2000 mm, 36.6 m (duplicate of
Figure 3.22d); (e) 2185 mm, 40 m; (f) 2460 mm, 45 m
0
25
50
75
100
125
150
175
200
225
250
275
300
325
350
350 400 450 500 550 600 650
Number of
15‐mm
strands
Tendon eccentricity at midspan (mm)
maximum for SLS 1A | σtop, dev < 0
maximum for SLS 1A | σbot, mid > ‐42 MPa
minimum for SLS 1B | σbot, mid < 0
minimum for SLS 1D | σbot, mid < 0
maximum for SLS 1C | σtop, dev < 0
maximum for SLS 1C | σbot, mid > ‐42 MPa
Stage II
Stage I
minimum for ULS 1D | Mr > Mf
0
25
50
75
100
125
150
175
200
225
250
275
300
325
350
550 600 650 700 750 800 850 900
Tendon eccentricity at midspan (mm)
maximum for SLS 1A | σtop, dev < 0
maximum for SLS 1A | σbot, mid > ‐42 MPa
minimum for SLS 1B | σbot, mid < 0
minimum for SLS 1D | σbot, mid < 0
maximum for SLS 1C | σtop, dev < 0
maximum for SLS 1C | σbot, mid > ‐42 MPa
Stage II
Stage I
minimum for ULS 1D | Mr > Mf
0
25
50
75
100
125
150
175
200
225
250
275
300
325
350
850 900 950 1000 1050 1100 1150
Tendon eccentricity at midspan (mm)
maximum for SLS 1A | σtop, dev < 0
maximum for SLS 1A | σbot, mid > ‐42 MPa
minimum for SLS 1B | σbot, mid < 0
minimum for SLS 1D | σbot, mid < 0
maximum for SLS 1C | σtop, dev < 0
maximum for SLS 1C | σbot, mid > ‐42 MPa
Stage II
Stage I
minimum for ULS 1D | Mr > Mf
0
25
50
75
100
125
150
175
200
225
250
275
300
325
350
950 1000 1050 1100 1150 1200 1250 1300 1350 1400
Numberof
15‐mmstrands
Tendon eccentricity at midspan (mm)
maximum for SLS 1A | σtop, dev < 0
maximum for SLS 1A | σbot, mid > ‐42 MPa
minimum for SLS 1B | σbot, mid < 0
minimum for SLS 1D | σbot, mid < 0
maximum for SLS 1C | σtop, dev < 0
maximum for SLS 1C | σbot, mid > ‐42 MPa
Stage II
Stage I
minimum for ULS 1D | Mr > Mf
0
25
50
75
100
125
150
175
200
225
250
275
300
325
350
1300 1350 1400 1450 1500 1550 1600
Tendon eccentricity at midspan (mm)
maximum for SLS 1A | σtop, dev < 0
maximum for SLS 1A | σbot, mid > ‐42 MPa
minimum for SLS 1B | σbot, mid < 0
minimum for SLS 1D | σbot, mid < 0
maximum for SLS 1C | σtop, dev < 0
maximum for SLS 1C | σbot, mid > ‐42 MPa
Stage II
Stage I
minimum for ULS 1D | Mr > Mf
0
25
50
75
100
125
150
175
200
225
250
275
300
325
350
1500 1550 1600 1650 1700 1750 1800
Tendon eccentricity at midspan (mm)
maximum for SLS 1A | σtop, dev < 0
maximum for SLS 1A | σbot, mid > ‐42 MPa
minimum for SLS 1B | σbot, mid < 0
minimum for SLS 1D | σbot, mid < 0
maximum for SLS 1C | σtop, dev < 0
maximum for SLS 1C | σbot, mid > ‐42 MPa
Stage II
Stage I
minimum for ULS 1D | Mr > Mf
C
hapter 3
Versatility of the D
ouble-T B
ase Concept for S
imply S
upported Spa
ns
40

Chapter 3 Versatility of the Double-T Base Concept for Simply Supported Spans
41
3.3.5 Results of Parametric Study
The main objectives of this parametric study were to determine the feasibility of the segmental
double-T as a design concept over a variety of spans and to develop a way to reduce the
sensitivity of the system to losses of prestress. The plots shown in Figure 3.22 and Figure 3.23
demonstrate clearly that the system is viable for the entire range of spans studied: 20 to 45 m,
and that valid variants of post-tensioning exist for all eleven combinations of span length and
section depth studied. Table 3.2 summarises the results in a different way, showing the range of
midspan tendon eccentricities and number of tendons that satisfy SLS and ULS criteria for each
combination of span and section depth. In all cases, limits on post-tensioning are governed by
SLS limits. The minimum number of tendons required for ULS is always less than that required
to eliminate tension in the bottom fibres of concrete at midspan under SLS conditions.
Table 3.2 – Range of bridge variants that satisfy all SLS and ULS criteria
Span length
(m)
Section depth (mm)
Midspan tendon eccentricity (mm)
Total number of strands
Minimum Maximum Minimum Maximum
20 1095 400 150 184
450 134 146
2000 1000 64 104
1350 50 52
25 1365 600 156 190
700 136 140
2000 1000 96 152
1367 74 76
30 1640 900 150 176
1000 136 142
2000 1000 136 206
1367 104 110
36.6 2000 1000 192 246 1367 144 164
40 2000 1000 224 270
1367 170 194
2185 1367 170 220
1513 154 184
45 2000 1000 268 310
1367 206 234
2460 1550 180 248
1726 166 226

Chapter 3 Versatility of the Double-T Base Concept for Simply Supported Spans
42
Conversely, this summary can be presented by selecting a specific number of strands in the
middle of the ranges listed in Table 3.2 for each variant and showing the amount that the tendons
can vary from the nominal stress after losses as has been done in Table 3.3.
Table 3.3 – Permissible range of variation from nominal post-tensioning force
Span length
(m)
Section depth (mm)
Midspan tendon
eccentricity (mm)
Selected number of
strands
Permissible stress in strands after losses (fraction of fpu)
Minimum after all losses(0.67fpu nominal)
Maximum after Stage II jacking(0.74fpu nominal)
20 1095 400 168 0.598 0.810
450 140 0.641 0.772
2000 1000 84 0.510 0.916 1350 52 0.644 0.740
25 1365 600 174 0.601 0.808
700 138 0.660 0.751
2000 1000 124 0.519 0.907 1367 76 0.652 0.740
30 1640 900 164 0.613 0.794
1000 140 0.651 0.751
2000 1000 172 0.530 0.886 1367 108 0.645 0.754
36.6 2000 1000 220 0.585 0.827 1367 154 0.626 0.788
40 2000 1000 248 0.605 0.806
1367 182 0.626 0.789
2185 1367 196 0.581 0.831 1513 170 0.607 0.801
45 2000 1000 290 0.619 0.791
1367 220 0.627 0.787
2460 1550 214 0.564 0.858 1726 196 0.567 0.853
In all cases, Stage I sensitivity to prestress losses can be reduced by lowering midspan tendon
eccentricities, as predicted. This is indicated by the widening of most of the Stage I envelopes
toward lower eccentricities on the plots above. The bottom limits of these envelopes (the
serviceability limit state criterion of no tensile stresses in the bottom concrete fibres at midspan)
are relatively flat, as are the bottom limits on the Stage II envelopes. This indicates that less
sensitivity to prestress losses can be achieved with the addition of relatively few strands. In
other words, a more robust system can be obtained for a small marginal cost. This is true for all
bridges except for the more slender 2000-mm-deep 40- and 45-m spans. These two variants are
relatively insensitive to the post-tensioning force (and consequently to the post-tensioning losses)

Chapter 3 Versatility of the Double-T Base Concept for Simply Supported Spans
43
for all midspan tendon eccentricities between 1000 and 1367 mm. Therefore, a midspan tendon
eccentricity toward the lower end of those studied is good practice for all variants of the double-
T, except for the 2000-mm-deep 40- and 45-m spans, for which it is unnecessary.
Beyond the validation of its two main hypotheses, this study drew out a number of other
interesting points regarding the double-T concept.
For shorter spans of the 2000-mm-deep sections studied, the range of tendon options is more
limited. The upper serviceability limit on number of strands changes. For shorter spans of 20
and 25 m, the number of strands is limited by tensile stresses in the top fibres at the deviators.
For the 45 m span, it is limited by compressive stresses in the bottom fibres at midspan. For
spans in between, and for all of the variants with 18.3:1 span-to-depth ratios, a combination of
the two criteria limits the number of strands that can be used, with tensile stresses in the top
fibres at the deviators limiting for less eccentric prestress and compressive stresses in the bottom
fibres at midspan limiting for more eccentric prestress. This effect can be summarised as
follows. For spans more slender than 20:1 (40 m long, 2000 mm deep), too much prestress
causes the structure to hog upward unstably and tensile stresses to occur at the top fibres of
concrete over the deviators. For spans less slender than 15:1 (30 m long, 2000 mm deep), this
hogging will be expressed as excessive compressive stresses in the bottom fibres instead of
tensile stresses in the top fibres.
Results for the 2000-mm-deep sections from 20 to 36.6 m in length illustrate an interesting
possibility. For these variants, the regions of valid numbers of Stage I and Stage II strands
overlap at lower midspan tendon eccentricities. A variant with a number of strands that fell
within this overlapping zone would satisfy all criteria for both Stage I and Stage II strands and
would therefore only require one stage of tendon stressing. Construction staging for such short-
span structures would be simplified.
For spans of 20 to 30 m for the constant span-to-depth ratio sections (all of which are shallower
than 2000 mm), the range of valid eccentricities was somewhat limited, but opened up for
smaller midspan tendon eccentricities. This suggests that these sections could benefit from
tendons at an eccentricity even less than the range studied.
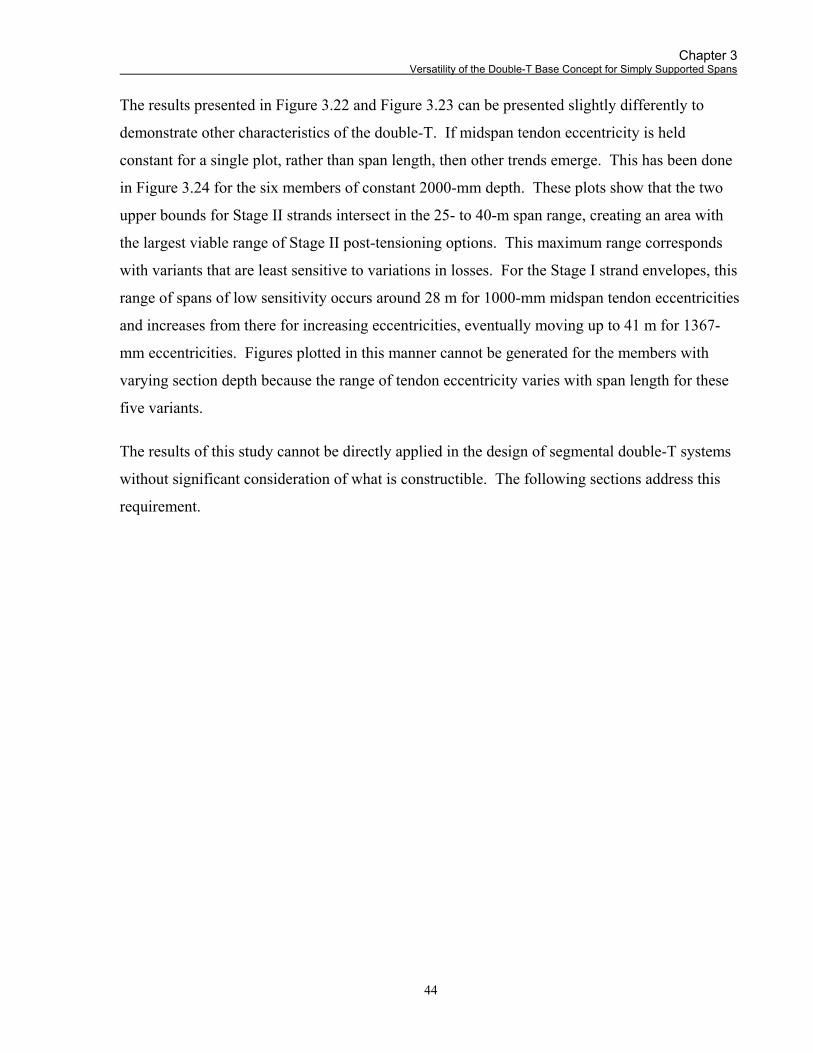
Chapter 3 Versatility of the Double-T Base Concept for Simply Supported Spans
44
The results presented in Figure 3.22 and Figure 3.23 can be presented slightly differently to
demonstrate other characteristics of the double-T. If midspan tendon eccentricity is held
constant for a single plot, rather than span length, then other trends emerge. This has been done
in Figure 3.24 for the six members of constant 2000-mm depth. These plots show that the two
upper bounds for Stage II strands intersect in the 25- to 40-m span range, creating an area with
the largest viable range of Stage II post-tensioning options. This maximum range corresponds
with variants that are least sensitive to variations in losses. For the Stage I strand envelopes, this
range of spans of low sensitivity occurs around 28 m for 1000-mm midspan tendon eccentricities
and increases from there for increasing eccentricities, eventually moving up to 41 m for 1367-
mm eccentricities. Figures plotted in this manner cannot be generated for the members with
varying section depth because the range of tendon eccentricity varies with span length for these
five variants.
The results of this study cannot be directly applied in the design of segmental double-T systems
without significant consideration of what is constructible. The following sections address this
requirement.
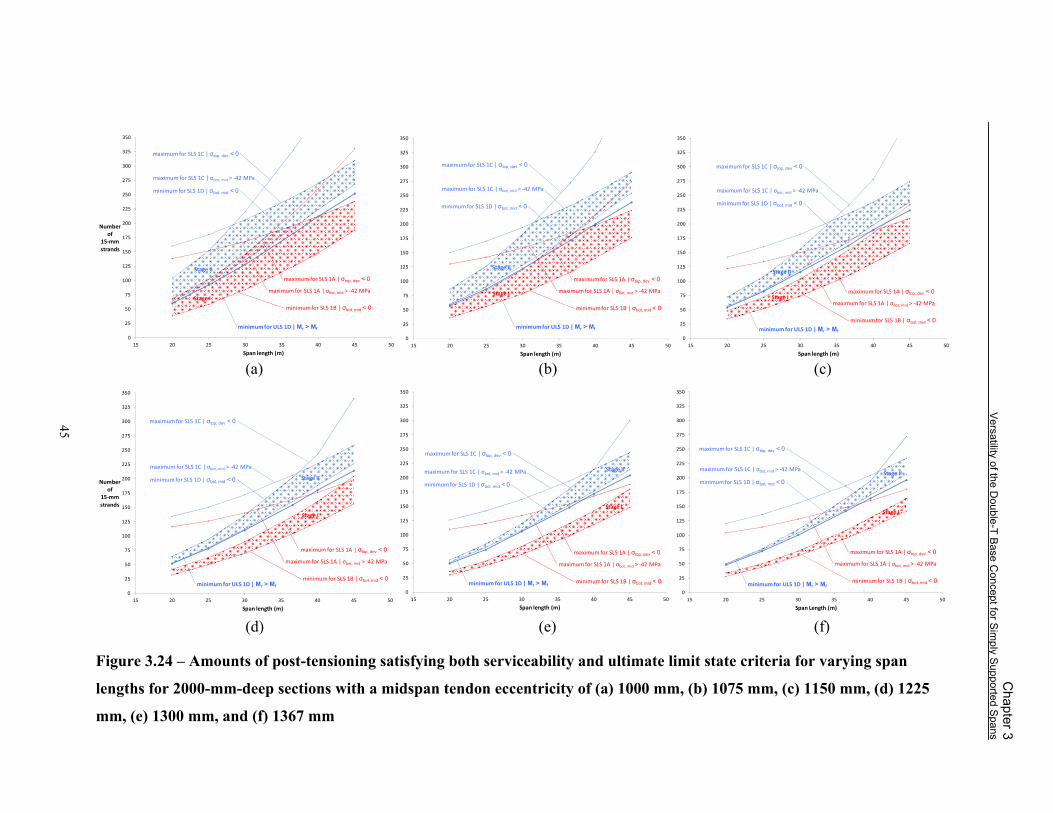
(a) (b) (c)
(d) (e) (f)
Figure 3.24 – Amounts of post-tensioning satisfying both serviceability and ultimate limit state criteria for varying span
lengths for 2000-mm-deep sections with a midspan tendon eccentricity of (a) 1000 mm, (b) 1075 mm, (c) 1150 mm, (d) 1225
mm, (e) 1300 mm, and (f) 1367 mm
0
25
50
75
100
125
150
175
200
225
250
275
300
325
350
15 20 25 30 35 40 45 50
Number of
15‐mmstrands
Span length (m)
maximum for SLS 1A | σtop, dev < 0
maximum for SLS 1A | σbot, mid > ‐42 MPa
minimum for SLS 1B | σbot, mid < 0
minimum for SLS 1D | σbot, mid < 0
maximum for SLS 1C | σtop, dev < 0
maximum for SLS 1C | σbot, mid > ‐42 MPa
Stage II
Stage I
minimum for ULS 1D | Mr > Mf
0
25
50
75
100
125
150
175
200
225
250
275
300
325
350
15 20 25 30 35 40 45 50
Numberof
15‐mmstrands
Span length (m)
maximum for SLS 1A | σtop, dev < 0
maximum for SLS 1A | σbot, mid > ‐42 MPa
minimum for SLS 1B | σbot, mid < 0
minimum for SLS 1D | σbot, mid < 0
maximum for SLS 1C | σtop, dev < 0
maximum for SLS 1C | σbot, mid > ‐42 MPa
Stage II
Stage I
minimum for ULS 1D | Mr > Mf0
25
50
75
100
125
150
175
200
225
250
275
300
325
350
15 20 25 30 35 40 45 50
Span length (m)
maximum for SLS 1A | σtop, dev < 0
maximum for SLS 1A | σbot, mid > ‐42 MPa
minimum for SLS 1B | σbot, mid < 0
minimum for SLS 1D | σbot, mid < 0
maximum for SLS 1C | σtop, dev < 0
maximum for SLS 1C | σbot, mid > ‐42 MPa Stage II
Stage I
minimum for ULS 1D | Mr > Mf
0
25
50
75
100
125
150
175
200
225
250
275
300
325
350
15 20 25 30 35 40 45 50
r
Span Length (m)
maximum for SLS 1A | σtop, dev < 0
maximum for SLS 1A | σbot, mid > ‐42 MPa
minimum for SLS 1B | σbot, mid < 0
minimum for SLS 1D | σbot, mid < 0
maximum for SLS 1C | σtop, dev < 0
maximum for SLS 1C | σbot, mid > ‐42 MPaStage II
Stage I
minimum for ULS 1D | Mr > Mf
45
C
hapter 3
Versatility of the D
ouble-T B
ase Concept for S
imply S
upported Spa
ns

Chapter 3 Versatility of the Double-T Base Concept for Simply Supported Spans
46
3.3.6 Selection of Section Depths and Midspan Tendon Eccentricities
To substantiate the results presented above and develop the double-T concept further, six specific
variants were chosen. The most slender variant was considered for each of the six span lengths.
For these six variants, a midspan tendon eccentricity was chosen that allowed for a maximum
tolerance to range in post-tensioning losses with a minimum number of strands, i.e., at the
eccentricity where the blue range of Stage II post-tensioning options was at its widest. This led
to the selection of the variants listed below in Table 3.4.
Table 3.4 – Selected double-T variants for further study
Span length
(m)
Section depth (mm)
Span-to-depth ratio
Midspan tendon eccentricity
(mm)
Minimum number of strands
20 1095 18.3:1 400 150 25 1365 18.3:1 600 156 30 1640 18.3:1 900 150
36.6 2000 18.3:1 1225 160 40 2000 20.0:1 1300 176 45 2000 22.5:1 1350 206
The configurations listed above not only satisfy all criteria for Stage II post-tensioning, but also
allow for a number of strands for Stage I post-tensioning that satisfies all related serviceability
criteria.
3.3.7 Preliminary Post-tensioning Anchorage Considerations
Systems with external tendons permit large numbers of strands in a section without the
restriction of fitting ducts within concrete and the related requirement for adequate concrete
cover. Proper fit of the required anchorages is necessary, however, at the ends of the member.
To prove that the numbers of strands listed in Table 3.4 can, indeed, be fit into their respective
bridge variants, end segment web cross-sections were drawn and outlines of the required tendon
anchorage spirals were overlaid on them. The end segments of sections were considered with
section depths of 1095, 1365, 1640, and 2000 mm and varying web widths. These overlays are
shown in Figure 3.25.
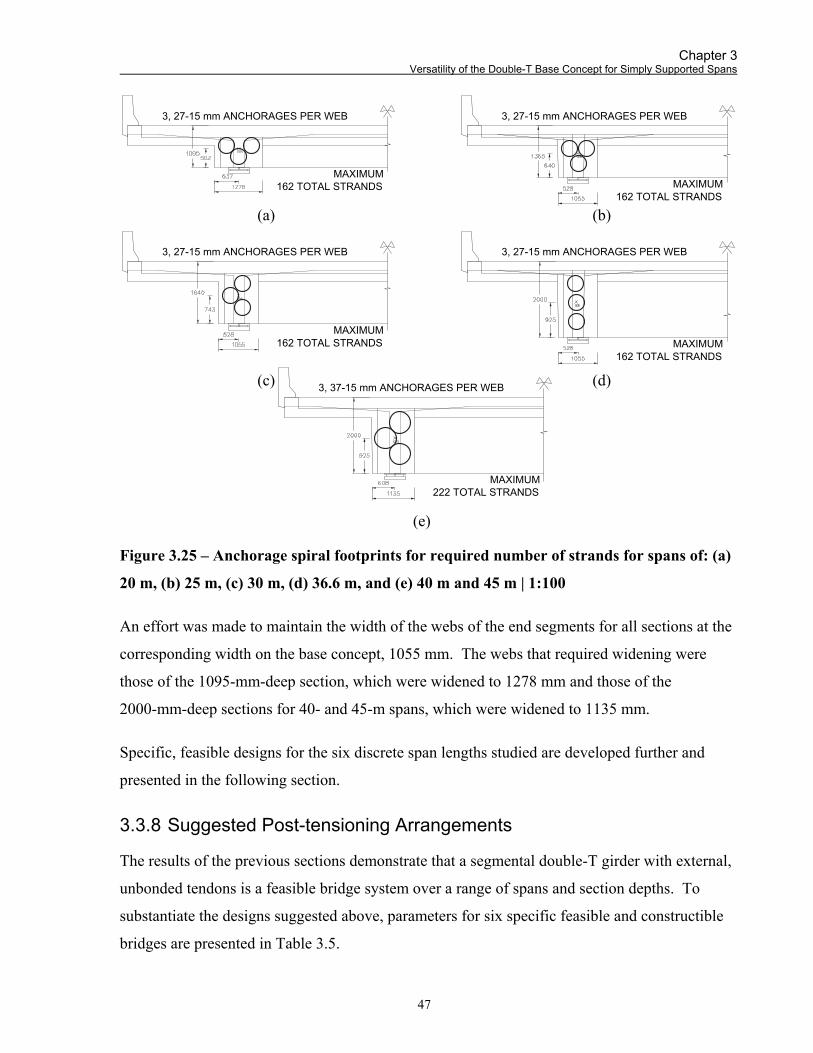
Chapter 3 Versatility of the Double-T Base Concept for Simply Supported Spans
47
3, 27-15 mm ANCHORAGES PER WEB
3, 27-15 mm ANCHORAGES PER WEB3, 27-15 mm ANCHORAGES PER WEB
3, 27-15 mm ANCHORAGES PER WEB
3, 37-15 mm ANCHORAGES PER WEB
MAXIMUM162 TOTAL STRANDS
MAXIMUM162 TOTAL STRANDS
MAXIMUM162 TOTAL STRANDS MAXIMUM
162 TOTAL STRANDS
MAXIMUM222 TOTAL STRANDS
(a) (b) (c) (d)
(e)
Figure 3.25 – Anchorage spiral footprints for required number of strands for spans of: (a)
20 m, (b) 25 m, (c) 30 m, (d) 36.6 m, and (e) 40 m and 45 m | 1:100
An effort was made to maintain the width of the webs of the end segments for all sections at the
corresponding width on the base concept, 1055 mm. The webs that required widening were
those of the 1095-mm-deep section, which were widened to 1278 mm and those of the
2000-mm-deep sections for 40- and 45-m spans, which were widened to 1135 mm.
Specific, feasible designs for the six discrete span lengths studied are developed further and
presented in the following section.
3.3.8 Suggested Post-tensioning Arrangements
The results of the previous sections demonstrate that a segmental double-T girder with external,
unbonded tendons is a feasible bridge system over a range of spans and section depths. To
substantiate the designs suggested above, parameters for six specific feasible and constructible
bridges are presented in Table 3.5.

Chapter 3 Versatility of the Double-T Base Concept for Simply Supported Spans
48
Table 3.5 – Feasible and constructible bridge variants
Span (m)
Section depth (mm)
Midspan tendon
eccentricity (mm)
Number of strands
(Stage I | Stage II)
Tendon arrangement
Stage I
Stage II
20 1095 400 100 | 150 2 x 2 x 25/27 + 2 x 25/27 tendons 25 1365 600 104 | 156 2 x 2 x 26/27 + 2 x 26/27 tendons 30 1640 900 100 | 150 2 x 2 x 25/27 + 2 x 25/27 tendons
36.6 2000 1225 108 | 160 2 x 2 x 27 + 2 x 26/27 tendons 40 2000 1300 120 | 176 2 x 2 x 30/37 + 2 x 28/37 tendons 45 2000 1350 148 | 206 2 x 2 x 37 + 2 x 29/37 tendons
3.3.9 Post-tensioning Details
3.3.9.1 Transition from Wide to Thin Webs
The location of the transition from wide (665 mm) to thin (285 mm) webs was governed by the
geometry of where the tendon ducts left the concrete of the webs. This transition was placed at
such a distance that the ducts would not pass through the longitudinal faces of the webs as
illustrated in Figure 3.26a and Figure 3.26b below, but would rather pass entirely through the
transverse face of the transition as illustrated in Figure 3.26c. In each of the illustrations, the
geometry of the ducts does not change; only the location of the transition changes.
(a) (b) (c)
Figure 3.26 – Determination of location of web width transition

Chapter 3 Versatility of the Double-T Base Concept for Simply Supported Spans
49
Table 3.6 below summarises the location of the transition for each design.
Table 3.6 – Location of web width transition
Span (m)
Distance from support to transition (mm)
20 3300 25 2740 30 3280
36.6 4000 40 4000 45 5300
3.3.9.2 Number of Segments
Each design was divided into segments that made for even lengths of all non-end segments. The
end segment lengths were chosen such that segments were as long as possible but did not exceed
60 t. Non-end segment lengths were selected such that they did not exceed 2800 mm and
weights did not exceed 60 t. Segment lengths were chosen such that deviators were placed at the
longitudinal centre of a segment and all thin-webbed interior segments were the same length.
Table 3.7 below summarises the segment lengths chosen.
Table 3.7 – Segment divisions
Span (m)
Number of segments
End segment length
(mm)
Wide-webbed segment length
(mm)
Deviator segment length
(mm)
Standard interior segment length
(mm)
20 10 2600 2200 2000 2100 25 11 2500 2640 2360 2400 30 14 2500 2020 2280 2300
36.6 14 2500 2800 2800 2800 40 17 2540 2255 1800 2700 45 20 2500 1895 2210 2500
3.3.9.3 End Diaphragm Location
The force due to the inward lateral deviation of the tendons from their anchorages in the webs to
the deviators pulls the webs laterally inward at the ends of the bridge. This inward force must be
resisted by a diaphragm. If the centerline of the diaphragm is not aligned with the intersection of
the lines of action of the tensile force in the tendons and the compressive force in webs, then it
must be designed to resist not only compression, but bending as well. An example of a

Chapter 3 Versatility of the Double-T Base Concept for Simply Supported Spans
50
diaphragm properly positioned is illustrated in Figure 3.27 below, which shows the lines of
action of all three forces intersecting at the same point.
Figure 3.27 – Design considerations for end diaphragm placement | 1:100
The intersection point of the tendons and webs is dictated by fitting of the anchorages but the
diaphragm location can be chosen freely and so was positioned where it needs only to resist
compression. For all variants, a diaphragm 600 mm thick resists the factored compressive forces
and does so in pure compression when located 600 mm from the end of the girder.
3.3.10 Finalised Preliminary Concepts
The concepts described in general in previous sections become concrete when conceptual
drawings for the six variants are presented as shown in Figure 3.28 through Figure 3.33 on the
following pages.
C WEBL
CLSUPPORT
CLDIAPHRAGM

Chapter 3 Versatility of the Double-T Base Concept for Simply Supported Spans
51
3.4 Conclusions
Feasible, constructible segmental double-T options exist for all spans from 20 to 45 m. Span-to-
depth ratios of up to 22.5:1 are feasible, and it is possible that even more slender bridges could
be constructed.
Reducing the midspan tendon eccentricity does indeed reduce sensitivity to post-tensioning
losses with a minimum sensitivity realised between spans of 28 and 38 m for midspan tendon
eccentricities of 1000 to 1225 mm. For shorter spans, the upper efficiency limit on eccentricity
is 1200 mm; for longer spans, it is 1300 mm.
The possibility exists for single-stage stressing for shorter spans.
The construction of multi-span bridges using the single-span designs presented in this chapter is
discussed in the following chapter.
Chapter 3 Versatility of the Double-T Base Concept for Simply Supported Spans
52
Figure 3.28 – Conceptual design of precast segmental double-T for 20-m spans
ELEVATION
SECTION AT MIDSPAN
PLAN
SECTION AT END
1:200
1:100
1:200
1:100

Chapter 3 Versatility of the Double-T Base Concept for Simply Supported Spans
53
Figure 3.29 – Conceptual design of precast segmental double-T for 25-m spans
ELEVATION
SECTION AT MIDSPAN
PLAN
SECTION AT END
1:200
1:100
1:200
1:100

Chapter 3 Versatility of the Double-T Base Concept for Simply Supported Spans
54
Figure 3.30 – Conceptual design of precast segmental double-T for 30-m spans
ELEVATION
SECTION AT MIDSPAN
PLAN
SECTION AT END
1:200
1:100
1:200
1:100

Chapter 3 Versatility of the Double-T Base Concept for Simply Supported Spans
55
Figure 3.31 – Conceptual design of precast segmental double-T for 36.6-m spans
ELEVATION
SECTION AT MIDSPAN
PLAN
SECTION AT END
1:200
1:100
1:200
1:100
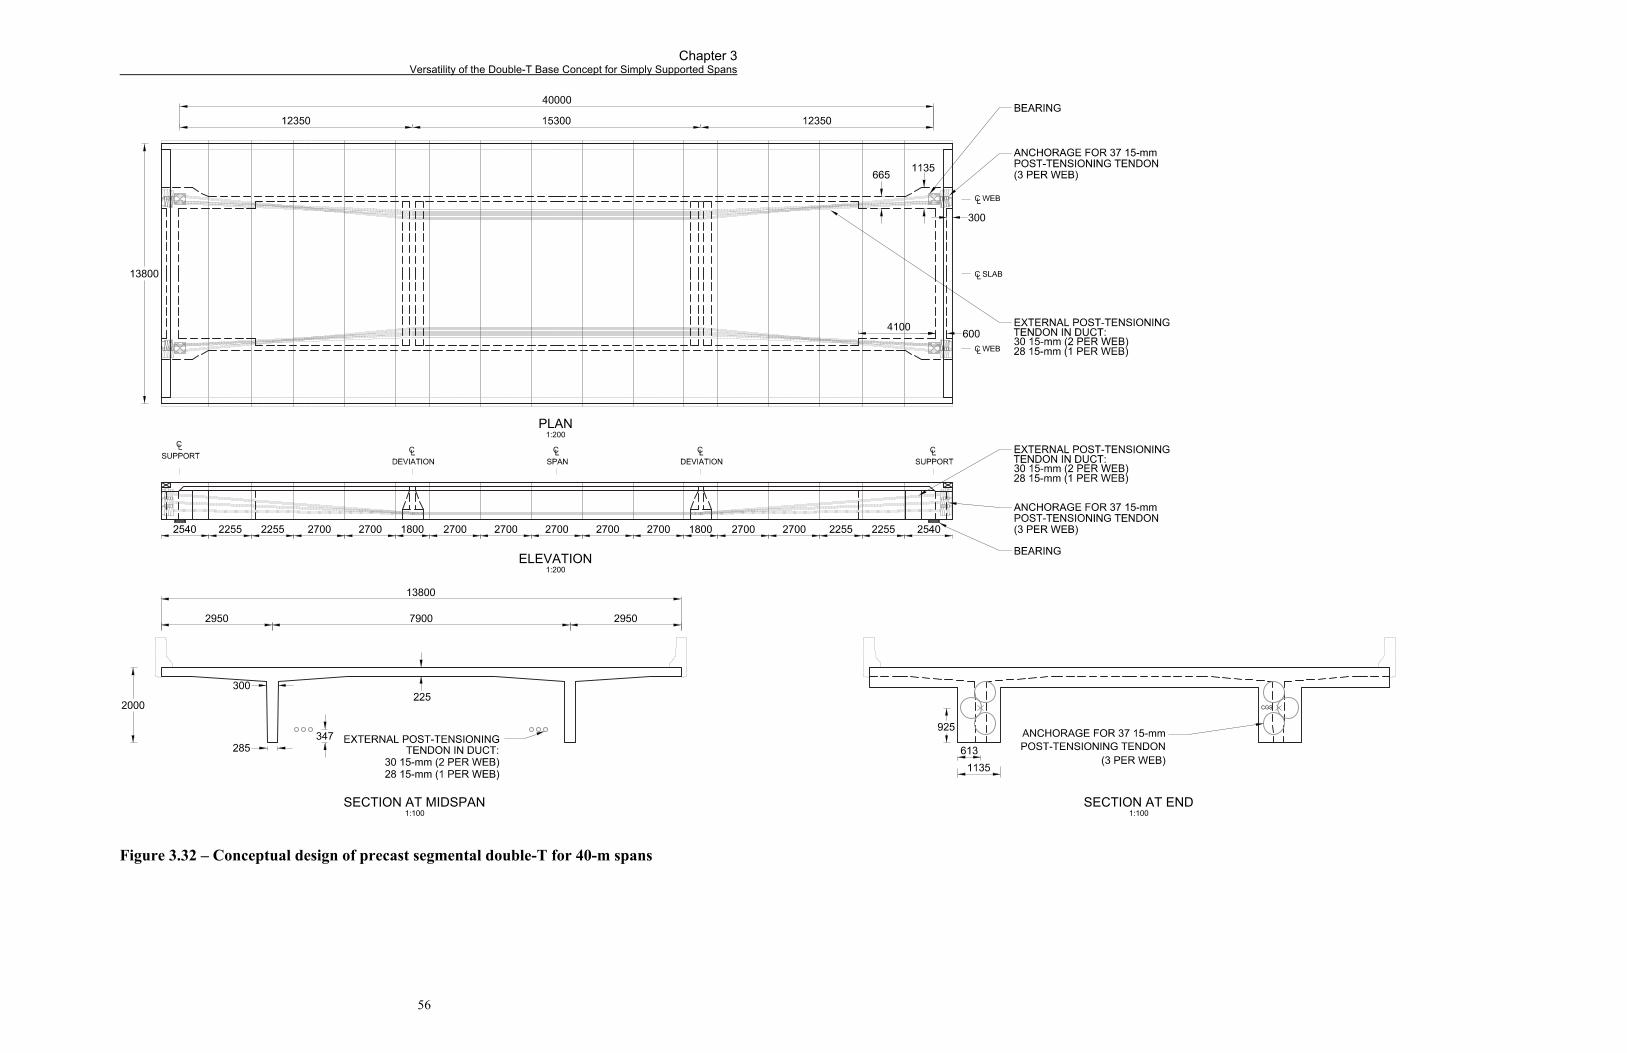
Chapter 3 Versatility of the Double-T Base Concept for Simply Supported Spans
56
Figure 3.32 – Conceptual design of precast segmental double-T for 40-m spans
ELEVATION
SECTION AT MIDSPAN
PLAN
SECTION AT END
1:200
1:100
1:200
1:100
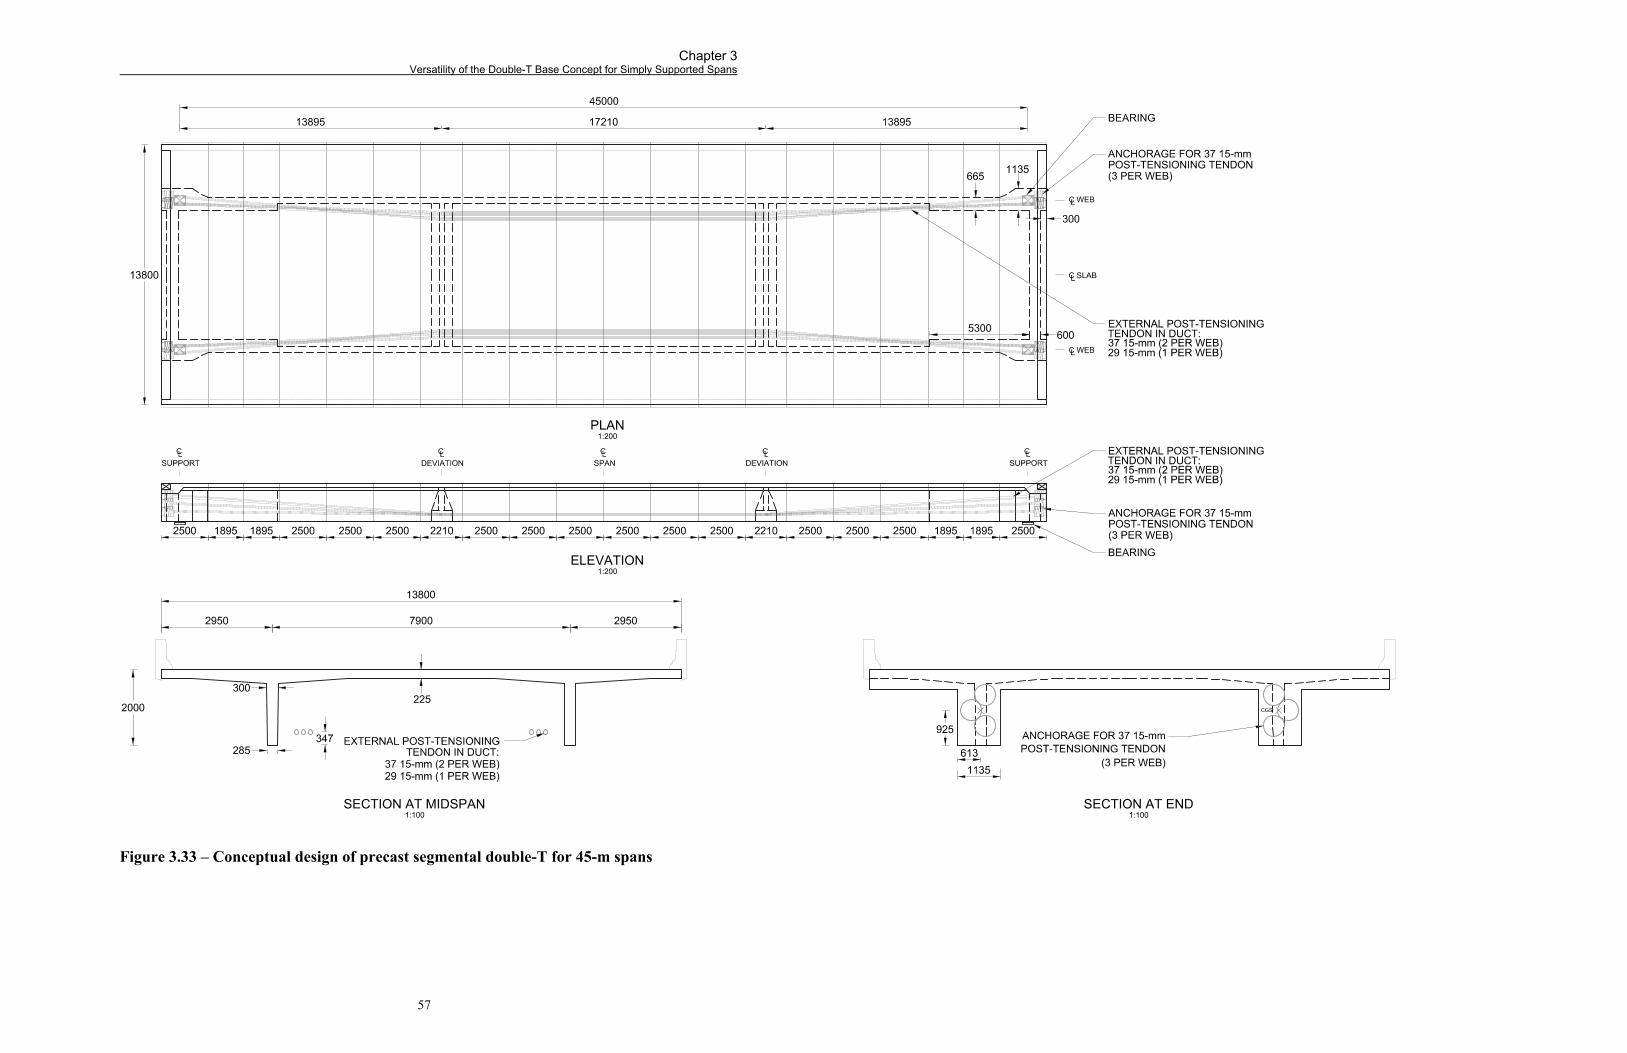
Chapter 3 Versatility of the Double-T Base Concept for Simply Supported Spans
57
Figure 3.33 – Conceptual design of precast segmental double-T for 45-m spans
ELEVATION
SECTION AT MIDSPAN
PLAN
SECTION AT END
1:200
1:100
1:200
1:100

58
Chapter 4 Application of the Precast Segmental Double-T to
Multi-span Structures
4.1 Motivation to Apply Double-T to Multi-span Structures
Many highway overpasses are multi-span structures. To be useful, any alternative to the
conventional system used for short spans would have to be applicable to multi-span bridges.
This chapter demonstrates that the double-T base concept originally presented by Li (2010) can
be modified in ways that allow for durable multi-span alternatives for a wide variety of highway
overpass structures.
4.1.1 Traditional Solution – Expansion Joints
A simple approach to making the base concept multi-span is to lay simply supported spans end to
end and install expansion joints between them at all supports. Expansion joints, however,
usually deteriorate faster than other bridge components and are often the cause of shorter service
lives for bridges. A 1983 FHWA survey showed that, in a five-year period, 60 % of bridge
expansion joints studied in the United States were leaking water and the other 40 % had
problems that would shorten their service lives (Fincher, 1983). Expansion joint damage can
lead to differential movements between sides of a joint, which can in turn cause bumps that
exacerbate damage to the joint. Not only do expansion joints usually require replacement at least
Chapter 4 Application of the Precast Segmental Double-T to Multi-span Structures
59
once during the service life of a bridge, problems with the joints themselves can lead to
maintenance and durability issues with other components. For example, if the neoprene seal and
waterproofing connection to the expansion joint, which can never be maintained watertight
(Menn, 1990), leak, then bridge components below them such as bearings, bearing seats, and
ballast walls / end diaphragms can be exposed to deck runoff, which hastens their degradation
(Zia and Caner, 1998). Furthermore, because of their location, these components are often
difficult to access and inspect. In essence, for bridges with expansion joints over the supports,
the weakest point in the structure from a penetration perspective is placed above the point of
worst consequence.
In addition to these durability issues, expansion joints often fail to perform their intended role. If
their seals break and they fill with debris, they no longer accommodate the translations or
rotations for which they were intended (Thippeswamy et al., 2002).
To avoid the problems listed above, the CHBDC (Cl. 2.3.2.5.1, 2006) states that, “Wherever
practical, expansion and/or fixed joints in decks shall be avoided or placed in the approach
pavements.” It is therefore desirable to connect adjacent spans of the proposed double-T system
in some way. One proposed method would be to construct adjacent spans one at a time and
leave them essentially simply supported. End rotations at each support would be accommodated
with a connecting slab. This option is discussed in Section 4.2. Another alternative is to make
the system fully continuous. All spans for this option would be constructed at the same time and
the bridge would be designed to resist the resulting large negative moments at supports. This
alternative is discussed in Section 4.3.
4.2 Simply Supported Spans with Linking Slabs
4.2.1 Linking Slabs
One solution to replace expansion joints that has been used successfully in many rehabilitation
applications is linking slabs. A linking slab is a thin slab that is attached to the ends of the decks
of two adjacent spans that allows the ends to rotate and displace as though the attached members
were essentially simply-supported. Two types of linking slab exist: debonded linking slabs,

Chapter 4 Application of the Precast Segmental Double-T to Multi-span Structures
60
which are long and extend into the adjacent spans and accommodate both translations and
rotations; and flexible linking slabs, which are much shorter and only accommodate rotations2.
Lam et al. (2008) note that the Ministry of Transportation of Ontario has been using linking slabs
in the rehabilitation of existing bridges since the mid-1990’s following the success had by the
City of Toronto with linking slabs used to replace expansion joints on the Gardiner Expressway
in the late-1980’s. The performance of these slabs led the Ministry to develop guidelines for
their design in 2001 (Lam et al., 2008).
In this section, designs for flexible linking slabs connecting adjacent spans of each of the six
design variants in Chapter 3 are presented.
4.2.1.1 Axial or Flexural Members?
The literature on linking slabs is inconclusive as to whether they act primarily as axial or as
flexural members. They have been described as purely flexural (Lam et al., 2008), purely axial
(Okeil and ElSafty, 2005), and a combination of both (Caner and Zia, 1998). Generally for all
types of linking slab, the axial component of the deformation induced in the slab is influenced by
the support conditions of the adjacent members.
The flexible linking slabs designed in this thesis are considered only to be subjected to imposed
rotation and not imposed elongation for three reasons: (1) All spans in the connected system will
be on elastomeric bearings, essentially rollers, allowing them to translate horizontally; (2) The
elastomeric bearings will act more as rollers than pins and allow span ends to rotate about their
neutral axes; and (3) The neutral axis of the double-T section is quite high and so imposed end
rotations in the spans adjacent to the flexible linking slabs will induce mostly flexural
deformation and very little axial deformation.
2 Much of the literature on this subject does not make a firm distinction between these two systems, referring to both
simply as flexible linking slabs or flexible links; however, the distinction makes subsequent discussion in this thesis clearer.

Chapter 4 Application of the Precast Segmental Double-T to Multi-span Structures
61
NEUTRAL AXIS
OF GIRDER
ΔR ΔH
The first reason presented obviously eliminates horizontal reactions at supports and, therefore,
longitudinal tensile stresses in the flexible linking slabs. An explanation of how the second and
third reasons eliminate axial deformations follows.
To explain why roller supports reduce axial deformation in a flexible linking slab, consider two
adjacent simply supported members attached by a linking slab. When the members are subjected
to positive bending, the ends subsequently rotate and induce an axial deformation in the attached
linking slab. This deformation is greater if the linking slab is farther away from the point of
rotation, hence for the same magnitude of rotation, a pin connection (whose point of rotation is
the pin at the bottom of the member) induces more axial deformation than a roller (whose point
of rotation is the neutral axis at the end of the member), which is closer to the linking slab (Okeil
and ElSafty, 2005). Figure 4.1 shows two girder ends with a linking slab between them modeled
as a stick with pinned ends. It can be seen from this figure that axial deformation is (a) least in
an linking slab connecting two roller-supported members and is equal to 2∆R, (b) greatest in an
linking slab connecting two pin/hinge-supported members and is equal to 2∆H, and (c)
somewhere in between in a linking slab connecting a roller- and a pin/hinge-supported member,
and is equal to ∆R + ∆H.
(a) (b) (c) Figure 4.1 – Effect of support conditions on linking slab behaviour with (a) two roller
supports, (b) two pin/hinge supports, and (c) one of each type of support (adapted from
Okeil and ElSafty, 2005)
NEUTRAL AXIS
OF GIRDER
ΔR ΔR
NEUTRAL AXIS
OF GIRDER
ΔH ΔH

Chapter 4 Application of the Precast Segmental Double-T to Multi-span Structures
62
To explain why a high neutral axis reduces axial deformation in a flexible linking slab, consider
an end of a simply supported beam on a roller. When the beam bends, the end rotates about the
beam’s neutral axis. A linking slab connected to the roller-supported end of the beam undergoes
axial deformations proportional to the horizontal distance between the neutral axis of the beam
and that of the linking slab. The farther between these two neutral axes, the greater the axial
deformation imposed on the flexible linking slab for a given end rotation of the members. In
Figure 4.2, it can be seen that the end displacement, ∆R, of the linking slab is greater when the
neutral axis of the attached beam is lower (a) than if it is higher (b).
(a) (b)
Figure 4.2 – Effect of distance between neutral axes on linking slab behaviour with (a)
lower neutral axis and (b) higher neutral axis (adapted from Okeil and ElSafty, 2005)
To connect adjacent spans of a multi-span double-T system, it is proposed that all intermediate
supports be elastomeric bearings that will act as rollers and that all spans be connected with short
flexible linking slabs. These two design features will ensure that axial deformations in the
flexible linking slabs are minimised. This means that there will be no horizontal fixity within the
structure. Calculations, shown in Appendix C, were performed to check the response of the
structure to longitudinal wind and braking forces. The resulting horizontal demand was well
below the horizontal shear capacity for corresponding elastomeric bearings for all span length
from 20 to 45 m, and so the lack of horizontal fixity is deemed not to be of concern for this
structure.
4.2.2 Design Criteria
The design of linking slabs is only governed by serviceability limit state criteria: cracking must
be limited under service loading. The response of the linking slab under ultimate loading is not
critical. It is assumed that at the ultimate limit state, the slab is allowed to crack severely and
ΔR FLEXIBLELINKING SLAB
FLEXIBLELINKING SLAB
NEUTRAL AXIS
OF GIRDER
NEUTRAL AXIS
OF GIRDER
ΔR
Chapter 4 Application of the Precast Segmental Double-T to Multi-span Structures
63
that these cracks and the failure of the linking slab do not create stability or safety concerns
because the area considered sits on the abutments or piers of the bridge.
4.2.3 Preliminary Design
The flexible linking slab for the modified double-T base concept is a cast-in-place slab. It will
connect two adjacent double-T spans. These spans will be post-tensioned with tendons
dimensioned for simply supported spans as described in Chapter 3. To ensure that the length of
the gap between spans and the end rotations are as close to what they will be during the service
life of the bridge, the flexible linking slab is to be poured after the precast concrete bridge
segments have been placed and fully stressed and the barrier walls and wearing surface have
been installed. This necessitates that a gap be left in the asphalt paving over the supports where
the linking slab is to be installed. After it is installed, waterproofing can be installed and an
asphalt patch can be paved over it. The slab covers most of the width of the bridge, with 300
mm left on either side for barrier walls as shown in Figure 4.3. The preliminary design processes
outlined below determines requirements for the slab length, thickness, and material properties.

Chapter 4 Application of the Precast Segmental Double-T to Multi-span Structures
64
Figure 4.3 – Parameters to be designed for linking slab
4.2.4 Demand | Imposed Rotations
The six specific designs of varying span length presented in Section 3.3.10 were considered for
calculations of demand outlined in this section. The rotations considered in the design of the
flexible linking slab were those due only to service live loads. Translations due to creep,
shrinkage, and temperature change would all be accommodated by horizontal translation of
adjacent spans on elastomeric bearings. A summary of rotations imposed on the linking slab for
six discrete span lengths is given in Table 4.1.
The imposed rotations can be seen to decrease and then increase again with increasing span
length. This is because from 20 to 36.6 m, the depth of the adjacent double-T spans increases,
increasing their stiffness and reducing end rotations. From 36.6 to 45 m, section depth remains
constant but live loads increase and so end rotations increase.
ELEVATION
PLAN
C WEBL
C WEBL
CLSUPPORT
CLSUPPORT
LENGTH OF LINKING SLAB
CONCRETE TYPE
THICKNESS OF LINKING SLAB

Chapter 4 Application of the Precast Segmental Double-T to Multi-span Structures
65
Table 4.1 – Rotations imposed on linking slab due to service live loads
Span (m)
Rotation imposed at both ends(rad)
Depth (mm)
20 1095 0.0107 25 1365 0.0103 30 1640 0.0098
36.6 2000 0.0086 40 2000 0.0104 45 2000 0.0123
To resist these end rotations, a novel, durable material will be used: ultra high-performance fibre-
reinforced concrete (UHPFRC). This material is described in the following section before
describing the actual finalised designs of the flexible linking slab.
4.2.5 Ultra High-performance Fibre-reinforced Concrete
Fibre-reinforced concrete in its modern form is about 50 years old, but the idea of mixing fibres
with brittle materials to carry tensile forces is not new. Susetyo (2009) lists several examples of
this idea through history. Modern fibre-reinforced concrete differs from regular concretes in that
it can exhibit a ductile post-peak behaviour. A subgroup of fibre-reinforced concretes is high
performance fibre-reinforced cement composites (HPFRCC). Due to the high amount of fibres
that these materials contain and several other factors discussed in Section 4.2.5.1, they exhibit a
strain hardening post-peak behaviour. UHPFRC is a further subgroup of this material. It differs
from HPFRCC in that it contains a dense matrix and, as a result, has a very low permeability.
For this reason, it is suitable for use in areas of exposure to de-icing chemicals and other
detrimental effects such as in bridge superstructures.
UHPFRC used without reinforcing steel is an excellent material for use in a flexible linking slab.
It has been noted that maximum tensile strains of up to 0.01 are achievable using slurry
infiltrated fibre concrete (Naaman, 2000) and 0.025 using UHPFRC (Jungwirth and Muttoni,
2004). These values are around 100 times greater than what can be achieved with conventional
concretes without fibres. Furthermore, large strains are attainable without large crack openings,
i.e., both crack spacing and crack widths can be maintained relatively small (Jenq and Shaw,
1986; Jungwirth and Muttoni, 2004; and Leutbecher and Fehling, 2009). When compared to a
member made of regular conventionally reinforced concrete undergoing axial deformation, a

Chapter 4 Application of the Precast Segmental Double-T to Multi-span Structures
66
member (with or without conventional reinforcement) that is composed of a properly designed
fibre-reinforced concrete mix can achieve the maximum tensile strain in the concrete matrix at
many more locations before the steel bridging any single crack reaches its yield strain. The
stress is carried across cracks by fibres much the same way as it is by conventional reinforcing
steel.
4.2.5.1 Cracking Behaviour in Fibre-reinforced Concrete
It is generally accepted that there are three main zones along the length (not width) of a crack in
fibre-reinforced concrete. These zones are best categorised by Visalvanich and Naaman (1983)
as the stress free zone (near the concrete surface, where nothing bridges the gap), the
pseudoplastic zone (where fibres bridge the gap and carry stresses through tension, bond with the
matrix, and bending of the matrix in the case of inclined fibres), and the process zone (where the
crack is currently forming within the matrix and the fibres have not yet engaged to carry more
stress than the surrounding matrix).
Fibre reinforced concretes can be either strain hardening or strain softening; their behaviour after
first cracking is dependent on fibre strength compared to concrete matrix strength and on the
volume fraction of fibres. Fibre reinforced concretes that strain harden are generally
distinguished as HPFRCCs. As tensile deformations increase in HPFRCCs and fibres elongate
and pull out at cracks, more stress is carried by the member with increasing strain, i.e., it strain
hardens. In regular fibre-reinforced concretes, there are not enough fibres bridging a crack to
carry more load than what was originally carried by the uncracked concrete matrix, fibres fail
before they pull out, and there is a sharp drop in stress after the peak stress, i.e., the concrete
strain softens (Visalvanich and Naaman, 1983). A comparison of the stress-strain relationships
of strain hardening and strain softening fibre-reinforced concretes is shown in Figure 4.4.
Whether a given mix is strain hardening or softening depends on the volume of fibres, their yield
strength, and their bond strength with the surrounding matrix. Specifically, the determining
factor is whether the bond holding all fibres bridging a crack is strong enough to carry enough
force to crack the matrix at another location before fibre pullout or yield. If it is high enough,
then strain hardening occurs.
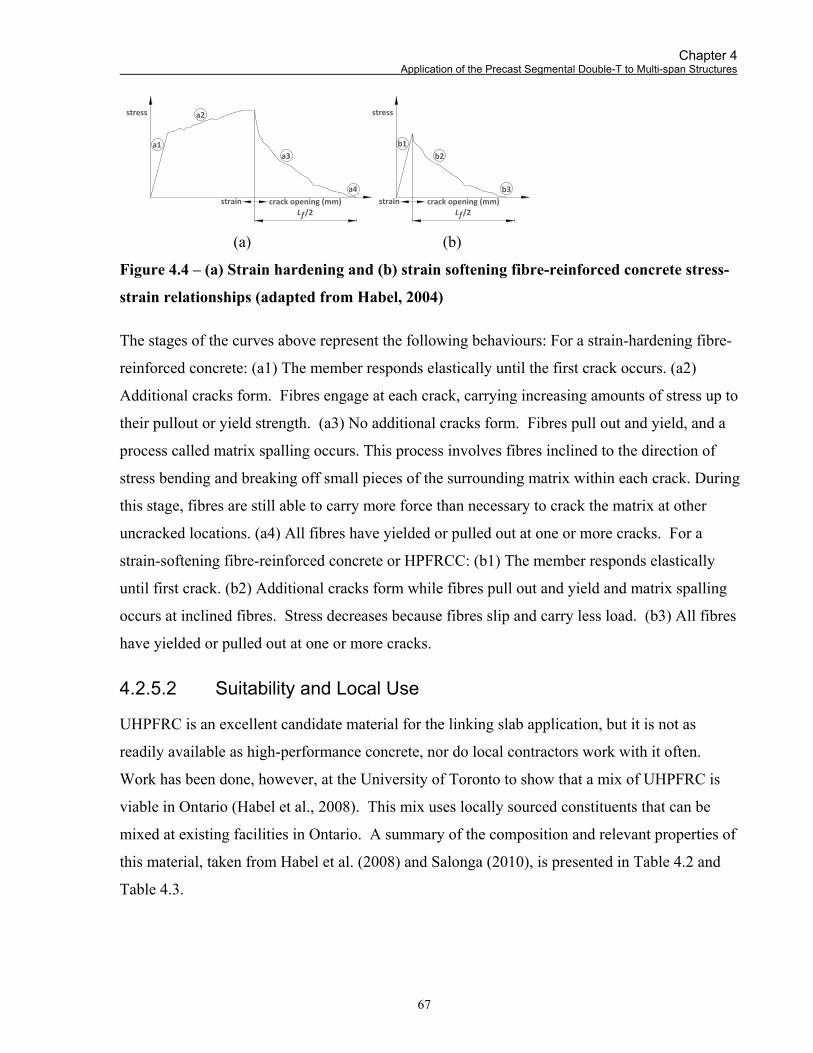
Chapter 4 Application of the Precast Segmental Double-T to Multi-span Structures
67
(a) (b)
Figure 4.4 – (a) Strain hardening and (b) strain softening fibre-reinforced concrete stress-
strain relationships (adapted from Habel, 2004)
The stages of the curves above represent the following behaviours: For a strain-hardening fibre-
reinforced concrete: (a1) The member responds elastically until the first crack occurs. (a2)
Additional cracks form. Fibres engage at each crack, carrying increasing amounts of stress up to
their pullout or yield strength. (a3) No additional cracks form. Fibres pull out and yield, and a
process called matrix spalling occurs. This process involves fibres inclined to the direction of
stress bending and breaking off small pieces of the surrounding matrix within each crack. During
this stage, fibres are still able to carry more force than necessary to crack the matrix at other
uncracked locations. (a4) All fibres have yielded or pulled out at one or more cracks. For a
strain-softening fibre-reinforced concrete or HPFRCC: (b1) The member responds elastically
until first crack. (b2) Additional cracks form while fibres pull out and yield and matrix spalling
occurs at inclined fibres. Stress decreases because fibres slip and carry less load. (b3) All fibres
have yielded or pulled out at one or more cracks.
4.2.5.2 Suitability and Local Use
UHPFRC is an excellent candidate material for the linking slab application, but it is not as
readily available as high-performance concrete, nor do local contractors work with it often.
Work has been done, however, at the University of Toronto to show that a mix of UHPFRC is
viable in Ontario (Habel et al., 2008). This mix uses locally sourced constituents that can be
mixed at existing facilities in Ontario. A summary of the composition and relevant properties of
this material, taken from Habel et al. (2008) and Salonga (2010), is presented in Table 4.2 and
Table 4.3.
strain crack opening (mm)
stressstress
strain crack opening (mm)L /2f L /2f
a1
a2
a3
a4
b2
b3
b1

Chapter 4 Application of the Precast Segmental Double-T to Multi-span Structures
68
Table 4.2 – University of Toronto ultra high-performance fibre-reinforced concrete
composition (adapted from Habel et al., 2008)
Constituent
Weight (kg/m3)
Percent by mass
GU cement 967 37.2 % white silica fume, 15-18 m2/g 251 9.6 % sand, grain size < 0.5 mm 675 25.9 % steel fibres, straight, lf = 10 mm, df = 0.2 mm 430 16.5 % (5.5 % by volume) superplasticizer, polycarboxylate, 35 % solid content by mass 35 1.3 % Water 244 9.4 %
Total 2602 100.0 %
Table 4.3 – University of Toronto ultra high-performance fibre-reinforced concrete
properties (adapted from Habel et al., 2008)
Property Value
Compressive strength (28-day) 128 MPa Tensile strength (100-day) 24.4 MPa Tensile cracking stress 7.0 MPa * Rapid chloride permeability (28-day, ASTM C1202) 72 C Resistance to freeze-thaw cycles Extremely high * from Salonga, 2010.
The extreme durability of this material is due primarily to its high strength and the high density
of its matrix. These properties enable two other characteristics that are important to concrete in
bridges subjected to winter conditions and deicing chemicals.
1. The measured rapid chloride permeability result is exceptionally low. It is well below
values achieved with conventional high performance concretes as evinced by a study
from Bickley and Mitchell (2001). This study surveyed high performance concrete
specifications in Canada and noted an average specified value of 1000 C or less (Bickley
and Mitchell, 2001). A permeability of less than one tenth of this value has been achieved
with the University of Toronto UHPFRC mix and other similar mixes (Habel et al.,
2008).
2. The freeze-thaw cycle resistance of UHPFRC is considered to be very high for a number
of reasons. Foremost is the high tensile strength of the concrete, which resists the
expansive effect of ice formation in pores. Also relevant is the fact that UHPFRC self

Chapter 4 Application of the Precast Segmental Double-T to Multi-span Structures
69
desiccates relatively quickly and so the water available to expand within pores is low and
usually below the critical saturation of 91 % relative humidity (Habel et al., 2008).
4.2.6 Maximum strains in University of Toronto Ultra High-performance Fibre-reinforced concrete
Habel (2004) and Salonga (2010) demonstrate that the University of Toronto UHPFRC can
undergo a maximum tensile strain of about 0.01; but as discussed below, in order to remain
reasonably linear elastic, it should be limited to a strain of approximately 0.0025.
Salonga (2010) presents results of modulus of rupture tests performed at the University of
Toronto. In these tests, three beams 150 x 150 x 900 mm cast of University of Toronto
UHPFRC were loaded in four-point bending, with loads applied at the third points of the beams
as shown in Figure 4.5, adapted from Salonga (2010). A linear variable differential transformer
was mounted at three-quarter depth of the section to measure average longitudinal strains as the
beam was loaded. A more detailed explanation of the test setup and procedure is given in
Salonga (2010). Results from these tests are shown in Figure 4.6 below.
Figure 4.5 – Schematic of test setup for University of Toronto UHPFRC beam modulus of
rupture tests
APPLIED LOAD
LINEAR VARIABLEDIFFERENTIALTRANSDUCER
300
38
112150
300300
900

Chapter 4 Application of the Precast Segmental Double-T to Multi-span Structures
70
Figure 4.6 – Results of University of Toronto UHPFRC beam modulus of rupture tests
The results above show the average strain in the concrete at the depth of the linear variable
differential transducer. From these results, the maximum strain in the extreme tensile fibres of
the member can be inferred for the initial linear elastic portion of the graph by multiplying
strains by two factors. First, the strains are multiplied by a factor of 2, assuming the neutral axis
is at the centre of the beam and so strains in the extreme tensile fibres are twice those measured
at a three-quarter depth. This yields the average strain in the extreme fibres of the beam.
Second, the strains are multiplied by a factor of . To obtain the maximum strain in the extreme
fibres, the strains in the beam while linear elastic are assumed to follow the shape shown in
Figure 4.7 below, increasing from zero at the ends to a maximum, constant value between the
load points. The maximum strain in such a trapezoidal shape, εmax, would correspond to times
the average strain, εav.
The maximum strain in the extreme tensile fibres is thus 2 times those measured by the
linear variable differential transducer.
0
10
20
30
40
50
60
70
80
90
0.000 0.001 0.002 0.003 0.004 0.005 0.006 0.007 0.008 0.009 0.010
Load atthirdpoints (kN)
Average strain at three‐quarter depth
Beam 1
Beam 2
Beam 3

Chapter 4 Application of the Precast Segmental Double-T to Multi-span Structures
71
Figure 4.7 – Assumed strains in extreme tensile fibres of University of Toronto UHPFRC
beams
These assumptions are valid for the beams while they remain linear elastic. Because the beams
exhibit very slow transitions from the uncracked to the cracked state while multiple microcracks
develop with increasing load, these assumptions can be applied with reasonable accuracy even
when the beams have been loaded slightly beyond their initial cracking strength. Multiplying the
strains obtained by an overall factor of yields the maximum strains in the extreme tensile fibres
shown plotted in Figure 4.8 below.
It can be seen from these results that a maximum tensile strain due to flexure of approximately
0.0025 can be imposed on University of Toronto UHPFRC with no significant permanent
damage to the material. Indeed, for the current application, it is reasonable to assume that even
more maximum deformation is possible because the strains being imposed are due to an imposed
rotation from adjacent spans and not imposed moments. In essence, this means the application is
controlled by displacement and cracks formed at the maximum imposed rotation are not widened
further due to subsequent impositions of this rotation.
εavεmax

Chapter 4 Application of the Precast Segmental Double-T to Multi-span Structures
72
Figure 4.8 – Maximum extreme fibre strains in University of Toronto UHPFRC beam
modulus of rupture tests
Following the results outlined above, the flexible linking slabs were designed to accommodate
strains due to rotation only, and so were dimensioned to a maximum thickness and a minimum
length such that tensile strains were accommodated without plastic deformation in the slab.
Using a tensile strain limit of 0.0025, the parameters of slab thickness and length were varied to
determine optimal values for these dimensions. Constructability criteria dictated that slabs be
made thick enough to be suitably durable. A lower limit of 75 mm was set on slab thickness to
promote a random distribution of fibre orientation. An upper limit of 1500 mm was set on slab
length to limit the amount of material placed and the associated cost. The results of the
parametric study are summarised in Figure 4.9 below, in which maximum tensile strains due to
imposed rotations (which differ for each span) are shown plotted against the varied dimensions.
The results of this study were used to set reasonable dimensions for slabs for the six bridge
variants that would ensure the flexible linking slabs remained linear elastic while undergoing the
maximum imposed rotations. These dimensions are shown below in Table 4.4.
0
10
20
30
40
50
60
70
80
90
0.000 0.001 0.002 0.003 0.004 0.005 0.006 0.007 0.008 0.009 0.010
Load atthirdpoints(kN)
Strain in extreme tensile fibres at midspan
Beam 1
Beam 2
Beam 3

Chapter 4 Application of the Precast Segmental Double-T to Multi-span Structures
73
(a) (b)
Figure 4.9 – Maximum tensile strains in flexible linking slabs as a function of (a) length,
with constant thickness of 100 mm, and (b) thickness, with constant length of 400 mm
Table 4.4 – Flexible linking slab dimensions
Span (m)
Length (mm)
Thickness (mm)
Maximum tensile strain due to imposed rotation
20 400 90 0.0024 25 375 90 0.0025 30 350 90 0.0025
36.6 325 90 0.0024 40 375 90 0.0025 45 450 90 0.0025
The required lengths of flexible linking slab shown in the table above decrease with increasing
adjacent span length for spans from 20 to 36.6 m and then increase from 36.6 to 45 m. This
follows the trend in imposed end rotations, which vary as a function of the stiffness of the
adjacent spans and imposed live load, as described in Section 4.2.4.
These flexible linking slabs accommodate only rotations between adjacent spans. Translations
due to service conditions are accommodated by allowing the adjacent spans to move. These
translations still require that some type of expansion joint be present in the entire bridge system,
but this can be placed at the end of an approach slab where expansion joint leakage results in the
0.0000
0.0005
0.0010
0.0015
0.0020
0.0025
0.0030
200 400 600 800
Maximumstrain intop fibres
Length (mm)Flexible linking slab:
40 60 80 100 120 140
Thickness (mm)
45‐m span
20‐m span
25‐m and 40‐m spans
30‐m span
36.6‐m span

Chapter 4 Application of the Precast Segmental Double-T to Multi-span Structures
74
seepage of water into the underlying soil and not in the exposure of underlying bridge hardware
to deicing chemicals.
The bearings required to accommodate these translations were dimensioned and are summarised
below in Table 4.5. The bearings selected were chosen from the AGOM catalogue (2009) and
are all Type 5 elastomeric bearings with a specified bearing strength of 15 N/mm2. Smaller
bearings are possible with an increased bearing strength, but the trade-off for this added strength
is the ratio of height of elastomer to height of bearing, i.e., horizontal translation capacity is
sacrificed for smaller bearing area.
Table 4.5 – Selected short elastomeric bearings for two-span system
Span (m)
ULS weight per
bearing (kN)
Required area
(mm2)
SLS imposed horizontal translation
(mm)
Dimensions of selected
bearing (mm)
Height of selected bearing (mm)
Height of elastomer
(mm)
20 1842 122 813 25.2 350 x 450 76 44 25 2254 150 247 34.3 350 x 450 91 55 30 2667 177 832 51.8 400 x 500 121 77
36.6 3111 207 418 60.1 400 x 600 151 99 40 3300 219 999 69.6 400 x 600 181 121 45 3468 231 217 71.0 400 x 600 181 121
This table is for bridges with two adjacent spans in a configuration shown in Figure 4.10a below.
For bridges with four adjacent spans, like the configuration shown in Figure 4.10b, horizontal
translations at the abutments are greater and require larger, taller bearings such as those listed in
Table 4.6 below. All of these bearings can be accommodated physically under the widened webs
of the end segments.
(a)
(b) Figure 4.10 – Configurations of flexible linking slabs and bearings for (a) two- and (b) four-
span bridges
EXPANSION JOINTEXPANSION JOINTAPPROACH SLAB FLEXIBLE LINKING SLABAPPROACH SLAB
SHORTELASTOMERICBEARING
SHORTELASTOMERICBEARINGS
SHORTELASTOMERICBEARING
EXPANSION JOINTEXPANSION JOINTAPPROACH SLABAPPROACH SLAB
FLEXIBLE LINKING SLAB FLEXIBLE LINKING SLAB FLEXIBLE LINKING SLAB
SHORTELASTOMERICBEARINGS
SHORTELASTOMERICBEARINGS
SHORTELASTOMERICBEARINGS
TALLELASTOMERICBEARING
TALLELASTOMERICBEARING
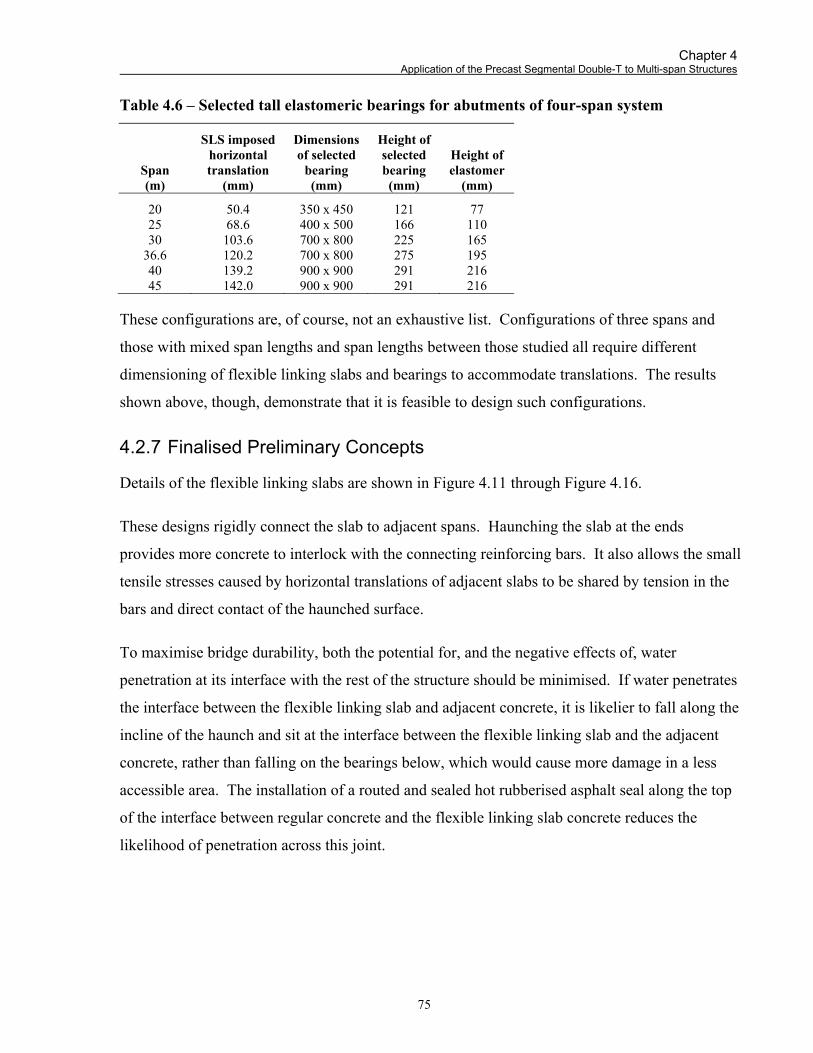
Chapter 4 Application of the Precast Segmental Double-T to Multi-span Structures
75
Table 4.6 – Selected tall elastomeric bearings for abutments of four-span system
Span (m)
SLS imposed horizontal translation
(mm)
Dimensions of selected
bearing (mm)
Height of selected bearing (mm)
Height of elastomer
(mm)
20 50.4 350 x 450 121 77 25 68.6 400 x 500 166 110 30 103.6 700 x 800 225 165
36.6 120.2 700 x 800 275 195 40 139.2 900 x 900 291 216 45 142.0 900 x 900 291 216
These configurations are, of course, not an exhaustive list. Configurations of three spans and
those with mixed span lengths and span lengths between those studied all require different
dimensioning of flexible linking slabs and bearings to accommodate translations. The results
shown above, though, demonstrate that it is feasible to design such configurations.
4.2.7 Finalised Preliminary Concepts
Details of the flexible linking slabs are shown in Figure 4.11 through Figure 4.16.
These designs rigidly connect the slab to adjacent spans. Haunching the slab at the ends
provides more concrete to interlock with the connecting reinforcing bars. It also allows the small
tensile stresses caused by horizontal translations of adjacent slabs to be shared by tension in the
bars and direct contact of the haunched surface.
To maximise bridge durability, both the potential for, and the negative effects of, water
penetration at its interface with the rest of the structure should be minimised. If water penetrates
the interface between the flexible linking slab and adjacent concrete, it is likelier to fall along the
incline of the haunch and sit at the interface between the flexible linking slab and the adjacent
concrete, rather than falling on the bearings below, which would cause more damage in a less
accessible area. The installation of a routed and sealed hot rubberised asphalt seal along the top
of the interface between regular concrete and the flexible linking slab concrete reduces the
likelihood of penetration across this joint.

Figure 4.11 – Conceptual design of flexible linking slab for adjacent 20-m spans
76
C
hapter 4
Application of the P
recast Segm
enta
l Double-T
to Multi-span S
tructures

Figure 4.12 – Conceptual design of flexible linking slab for adjacent 25-m spans
77
C
hapter 4
Application of the P
recast Segm
enta
l Double-T
to Multi-span S
tructures

Figure 4.13 – Conceptual design of flexible linking slab for adjacent 30-m spans
78
C
hapter 4
Application of the P
recast Segm
enta
l Double-T
to Multi-span S
tructures

Figure 4.14 – Conceptual design of flexible linking slab for adjacent 36.6-m spans
79
C
hapter 4
Application of the P
recast Segm
enta
l Double-T
to Multi-span S
tructures

Figure 4.15 – Conceptual design of flexible linking slab for adjacent 40-m spans
80
C
hapter 4
Application of the P
recast Segm
enta
l Double-T
to Multi-span S
tructures

Figure 4.16 – Conceptual design of flexible linking slab for adjacent 45-m spans
81
C
hapter 4
Application of the P
recast Segm
enta
l Double-T
to Multi-span S
tructures

Chapter 4 Application of the Precast Segmental Double-T to Multi-span Structures
82
4.3 Spans Made Continuous Over Supports
An alternative method to eliminate expansion joints is to make a multispan bridge that is fully
continuous over its supports. This eliminates the need to deal with relative displacements of
adjacent spans and imposes a new challenge to be overcome: the system must be designed to
resist negative moments over the piers. This section of the thesis describes the design of a
continuous system of adjacent 20- to 45-m spans based on the original simply supported double-
T system. For this design alternative, tendons are made continuous over the piers and are only
anchored at abutments. This allows the webs at intermediate supports to remain relatively
narrow when compared to conventional span-by-span segmental bridges, because room for
anchorages is not required.
Heavy diaphragms are not required for this continuous system because the tendons are not being
anchored at the supports and so do not require anchorage over them. Also, tendons are not being
deviated horizontally and so heavy diaphragms are not needed at the supports to resist the
compressive horizontal component of the tendon forces. Diaphragms are not needed in these
areas for load sharing, either, because the rigid pier supporting both webs prevents the webs from
moving relative to one another. Diaphragms are only required to deviate the tendons over the
supports and resist tensile forces due to tendons not being directly over supports. The deviator
diaphragms within the spans are not altered from previous concepts.
To prove that this concept will work over the range of spans considered, only systems of two
adjacent spans of 20, 36.6, and 45 m will be designed. The feasibility of designing other systems
with more spans and other span lengths within this range can be inferred from these designs.
4.3.1 Design Criteria
At the serviceability limit state, the concrete double-T section is required to remain linear elastic
in compression and not undergo any tension so as to not open any segmental joints. For both
positive and negative bending, this means that the no tension and linear elastic design criteria
listed in Section 2.4.1 apply. For negative bending, the stresses in the top extreme fibres are
required to remain compressive and the stresses in the bottom fibres are required to remain

Chapter 4 Application of the Precast Segmental Double-T to Multi-span Structures
83
below 0.6f΄c, or 42 MPa. At the ultimate limit state, the section is required to resist negative
moments without crushing concrete.
4.3.2 Preliminary Design
A perspective projection of the proposed general arrangement of the pier segment for the
continuous system is shown in Figure 4.17 below.
Figure 4.17 – Continuous double-T pier segment
Designs of bridges with two adjacent spans of 20, 36.6, and 45 m are considered in this section.
The post-tensioning arrangements for the simply-supported spans from Chapter 3 are used for
the purposes of these continuous designs except for the 45-m span, for which the number of
strands was increased from 206 to 222. This increase did not necessitate any change in
anchorage hardware because the anchorages for this bridge variant were not at full capacity.
Tendon details are as listed in Table 4.7.
Table 4.7 – Tendon details for continuous configurations
Span (m)
Number of strands
Eccentricity of tendons over supports
(mm)
20 150 168 36.6 160 417 45 206 267

Chapter 4 Application of the Precast Segmental Double-T to Multi-span Structures
84
In a continuous system it might seem intuitive to bring the post-tensioning tendons as high as
possible over the piers in order to reduce their eccentricity and the resulting imposed negative
moment. This causes a related effect, however: increased secondary moment due to prestress
increases positive moments in the adjacent spans. To reduce this effect, tendons are brought up
over the supports, but not to their minimum possible eccentricity.
4.3.3 Demand | Imposed Moments
The two-span bridges were loaded according to the Canadian Highway Bridge Design Code
(CSA, 2006).
4.3.3.1 Dead and Superimposed Dead Loads
Dead and superimposed dead loads were multiplied by a load factor of 1.00 for the serviceability
limit state. At the ultimate limit state, the weight of the precast concrete girder was multiplied by
a load factor of 1.10, the weight of the cast-in-place concrete barriers by 1.20, and that of the
asphalt wearing surface by a load factor of 1.50.
4.3.3.2 Live Loads
For each of the six systems of two adjacent spans, flexural responses to both the CL-625 truck
and lane loads were determined. Then, as for the single span systems, responses under live loads
in both two and three design lanes were considered.
To account for the statistical unlikelihood of all lanes being occupied by traffic at once, multi-
lane loading reduction factors specified in the CHBDC were applied to all live loads.
To account for the increased vertical loads applied by vehicles travelling over uneven surfaces,
the dynamic load allowance specified in the CHBDC was also applied to the CL-625 truck loads,
but not the lane loads.
Truck placements that produced the most severe positive moments within the span and the most
severe negative moment over the support were considered. For positive moment, the CL-625
truck load produced the most severe effects in all bridges. For negative moment, the lane load,
with the truck at a slightly different location, produced the most severe effect.
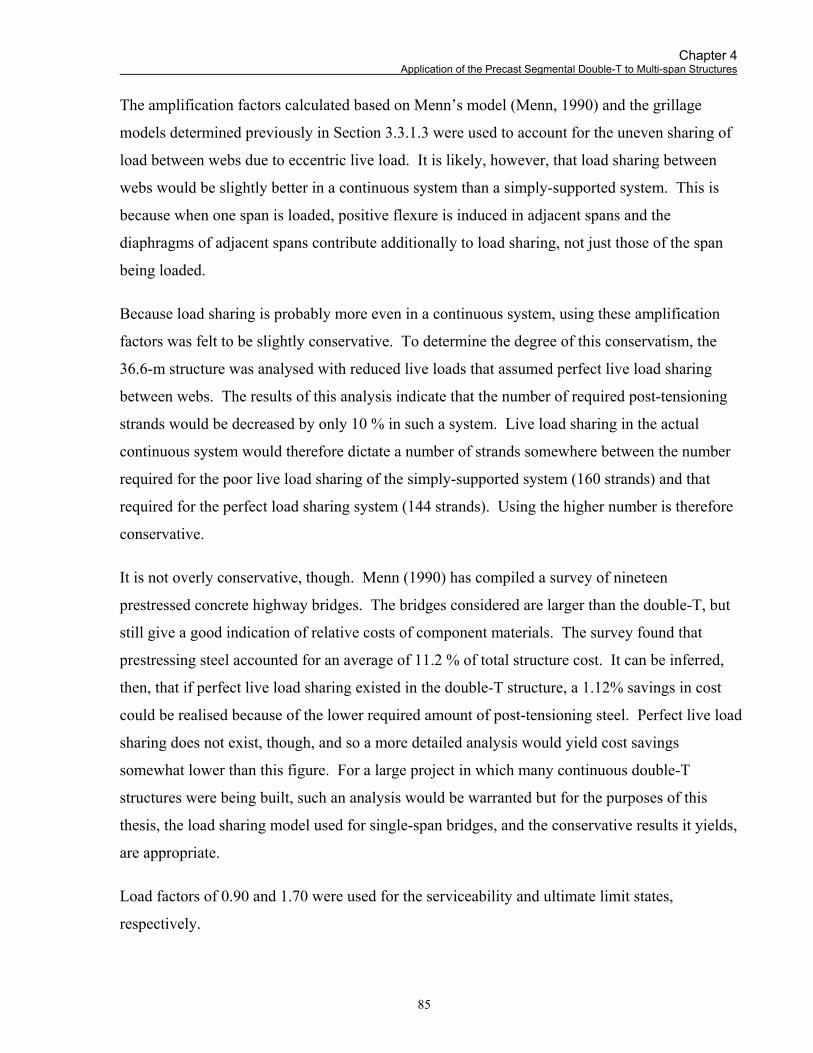
Chapter 4 Application of the Precast Segmental Double-T to Multi-span Structures
85
The amplification factors calculated based on Menn’s model (Menn, 1990) and the grillage
models determined previously in Section 3.3.1.3 were used to account for the uneven sharing of
load between webs due to eccentric live load. It is likely, however, that load sharing between
webs would be slightly better in a continuous system than a simply-supported system. This is
because when one span is loaded, positive flexure is induced in adjacent spans and the
diaphragms of adjacent spans contribute additionally to load sharing, not just those of the span
being loaded.
Because load sharing is probably more even in a continuous system, using these amplification
factors was felt to be slightly conservative. To determine the degree of this conservatism, the
36.6-m structure was analysed with reduced live loads that assumed perfect live load sharing
between webs. The results of this analysis indicate that the number of required post-tensioning
strands would be decreased by only 10 % in such a system. Live load sharing in the actual
continuous system would therefore dictate a number of strands somewhere between the number
required for the poor live load sharing of the simply-supported system (160 strands) and that
required for the perfect load sharing system (144 strands). Using the higher number is therefore
conservative.
It is not overly conservative, though. Menn (1990) has compiled a survey of nineteen
prestressed concrete highway bridges. The bridges considered are larger than the double-T, but
still give a good indication of relative costs of component materials. The survey found that
prestressing steel accounted for an average of 11.2 % of total structure cost. It can be inferred,
then, that if perfect live load sharing existed in the double-T structure, a 1.12% savings in cost
could be realised because of the lower required amount of post-tensioning steel. Perfect live load
sharing does not exist, though, and so a more detailed analysis would yield cost savings
somewhat lower than this figure. For a large project in which many continuous double-T
structures were being built, such an analysis would be warranted but for the purposes of this
thesis, the load sharing model used for single-span bridges, and the conservative results it yields,
are appropriate.
Load factors of 0.90 and 1.70 were used for the serviceability and ultimate limit states,
respectively.

Chapter 4 Application of the Precast Segmental Double-T to Multi-span Structures
86
4.3.3.3 Temperature Effects
The effects of temperature must be considered at serviceability limit states for a continuous
system. A temperature differential across the section induces moment in a two-span system due
to restraint at the middle support. The resulting bending moment diagram shape is triangular
with a maximum over the support. The differential considered was a “hot on top” differential
across the 225-mm depth of the deck slab. The self-equilibrating stress distributions and
resulting imposed moment are shown in Figure 4.18. A load factor of 0.80 was used for the
serviceability limit state when calculating positive moment demand. Temperature effects were
not applied when considering negative moment demand as they reduced the total applied
moment.
Figure 4.18 – Temperature differentials and resulting imposed moments in continuous
system
4.3.3.4 Secondary Moment due to Prestress
Prestressing induces a positive secondary moment in a statically indeterminate system such as a
multi-span continuous bridge. In a two-span system, the resulting bending moment diagram
shape is triangular with a maximum over the support. This moment must be considered at both
the serviceability and ultimate limit states. A load factor of 1.00 was used for serviceability limit
states and 0.95 for ultimate limit states.
+1.873
-3.300
SELF-EQUILIBRATINGSTRESS DISTRIBUTION (MPa)SECTION
RESULTINGMOMENT (kNm)
-1.848
-2.880+2.064

Chapter 4 Application of the Precast Segmental Double-T to Multi-span Structures
87
4.3.4 Capacity | Serviceability Limit State
For serviceability limit states, sectional resistance was considered using an uncracked section.
All concrete sections considered resist service loads without undergoing any tension and while
remaining entirely linear elastic. As an example, Figure 4.19 and Figure 4.20 show analyses for
positive and negative moment, respectively, including all imposed factored bending moments.
The positive moment analysis shown in Figure 4.19 includes the truck load and temperature
effects. The negative moment analysis shown in Figure 4.20 includes the lane load and does not
include temperature effects as these would reduce negative moments. Details of all calculations
performed for each sectional analysis can be found in Appendix D.
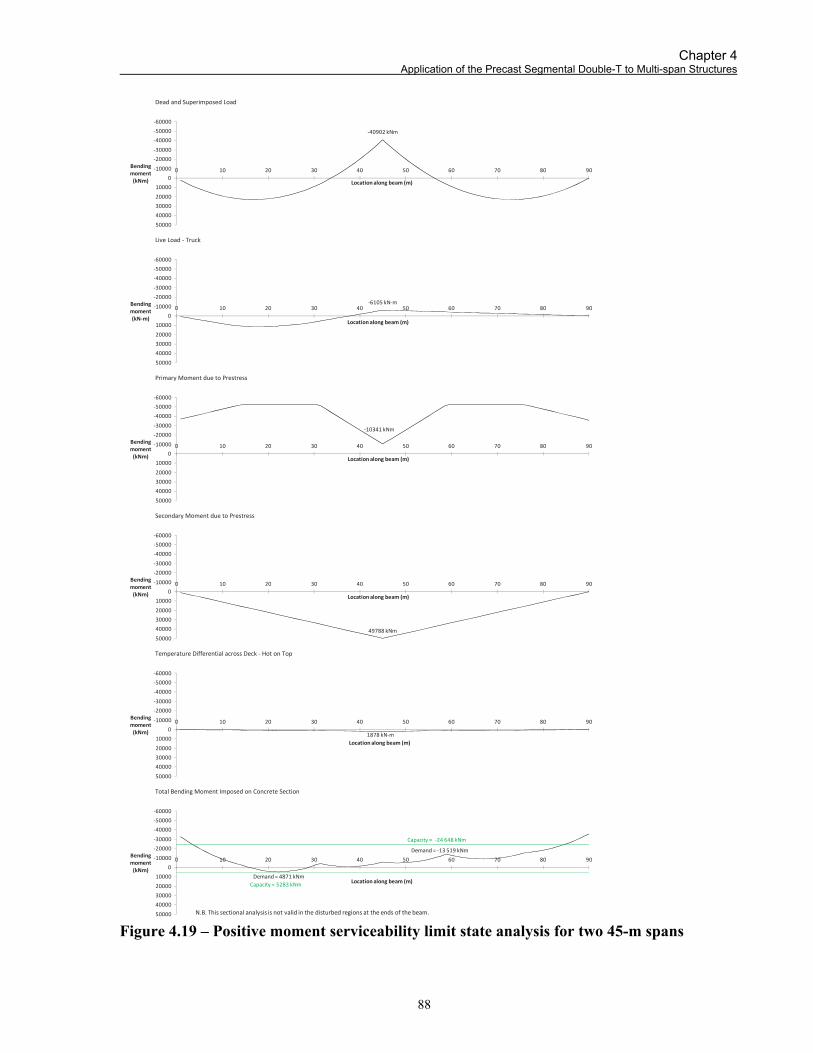
Chapter 4 Application of the Precast Segmental Double-T to Multi-span Structures
88
Figure 4.19 – Positive moment serviceability limit state analysis for two 45-m spans
Dead and Superimposed Load
Live Load Truck
Primary Moment due to Prestress
Secondary Moment due to Prestress
Temperature Differential across Deck Hot on Top
Total Bending Moment Imposed on Concrete Section
40902 kNm
60000
50000
40000
30000
20000
10000
0
10000
20000
30000
40000
50000
0 10 20 30 40 50 60 70 80 90Bendingmoment(kNm) Locationalong beam (m)
6105 kN m
60000
50000
40000
30000
20000
10000
0
10000
20000
30000
40000
50000
0 10 20 30 40 50 60 70 80 90Bendingmoment(kN m)
Locationalong beam (m)
10341 kNm
60000
50000
40000
30000
20000
10000
0
10000
20000
30000
40000
50000
0 10 20 30 40 50 60 70 80 90Bendingmoment(kNm) Locationalong beam (m)
49788 kNm
60000
50000
40000
30000
20000
10000
0
10000
20000
30000
40000
50000
0 10 20 30 40 50 60 70 80 90Bendingmoment(kNm) Locationalong beam (m)
1878 kN m
60000
50000
40000
30000
20000
10000
0
10000
20000
30000
40000
50000
0 10 20 30 40 50 60 70 80 90Bendingmoment(kNm)
Locationalong beam (m)
Demand = 4871 kNm
Demand = 13 519 kNm
Capacity = 5283 kNm
Capacity = 24 648 kNm
60000
50000
40000
30000
20000
10000
0
10000
20000
30000
40000
50000
0 10 20 30 40 50 60 70 80 90Bendingmoment(kNm)
Locationalong beam (m)
N.B. This sectional analysis is not valid in the disturbed regions at the ends of the beam.

Chapter 4 Application of the Precast Segmental Double-T to Multi-span Structures
89
Figure 4.20 – Negative moment serviceability limit state analysis for two 45-m spans
Dead and Superimposed Load
Live Load Lane
Primary Moment due to Prestress
Secondary Moment due to Prestress
Total Bending Moment Imposed on Concrete Section
40902 kNm
60000
50000
40000
30000
20000
10000
0
10000
20000
30000
40000
50000
0 10 20 30 40 50 60 70 80 90Bendingmoment(kNm) Locationalong beam (m)
9070 kNm
60000
50000
40000
30000
20000
10000
0
10000
20000
30000
40000
50000
0 10 20 30 40 50 60 70 80 90Bendingmoment(kNm) Locationalong beam (m)
10341 kNm
60000
50000
40000
30000
20000
10000
0
10000
20000
30000
40000
50000
0 10 20 30 40 50 60 70 80 90Bendingmoment(kNm) Locationalong beam (m)
49788 kNm
60000
50000
40000
30000
20000
10000
0
10000
20000
30000
40000
50000
0 10 20 30 40 50 60 70 80 90Bendingmoment(kNm) Locationalong beam (m)
Capacity = 24 648 kNm
Capacity = 5283 kNmDemand = 4765 kNm
Demand = 14 961 kNm
60000
50000
40000
30000
20000
10000
0
10000
20000
30000
40000
50000
0 10 20 30 40 50 60 70 80 90Bendingmoment(kNm)
Locationalong beam (m)
N.B. This sectional analysis is not valid in the disturbed regions at the ends of the beam.

Chapter 4 Application of the Precast Segmental Double-T to Multi-span Structures
90
4.3.5 Capacity | Ultimate Limit State Analysis
The structures were analysed at ultimate limit states using a similar, but more complicated,
procedure to that outlined in Section 3.3.3.
As with the simply supported bridges, at ultimate limit states the tendons were assumed to yield
and a corresponding force in the tendon was applied at the ends of the beam. For the resulting
system, significant values of bending moment resistance were calculated, including ultimate
moment when concrete begins crushing and cracking moment when concrete first cracks. In the
analysis of continuous systems, this calculation was slightly more complicated than that for
simply supported cases, because these values were calculated in both positive and negative
flexure. Corresponding sections of strain were also calculated to produce matching pairs of
moment and concrete strain at the level of the tendons.
Bending moments were applied across both spans. The shape of the bending moment diagram
was the same as that produced by factored live and dead loads, but was scaled such that the
ultimate resistance of the section was reached at either the point of maximum positive or
negative moment, whichever was reached at a lower scaling factor. A plot was produced of
strain in the concrete at the level of the tendons at points along the bridge using the matching
pairs described in the previous paragraph, aligning moments with points along the scaled
bending moment diagram. This plot was also more complicated than that produced for the
simply supported case, because regions of cracking in both positive and negative bending were
considered. The area under the resulting plot of strains, with the dimensions of strain and length,
was calculated to give the elongation of the tendon due to deformation of the bridge. If this
elongation was equal to or greater than the yield elongation of the tendon, then the original
assumption of tendon yield was valid. If the elongation was less than the yield elongation of the
tendon, then a second iteration of the above calculation was required, this time assuming a force
in the tendon corresponding to the calculated elongation.
Once a force in the tendon was established that equilibrated the applied scaled bending moments,
the capacity of the resulting section (the maximum scaled bending moment) was compared to the
original demand moment. If capacity was greater than demand, then the section resisted ultimate
loading.
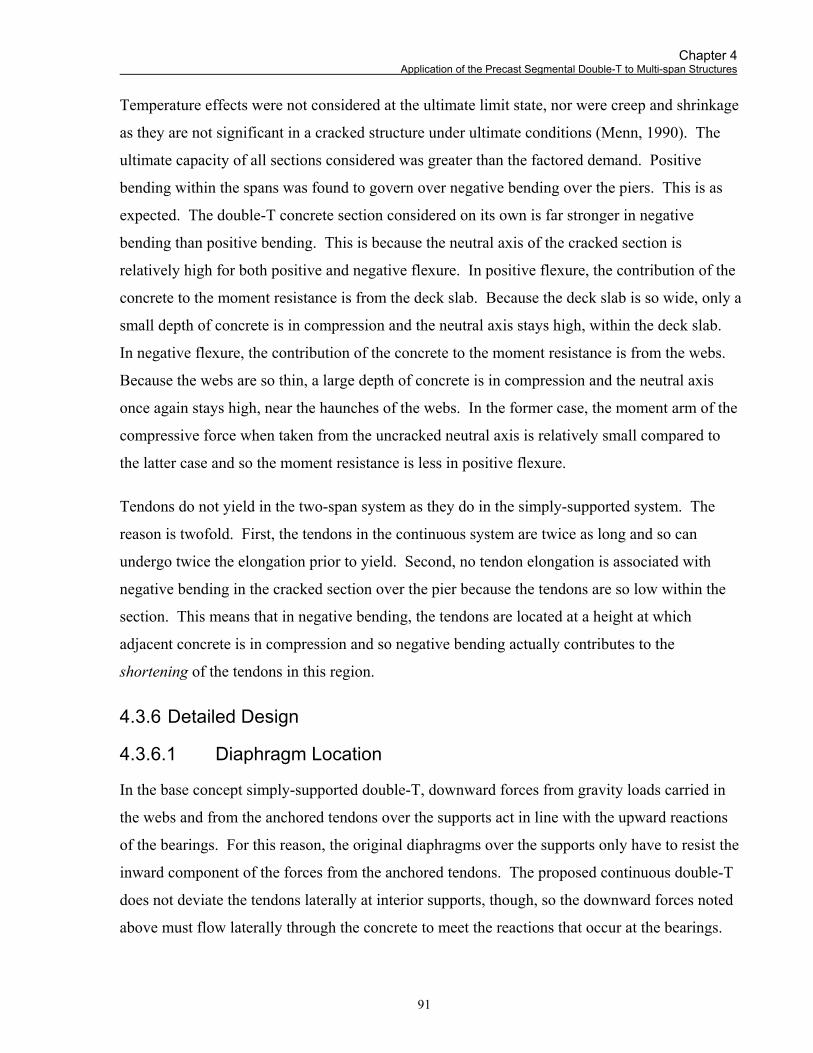
Chapter 4 Application of the Precast Segmental Double-T to Multi-span Structures
91
Temperature effects were not considered at the ultimate limit state, nor were creep and shrinkage
as they are not significant in a cracked structure under ultimate conditions (Menn, 1990). The
ultimate capacity of all sections considered was greater than the factored demand. Positive
bending within the spans was found to govern over negative bending over the piers. This is as
expected. The double-T concrete section considered on its own is far stronger in negative
bending than positive bending. This is because the neutral axis of the cracked section is
relatively high for both positive and negative flexure. In positive flexure, the contribution of the
concrete to the moment resistance is from the deck slab. Because the deck slab is so wide, only a
small depth of concrete is in compression and the neutral axis stays high, within the deck slab.
In negative flexure, the contribution of the concrete to the moment resistance is from the webs.
Because the webs are so thin, a large depth of concrete is in compression and the neutral axis
once again stays high, near the haunches of the webs. In the former case, the moment arm of the
compressive force when taken from the uncracked neutral axis is relatively small compared to
the latter case and so the moment resistance is less in positive flexure.
Tendons do not yield in the two-span system as they do in the simply-supported system. The
reason is twofold. First, the tendons in the continuous system are twice as long and so can
undergo twice the elongation prior to yield. Second, no tendon elongation is associated with
negative bending in the cracked section over the pier because the tendons are so low within the
section. This means that in negative bending, the tendons are located at a height at which
adjacent concrete is in compression and so negative bending actually contributes to the
shortening of the tendons in this region.
4.3.6 Detailed Design
4.3.6.1 Diaphragm Location
In the base concept simply-supported double-T, downward forces from gravity loads carried in
the webs and from the anchored tendons over the supports act in line with the upward reactions
of the bearings. For this reason, the original diaphragms over the supports only have to resist the
inward component of the forces from the anchored tendons. The proposed continuous double-T
does not deviate the tendons laterally at interior supports, though, so the downward forces noted
above must flow laterally through the concrete to meet the reactions that occur at the bearings.
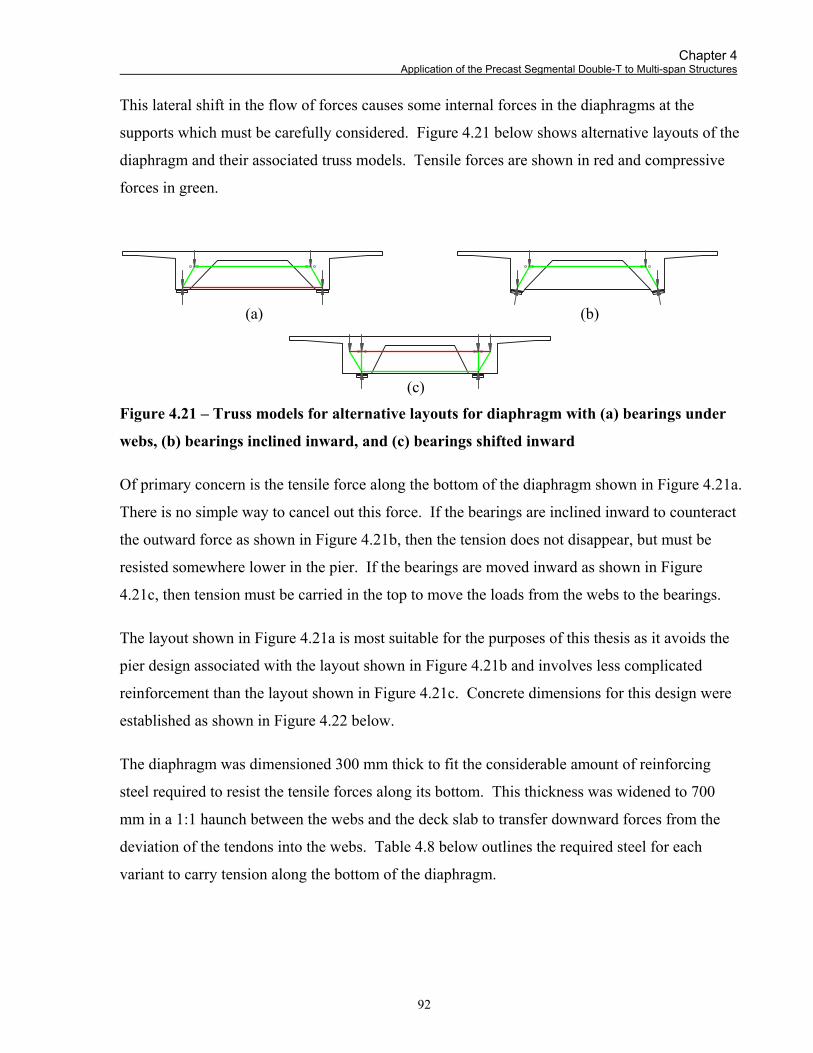
Chapter 4 Application of the Precast Segmental Double-T to Multi-span Structures
92
This lateral shift in the flow of forces causes some internal forces in the diaphragms at the
supports which must be carefully considered. Figure 4.21 below shows alternative layouts of the
diaphragm and their associated truss models. Tensile forces are shown in red and compressive
forces in green.
(a) (b) (c)
Figure 4.21 – Truss models for alternative layouts for diaphragm with (a) bearings under
webs, (b) bearings inclined inward, and (c) bearings shifted inward
Of primary concern is the tensile force along the bottom of the diaphragm shown in Figure 4.21a.
There is no simple way to cancel out this force. If the bearings are inclined inward to counteract
the outward force as shown in Figure 4.21b, then the tension does not disappear, but must be
resisted somewhere lower in the pier. If the bearings are moved inward as shown in Figure
4.21c, then tension must be carried in the top to move the loads from the webs to the bearings.
The layout shown in Figure 4.21a is most suitable for the purposes of this thesis as it avoids the
pier design associated with the layout shown in Figure 4.21b and involves less complicated
reinforcement than the layout shown in Figure 4.21c. Concrete dimensions for this design were
established as shown in Figure 4.22 below.
The diaphragm was dimensioned 300 mm thick to fit the considerable amount of reinforcing
steel required to resist the tensile forces along its bottom. This thickness was widened to 700
mm in a 1:1 haunch between the webs and the deck slab to transfer downward forces from the
deviation of the tendons into the webs. Table 4.8 below outlines the required steel for each
variant to carry tension along the bottom of the diaphragm.

Chapter 4 Application of the Precast Segmental Double-T to Multi-span Structures
93
Figure 4.22 – Proposed diaphragm design | 1:100
Table 4.8 – Reinforcing steel requirements to resist transverse tension in diaphragms
Span (m)
Tension reinforcement
Alternative 1
Alternative 2
20 8, hooked 35M 16, straight 25M 36.6 13, hooked 35M 25, straight 25M 45 19, hooked 35M 37, straight 25M
4.3.7 Losses
Sections 4.3.1 through 4.3.6 show that it is possible to modify the double-T section in such a way
that it resists negative moments at supports and so is appropriate for a continuous girder system.
The feasibility of such a system, however, is dependent on whether it can be post-tensioned
along its entire length without unreasonably high losses of post-tensioning force. Li (2010)
showed that the losses for a 36.6-m-long single span brought the final stress in the tendons to
0.67fpu. The following sections present calculations of losses for one- to four-span systems, each
with identical span lengths from 20 to 45 m, and show that losses are reasonably low for all
systems. The losses considered, as specified in Clause 8.7.4.1 of the CHBDC (2010), are those
A'
A
11
200
SUPPORTCL
300200700
1775
225
2000
Chapter 4 Application of the Precast Segmental Double-T to Multi-span Structures
94
that occur initially at jacking and subsequent transfer of stress to the concrete, i.e., losses due to
friction and anchor set and those that occur during the service life of the member, i.e., due to
creep, shrinkage, and relaxation of the tendons.
4.3.7.1 Friction
Frictional forces between the tendons and ducts during stressing reduce the overall force in the
tendon. These reductions, FR, were calculated according to CHBDC (2010) Clause 8.7.4.2.3 as
1 Σ (4.1)
Where fsj is the stress in the tendon at the time of jacking; μ is the coefficient of friction between
tendon and duct at a deviator, taken as 0.25 for rigid steel pipe ducts; and α is the angle break at
the deviator. The values obtained for frictional losses were lower than those that would be
expected for draped internal tendons of similar length. This is because friction losses in external
tendons only occur at the locations of discrete angle breaks such as deviators.
4.3.7.2 Anchorage Slip
Anchorage slip, or anchor set, losses were calculated based on a 7-mm slip of the anchorage
seating wedges, which is a typical value for most post-tensioning hardware. The loss associated
with this slip is due to the loss of strain equivalent to the slip spread over a length of tendon
between the anchor and a remote deviator. The exact location of this deviator was not initially
known but was determined as follows:
(1) The normal force at the closest deviator to the jacking anchorage was calculated based on
the jacking force in the tendon and the angle break imposed by the deviator.
(2) The frictional force at that deviator due to this normal force was calculated based on a
coefficient of friction of 0.25 as specified in Table 8.3 of the CHBDC (2010) for external
ducts.
(3) A resulting stress difference across the deviator was calculated based on the loss in stress
from the jacking side of the deviator to the dead end side.
(4) A frictional stress capacity for the deviator was calculated based on the area over which
the tendon rubbed in this location.

Chapter 4 Application of the Precast Segmental Double-T to Multi-span Structures
95
(5) This process was repeated for each subsequent deviator farther from the jack (within the
spans and at the supports). The tendon was assumed to ‘hang up’ at the deviator at which
the frictional stress capacity (the capacity of the deviator to ‘hold’ the tendon) was greater
than the stress difference across it caused by the cumulative loss in frictional stresses of
previous deviators (the pull of the tendon across the deviator).
It was found that, contrary to other types of loss, those due to anchorage slip actually decreased
with longer span and overall structure lengths. This was because anchorage slip is a fixed
amount of shortening. The resulting stress loss is reduced when this shortening is spread over a
longer total length of strand in a longer bridge system.
4.3.7.3 Creep
Creep is the plastic shortening of concrete members over time under long-term loads. Under the
constant load of a post-tensioning force, concrete members shorten in the direction of that force,
thereby reducing the prestressing force. This reduction was calculated according to CHBDC
Clause 8.7.4.3.2 as
1.37 0.77 0.01 (4.2)
This equation contains a term, RH, to account for the mean annual relative humidity to which the
member is subjected. Creep is primarily due to water molecules moving out from between
adjacent sheets of calcium silicate hydrate within a concrete matrix and escaping to the
atmosphere. A higher relative humidity, literally a higher partial pressure of water within air,
keeps more moisture within the concrete matrix and slows down the rate of creep. For the
purposes of this thesis, a value of 65 % was used as given for Toronto in Figure A3.1.3 of the
CHBDC (2010). Kcr is a factor taken as 1.6 for post-tensioned components; fcir is as described
above in the section on elastic shortening; and fcds is the stress in the concrete at transfer at the
same location at which fcir is calculated due to the effects of subsequently added dead loads and
is taken as
, , (4.3)

Chapter 4 Application of the Precast Segmental Double-T to Multi-span Structures
96
4.3.7.4 Shrinkage
Shrinkage results from a loss of water within the concrete and is not affected by member loading.
The simplified method presented in Clause 8.7.4.3.3 of the CHBDC (2010) has been used to
determine the effects of concrete shrinkage on prestressing losses:
94 0.85 (4.4)
As with creep, the value for mean annual relative humidity in Toronto of 65 % was used as given
in Figure A3.1.3 of the CHBDC (2010).
4.3.7.5 Relaxation
Relaxation of tendons after transfer, REL2, was calculated using the formula given in Clause
8.7.4.3.4 of the CHBDC (2010):
0.55 0.34.
0.002 (4.5)
The subscript 2 in the term REL2 distinguishes the relaxation of strands that occurs after transfer
from that which occurs in pretensioned members after stressing but prior to concrete placement,
REL1. This stage does not occur in the post-tensioning process and so REL1 is neglected in this
thesis. The subscript is kept, however, to maintain consistency with the code. The formula
above takes into account the stress in the tendons at the time of transfer, fst; the ultimate stress of
the tendons, fpu, the losses due to creep, CR, and those due to shrinkage, SH.
4.3.7.6 Total Loss Summary
The total losses of stress in the tendons were calculated as the sum of the losses mentioned
above. These are applicable to strands jacked from one end. Strands jacked from both ends
would not exhibit significantly lower amounts of losses because this would only reduce friction
losses, which are a small component of total losses in this external, unbonded tendon system. A
summary of stresses in the tendons after all losses is presented in Table 4.9.

Chapter 4 Application of the Precast Segmental Double-T to Multi-span Structures
97
Table 4.9 – Tendons stresses after all losses | σp,final as a fraction of fpu, (with an assumed
jacking stress of 0.800fpu)
Number of Spans
Span Length (m)
20 36.6 45
1 0.725 0.716 0.679 2 0.739 0.724 0.685 3 0.743 0.726 0.687 4 0.746 0.726 0.688
These results differ from those originally calculated by Li (2010) for this system. The current
model differs from the original one calculated by Li in three ways: the calculated friction losses
are smaller in this model because the angle break term, α, has been input in radians instead of
degrees; the losses due to creep and shrinkage are calculated based on the 2010 CHBDC rather
than Gauvreau (1993); and the 36.6-m span in this calculation contains 160 strands instead of
156, at a different eccentricity. If the base concept of a 36.6-m-long, 2000-mm-deep bridge with
156 strands were analysed using the current method, stress in the tendons after all losses would
be 0.697fpu, rather than 0.670fpu.
Losses do not vary significantly between the highest amount (0.121fpu for the single 45-m-span)
and the lowest (0.054fpu for the four 20-m-spans) and all calculated losses are reasonably close to
what has been assumed in design calculations, i.e., 0.670fpu. Losses for all configurations are
reasonably low because the tendons are external and have no drape but only discrete angle
breaks at which friction losses can occur.
Configurations with more spans have fewer losses. This is due to the way anchor set loss is
distributed across the spans as discussed in Section 4.3.7.2.
It is possible that even longer multi-span configurations could be stressed with continuous
tendons without undue prestress losses. For the purposes of this thesis, however, only
configurations with up to four spans are considered.
4.3.8 Finalised Preliminary Concepts
Figure 4.23 through Figure 4.25 on the following pages present preliminary design drawings for
continuous configurations for adjacent spans of 20, 36.6, and 45 m.
Chapter 4 Application of the Precast Segmental Double-T to Multi-span Structures
98
4.4 Conclusions
Durable multi-span alternatives for a wide variety of highway overpass structures are possible
using the segmental double-T concept. The design alternatives of simply supported spans with
flexible linking slabs and real continuous structures presented above are compared and
contrasted with each other and the conventional slab on girder system in detail in Chapter 6.
First though, the following chapter addresses another barrier to the adoption of the precast
segmental method for short overpass bridges: the technically onerous requirement for match-
casting of segments.
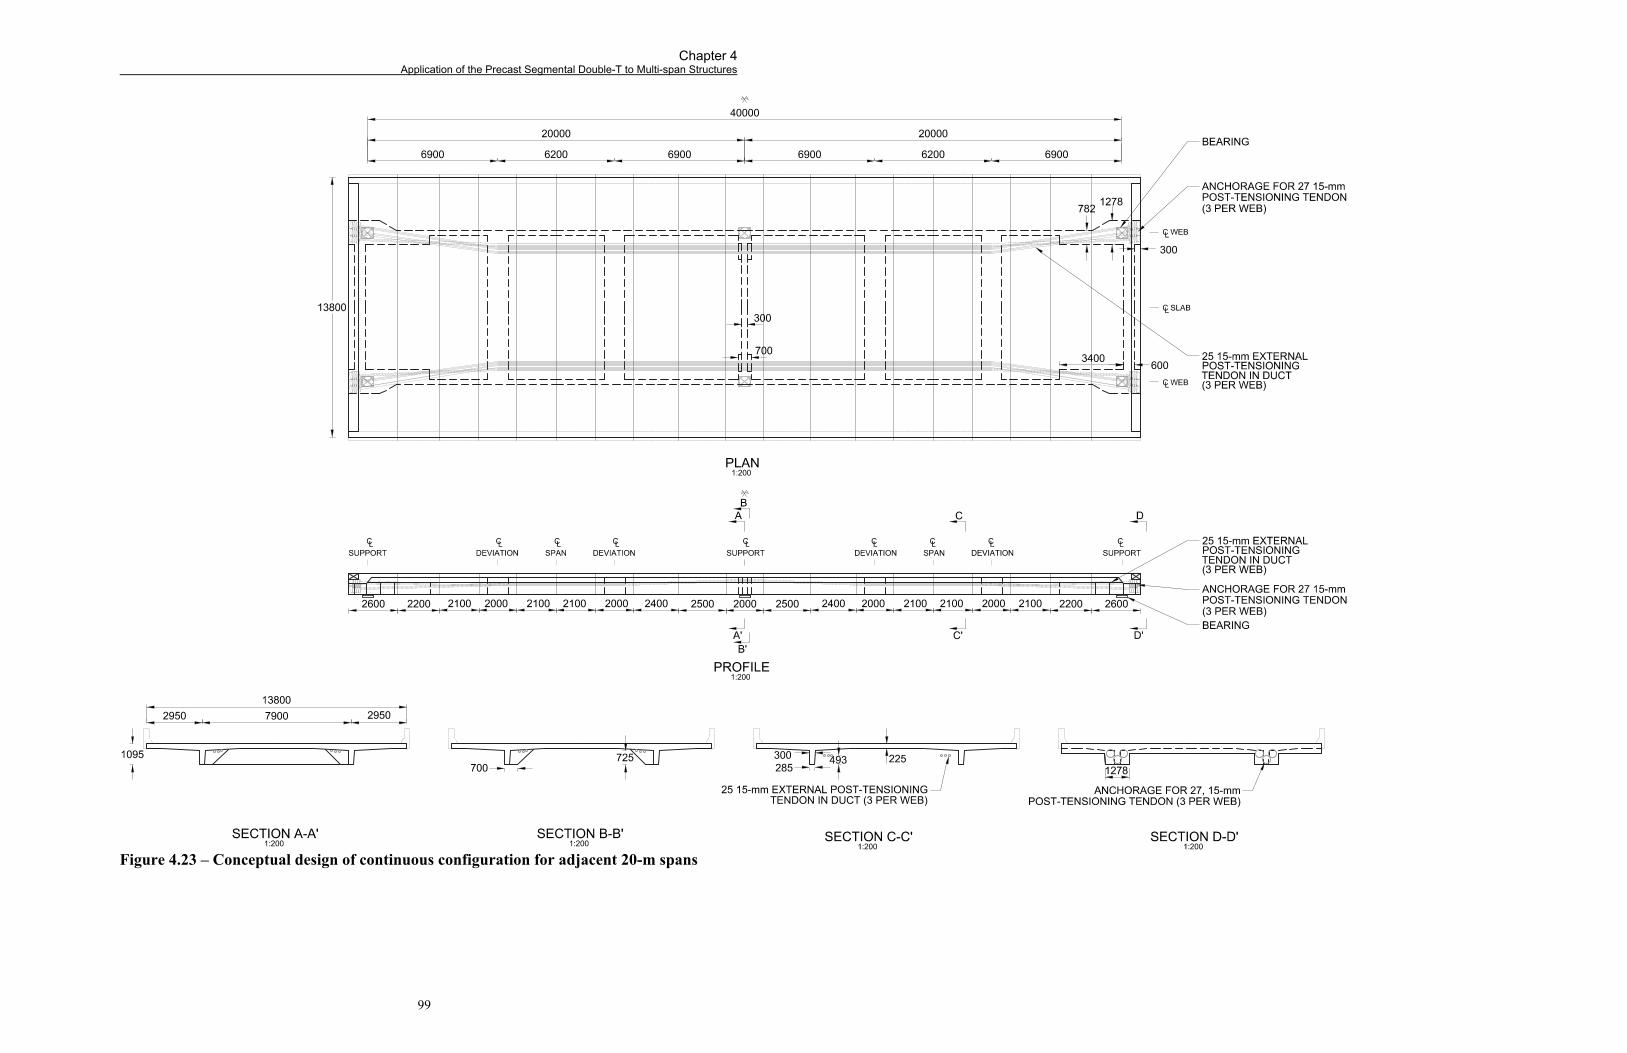
Chapter 4 Application of the Precast Segmental Double-T to Multi-span Structures
99
Figure 4.23 – Conceptual design of continuous configuration for adjacent 20-m spans

Chapter 4 Application of the Precast Segmental Double-T to Multi-span Structures
100
Figure 4.24 – Conceptual design of continuous configuration for adjacent 36.6-m spans

Chapter 4 Application of the Precast Segmental Double-T to Multi-span Structures
101
Figure 4.25 – Conceptual design of continuous configuration for adjacent 45-m spans

102
Chapter 5 Geometry Control during Precasting of Segments
5.1 Motivation to Eliminate Match Casting
For the design of the base concept double-T, Li (2010) recommended that segments be match
cast to ensure their proper alignment. Match casting requires that precasters adhere to rigorous
surveying and construction tolerances to ensure the proper alignment of the overall structure.
Not all precasters are equipped to perform such surveying and the accompanying calculations,
though, and so match casting is a barrier to the adoption of the base concept double-T.
Match casting is typically used for long bridges or multiple bridges consisting of 600 segments
or more. The double-T uses 20 or fewer segments per span, though. It is hypothesised that
match casting is not required to construct the double-T. Segments built to regular formwork
tolerances, to which precasters are accustomed, can be assembled into structures whose overall
geometry will not be adversely affected. This can be done using wood formwork and rigid
bulkheads on either longitudinal end of the formwork. A description of this method, and the
formwork required for it, is presented in this chapter.

Chapter 5 Geometry Control
103
5.2 Match Casting
When bridge segments are precast offsite, their geometry must be carefully controlled to ensure
the overall alignment of the finished structure. Match casting was first pioneered by Jean Muller
in the 1960s as a system to speed up the on-site construction of segmental bridges (Gauvreau,
2006), but an added benefit is that geometry of the overall structure can be carefully controlled.
The first major bridge on which it was used was the Oleron Viaduct in France, completed in
1966 (Gauvreau, 2006).
Match casting is most typically used for box girders to form “perfect” joints between segments.
This is accomplished by pouring each segment against the surface of the previously cast segment
adjacent to it in the structure. This system is illustrated below in Figure 5.1.
Figure 5.1 – Match casting (adapted from Interactive Design Systems, 2005)
The precise surveying required before and after the casting of each segment and the calculations
required to set each new segment and ensure proper alignment can be onerous for precasters and
not many in Canada are equipped to handle such work.
5.3 Current Precasting Practice
A survey of segmental construction tolerances conducted at the University of Toronto found that
the most rigorous standards demand that overall structural deviation (in plan and profile) be kept
below 1/1000th of overall span length (Bagrianski, 2010). This is a fairly strict standard meant
for complicated, long, concrete box-girder structures. It is reasonable that tolerances for overall
deviation for the shorter, less complicated, segmental double-T could be somewhat relaxed from
this standard, though, to 1/400th of overall span length. A deviation beyond around 1/360th of

Chapter 5 Geometry Control
104
span (Holden and Sammler, 1999), or even 1/300th of span (Galambos et al., 1993) is almost
completely invisible to the human eye.
A common standard used for precasting of structural and architectural concrete (PCI, 2000) was
consulted to determine tolerances that precasters are accustomed to following for everyday
components. The most rigorous tolerance given in this reference for dimensions of hand-
measured wood formwork is 6 mm (¼”). It is reasonable, therefore, to demand such rigorous
tolerances from precasters for dimensions of double-T segments. For overall structural
geometry, the tolerance that would often be applied is 1:800 for deviations from the entire length
of the structure, as given in CSA A23.4, Clause 12.1.2. For reasons stated above, it is reasonable
that this tolerance could be relaxed to a maximum deviation of 1/400th of span length for short
structures such as the segmental double-T.
5.4 Formwork for Segmental Double-T
The formwork for the segmental double-T can be made almost entirely out of wood; however,
the rigid bulkheads at either longitudinal end of the formwork would require a different material.
With typical match cast joints, small deviations from a planar surface in one face of a segment
will be matched in the following segment and will not cause a problem. The proposed system
will employ two bulkheads, however, that will have to match one another perfectly and be
sufficiently rigid to remain planar. The method proposed to accomplish this is to fabricate one
single bulkhead out of steel. A second bulkhead can then be cast against this bulkhead using a
high-strength concrete. This will ensure that the bulkheads and all shear keys match one another
and that they are both planar. With two perfectly-matched bulkheads, the tolerances of concern
in the casting of each segment are all related to the wood portion of the forms and the alignment
of one bulkhead with the other. These issues are discussed below.
5.5 Application of Current Tolerances to Segmental Double-T
The 6-mm tolerance noted in Section 5.3 above could be applied to the dimensions of double-T
segments using rigid, precision bulkheads and wood forms with the following general effects:
Overall height – The effects of a 6-mm variation in height between segments are not severe.

Chapter 5 Geometry Control
105
Overall width – The effects of a 6-mm variation in width between segments are also not
severe. Such a difference would not cause problems with fit of components and would be
mainly aesthetic.
Deck slab thickness - The effects of a 6-mm variation in deck slab thickness between
segments are not severe. If the differences in height are so severe that they cause problems
with differential compaction of asphalt on the deck, then problem areas can be milled to
ensure a more uniform surface.
Web width - The effects of a 6-mm width variation between webs are also not severe. Such a
difference would not cause problems with fit of components and would be mainly aesthetic.
If the same formwork is used for each segment, then it is unlikely that the three parameters above
will vary much. The dimension that will be most difficult to control between segments and will
have the most significant impact will be the length of longitudinal vertices of the segment,
controlled by the alignment of the two bulkheads with one another. A difference between
vertices will cause a change in alignment of the overall structure as shown in Figure 5.2, in
which the misalignment has been exaggerated. If the left side is longer than the right, then the
overall structure will curve to the right. If the top is longer than the bottom, then the overall
structure will curve downward.
Figure 5.2 – Exaggerated alignment effect of differences in vertex length for a bridge
segment
6
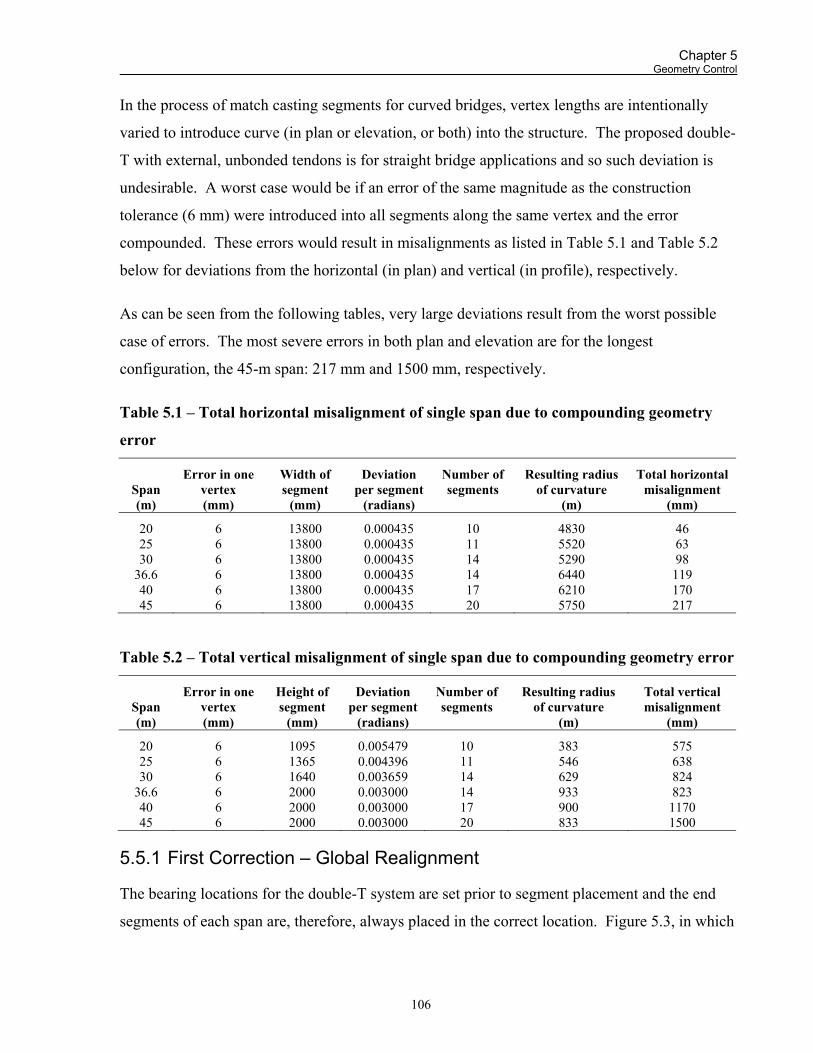
Chapter 5 Geometry Control
106
In the process of match casting segments for curved bridges, vertex lengths are intentionally
varied to introduce curve (in plan or elevation, or both) into the structure. The proposed double-
T with external, unbonded tendons is for straight bridge applications and so such deviation is
undesirable. A worst case would be if an error of the same magnitude as the construction
tolerance (6 mm) were introduced into all segments along the same vertex and the error
compounded. These errors would result in misalignments as listed in Table 5.1 and Table 5.2
below for deviations from the horizontal (in plan) and vertical (in profile), respectively.
As can be seen from the following tables, very large deviations result from the worst possible
case of errors. The most severe errors in both plan and elevation are for the longest
configuration, the 45-m span: 217 mm and 1500 mm, respectively.
Table 5.1 – Total horizontal misalignment of single span due to compounding geometry
error
Span (m)
Error in one vertex (mm)
Width of segment
(mm)
Deviation per segment
(radians)
Number of segments
Resulting radius of curvature
(m)
Total horizontal misalignment
(mm)
20 6 13800 0.000435 10 4830 46 25 6 13800 0.000435 11 5520 63 30 6 13800 0.000435 14 5290 98
36.6 6 13800 0.000435 14 6440 119 40 6 13800 0.000435 17 6210 170 45 6 13800 0.000435 20 5750 217
Table 5.2 – Total vertical misalignment of single span due to compounding geometry error
Span (m)
Error in one vertex (mm)
Height of segment
(mm)
Deviation per segment
(radians)
Number of segments
Resulting radius of curvature
(m)
Total vertical misalignment
(mm)
20 6 1095 0.005479 10 383 575 25 6 1365 0.004396 11 546 638 30 6 1640 0.003659 14 629 824
36.6 6 2000 0.003000 14 933 823 40 6 2000 0.003000 17 900 1170 45 6 2000 0.003000 20 833 1500
5.5.1 First Correction – Global Realignment
The bearing locations for the double-T system are set prior to segment placement and the end
segments of each span are, therefore, always placed in the correct location. Figure 5.3, in which

Chapter 5 Geometry Control
107
misalignments are exaggerated, shows that the worst-case deviation introduced into the segments
from vertex length errors occurs at midspan once the segments are in place and is equal to only a
quarter of the original error.
Figure 5.3 – Alignment error after segment placement
As a result of this realignment, alignment errors are as listed in Table 5.3 below.
Table 5.3 – Alignment errors after segment placement
Span (m)
Vertical Misalignment
at Midspan (mm)
Vertical Deviation as
Fraction of Span
Horizontal Misalignment
at Midspan (mm)
Horizontal Deviation as
Fraction of Span
20 11 1/1752 144 1/139 25 16 1/1584 160 1/157 30 24 1/1224 206 1/146
36.6 30 1/1227 206 1/178 40 42 1/943 293 1/137 45 54 1/828 375 1/120
REALIGNMENT
REALIGNMENT
MISALIGNMENTWITH
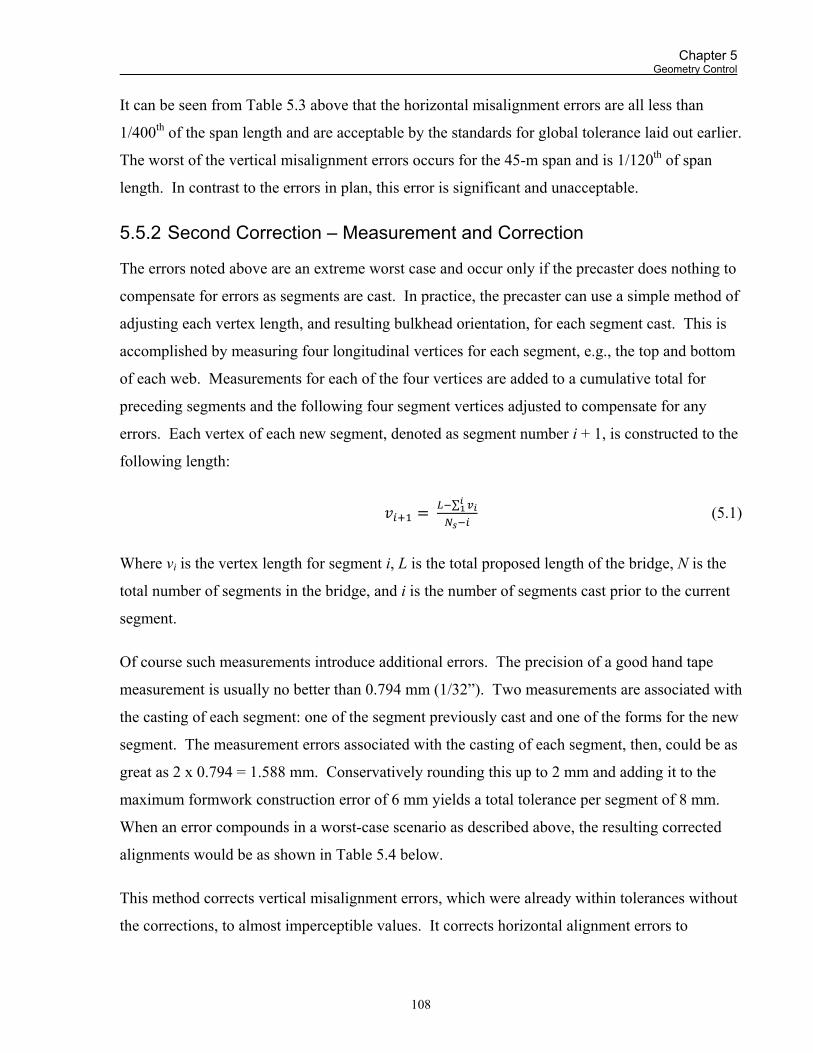
Chapter 5 Geometry Control
108
It can be seen from Table 5.3 above that the horizontal misalignment errors are all less than
1/400th of the span length and are acceptable by the standards for global tolerance laid out earlier.
The worst of the vertical misalignment errors occurs for the 45-m span and is 1/120th of span
length. In contrast to the errors in plan, this error is significant and unacceptable.
5.5.2 Second Correction – Measurement and Correction
The errors noted above are an extreme worst case and occur only if the precaster does nothing to
compensate for errors as segments are cast. In practice, the precaster can use a simple method of
adjusting each vertex length, and resulting bulkhead orientation, for each segment cast. This is
accomplished by measuring four longitudinal vertices for each segment, e.g., the top and bottom
of each web. Measurements for each of the four vertices are added to a cumulative total for
preceding segments and the following four segment vertices adjusted to compensate for any
errors. Each vertex of each new segment, denoted as segment number i + 1, is constructed to the
following length:
∑
(5.1)
Where vi is the vertex length for segment i, L is the total proposed length of the bridge, N is the
total number of segments in the bridge, and i is the number of segments cast prior to the current
segment.
Of course such measurements introduce additional errors. The precision of a good hand tape
measurement is usually no better than 0.794 mm (1/32”). Two measurements are associated with
the casting of each segment: one of the segment previously cast and one of the forms for the new
segment. The measurement errors associated with the casting of each segment, then, could be as
great as 2 x 0.794 = 1.588 mm. Conservatively rounding this up to 2 mm and adding it to the
maximum formwork construction error of 6 mm yields a total tolerance per segment of 8 mm.
When an error compounds in a worst-case scenario as described above, the resulting corrected
alignments would be as shown in Table 5.4 below.
This method corrects vertical misalignment errors, which were already within tolerances without
the corrections, to almost imperceptible values. It corrects horizontal alignment errors to
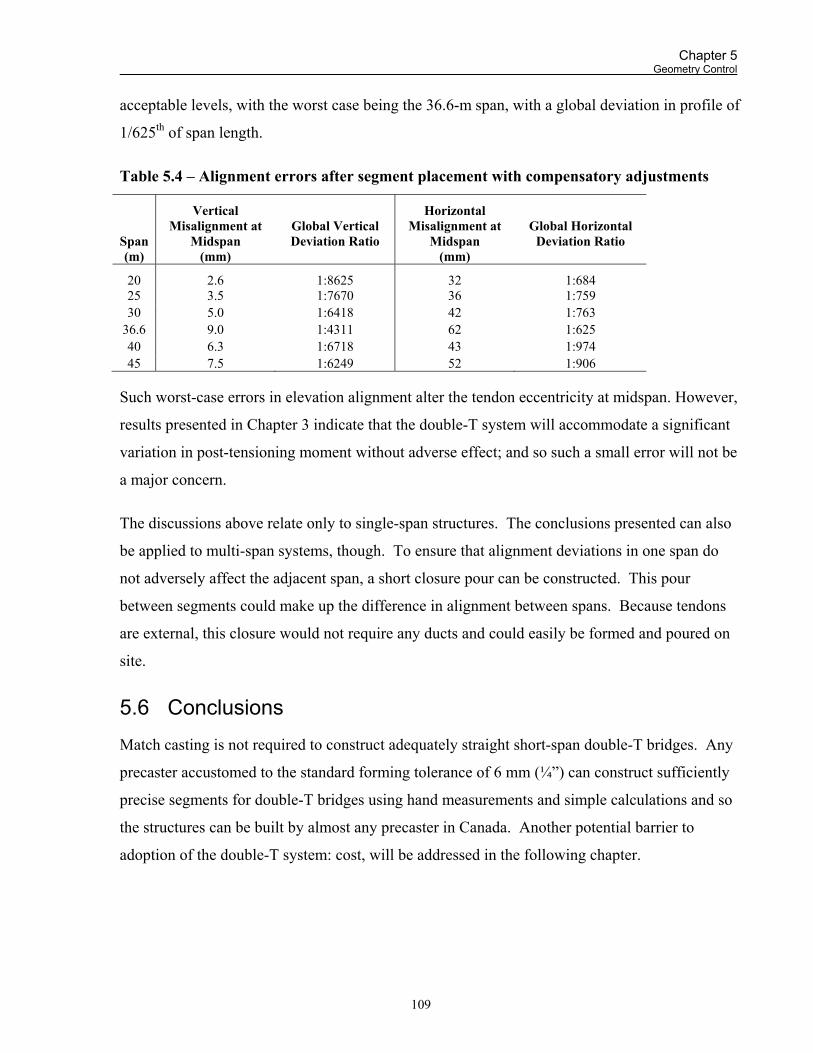
Chapter 5 Geometry Control
109
acceptable levels, with the worst case being the 36.6-m span, with a global deviation in profile of
1/625th of span length.
Table 5.4 – Alignment errors after segment placement with compensatory adjustments
Span (m)
Vertical Misalignment at
Midspan (mm)
Global Vertical Deviation Ratio
Horizontal Misalignment at
Midspan (mm)
Global Horizontal Deviation Ratio
20 2.6 1:8625 32 1:684 25 3.5 1:7670 36 1:759 30 5.0 1:6418 42 1:763
36.6 9.0 1:4311 62 1:625 40 6.3 1:6718 43 1:974 45 7.5 1:6249 52 1:906
Such worst-case errors in elevation alignment alter the tendon eccentricity at midspan. However,
results presented in Chapter 3 indicate that the double-T system will accommodate a significant
variation in post-tensioning moment without adverse effect; and so such a small error will not be
a major concern.
The discussions above relate only to single-span structures. The conclusions presented can also
be applied to multi-span systems, though. To ensure that alignment deviations in one span do
not adversely affect the adjacent span, a short closure pour can be constructed. This pour
between segments could make up the difference in alignment between spans. Because tendons
are external, this closure would not require any ducts and could easily be formed and poured on
site.
5.6 Conclusions
Match casting is not required to construct adequately straight short-span double-T bridges. Any
precaster accustomed to the standard forming tolerance of 6 mm (¼”) can construct sufficiently
precise segments for double-T bridges using hand measurements and simple calculations and so
the structures can be built by almost any precaster in Canada. Another potential barrier to
adoption of the double-T system: cost, will be addressed in the following chapter.

110
Chapter 6 Comparison of Double-T and Conventional Systems
6.1 Motivation to Compare these Parameters
In Chapter 3 and Chapter 4, various single- and multi-span designs of the segmental double-T are
proven to be feasible to design and construct. Feasibility is not the only criterion by which to
judge an alternative structural system, though: a reasonable alternative should offer some
combination of benefits over the current conventional system including material, cost, or time
savings. This chapter compares the material use and cost of the double-T alternative to several
real examples of the conventional cast-in-place deck slab on precast girder system and also
compares the various multi-span options laid out in Chapter 4 to one another and to the
conventional system considering schedule impacts and constructability. The chapter concludes
with a discussion of the aesthetic merit of this system.
6.2 Material Use Efficiency – Double-T Variants Compared to One Another
All eleven of the combinations of span length and section depth described in Section 3.2 were
found to be feasible and of these, six were chosen as efficient designs, one for each discrete span
length studied. Feasible span-to-depth ratios ranged from 18.3:1 to 22.5:1. The upper limit on

Chapter 6 Comparison of Double-T and Conventional Systems
111
slenderness was not found in this study and it is reasonable to expect that slightly more slender
bridges could be designed.
There are measurements of material use efficiency for concrete bridges other than slenderness,
though. One of them is effective depth, which is calculated by dividing the volume of concrete
in the superstructure by the deck area. Menn (1990) gives a formula for what he believes is an
efficient effective depth as a function of span length3: 0.35 0.0045 .
Figure 6.1 below shows effective depth values for the six bridges selected in Section 3.3.8 of
Chapter 3 and plots them against Menn’s formula. As can be seen from the figure, the chosen
variants all have approximately the same effective depth. All variants are much more efficient
than what would be suggested by Menn’s formula. This is to be expected as the systems take
advantage of the relatively high-strength concrete employed in their construction. Menn’s
formula was primarily derived to describe longer, multi-span, concrete box girder bridges and so
is not very applicable to these shorter span double-T bridges, though.
Figure 6.1 – Effective depth versus span length of double-T bridges
3 For multi-span bridges, Menn recommends using a geometrical average of the span lengths.
0.30
0.35
0.40
0.45
0.50
0.55
0.60
0.65
10 20 30 40 50 60 70
Concrete volume /deck area (m)
Longest span length (m)
Menn: 0.35 + 0.0045L

Chapter 6 Comparison of Double-T and Conventional Systems
112
Another measure of the efficiency of a post-tensioned concrete bridge is the amount of post-
tensioning steel used per unit volume of concrete. Figure 6.2 below shows the amounts of post-
tensioning in the six chosen bridge variants plotted against two formulae which describe
relatively efficient post-tensioned concrete bridges. The first is Menn’s (1990)4: 0.4 . The
second is Schlaich and Scheef’s (1982): 4.5 0.5 .
Figure 6.2 – Post-tensioning use versus span length of double-T bridges
As can be seen from Figure 6.2, the variants become more efficient with increasing span length
and reach a peak in terms of post-tensioning steel efficiency at spans of 36.6 m. At this span
length and greater, the variants come close to attaining the level of efficiency suggested by
Schlaich and Scheef’s equation; however, all six chosen double-T variants are less efficient than
what would be predicted by either Schlaich and Scheef or Menn. This is true for two main
reasons. First, the chosen variants take advantage of high-strength concrete by heavily
prestressing it. This is possible only by using a relatively large amount of post-tensioning steel.
Second, these two formulae are used to describe long multi-span concrete box girder bridges and
are probably less applicable to these shorter spans.
4 Again, Menn recommends using a geometric average of span lengths for multi-span structures.
0
10
20
30
40
50
60
10 20 30 40 50 60 70
Prestressingsteel mass /concrete
volume (t/m3)
Longest span length (m)
Schlaich and Scheef: 4.5 + 0.5L
Menn: 0.4L

Chapter 6 Comparison of Double-T and Conventional Systems
113
6.3 Material Use and Cost Efficiency – Double-T System Compared to Conventional System
6.3.1 Conventional Bridge Data Collection
To compare the efficiency of the chosen variants to conventional systems, design drawings for
sixteen cast-in-place deck slab on precast girder bridges were collected from the records of
McCormick Rankin Corporation, a consulting engineering firm in Mississauga, Ontario. These
bridges were constructed between 2000 and 2007. Thirteen were constructed for the Ontario
Ministry of Transportation, two for the County of Oxford, and one for the Region of Halton. All
were generally designed and constructed to the same specifications. They were designed by
different firms and bid and constructed by different contractors. Of the sixteen bridges, three are
single span and the remainder multi-span. The span lengths range from 16.6 to 61.0 m.
Geometric data were collected from information presented on the general arrangement, deck
slab, and girder sheets of the contract drawings for each of the bridges. Cost data were collected
for twelve of the sixteen bridges from the Ontario Ministry of Transportation’s Highway Costing
system, HICO. An average of the three lowest bids for each of the contract items considered was
taken directly from this system. Costs were converted to 2010 Canadian dollars using the
Ministry’s Tender Price Index. This price index is a factor which converts costs from different
years to comparable numbers and is derived from hundreds of item prices on Ministry projects
that vary from year to year. Drawings, quantity, and cost data for these bridges are shown in
Appendix F.
6.3.2 Material Use Comparison
Figure 6.3 below plots the span-to-depth ratio against the length of the longest span for each
bridge. Conventional single-span bridges are shown in green, multi-span in blue. The six
double-T spans considered are shown in red. For all spans, the double-T variants considered are
above or near the upper slenderness range of the conventional bridges considered. The
transverse design of the double-T bridges was based solely on bending and does not account for
arching action within the deck slab between webs. If arching action were considered, it is
possible that the deck slab thickness could be reduced. Since the majority of the concrete in this

Chapter 6 Comparison of Double-T and Conventional Systems
114
system is in the deck slab, a slight reduction in deck slab thickness would lead to large savings in
concrete, and so it is likely that these bridges could be made slightly more slender.
Figure 6.3 – Span-to-depth ratio versus span length of double-T and conventional bridges
The effective depths, also described above, for each of the sixteen conventional bridges
considered were calculated and plotted against the six chosen double-T variants in Figure 6.4.
Conventional single-span bridges are shown in green, multi-span in blue. The six double-T
spans considered are shown in red. This figure shows that the double-T designs are more
efficient than most comparable conventional bridges for spans of 30 to 45 m, but do not lie
outside the normal range for this type of bridge.
10
15
20
25
10 20 30 40 50 60 70
Span:depth
Longest span length (m)
Bridge Type
single‐span CPCI girder multi‐span CPCI girder
double‐T

Chapter 6 Comparison of Double-T and Conventional Systems
115
Figure 6.4 – Effective depth versus span length of double-T and conventional bridges
The double-T is slightly more efficient than conventional systems in terms of concrete without
using more prestressing steel than a conventional precast girder system. Figure 6.5 below
compares area of prestressing steel to longest span length. This plot shows that the double-T
uses about the same amount of prestressing steel as any conventional configuration for a
comparable span. Conventional single-span bridges are shown in green, multi-span in blue. The
six double-T spans considered are shown in red.
Figure 6.5 – Post-tensioning use versus span length of double-T and conventional bridges
0.30
0.35
0.40
0.45
0.50
0.55
0.60
0.65
10 20 30 40 50 60 70
Concretevolume /deck
area (m)
Longest span length (m)
0.00
0.01
0.02
0.03
0.04
0.05
0.06
0.07
0.08
0.09
10 20 30 40 50 60 70
Area of prestressingsteel (m2)
Longest span length (m)
Bridge Type
single‐span CPCI girder multi‐span CPCI girder
double‐T
Bridge Type
single‐span CPCI girder multi‐span CPCI girder
double‐T
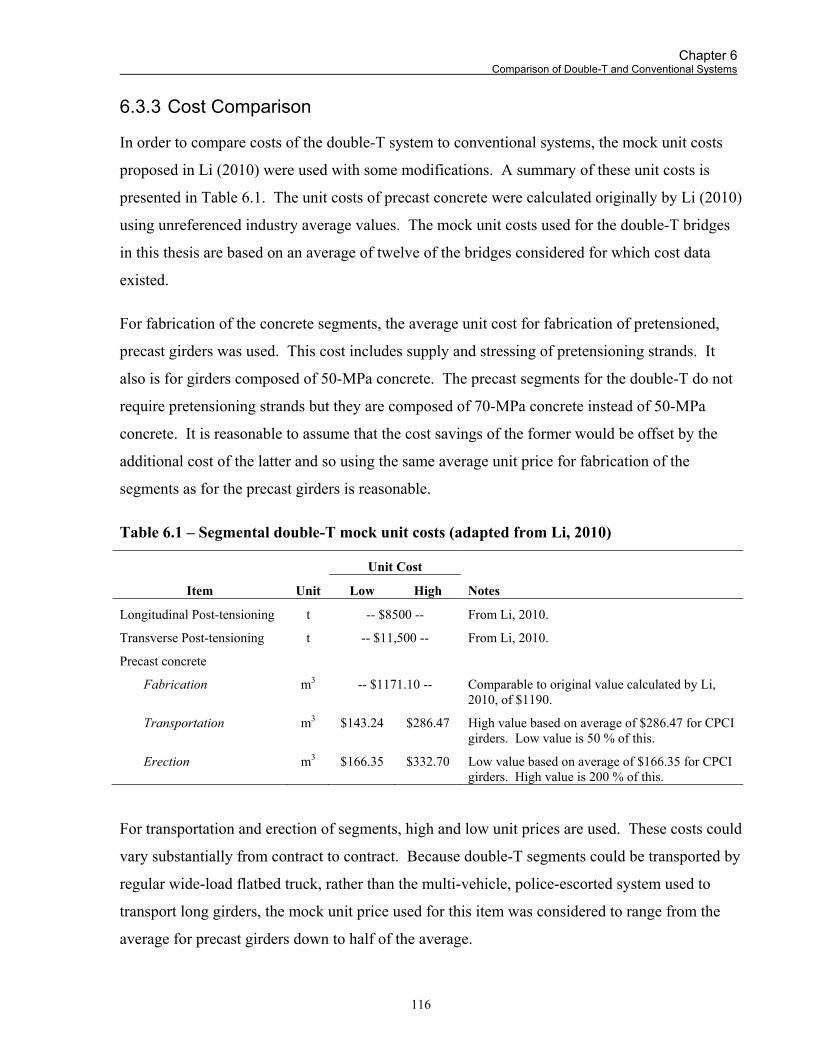
Chapter 6 Comparison of Double-T and Conventional Systems
116
6.3.3 Cost Comparison
In order to compare costs of the double-T system to conventional systems, the mock unit costs
proposed in Li (2010) were used with some modifications. A summary of these unit costs is
presented in Table 6.1. The unit costs of precast concrete were calculated originally by Li (2010)
using unreferenced industry average values. The mock unit costs used for the double-T bridges
in this thesis are based on an average of twelve of the bridges considered for which cost data
existed.
For fabrication of the concrete segments, the average unit cost for fabrication of pretensioned,
precast girders was used. This cost includes supply and stressing of pretensioning strands. It
also is for girders composed of 50-MPa concrete. The precast segments for the double-T do not
require pretensioning strands but they are composed of 70-MPa concrete instead of 50-MPa
concrete. It is reasonable to assume that the cost savings of the former would be offset by the
additional cost of the latter and so using the same average unit price for fabrication of the
segments as for the precast girders is reasonable.
Table 6.1 – Segmental double-T mock unit costs (adapted from Li, 2010)
Item Unit
Unit Cost
Notes Low High
Longitudinal Post-tensioning t -- $8500 -- From Li, 2010.
Transverse Post-tensioning t -- $11,500 -- From Li, 2010.
Precast concrete
Fabrication m3 -- $1171.10 -- Comparable to original value calculated by Li, 2010, of $1190.
Transportation m3 $143.24 $286.47 High value based on average of $286.47 for CPCI girders. Low value is 50 % of this.
Erection m3 $166.35 $332.70 Low value based on average of $166.35 for CPCI girders. High value is 200 % of this.
For transportation and erection of segments, high and low unit prices are used. These costs could
vary substantially from contract to contract. Because double-T segments could be transported by
regular wide-load flatbed truck, rather than the multi-vehicle, police-escorted system used to
transport long girders, the mock unit price used for this item was considered to range from the
average for precast girders down to half of the average.

Chapter 6 Comparison of Double-T and Conventional Systems
117
Erection of the segments would require some sort of falsework or erection girder, something not
required for the simpler erection of precast girders. For this reason, the mock price used for
double-T segments was considered to range from the average for precast girders up to twice the
average. These variations are consistent with assumptions originally made by Li (2010).
Figure 6.6 below presents total superstructure cost data, including only the items listed in Table
6.1, divided by total deck area for each bridge. This is plotted against span length. Conventional
single-span bridges are shown in green, multi-span in blue. High and low costs for the six
double-T spans considered are shown in red, linked together for each span length. From this
figure, it can be seen that the initial superstructure costs of double-T bridges lies somewhere in
the middle of the range of costs for conventional precast girder bridges and so the double-T can
be said to be competitive with the conventional system in terms of cost.
Figure 6.6 – Unit cost of bridge superstructure versus span length of double-T and
conventional bridges
The discussions above present comparisons of material use and construction costs. The
following sections present a comparison of the various designs considering construction logistics
and scheduling.
$0
$500
$1,000
$1,500
$2,000
10 20 30 40 50 60 70
Cost per unitdeck area(2010$/m2)
Longest span length (m)
Bridge Type
single‐span CPCI girder multi‐span CPCI girder
double‐T

Chapter 6 Comparison of Double-T and Conventional Systems
118
6.4 Scheduling and Logistics – Double-T Systems Compared to Conventional System
6.4.1 Construction Staging for Flexible Linking Slab Alternative
The flexible linking slab alternative of the double-T has similar construction staging to the
original simply-supported version. The two-stage longitudinal post-tensioning follows the same
sequence, i.e., Stage I tendons are jacked, barriers and a wearing surface are installed, and then
Stage II tendons are jacked. For continuous structures using flexible linking slabs, this basic
staging can be followed, but the flexible linking slabs must be poured after the barriers and
asphalt wearing surfaces are installed, and so a gap must be left in the asphalt paving over the
supports where the flexible linking slab is to be installed as discussed in Section 4.2.3. After it is
poured, waterproofing can be installed and an asphalt patch can be paved over it. The paving
cannot be completed in one stage because the dead weight of the wearing surface is required on
the spans prior to the stressing of Stage II tendons.
For a two-span structure, all stressing can be accomplished from the abutment ends of the
structure. With more than two spans, however, tendons for central spans must be jacked from an
intermediate pier. This can be accomplished by two methods. The first method involves
constructing adjacent spans with a sufficient gap between them such that a jack can be
accommodated to stress tendons from the end between spans. This method is feasible, but
results in a pier cap that is long in the longitudinal direction to accommodate the wide space
between bearings of adjacent spans. The second method involves constructing each span
completely, including paving and Stage II jacking, before moving on to the next adjacent span.
This method requires slightly more overall construction time because it does not allow for as
much overlap of operations. Because each span is constructed independently, however, only one
span of falsework or one erection girder is required for temporary support.
It should be noted that it is possible to pave in one stage if spans are loaded prior to Stage II
jacking with compensation loads that would load the structures in a similar manner to the asphalt
wearing surface. It is anticipated that the site logistics of moving such large loads would be
overly complicated, though, and would congest the deck of the bridge during construction. In
particular, compensation loads would be a nuisance during the paving operation.

Chapter 6 Comparison of Double-T and Conventional Systems
119
6.4.2 Construction Staging for Continuous Alternative
The construction staging for the continuous alternative of the double-T is simpler than that of the
flexible linking slab option discussed in the previous section. After all spans are erected, Stage I
tendons are stressed for all spans simultaneously, falsework for all spans can then be removed,
barriers and a wearing surface installed, and then Stage II tendons stressed. While this
alternative is simpler, it requires that falsework be constructed for all spans concurrently.
6.4.3 Scheduling Comparison
To compare the constructability of the various construction options in a quantitative manner,
mock construction schedules were assembled for two different applications: an overpass using
two 40-m spans, and one using four 40-m spans. Four alternative construction methods for these
same two overpass applications were compared: a continuous segmental double-T constructed on
falsework, simply supported segmental double-T’s connected using flexible linking slabs
constructed on falsework, the same simply supported bridge constructed on an erection girder,
and an equivalent conventional precast girder bridge with cast-in-place deck slab. Detailed
schedules for these projects are presented in Gantt chart form in Appendix G. Table 6.2 and
Table 6.3 below summarise some of the key quantifiable differences between the four
construction schedules.
The most significant result of the analysis presented in Table 6.2 and Table 6.3 below is that all
segmental double-T options have considerably shorter construction durations than the current
conventional method of cast-in-place deck slab on precast girders. A more complete comparison
is presented in Table 6.4 below. Negative points are indicated in red while positive points are
indicated in green. Subtler comparisons are made, however, in the three one-on-one
comparisons that come out of this analysis and are presented in the subsequent sections. These
comparisons are: continuous versus all simply-supported segmental double-T systems, simply-
supported systems built on falsework versus those constructed on an erection girder, and all
segmental double-T systems versus cast-in-place deck slab on precast girder systems.

Chapter 6 Comparison of Double-T and Conventional Systems
120
Table 6.2 – Construction schedules for various alternative methods | two 40-m spans
Construction method
Continuous segmental
double-T on falsework
Simply-supported spans segmental
double-T on falsework
Simply-supported spans segmental
double-T on erection girder
Conventional precast girders
with cast-in-place deck slab
Duration of Superstructure Construction (working days)
51 47 33 61
Duration as percentage of precast girder option
84 % 77 % 54 % 100 %
Precaster Start-up (number of working days prior to start of superstructure construction)
38 36 50 29
Falsework below new overpass
under both spans for
36 days
under spans individually for
19 days each
none none
Large crane use 1 mobilisation of4 days
2 mobilisations of2 days each over 16 working days
1 mobilisation of 16 days
1 mobilisation of1 day
Number of mobilisations of paving crew
2 3 3 1
Table 6.3 – Construction schedules for various alternative methods | four 40-m spans
Construction method
Continuous segmental
double-T on falsework
Simply-supported spans segmental
double-T on falsework
Simply-supported spans segmental
double-T on erection girder
Conventional precast girders
with cast-in-place deck slab
Duration of Superstructure Construction (working days)
84 75 49 105
Duration as percentage of conventional precast girder option
80 % 71 % 47 % 100 %
Precaster Start-up (number of working days prior to start of superstructure construction)
79 70 98 59
Falsework below new overpass
under all spans for 70 days
under spans individually for
19 days each
none none
Large crane use 1 mobilisation of8 days
4 mobilisations of2 days each over 44 working days
1 mobilisation of 30 days
1 mobilisation of1 day
Number of mobilisations of paving crew
2 5 5 1
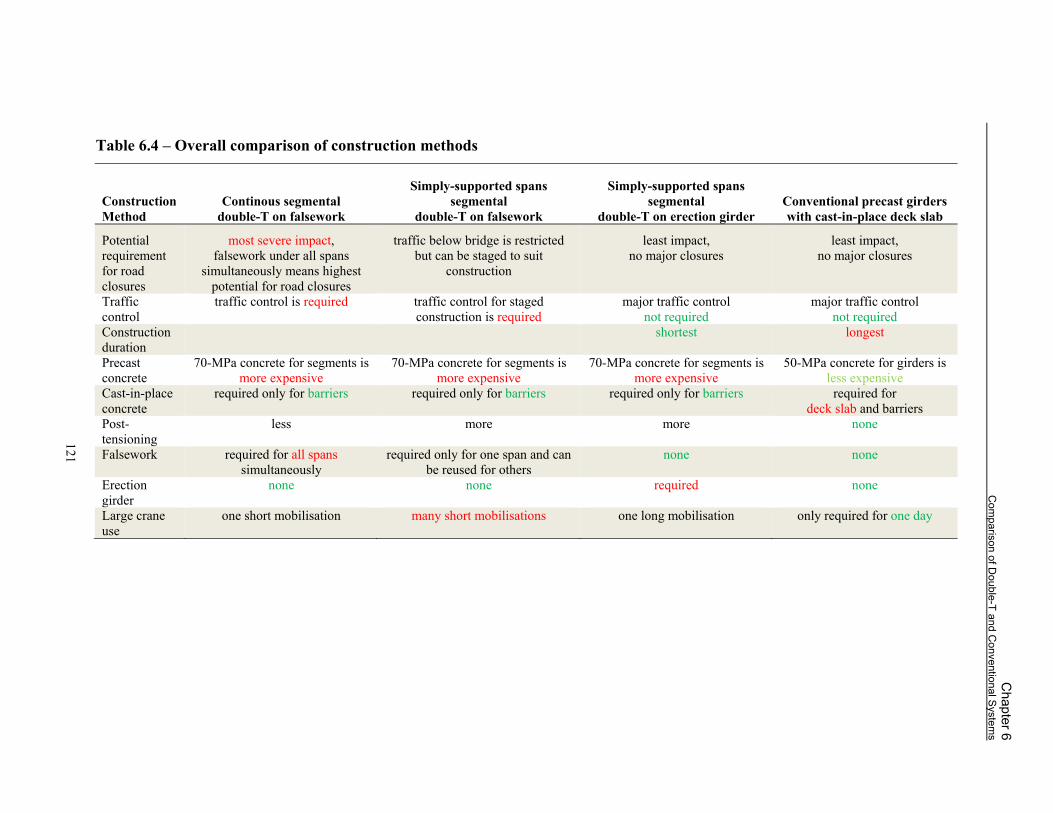
Table 6.4 – Overall comparison of construction methods
Construction Method
Continous segmental double-T on falsework
Simply-supported spans segmental
double-T on falsework
Simply-supported spans segmental
double-T on erection girder Conventional precast girderswith cast-in-place deck slab
Potential requirement for road closures
most severe impact, falsework under all spans
simultaneously means highest potential for road closures
traffic below bridge is restricted but can be staged to suit
construction
least impact, no major closures
least impact, no major closures
Traffic control
traffic control is required traffic control for staged construction is required
major traffic control not required
major traffic control not required
Construction duration
shortest longest
Precast concrete
70-MPa concrete for segments is more expensive
70-MPa concrete for segments is more expensive
70-MPa concrete for segments ismore expensive
50-MPa concrete for girders is less expensive
Cast-in-place concrete
required only for barriers required only for barriers required only for barriers required for deck slab and barriers
Post-tensioning
less more more none
Falsework required for all spans simultaneously
required only for one span and can be reused for others
none none
Erection girder
none none required none
Large crane use
one short mobilisation many short mobilisations one long mobilisation only required for one day
121
C
hapter 6
Com
parison of Double-T
and C
onventional S
ystems

Chapter 6 Comparison of Double-T and Conventional Systems
122
6.4.3.1 Comparison of Real Continuous and Simply-supported Systems
Of the two major groups of double-T alternatives considered in this thesis, the simply-supported
option requires less time onsite and less overall falsework, but more intensive onsite operations,
e.g., more use of a crane onsite and more mobilisations of a paving crew. When only
considering construction schedules, it appears to be the better option, but it is understood that
other factors such as the higher durability inherent in a fully continuous structure could lead a
designer to choose it as a preferred option. Table 6.5 below compares the advantages and
disadvantages of the real continuous and simply-supported options presented in this thesis.
Table 6.5 – Comparison of construction schedules between continuous and simply-
supported double-T options
Continuous Simply-supported with flexible linking slab
Advantages crane required less extensively falsework below bridge allows traffic interruptions to be staged
fewer mobilisations of paving crew slightly shorter overall duration requires less falsework
Disadvantages requires more falsework crane required more extensively longer overall duration more mobilisations of paving crew
6.4.3.2 Comparison of Simply-supported Systems Built on Falsework and Built on an Erection Girder
The simply supported system with flexible linking slabs can be constructed using falsework or an
erection girder. Use of an erection girder speeds up production and allows for a shorter
construction schedule, but there are no major differences in scheduling between this option and
building on falsework. Table 6.6 below compares the advantages and disadvantages of
constructing on falsework to those of construction using an erection girder. The major deciding
factor between these two options is whether the contractor has access to an affordable and
suitable erection girder. On very large-scale projects where many structures of the same span are
to be constructed, then it might make sense to construct an erection girder for this particular
application and its cost could be offset by the savings realised by a shorter construction schedule
and less traffic control.

Chapter 6 Comparison of Double-T and Conventional Systems
123
Table 6.6 – Comparison of construction schedules between simply-supported double-T
constructed on falsework and constructed on erection girder
Simply-supported with falsework Simply-supported with erection girder
Advantages later precaster start-up date shorter overall duration does not require erection girder requires no closures
Disadvantages longer overall duration earlier precaster start-up date may require closures, but they can be
staged requires erection girder
6.4.4 Logistics Comparison
All double-T options have significantly shorter construction durations than the precast girder
with cast-in-place deck slab option. This is due to the fact that much of the time spent onsite
constructing a conventional system is spent casting concrete and waiting for it to cure. Shifting
the construction of the concrete deck slab to the precasting yard, therefore, saves much time
onsite. The most significant comparative disadvantage of the double-T option is that it might
require some road closures if constructed on falsework. This may be a major deciding factor on
some projects in urban areas. In areas where closures are of less concern, though, such as on
remote secondary roads and in cold northern areas, where reducing the amount of cast-in-place
concrete is more important, the double-T is a very competitive option. Table 6.7 below
compares the advantages and disadvantages of the precast double-T system to those of the
conventional precast girder with cast-in-place deck slab system.
Table 6.7 – Comparison of construction schedules between precast segmental double-T and
conventional precast girder with cast-in-place deck slab
Segmental double-T Precast girder with cast-in-place deck slab
Advantages much shorter overall duration later precaster start-up date no on-site deck slab construction requires no closures less extensive use of crane only one mobilisation of paving crew
Disadvantages may require closures, staged or otherwise much longer overall duration more extensive use of crane multiple mobilisations of paving crew
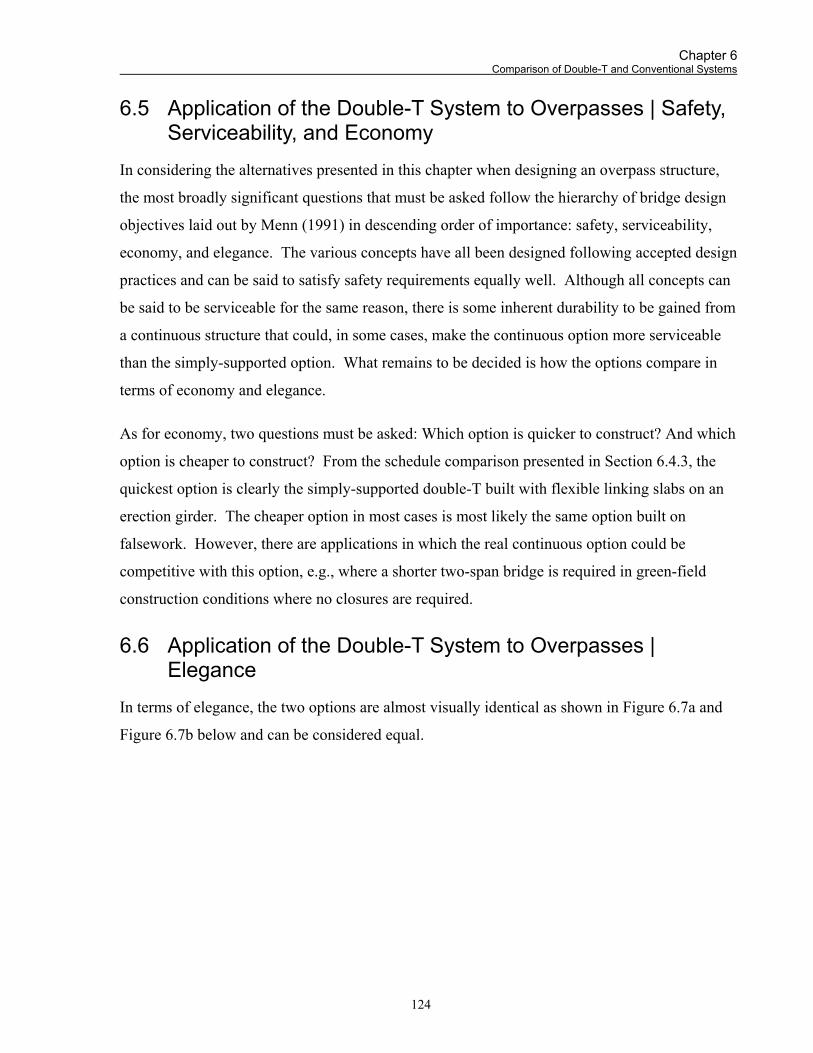
Chapter 6 Comparison of Double-T and Conventional Systems
124
6.5 Application of the Double-T System to Overpasses | Safety, Serviceability, and Economy
In considering the alternatives presented in this chapter when designing an overpass structure,
the most broadly significant questions that must be asked follow the hierarchy of bridge design
objectives laid out by Menn (1991) in descending order of importance: safety, serviceability,
economy, and elegance. The various concepts have all been designed following accepted design
practices and can be said to satisfy safety requirements equally well. Although all concepts can
be said to be serviceable for the same reason, there is some inherent durability to be gained from
a continuous structure that could, in some cases, make the continuous option more serviceable
than the simply-supported option. What remains to be decided is how the options compare in
terms of economy and elegance.
As for economy, two questions must be asked: Which option is quicker to construct? And which
option is cheaper to construct? From the schedule comparison presented in Section 6.4.3, the
quickest option is clearly the simply-supported double-T built with flexible linking slabs on an
erection girder. The cheaper option in most cases is most likely the same option built on
falsework. However, there are applications in which the real continuous option could be
competitive with this option, e.g., where a shorter two-span bridge is required in green-field
construction conditions where no closures are required.
6.6 Application of the Double-T System to Overpasses | Elegance
In terms of elegance, the two options are almost visually identical as shown in Figure 6.7a and
Figure 6.7b below and can be considered equal.

Chapter 6 Comparison of Double-T and Conventional Systems
125
(a)
(b)
(c)
Figure 6.7 – Visual comparison of (a) continuous, (b) simply-supported segmental
double-T, and (c) conventional options

Chapter 6 Comparison of Double-T and Conventional Systems
126
Both the options presented above, though, stand out when compared to a similar conventional
girder bridge with cast-in-place deck slab as shown in Figure 6.7c. Three main factors contribute
to this superiority:
1. The conventional precast girder option requires that all girders be supported and so
necessitates some sort of pier cap to extend the entire width of the deck at the supports
whereas the double-T option only needs to be supported under the webs and so the piers
do not need to extend the full width of the deck. Hiding away the visual element of this
pier makes the entire structure appear more slender because the span one sees is the entire
bridge length rather than two divided spans.
2. The outer girders of the conventional system cannot be placed very far from the edges of
the deck whereas the webs of the double-T system are tucked far in under the deck slab.
This allows a longer shadow to be cast on the webs than on the girders and so imparts
upon the double-T a higher visual slenderness.
3. There are many girders required for the conventional system whereas the double-T
system requires only two webs. This reduction in the number of elements significantly
reduces the amount of visual clutter under the deck.
These points are illustrated in Figure 6.8 on the following page.
6.7 Adoption of the Double-T System in Ontario
Adopting the double-T system in Ontario to replace the current system of cast-in-place deck slab
on precast girders is an excellent idea for all the benefits presented in preceding sections.
Replacement of the current system, though, will mean dealing with several challenges.
First, the precast concrete industry will have to abandon or phase out formwork and stressing
systems used to construct conventional precast, pretensioned girders. The industry has invested
heavily in this system and replacing it with something new means a change from the constantly-
diminishing marginal fixed costs of old formwork and stressing systems to high up-front costs
for new formwork. It also means a loss of revenue due to precasters no longer pretensioning

Chapter 6 Comparison of Double-T and Conventional Systems
127
elements, but rather, having them post-tensioned by other companies. This change can be
facilitated by reducing the cost of new formwork as explained in Chapter 5.
Second, local contractors in Ontario will have to become familiar with post-tensioned concrete, a
material used in jurisdictions throughout the world. It will take some time for existing firms to
move into the province and local contractors to develop the proficiency with the system that will
allow them to bid competitively.
Third, owners, designers, and contractors will have to become comfortable with the use of
higher-strength concretes. Most bridges in Ontario are currently constructed with high-
performance concretes with specified strengths no higher than 50 MPa.
6.8 Conclusions
The precast segmental double-T makes efficient use of concrete when compared to the
conventional cast-in-place deck slab on precast girders. It can be made more slender, using less
concrete and a comparable amount of prestressing steel. This can be accomplished for an initial
superstructure cost that is comparable to the conventional system. The double-T can take less
time to build than the conventional system. It also offers some aesthetic benefits. Despite all of
this, there are still several reasons that the system will not be adopted quickly in Ontario.

Chapter 6 Comparison of Double-T and Conventional Systems
128
(a)
(b)
Figure 6.8 – Visual comparison of (a) double-T and (b) conventional precast girder options

129
Chapter 7 Conclusions
The precast segmental double-T with external, unbonded tendons is intrinsically more durable
than conventional systems. This is due to the fact that its deck slab (normally the component of
a bridge most attacked by deicing chemicals) is precast and transversely post-tensioned. Precast
concrete is generally more durable than cast-in-place concrete because of the controlled
environment in which it is cast. Also, transverse post-tensioning reduces cracking in the deck
slab, making it less penetrable.
This thesis advances the development of the precast segmental double-T presented in Li (2010)
and provides a body of knowledge necessary to facilitate the adoption of this system by
designers by addressing five associated key issues:
1. It validates the double-T design for a range of span lengths used in highway overpasses, and
2. It demonstrates that it is possible to reduce the system’s sensitivity to post-tensioning losses.
Results of the parametric study presented in Chapter 3 show that the system can be used over a
range of spans (from 20 to 45 m) and with lower sensitivity to post-tensioning loss than reported
in previous literature.

Chapter 7 Conclusions
130
3. It presents designs using the precast segmental double-T system for multi-span bridges
without the use of expansion joints.
Designs presented in Chapter 4 show that there are two viable methods to make the system
multi-span without using expansion joints within the structure. It can be made as a series of
simply-supported spans connected by flexible linking slabs made of ultra high-performance
fibre-reinforced concrete, a material which can be produced from readily-available constituents
in Canada. It can also be made fully continuous over the supports.
4. It shows that the onerous technical requirements of conventional match casting can be
relaxed for short spans built using this method.
The segmental double-T does not need to be match cast to achieve adequate precision as shown
in Chapter 5 and so any precaster in Canada can construct segments using normal formwork
tolerances.
5. It shows that the system is competitive with conventional systems by comparing material use,
cost, scheduling, and aesthetic criteria.
As demonstrated in Chapter 6 through a comparison with data from existing conventional
bridges using cast-in-place deck slabs on precast girders, the segmental double-T can be built
more quickly than conventional systems, it uses concrete more efficiently, it can be built at a
price comparable to the average price of examples of the existing system, and is an elegant
alternative to conventional overpass bridges.

131
Bibliography
AGOM, 2009. AGOM Elastomeric Bridge Bearings. Ossona, Italy.
Aïtcin, P.-C., 1998. High-Performance Concrete. E & FN Spon.
Al-Taan, S., and J.R. Al-Feel, 1989. Prediction of crack width in fibrous reinforced concrete members. Fibre Reinforced Cements and Concretes: Recent Developments; Cardiff; UK; 18-20 Sept.1989: 209-18.
Bagrianski, S., 2010. Geometry Control of Precast Segments: A Precise Alternative to Match-Casting. BASc dissertation. Department of Civil Engineering, University of Toronto.
Bickley, J.A. and D. Mitchell, 2001. A State-of-the-art Review of High Performance Concrete Structures Built in Canada: 1990-2000. Toronto, Ontario.
Canadian Standards Association, 2006a. CAN/CSA-S6-06: Canadian Highway Bridge Design Code. CSA, Mississauga, Ontario.
Canadian Standards Association, 2006b. S6.1-06: Commentary on CAN/CSA-S6-06, Canadian Highway Bridge Design Code. CSA, Mississauga, Ontario.
Caner, A., and P. Zia, 1998. Behavior and design of link slabs for jointless bridge decks. PCI Journal 43 (3): 68-80.
CEB-FIP, 2010. Draft Model Code for Concrete Structures. Comité Euro-International du Béton, Paris.
Chen, W., and E.M. Lui, 2005. Handbook of Structural Engineering. 2nd ed. CRC Press.
Collins, M.P., and D. Mitchell, 1997. Prestressed Concrete Structures. Toronto: Response.
Departement des Travaux Publics du Canton de Vaud, 1989. Catalogue of le viaduc d’Orbe for Routes nationales suisses N9.
FHWA National Bridge Inventory, as of December, 2010. Federal Highway Administration, Washington.
Fincher, H.E., 1983. Evaluation of rubber expansion joints for bridges. Rep. No. FHWA/IN/RTC-83/1, Washington, D.C., 15–16.
Galambos, T.V., R.T. Leon, C.W. French, M. Barker, and B. Dishongh, 1993. Inelastic Rating Procedures for Steel Beam and Girder Bridges. NCHRP Report 352.
Gauvreau, P., 1993. Ultimate Limit States of Concrete Girders Prestressed with Unbonded Tendons. Institute of Structural Engineering, Swiss Federal Institute of Technology, Report No. 198. Basel: Birkhäuser-Verlag.
Gauvreau, P., 2006. Bridges. Chapter 12 (pp. 195-240) of Post-tensioning Manual. 6th ed. Phoenix: Post-Tensioning Institute.
Gergely, P., and L.A. Lutz, 1968. Maximum Crack Width in Reinforced Concrete Flexural Members. Causes, Mechanisms, and Control of Cracking in Structures. SP-20, American Concrete Institute, Detroit, Michigan, 87-117.

132
Habel, K., 2004. Structural behaviour of elements combining ultra-high performance fibre reinforced concretes and reinforced concrete. Doctoral dissertation. Génie Civil, École Polytechnique Fédérale de Lausanne, Switzerland.
Habel, K., J.P. Charron, S. Braike, R.D. Hooton, P. Gauvreau, and B. Massicotte, 2008. Ultra-high performance fibre-reinforced concrete mix design in central Canada. Canadian Journal of Civil Engineering. 35(2): 217-224.
Holden, A., and B. J. Sammler, 1999. Structural Design for the Stage. Focal Press, Boston.
Interactive Design Systems, 2005. <http://www.ids-soft.com/solutions/products/geometrey.html> Match cast diagram (May, 2011)
Jenq, Y.S., and S.P. Shah, 1986. Crack propagation in fiber-reinforced concrete. Journal of Structural Engineering 112 (1) (Jan.): 19-34.
Jungwirth, J., and A. Muttoni, 2004. Structural Behavior of Tension Members in UHPC. Swiss Federal Institute of Technology (EPFL). Lausanne, Switzerland.
Kullaa, J., 1998. Micromechanics of multiple cracking. I. fibre analysis. Journal of Materials Science (UK) 33 (16) (15 Aug.): 4213-24.
Lam, C., D. Lai, J. Au, L. Lim, W. Young, B. Tharmabala, 2008. Development of Flexible Link Slab for Elimination of Existing Expansion Joints on Steel Girder Bridges, Report BO-01-01, Bridge Office, Ministry of Transportation of Ontario, April 1, 2001.
Leonhardt, F., 1979. Vorlesungen uber Massivbau. Berlin: Springer-Verlag.
Leutbecher, T. and E. Fehling, 2009. Rissbildung und zugtragverhalten von mit fasern verstärktem stahlbeton am beispiel ultrahochfesten betons. Beton- Und Stahlbetonbau 104 (6, pp. 357-367): June.
Li, Y.E., 2010. Bridge System with Precast Concrete Double-T Girder and External Unbonded Post-tensioning. MASc dissertation. Department of Civil Engineering, University of Toronto.
Menn, C., 1990. Prestressed Concrete Bridges. Translated from German and edited by P. Gauvreau. Basel: Birkhäuser Verlag.
Menn, C., 1991. An Approach to Bridge Design. Engineering Structures. 13 (Apr.):106-12.
Naaman, A.E., 2000. HPFRCCs: Properties and Applications in Repair and Rehabilitation, High-Performance Fiber-Reinforced Concrete in Infrastructure Repair and Retrofit, ACI SP 185-1, Michigan.
Naaman, A.E., and K. Visalvanich, 1983. Modeling fracture in fiber reinforced concrete. Paper presented at Proceedings of the 4th Engineering Mechanics Division Specialty Conference: Recent Advances in Engineering Mechanics and their Impact on Civil Engineering Practice.
Newhouse, C. D., 2005. Design and Behavior of Precast, Prestressed Girders Made Continuous – An Analytical and Experimental Study. Doctoral dissertation. Civil and Environmental Engineering, Virginia Polytechnic Institute and State University.
Okeil, A.M., and A. ElSafty, 2005. Partial continuity in bridge girders with jointless decks. Practice Periodical on Structural Design and Construction 10 (4) (November): 229-38.

133
Precast/Prestressed Concrete Institute, 2000. MNL 135-00. Tolerance Manual for Precast and Prestressed Concrete Construction. PCI, USA.
Salonga, J.A., 2010. Innovative Systems for Arch Bridges Using Ultra High-Performance Fibre-Reinforced Concrete. PhD dissertation. Department of Civil Engineering, University of Toronto.
Schlaich, J., and H. Scheef, 1982. Concrete Box Girder Bridges. Structural Engineering Documents, International Association for Bridge and Structural Engineering. Zurich.
Schlaich, J., K. Shäfer, and M. Jennewein, 1987. Towards a Consistent Design of Structural Concrete. PCI Journal. 32, 3: 74-150.
Straski, J., M. Korenek, 1986. Short span segmental bridges in Czechoslovakia. PCI Journal 31 (1) (Jan.Feb.): 106-32.
Stussi, B., 1958. Grundsatzliches zum Projekt, zur Ausfuhrung und zur Berechnung. In Offentlichen Bauten des Kantons, Weinlandbrucke Andelfingen (32-47).
Susetyo, J., 2009. Fibre Reinforcement for Shrinkage Crack Control in Prestressed, Precast Segmental Bridges. PhD dissertation. Department of Civil Engineering, University of Toronto.
Thippeswamy, H.K., H.V.S. GangaRao, and J.M. Franco, 2002. Performance evaluation of jointless bridges. Journal of Bridge Engineering 7 (5) (September/October): 276-89.
Walraven, J.C., 2009. High performance fiber reinforced concrete: Progress in knowledge and design codes. Materials and Structures 42 (9) (Nov): 1247-60.