predicting the financial vulnerability of u.s. public
TRANSCRIPT

Digital Commons @ George Fox University Digital Commons @ George Fox University
Doctor of Business Administration (DBA) Theses and Dissertations
5-2021
Predicting the Financial Vulnerability of U.S. Public Charities: A Predicting the Financial Vulnerability of U.S. Public Charities: A
Test of the Tuckman-Chang Model Test of the Tuckman-Chang Model
Alesha L. Graves
Follow this and additional works at: https://digitalcommons.georgefox.edu/dbadmin
Part of the Corporate Finance Commons, and the Finance and Financial Management Commons

Running head: PREDICTING THE FINANCIAL VULNERABILITY OF U.S. PUBLIC
CHARITIES
Predicting the Financial Vulnerability of U.S. Public Charities:
A Test of the Tuckman-Chang Model
by
Alesha L. Graves
Lexington, Kentucky
A dissertation submitted in partial fulfillment of the requirements for the degree of
DOCTOR OF BUSINESS ADMINISTRATION
College of Business
George Fox University
Dissertation Committee:
David Tucker, Ph. D., Chairperson
Chengping Zhang, Ph. D., Member
Paul Shelton, Ph. D., Member
May 2021

,Ill\ GEORGE Foxw UNIVERSITY
COLLEGE OF BUSINESS
Dissertation Completion Approval Doctor of Business Administration
Student Name: Alesha Graves Student ID#: 1920280
Cohort#: 12 ----�--
Concentration: ACCT
Project Title:
Predicting the Financial Vulnerabilities of U.S. Public Charities
has been approved for the Doctor of Business Administration Program at George Fox University as a dissertation for the DBA degree.
Approval Signatures:
:])��� Chair
Dr. David Tucker, PhD. Chair (print)
Member
Dr. Chengping Zhang, PhD. Member (print) a?
Member
Dr. Paul Shelton PhD. Member (print)
_,,.
DrJusti��BA Prog,am
Date :S - 3 - Z.o2 \
Date
Date --------
Date 5/3/2021
PREDICTING THE FINANCIAL VULNERABILITY OF U.S. PUBLIC CHARITIES II

PREDICTING THE FINANCIAL VULNERABILITY OF U.S. PUBLIC CHARITIES III
Dedication
I dedicate this dissertation to my husband
Kevin Graves
and our daughter
Kelly Graves.
Their love, support, grace, and patience were unwavering through my doctoral journey. I
love you and am so thankful for you.

PREDICTING THE FINANCIAL VULNERABILITY OF U.S. PUBLIC CHARITIES IV
Acknowledgements
But Moses’ hands grew weary, so they took a stone and put it under him, and he sat on it
while Aaron and Hur held up his hands, one on one side, and the other on the other side.
So his hands were steady until the going down of the sun.
Exodus 17:12 ESV
I did not travel my doctoral journey alone. Many were a part of this journey and
provided support for which I am incredibly grateful. My husband Kevin encouraged me
through every class, provided a shoulder for me to cry on when I did not think I could
continue going, and took on so much so that I could have the space and time to work. Our
daughter Kelly has been my biggest cheerleader and the best assistant a DBA student
could have. She provided hours of typing assistance, kept me organized, and provided
music and entertainment when it was needed. I pray that God blesses her fully in all of
her future academic endeavors. My parents, Jack and Dian Caldwell, were also a huge
source of encouragement through the entire process and celebrated the small milestones
along the way.
I am grateful for the support and constructive feedback from my dissertation
committee chairperson, David Tucker. His timely responses to my questions and
dissertation drafts allowed me to complete my work in a short amount of time. I am also
appreciative of Chengping Zhang’s and Paul Shelton’s agreement to serve on my
dissertation committee.
I must also acknowledge the support and encouragement provided by each faculty
member of Asbury University’s Dayton School of Business. In my mind, this team is
gold. I especially want to thank Mike Yoder for taking time out of his incredibly busy

PREDICTING THE FINANCIAL VULNERABILITY OF U.S. PUBLIC CHARITIES V
schedule to read a draft of my dissertation and provide feedback and Mike Ross for
helping me understand statistical testing.
Above all, I am grateful for God’s grace and strength that sustained me through
this process. I am in awe that He saw me worthy enough to teach and train individuals. It
is my heart’s desire that what I learned during this journey is used to honor Him and
advance His kingdom. I pray that He continues to do a mighty work in me so that He can
do a great work through me.

PREDICTING THE FINANCIAL VULNERABILITY OF U.S. PUBLIC CHARITIES VI
Abstract
Charitable organizations are significant contributors to the U.S. economy, and Americans
invest billions of dollars into these organizations through their donations. Without these
organizations, additional pressure would be placed on governmental agencies to provide
certain services or those services would not be provided at all, indicating that these
organizations’ long-term survival is necessary. In 1991, Tuckman and Chang published
the seminal work on the financial vulnerability of nonprofit organizations and presented a
model that describes a financially vulnerable organization. Subsequent studies of this
model indicate that the model is predictive; however, those studies did not utilize an
actual financial shock. This study tests the predictive ability of the Tuckman-Chang
model by applying it to charitable organizations that survived and did not survive the
Great Recession, an economic event that negatively affected the charitable sector.
Charitable organizations listed in the 2006 IRS Statistics of Income Exempt
Organizations Sample File (SOI), hosted by the National Center for Charitable Statistics
(NCCS) Data Archive, were compared to those listed in the 2011 IRS SOI File. The
organizations listed in both files were considered to have survived the Great Recession
and those not listed in the 2011 IRS SOI File were considered to have not survived the
Great Recession. The Tuckman-Chang model was applied to all organizations listed in
the 2006 SOI file to classify them as financially not-at-risk, at-risk, and severely-at-risk.
A second model was developed by adding the debt ratio to the original Tuckman-Chang
model. It was applied to the organizations listed in the 2006 SOI file, resulting in a new
list of organizations classified as not-at-risk, at-risk, and severely-at-risk. Binary logistic
regression was utilized to test the relationship between the classifications of financially

PREDICTING THE FINANCIAL VULNERABILITY OF U.S. PUBLIC CHARITIES
VII
at-risk and financially severely-at-risk and organization survival of the Great Recession.
Regression results indicate that both models can predict the survival of a charitable
organization.
Keywords: charitable organizations, non-profit organizations, not-for-profit,
financial vulnerability, Great Recession

PREDICTING THE FINANCIAL VULNERABILITY OF U.S. PUBLIC CHARITIES
VIII
Table of Contents
Dedication iii
Acknowledgements iv
Abstract vi
List of Tables x
Chapter 1 - Introduction 1
Statement of the Research Problem 1
Purpose of Study 3
Significance of Study 5
Overview of Research Question and Hypotheses 6
Definitions of Terms 7
Limitations and Assumptions 10
Chapter 2 – Literature Review 13
Financial Vulnerability Models 13
Tuckman and Chang Model 13
Empirical Studies of the Tuckman and Chang Model 15
Development of Additional Financial Vulnerability Models 17
Defining Financial Vulnerability 24
Financial Vulnerability and the Great Recession 26
Financial Vulnerability and Debt 28
Chapter 3 – Method 33
Research Rationale and Design 33
Research Question and Hypotheses 34
Data 35
Measures 36
Data Analysis 40
Chapter 4 – Results 42
Descriptive Statistics 43

PREDICTING THE FINANCIAL VULNERABILITY OF U.S. PUBLIC CHARITIES IX
Regression Results 46
Results for Hypothesis One 46
Results for Hypothesis Two 49
Supplemental Analysis and Results 52
One-way Analysis of Variance (ANOVA), Hypothesis One 52
One-way Analysis of Variance (ANOVA), Hypothesis Two 54
Multinomial Logistic Regression 56
ANOVA Comparing Metrics of Financial Classifications 61
Chapter 5 – Discussion 69
Implications 72
Limitations and Further Research 73
Conclusion 75
References 76

PREDICTING THE FINANCIAL VULNERABILITY OF U.S. PUBLIC CHARITIES X
List of Tables
Table 1: NTEE Core Codes Major Groups ...................................................................... 10
Table 2: Summary of Population and Data Cleaning ....................................................... 36
Table 3: Financial Metrics with Corresponding Measures ............................................... 39
Table 4: Composition of Sample ...................................................................................... 43
Table 5: NTEE Subsectors, Survival Rates in the Great Recession ................................. 44
Table 6: Classifications of Risk ........................................................................................ 45
Table 7: Classification of Tablea, b Hypothesis One .......................................................... 46
Table 8: Omnibus Test of Model Coefficients, Hypothesis One ...................................... 47
Table 9: Binary Logistic Regression and Financial Vulnerability, Hypothesis One ........ 48
Table 10: Classification of Tablea, b Hypothesis Two ....................................................... 49
Table 11: Omnibus Test of Model Coefficients, Hypothesis Two .................................... 50
Table 12: Binary Logistic Regression and Financial Vulnerability, Hypothesis Two ...... 52
Table 13: ANOVA, Hypothesis One Descriptive Statistics.............................................. 53
Table 14: ANOVA, Hypothesis One Results ................................................................... 53
Table 15: Post Hoc Test – Tukey HSD, Hypothesis One ................................................. 54
Table 16: ANOVA, Hypothesis Two Descriptive Statistics ............................................. 54
Table 17: ANOVA, Hypothesis Two Results .................................................................. 55
Table 18: Post Hoc Test – Tukey HSD, Hypothesis Two ................................................. 55
Table 19: Likelihood Ratio Tests ...................................................................................... 57
Table 20: Parameter Estimates Not-At-Risk Group versus Each of the Other Groups: ... 58
Table 21: Correct Predictions Based on Logistic Model, Hypothesis One and Two ....... 60
Table 22: Comparing Metrics of Financial Classifications, Hypothesis One .................. 61
Table 23: Comparing Metrics of Financial Classifications, Hypothesis One .................. 62
Table 24: Post Hoc Test Metrics of Financial Classifications, Hypothesis One .............. 64
Table 25: Comparing Metrics of Financial Classifications, Hypothesis One .................. 65
Table 26: Comparing Metrics of Financial Classifications, Hypothesis Two .................. 66
Table 27: Post Hoc Test, Metrics of Financial Classifications, Hypothesis Two ............. 68

Running head: PREDICTING THE FINANCIAL VULNERABILITY OF U.S. PUBLIC
CHARITIES
Chapter 1 - Introduction
Statement of the Research Problem
It would be a rare occurrence for an individual to not encounter a nonprofit
organization during their lifetime due to the prominent role these organizations play in
the U.S. economy. These organizations may take the form of a school, hospital, religious
congregation, or membership association. They provide a multitude of services that affect
large groups of people in our society.
In 2016, approximately 1.54 million nonprofit organizations were registered with
the International Revenue Service (IRS), the governmental entity tasked with granting
tax-exempt status (NCCS Project Team, 2020). The number of organizations registered
does not include certain organizations that are not required to register with the IRS,
namely religious congregations and organizations that receive $5,000 or less in annual
gross receipts (Boris & Steuerle, 2006). The IRS grants automatic tax-exempt status to
religious congregations.
The nonprofit sector, defined by Boris and Steuerle (2006) as “those entities that
are organized for public purposes, are self-governed, and do not distribute surplus
revenues as profits” (p.67), has grown over the past ten years (NCCS Project Team,
2020). This sector contributed an estimated $1047.2 trillion to the U.S. economy in 2016,
composing 5.6 percent of the country’s Gross Domestic Product. Public charities, those
classified under Section 501(c)3 of the Internal Revenue Code (IRC), make up the largest
category in the nonprofit sector. These organizations accounted for just over 75 percent of
the sector’s total assets. Financial data aside, nonprofit organizations also contribute to
the economy’s wages and the workforce (Bridgeland et al., 2009).

PREDICTING THE FINANCIAL VULNERABILITY OF U.S. PUBLIC CHARITIES 2
Bowman (2002) highlighted four legal distinctions between for-profit
organizations and nonprofit organizations. The first distinction is that nonprofit
organizations do not have owners; therefore, they do not raise capital funds in the equity
market. The organization’s earnings may not be distributed for the benefit of others and
must be used in relation to the purpose and mission of the organization. The second
distinction, specifically for public charities that may receive donations that provide a tax
benefit to the donor, is that donors can restrict the use of donated assets. Third, nonprofit
organizations are not subject to involuntary bankruptcy, though they may file on a
voluntary basis. The fourth distinction is that nonprofit organizations may sell bonds at
tax-exempt rates.
Zietlow et al. (2018) also pointed out that nonprofit organizations have
governance structures that preclude self-interest and personal financial gain and that the
organizations are exempt from paying federal income taxes. They are also entities with a
public service mission. Michalski et al. (2018) indicated that nonprofit organizations are
entities with activities that realize their social value-adding mission. They state, “The
main difference between nonprofit organizations and for-profit businesses is an
economical calculation and the financial motivation of the staff, capital providers, and the
whole group of stakeholders” (p. 530).
Americans also substantially invest in nonprofit charitable organizations. In 2019,
these organizations received $449.64 billion, with the largest percentage of giving
coming from individuals (Giving USA, 2020). The top three types of organizations
receiving donations are those that are focused on religion, education, and human services.
The total giving in 2019 increased by almost 3 percent from 2018 (inflation-adjusted).

PREDICTING THE FINANCIAL VULNERABILITY OF U.S. PUBLIC CHARITIES 3
Though nonprofit organizations are a contributing factor to the U.S. economy and
are substantially invested in by the American public, a vast majority of nonprofits are
small to midsize organizations (Bridgeland et al., 2009). In 2009, 75 percent had annual
budgets of less than $500,000, while only 4 percent had budgets over $10 million
(Gordon et al., 2013).
Nonprofit organizations are not immune to economic struggles. The bursting of
the “dot.com” bubble in 2000 and the terrorist attacks on September 11, 2001 negatively
affected them (Keating et al., 2005). Economic conditions impact the financial health of
nonprofit organizations in a variety of ways. These include a decrease in individual
giving affected by a decline in personal income and employment rates, a decline in
corporate profits reducing corporate donations, a negative impact on endowment earnings
from declines in the stock and bond markets, and a contraction in government contracts
and grants.
The Great Recession also negatively impacted the nonprofit sector (Reich &
Wimer, 2012). Total charitable giving fell during the recession (Brooks, 2018) along with
other forms of organization revenue (Dietz et al., 2014). Costs also increased as the
demands for services increased (Bridgeland et al., 2009). The Great Recession provided a
“perfect storm” of impacts that stressed nonprofit organizations (Salamon et al., 2009).
Purpose of Study
In 1991, Tuckman and Chang published their seminal article on the financial
vulnerability of nonprofit charitable organizations. They presented four financial metrics
that are descriptive of financially vulnerable charitable organizations: low equity balance,
concentration of revenue sources, low administrative costs, and low operating margins.

PREDICTING THE FINANCIAL VULNERABILITY OF U.S. PUBLIC CHARITIES 4
Organizations were labeled financially at-risk if they are in the bottom quintile for any
one metric and financially severely-at-risk if they are in the bottom quintile for all four
metrics. Their model has become the direct and indirect subject of empirical tests since its
introduction. The results of the testing indicate that the model can predict the financial
vulnerability of nonprofit charitable organizations. However, multiple definitions of
financial vulnerability have been used in testing.
Tuckman and Chang (1991) defined a financially vulnerable nonprofit
organization as one that “is likely to cut back its service offerings immediately when it
experiences a financial shock” (p. 445). Other definitions include adverse shifts in
financial health (Keating et al., 2005), failure to meet the organization’s mission (Tevel et
al., 2015), reduction in program expenditures for three consecutive years (Greenlee &
Trussel, 2000), a 20 percent decrease in net assets over three years (Trussel, 2002), and
insolvency for two consecutive years (Searing, 2018). These definitions point to a crux in
financial vulnerability: the nonprofit organization’s ability to withstand a financial shock.
A financial shock may be an economic downturn, the loss of a major donor, or a lawsuit
(Trussel et al., 2002; Tuckman & Chang, 1991). However, to my knowledge, prior testing
of a nonprofit charitable organization’s financial vulnerability has not included an actual
financial shock.
An actual financial shock that affected the charitable sector was the Great
Recession that occurred from December 2007 to June 2009. Charitable organizations
experienced a decrease in donations during that time (Brooks, 2018; Giving USA, 2008).
They also experienced declines in government funding, endowments, and other
investments (Morreale, 2011; Reich & Wimer, 2012; Salamon et al., 2009). It is evident

PREDICTING THE FINANCIAL VULNERABILITY OF U.S. PUBLIC CHARITIES 5
that the Great Recession had a negative impact on the charitable sector; however, to my
knowledge, there is minimal research on the relationship between the Great Recession
and the financial vulnerability of nonprofit charitable organizations.
The purpose of this quantitative study was to pull together each of the elements
discussed. It was to empirically test the predictive ability of Tuckman and Chang’s (1991)
model of financial vulnerability for nonprofit charitable organizations using the Great
Recession as an actual financial shock to the charitable sector.
Significance of Study
The origins of the U.S. tax-exempt sector predate the formation of the government
(Arnsberger et al., 2008). Charitable organizations were formed to confront a variety of
issues at that time. Public charities continue to serve the public good for religious,
philanthropic, scientific, literary, or educational purposes. The overarching significance
of this study is to provide information that will support the longevity of these
organizations.
This study contributes to the vast literature on nonprofit organizations. It also
adds to the literature on the financial vulnerability of charitable organizations by testing
the predictability of Tuckman and Chang’s (1991) model of financial vulnerability using
an actual financial shock that affected charitable organizations. This study also
contributes to studies on the Great Recession by further examining its relationship to the
financial vulnerability of charitable organizations.
This study provides the management of nonprofit charitable organizations with a
group of financial metrics that can be used in strategic decision-making and in assessing
the financial health of the organization. The use of these metrics may allow management

PREDICTING THE FINANCIAL VULNERABILITY OF U.S. PUBLIC CHARITIES 6
of nonprofit organizations to make strategic decisions that may allow the organization to
fulfill its mission and programs for an extended period. Management’s use of the
information in this study may allow charitable organizations to be prepared for inevitable
financial shocks, thus, resulting in the continuation of public charities that serve the
public good. As Denison and Beard (2003) noted, “Without the nonprofit sector, public
agencies would be forced to provide more services or community needs would simply go
unmet” (p. 24).
Overview of Research Question and Hypotheses
This research study sought to determine if the seminal model of nonprofit
charitable organization financial vulnerability developed by Tuckman and Chang (1991)
predicts certain nonprofit organizations’ demise due to a financial shock. Therefore, this
study sought to answer the following question: Does the Tuckman and Chang model of
financial vulnerability accurately predict a charitable organization’s survival of a
financial shock? The associated null and alternative hypotheses were:
HO1: A charitable organization’s financial vulnerability has no effect on the
organization’s ability to survive a financial shock.
HA1: More financially vulnerable charitable organizations are less likely to
survive a financial shock than charitable organizations that are not financially
vulnerable.
This study also sought to determine if the predictive ability of the Tuckman-
Chang model is increased by adding the debt ratio to the model. The associated null and
alternative hypotheses were as follows:

PREDICTING THE FINANCIAL VULNERABILITY OF U.S. PUBLIC CHARITIES 7
HO2: Debt does not affect a charitable organization’s financial vulnerability or its
ability to survive a financial shock.
HA2: Charitable organizations that are more financially vulnerable due to debt are
less likely to survive a financial shock than charitable organizations that are not
financially vulnerable.
Definitions of Terms
The following list of terms and acronyms are used in this study.
Administrative costs: The expenses associated with the management and general
activities of the nonprofit organization. FASB Accounting Standards Update No.
2016-14 defines management and general activities as “Supporting activities that
are not directly identifiable with one or more program, fundraising, or
membership-development activities” (p. 11).
Charitable sector: Those entities that are organized for public purposes, are self-
governed, and do not distribute surplus revenues as profits” (Boris & Steuerle,
2006, p. 67). Also referred to as the nonprofit sector.
Financial vulnerability: The definition of financial vulnerability for this study is if
the nonprofit organization cannot survive a financial shock. Additional definitions
are discussed in Chapter 2.
Financially at-risk: A charitable organization is listed in the bottom quintile of at
least one of the four financial metrics in the Tuckman-Chang model of financial
vulnerability or of at least one of the five financial metrics in the extended
Tuckman-Chang model.

PREDICTING THE FINANCIAL VULNERABILITY OF U.S. PUBLIC CHARITIES 8
Financially not-at-risk: A charitable organization is not listed in the bottom
quintile of any of the four financial metrics in the Tuckman-Chang model of
financial vulnerability or any of the five financial metrics in the extended
Tuckman-Chang model.
Financially severely-at-risk: A charitable organization is listed in the bottom
quintile of all four financial metrics in the Tuckman-Chang model of financial
vulnerability or of all five financial metrics in the extended Tuckman-Chang
model.
Form 990: Form 990 is the Return of Organization Exempt from Income Tax
required to be filed with the IRS by most organizations exempt from income tax
under Internal Revenue Code section 501(a). Organizations with gross receipts of
$50,000 or less may file Form 990-N. Organizations with gross receipts less than
$200,000 and total assets at the end of the tax year less than $500,000 may file
Form 990-EZ. Tax-exempt organizations deemed to be private foundations must
file Form 990-PF.
Great Recession: The Great Recession was an economic crisis that occurred from
December 2007 to June 2009, resulting from issues within the housing market
that spread to the financial sector (Hurd & Robwedder, 2010).
IRC: This is an acronym used to identify the Internal Revenue Code.
IRS: This is an acronym used to identify the Internal Revenue Service, the U.S.
tax administrative agency.

PREDICTING THE FINANCIAL VULNERABILITY OF U.S. PUBLIC CHARITIES 9
NCCS: This is an acronym used to identify the National Center for Charitable
Statistics. The NCCS provides a variety of databases containing information
about the nonprofit sector.
NTEE: This is an acronym used to identify the National Taxonomy of Exempt
Entities. The NTEE system was developed in the mid-1980s and provides a
“mixed notation (letters and numbers) organization classification system of 630
centile level codes, collapsible into 26 major groups, collapsible into 10 major
categories” (National Center for Charitable Statistics, p. 16). The ten major
categories are used in this study.
Net assets: The residual interest in the assets of an entity that remains after
deducting its liabilities (FASB, 2008). For nonprofit organizations, net assets are
the difference between the organization’s assets and liabilities and are divided into
two classes based on the presence or absence of donor-imposed restrictions: net
assets without donor restrictions and net assets with donor restrictions.
Public charity: An organization that is considered tax-exempt under Internal
Revenue Code 501(c)3. These organizations are organized for exclusively
charitable purposes including religious, charitable, scientific, literary, and
educational purposes. They may also receive donations that may provide a tax
benefit to the donor.
Tax-exempt: The Internal Revenue Service may grant tax-exempt status to certain
organizations that file an application with the IRS and meet the tax-exempt
definitions in IRC Section 501(a). These organizations are exempt from federal
income tax and may be exempt from other state and property taxes.

PREDICTING THE FINANCIAL VULNERABILITY OF U.S. PUBLIC CHARITIES 10
Limitations and Assumptions
This research study is subject to certain limitations and assumptions. This study
includes only nonprofit public charities classified as tax-exempt under IRC Section
501(c)3 and does not include private foundations or other organizations that are tax-
exempt under other IRC sections. This limitation reduces the ability to generalize the
results of this study across the entire nonprofit/tax-exempt sector.
Public charities are further classified into one of the ten major groups or
subsectors using the National Taxonomy of Exempt Entities (NTEE) system. Each
subsector and organization within each subsector may vary in size, purpose, and
geographical location. Macroeconomic conditions may have a different effect on each
subsector. This study does not isolate one subsector for testing but includes all subsectors
listed in the data file. Table 1 presents the ten NTEE Core Code major groups.
Table 1: NTEE Core Codes Major Groups
NTEE Core Codes Major Groups
Code Category
AR Arts, culture, and humanities
ED Education
EN Environment
HE Health
HU Human services
IN International, foreign affairs
MU Mutual/Membership benefit
PU Public and societal benefit
RE Religion
UN Unknown, unclassified

PREDICTING THE FINANCIAL VULNERABILITY OF U.S. PUBLIC CHARITIES 11
The National Center for Charitable Statistics (NCCS) maintains databases
utilizing information from the IRS Form 990 required to be filed by U.S. tax-exempt
organizations. This study’s primary data source is the IRS Statistics of Income Exempt
Organizations Sample (SOI) File, which contains information from a weighted sample of
tax-exempt organizations that report a Form 990. However, the SOI File may not be
representative of the entire nonprofit sector. Due to the IRS’s minimum filing threshold,
tax-exempt organizations with gross receipts less than $25,000 are not required to file.
Further, churches and similar organizations are not required to file. Consequently, these
organizations may not be included in the SOI File unless they elected to file and may not
be represented in this study.
It is also possible that Form 990s filed with the IRS may include inaccurate and
erroneous information. However, studies show that the information from Form 990
filings may be relied upon for research purposes (Froelich & Knoepfle, 1996; Froelich et
al., 2000).
To adequately test the predictability of the Tuckman-Chang model of financial
vulnerability using the Great Recession as a financial shock, we must look for
organizations that existed prior to the start of the Great Recession and remain in existence
after the Great Recession. Nonprofit organizations are not subject to involuntary
bankruptcy (Bowman, 2002) and may cease to exist for various reasons. An assumption
of this study is that the organization ceased to exist, thereby not surviving the Great
Recession, if it is not listed in the 2011 SOI File, though the organization may not be
listed for other reasons
PREDICTING THE FINANCIAL VULNERABILITY OF U.S. PUBLIC CHARITIES 12
This study utilized a binary logistic regression analysis to examine a relationship
between the Tuckman-Chang model of charitable organization financial vulnerability and
an organization’s survival of a financial shock. It is assumed that this correlational
analysis method is appropriate for this study because it allows for an examination of a
relationship between the study’s variables.

PREDICTING THE FINANCIAL VULNERABILITY OF U.S. PUBLIC CHARITIES 13
Chapter 2 – Literature Review
This chapter provides information on Tuckman and Chang’s (1991) seminal work
on nonprofit organization financial vulnerability. It also discusses the empirical testing
and indirect testing of the Tuckman-Chang model as well as the definitions of financial
vulnerability used in those studies. Finally, this chapter discusses the impact of the Great
Recession and the use of debt on nonprofit charitable organizations.
Financial Vulnerability Models
The financial vulnerability of nonprofit charitable organizations has been the
source of testing since its introduction by Tuckman and Chang (1991). This section
describes the Tuckman and Chang model, empirical testing of that model, and the
development of additional models.
Tuckman and Chang Model
In their seminal article, Tuckman and Chang (1991) defined a financially
vulnerable nonprofit organization as one that “is likely to cut back its service offerings
immediately when it experiences a financial shock” (p. 445). The underlying idea is that a
cut back in service offerings results in a reduction of program offerings and the related
expenses. They presented four measures of financial vulnerability that result from the
idea that “Financial flexibility is assumed to exist if an organization has access to equity
balances, many revenue sources, high administrative costs, and high operating margins”
(p. 450). The four measures of financial vulnerability are a low equity balance, a
concentration of revenue sources, a low administrative costs ratio, and low or negative
operating margins.

PREDICTING THE FINANCIAL VULNERABILITY OF U.S. PUBLIC CHARITIES 14
Tuckman and Chang (1991) considered equity an important factor of financial
vulnerability for four reasons. An adequate equity balance increases the organization’s
ability to borrow any necessary capital. Any unrestricted liquid assets represented in the
organization’s equity can be converted to cash to cover any lost short-term revenue. Any
long-term assets represented in equity could eventually be sold if the loss of revenue
persists. Finally, a nonprofit can alter its services to allow for the use of any restricted
equity.
Tuckman and Chang (1991) noted that charitable organizations may be affected
by unstable revenue, especially if the organization’s primary funding comes from
donations due to the donors’ inconsistent nature and any economic impact on donations.
Due to the potential instability of revenue, the authors posited that a charitable
organization with diversified revenue sources is less financially vulnerable than those
without diversified revenue sources. Revenue concentration was measured using a
Herfindahl Index employing five sources of nonprofit revenue. The index measures one if
there is only one revenue source; conversely, organizations with diversified revenue
sources will have an index moving towards zero.
Tuckman and Chang (1991) also posited that an organization with lower
administrative costs may be less able to withstand financial shocks. They noted that
organizations with higher administrative costs that experience revenue loss may reduce
administrative costs before reducing or eliminating any program spending. The measure
was operationalized as a ratio of total administrative expenses to total expenses.
Finally, Tuckman and Chang (1991) considered nonprofit organizations with
higher operating margins to be less financially vulnerable due to the potential surplus
PREDICTING THE FINANCIAL VULNERABILITY OF U.S. PUBLIC CHARITIES 15
from which they may draw during a time of financial shock. Operating margin was
operationalized as the ratio of the net of total revenues and total expenses to total
expenses.
Tuckman and Chang (1991) applied descriptive testing of their financial
vulnerability measures to a sample of charitable organizations that filed a Form 990 with
the Internal Revenue Service in the 1983 tax year. They labeled nonprofits with one
measure in the lowest quintile of the sample as “at-risk” and nonprofits with all measures
in the lowest quintiles of the sample as “severely at risk.”
Empirical Studies of the Tuckman and Chang Model
The Tuckman and Chang (1991) indicators of financial vulnerability have been
the subject of direct empirical tests and have been indirectly tested in other studies. This
section discusses the testing, extension, and expansion of the Tuckman and Chang model.
Greenlee and Trussel (2000) considered a financially vulnerable charitable
organization as one that reduces program expenditures for three consecutive years. They
noted that program expenses provide a reasonable proxy of year-to-year changes in
program services. They used program expenses instead of net income because programs
are the focus of charitable nonprofit organizations. They extended the Tuckman and
Chang model by using those financial indicators to identify a charitable organization’s
financial vulnerability. Their model shows that all measures but equity are significant.
The overall model is significant and able to predict with reasonable accuracy if a charity
meets the definition of a financially vulnerable nonprofit organization.
Hager (2001) applied the Tuckman and Chang (1991) measures to charitable arts
organizations “to determine if the usefulness differs across types of organizations” (p.

PREDICTING THE FINANCIAL VULNERABILITY OF U.S. PUBLIC CHARITIES 16
377). An organization is determined to be financially vulnerable if it does not provide the
IRS Form 990 for three consecutive years. The results of testing indicated that the
Tuckman and Chang model predicts these organizations’ financial vulnerability and may
be used to assess different sectors of charitable organizations.
Trussel (2002) extended the work of Tuckman and Chang (1991) and Greenlee
and Trussel (2000) to develop an alternative model that predicts financial vulnerability.
He noted that “Financial vulnerability is an organization’s susceptibility to financial
problems” (p. 17), and he defined a financially vulnerable charity as one that reports a 20
percent decrease in net assets over three years. He removed the equity ratio and the
administrative costs ratio used in the Tuckman and Chang model. He included the debt
ratio, operationalized as total liabilities over total assets, and the organization’s size
measured by the natural log of the organization’s total assets. The results of his testing
indicate that each measure is significant and that the model as a whole is statistically
significant and can be used to predict financial vulnerability.
Trussel et al. (2002) developed a financial vulnerability index that nonprofit
organizations can use to assess if they are financially vulnerable to a financial shock.
They developed the index by using the Tuckman and Chang model without the equity
ratio and added the debt ratio and the organization’s size and sector. They suggested
comparing individual organization results of the financial metrics to industry
benchmarks.
Trussel and Greenlee (2004) used the Tuckman-Chang model’s financial
measures to develop a model to predict if a charitable organization will become
financially distressed. They defined a financially distressed charity as "an organization

PREDICTING THE FINANCIAL VULNERABILITY OF U.S. PUBLIC CHARITIES 17
that has a significant net reduction in its equity balance (i.e., net assets) over a three-year
period" (p. 101). They developed two models using two definitions of significant
reduction: (1) a 20 percent reduction in net assets over three years and (2) a 50 percent
reduction in net-assets over three years. They expanded Greenlee and Trussel's (2000)
model by controlling for the organization’s size and sector. Both models are significant
and able to predict if a charitable organization will become financially distressed. They
also noted that the variables of equity, margin, and size are significant and that the
variables for revenue concentration and administrative costs are not significant.
Thomas and Trafford (2013) extended the work of Tuckman and Chang (1991) by
developing a Charities and Financial Exposure Index (CFEI) using three of the four
measures in the Tuckman and Chang model. The removal of the administrative cost ratio
allows the CFEI to more accurately predict the charities that are financially vulnerable.
Development of Additional Financial Vulnerability Models
Other studies of financial vulnerability measures were conducted to further
explore the use of predictive models of financial vulnerability. Additional testing of
nonprofit financial vulnerability also revealed that more than one metric is needed to
label a financially vulnerable nonprofit organization. Denison and Beard (2003) used the
definitions presented in the literature current at that time to present a three-stage
“continuum of vulnerability” (p. 25) that described the symptoms of financial
vulnerability and suggests that organizations can move through the stages at different
paces.
Bowman (2011) proposed a financial model that provides a set of key financial
indicators to assess a nonprofit organization’s financial objectives. This model extended

PREDICTING THE FINANCIAL VULNERABILITY OF U.S. PUBLIC CHARITIES 18
the work of Tuckman and Chang (1991) by considering a more extended period of time.
The concepts of financial capacity and financial sustainability are keys to the model.
According to Bowman (2011), "The proposed model assumes that (1) a long-run
objective is maintaining or expanding services, and (2) a short-run objective is to develop
resilience to occasional economic shocks while making progress toward meeting long-
term objectives" (p. 39). The ability to meet the long-run objectives was measured by an
equity ratio and return on assets. The ability to meet the short-run objective was measured
by maintaining the appropriate level of unrestricted net assets to cover spending on
operations.
Chickoto-Schultz and Neely (2016) built upon Bowman’s (2011) identification of
financial capacity and financial sustainability as key financial indicators by looking for
characteristics of high financially performing nonprofit organizations, thus providing key
predictors of nonprofit financial health. They drew upon Carroll and Stater’s (2008)
measure of revenue volatility to measure financial stability. The testing results indicated
that financially high performing nonprofit organizations (those that exhibit financial
capacity and financial stability) maintain overhead costs, receive government grants, and
invest in capital assets. The results of testing also “suggest that to grow one’s financial
capacity, as well as remain financially stable, nonprofits need to generate more revenue
as well as utilize their assets and reserves” (p. 2573).
Cordery, Sim, and Baskerville (2013) used the financial vulnerability literature to
develop and test three conceptual models of financial vulnerability using amateur sports
clubs in New Zealand. Financial vulnerability was defined as follows for the three
models:

PREDICTING THE FINANCIAL VULNERABILITY OF U.S. PUBLIC CHARITIES 19
1. A reduction in program expenditures as a percentage of revenue over three
years, based on the research of Tuckman and Chang (1991), Hager (2001),
and Greenlee and Trussel (2000).
2. A three-year decline in net assets, based on the research of Trussel (2002),
Trussel et al. (2002), and Trussel and Greenlee (2004).
3. A decline in net earnings developed from the research of Hodge and Piccolo
(2005), Carrol and Stater (2009), and Keating et al. (2005).
Their testing results indicated that different models were useful for different types
of clubs; however, the reduction in net earnings model appeared to be the best prediction
model for identifying sports clubs that were financially vulnerable. The testing results
also demonstrated that not all prediction models are alike and that models may need to be
tailored for the nonprofit industry’s subsectors.
Vermeer, Raghunandan, and Forglone (2013) defined a financially distressed
nonprofit as one that “has either a deficit in total net assets (fund balance) or a deficit for
the current year” (p. 116). They used a logistic regression model to examine the factors
associated with an auditor issuing a going concern modified audit opinion. Their testing
results indicated that a nonprofit is more likely to receive a going concern modified audit
opinion if it is financially stressed, small, has a lower program expense ratio, and a high
number of internal control related audit findings.
Additional studies were conducted to test Tuckman and Chang’s (1991) model
and to compare its predictive ability against Altman’s (1968) and Ohlson’s (1980) models
used to predict bankruptcy of for-profit entities. Keating et al. (2005) tested four financial
vulnerability proxies using the Altman (1968), Ohlson (1980), and Tuckman and Chang

PREDICTING THE FINANCIAL VULNERABILITY OF U.S. PUBLIC CHARITIES 20
(1991) models. The four proxies are insolvency risk, defined as negative net assets;
financial disruption, defined as “a 25 percent or greater decline in total revenues during a
12-month period” (p. 11); funding disruption, defined as “a 25 percent decline in total
revenues during a 12-month period” (p.11); and program disruption, defined as “a 25
percent or more reduction in allocations to program expenses during a 12-month period”
(p. 12). Their testing results indicated that each may be used as a proxy for financial
vulnerability. The Ohlson model was found to have the highest explanatory power for
each measure. However, the Ohlson model was not significant in Tevel, Katz, and
Brock’s (2015) study.
Tevel et al. (2015) tested the predictive values of the Ohlson (1980) model,
Tuckman and Chang’s (1991) model, and a practitioners’ model based on rating
information used by the UK New Philanthropy Capital and the Israeli Midot. The
Tuckman and Chang model was found significant in predicting the financial vulnerability
of charitable organizations. The researchers performed additional testing to “generate a
more parsimonious Tuckman and Chang model” (p. 2509). The additional testing results
indicated that two measures are the strongest predictors: management costs reported in
administrative expenses and revenue concentration. Their study also noted that
organization size measured by net assets is correlated to financial vulnerability.
Gordon et al. (2013) used discrete hazard models to compare and test the financial
vulnerability models of Altman (1968), Ohlson (1980), Tuckman and Chang (1991), and
one developed using financial indicators recommended by the Internal Revenue Service.
They defined a financially distressed organization as insolvent, measured by total
liabilities exceeding total assets. They controlled for the fiscal year and sub-industry

PREDICTING THE FINANCIAL VULNERABILITY OF U.S. PUBLIC CHARITIES 21
group. Their testing results indicate that all of the Tuckman and Chang variables are
significant and that the IRS model has the lowest explanatory power of the models tested.
The results also indicate that financial vulnerability differs considerably across broad
nonprofit industry sectors and that the arts sector has the highest rate of insolvency.
Gordon et al. (2013) also developed and tested a composite model based on the
significant variables from the tested models and variables suggested from the literature.
The composite model consisted of eleven variables, ten of which were significant. With
the idea that the use of eleven variables may be cumbersome for users of nonprofit
financial statements, they moved forward with developing a parsimonious model of
financial vulnerability. The parsimonious model parallels the for-profit Dupont model but
includes variables for profitability, measured as two preceding years with a deficit; asset
turnover, measured by net assets divided by total revenue; and leverage, measured by
dividing net assets by total assets. This model significantly outperformed traditional
models.
Focusing on nonprofit human service organizations and higher education
institutions, Prentice (2016a) expanded the financial vulnerability models and revenue
volatility by examining the effects of environmental factors on a nonprofit’s financial
health. The environmental factors are gross domestic product (GDP), state product (SP),
median household income, and competition and niche by measuring the organization’s
revenue share at the regional, state, and national level. Eight accounting variables and
two revenue variables were included in the testing.
The testing results indicated that economic factors impacted both nonprofit
sectors included in the study, though only GDP was statistically significant for both.

PREDICTING THE FINANCIAL VULNERABILITY OF U.S. PUBLIC CHARITIES 22
Regarding the accounting variables, only the measure of net income over total assets was
statistically significant. Neither of the revenue variables was significant. Prentice (2016a)
concluded that environmental variables influence nonprofit financial health and that “…
the utility of the accounting variables is in demonstrating that it is essential for nonprofit
managers to maintain asset reserves that go beyond current fiscal year income” (p. 904).
Prentice (2016b) presented research that considers the number of financial
measures to capture the accounting constructs of liquidity, solvency, margin, and
profitability. The testing results indicated that the organization’s subsector has minimal
effect and that measures should not be combined to create indexes. Prentice (2016b)
suggested that nonprofit researchers should make the financial measure, not concepts, the
elements of interest.
Andres-Alonso, Garcia-Rodriguez, and Romero-Merion (2016) analyzed the
traditional variables used to define financially vulnerable nonprofit organizations in prior
studies. The traditional variables are deduction in net assets, reduction in program
expenses, and reduction in revenue. The study’s results indicated that a reduction in net
assets is the traditional variable that best defines financial vulnerability. However, the
authors noted that “it needs to be supplemented, as it does not include all the aspects of
this complex concept” (p. 2557). The results of the study indicate that looking at just one
variable will alter which nonprofits are vulnerable. Therefore, they expanded the
definition of financial vulnerability into a proposed three-dimensional model that assesses
operational vulnerability, measured by a variation in net assets overtime; leverage
vulnerability, measured by a ratio of total assets to total debt; and liquidity vulnerability,

PREDICTING THE FINANCIAL VULNERABILITY OF U.S. PUBLIC CHARITIES 23
measured by the ratio of current assets to current debt. Though not yet tested, they
proposed the following definition of financial vulnerability:
… an organization is classified as “highly financially vulnerable” if it
simultaneously meets three different criteria: a large reduction in net assets during
the last three years, a low proportion of total assets to debt, and a low ratio of its
current assets regarding short-term debt (p. 2558).
Kim (2017) extended the previous studies of financial vulnerability by testing the
effect of financial stability and operating efficiency on nonprofit arts organizations’
program outcomes. Indicators of financial vulnerability used in prior studies were used as
the measures of financial stability. However, Kim (2017) used the administrative cost
ratio as a measure of operating efficiency instead of financial stability. Kim (2017) also
expanded the testing by calculating four indexes for revenue concentration and
considering if a nonprofit is donative in nature. Audience attendance was the measure of
program outcome. The results of testing indicated that revenue diversification has a
positive impact on program outcomes. There is a negative relationship between program
outcomes and reliance on donations and an increase in operating margin. Operating
efficiency and equity do not have a significant effect on program outcomes. According to
Kim (2017), “The results show that not all financial attributes that are supposed to
enhance a nonprofit’s fiscal health improves program performance” (p. 543). However, it
is logical to consider the impact of program performance on the organization’s financial
health.
Searing (2018) used two financial vulnerability definitions when examining
vulnerable nonprofits that recovered in two years. The nonprofits definitions were (1)

PREDICTING THE FINANCIAL VULNERABILITY OF U.S. PUBLIC CHARITIES 24
when liabilities exceed assets for two consecutive years, and (2) when net assets decrease
by more than 25 percent annually for two consecutive years. Searing (2018) considered
financial vulnerability measures by examining vulnerable nonprofit organizations that
recovered in two years. The measures used were equity, surplus margin, revenue
concentration, size, and age, with controls for year and sector effects. The results of the
study indicate a relationship between the equity ratio and revenue diversification and the
ability to recover financially. There was also support that a higher surplus margin will
result in financial recovery. Organization age and size have minimal impact.
Defining Financial Vulnerability
The underlying consideration of financial vulnerability is assessing if a nonprofit
organization can withstand a financial shock. Examples of a financial shock include an
economic downturn, the loss of a major donor, or a lawsuit (Tuckman & Chang, 1991;
Trussel et al., 2002). Keating et al. (2005) noted that the four proxies for financial
vulnerability are “measures of dramatic adverse shifts in financial health, all of which
relate to the ability of a nonprofit organization to carry out its mission” (p. 11). Tevel et
al. (2015) also noted that financial vulnerability is “an organization’s susceptibility to
financial problems” (p. 2502), which could result in the reduction or discontinuation of
services and the subsequent failure to meet the organization’s mission.
The accounting principle going concern considers an entity’s ability to continue
operations. It assumes the ongoing use of assets and payments of debts during normal
operations. According to FASB Accounting Standards Update No. 2014-15, “U.S.
auditing standards and federal securities law require that an auditor evaluate whether
there is substantial doubt about an entity’s ability to continue as a going concern for a

PREDICTING THE FINANCIAL VULNERABILITY OF U.S. PUBLIC CHARITIES 25
reasonable period of time not to exceed one year beyond the date of the financial
statements being audited” (p. 1). It also notes that management should evaluate any
conditions or events that raise a concern about the organization’s ability to continue as a
going concern.
The FASB statement also notes that substantial doubt about an entity’s ability to
continue as a going concern exists “when relevant conditions and events, considered in
the aggregate, indicate that it is probable that the entity will be unable to meet its
obligations as they become due within one year after the date that the financial statements
are issued (or available to be issued)” (p. 2). Conditions and events (among others) that
FASB ASU No. 2014-15 suggests to include are current financial conditions, obligations,
funding, and other adverse conditions and events. The Accounting and Audit Guide for
Not-for-Profit Entities provides examples of events and conditions that may impact a
nonprofit entity’s ability to continue as a concern. The examples include:
Insufficient unrestricted revenues to provide supporting services;
High ratio of fundraising expenses to contributions or a low program ratio;
Interfund borrowing;
Activities that could jeopardize tax-exempt status;
Violations of laws;
External events that could affect donors motivations to continue to contribute;
Decreases in revenues contributed by repeat donors; and
A loss of major funding sources (p. 42).
Substantial doubt about an organization’s ability to continue as a going concern
indicates that an organization may not exist in the near future or may be vulnerable to a
PREDICTING THE FINANCIAL VULNERABILITY OF U.S. PUBLIC CHARITIES 26
financial shock, thus reflecting the overall idea of the financial vulnerability of an
organization. The definition of financial vulnerability for this research study is whether or
not the nonprofit organization has the ability to survive a financial shock. A recent
financial shock that had a significant impact on nonprofit organizations and included
many examples from the Accounting and Audit Guide is the Great Recession.
Financial Vulnerability and the Great Recession
The Great Recession occurred from December 2007 to June 2009 and is
considered a result of issues within the housing market that spread to the financial sector
(Hurd & Robwedder, 2010). The Great Recession’s impact felt greater than other
recessions due to shocks felt in the housing, stock, and labor markets.
Tzifakis et al. (2017) presented a case study of the impact of an economic crisis
on nonprofit organizations in Greece. They noted that individual donations to nonprofits
decreased in proportion to total funding and absolute numbers after the crisis. Their case
study also described how Greek nonprofit organizations implemented new strategies after
the crisis to increase financial strength, including reducing operating costs and an attempt
to diversify income sources.
Nonprofit organizations in the United States show similar reactions to economic
downturns. The U.S. nonprofit sector was stretched in the economic downturn of the
Great Recession (Reich & Wimer, 2012). Salamon et al. (2009) surveyed a sample of
U.S. nonprofits in April 2009. Of those responding, 80 percent reported some level of
financial stress from September 2008 to March 2009, with 40 percent of those
respondents indicating the stress to be “severe” or “very severe.” The researchers noted
that a “perfect storm” of impacts contributed to the stress: declining revenues, increased

PREDICTING THE FINANCIAL VULNERABILITY OF U.S. PUBLIC CHARITIES 27
costs, declining endowments, and decreased cash flow due to restricted credit and
government payment delays (p. 1). Adding to the stress is an increase in demand for
nonprofit services during a recession (Bridgeland et al., 2009).
The external economic environment has an effect on a nonprofit’s financial
health, as noted in a study conducted by Lin and Wang (2016). They performed testing
that considered organizational strategies and characteristics that helped charitable
organizations to survive the Great Recession. They considered fundraising efforts, the
Tuckman and Chang (1991) indicators of financial vulnerability, and the organization’s
debt. The testing results indicate that external funding relationships, higher operating
margin and equity ratio, and lower debt ratio and administrative cost ratio may improve a
charity’s ability to survive a financial crisis.
Charitable organizations were more likely to experience a decline in revenue than
to close during the recession period (Dietz et al., 2014). There were declines in federal,
state, and local government funding (Morreale, 2011; Salamon et al., 2009). Endowments
fell (Salamon et al., 2009), and foundations and bequests suffered from losses in the stock
market and other investments (Reich & Wimer, 2012). However, program income held up
better than other revenue sources, despite a decline (Salamon et al., 2009).
Recessions also affect giving to charitable organizations. Total charitable giving
fell an average of 2.7 percent during recessions that occurred before the Great Recession
(Giving USA, 2008). Individual charitable giving peaked in 2005 before the Great
Recession and declined rapidly from 2007 to 2009 (Brooks, 2018). Studies on charitable
giving during the time of the Great Recession indicate that the recession’s negative
impact on individual income, wealth, and homeownership resulted in a decline in

PREDICTING THE FINANCIAL VULNERABILITY OF U.S. PUBLIC CHARITIES 28
donations to charitable organizations (Brooks, 2018; Marx & Carter, 2014; Meer et al.,
2016; Osili et al., 2019).
Financial Vulnerability and Debt
Taking on debt may be a sensitive activity for many nonprofit organizations.
However, the organization’s management must choose to finance expenditures out of
current financial resources or through borrowing (Denison, 2009; Lam et al., 2020).
Nonprofits take on debt to cover a temporary shortage in cash flows (Bowman, 2015;
Charles, 2018) and to finance capital (Bowman, 2015; Charles, 2018; Yan et al., 2009).
Other reasons for incurring debt include taking advantage of an opportunity or
refinancing existing debt (Charles, 2018).
Tuckman and Chang (1993) presented two categories of nonprofit borrowing:
productive borrowing that “occurs when administrators expect the returns from borrowed
funds to exceed the costs of borrowing them” (p.349) and problematic borrowing that
“occurs when administrators borrow funds even though they expect that the returns from
the use of these funds will be less than their cost” (p.349). Examples of productive
borrowing include short-term bridge loans, program expansion, and taking advantage of
leverage.
Lam et al. (2020) noted two advantages of nonprofit organizations taking on debt.
The advantages include obtaining quick capital at a relatively low cost and the
maintenance of organization programs. Mitchell and Calabrese (2018) also noted that
many nonprofits may lack sufficient funds to survive financial shocks and that debt may
be an “important (if imperfect) vehicle for maintaining program continuity during
economic downturns” (p.7).

PREDICTING THE FINANCIAL VULNERABILITY OF U.S. PUBLIC CHARITIES 29
Though debt financing has advantages and opportunities, it also increases the
organization’s financial risk (Denison, 2009). Taking on debt commits future cash flow to
pay that debt (Charles, 2018). Fixed interest payments could result in deficits if revenues
are less than expected (Denison, 2009) and reduce future program outputs (Bowman,
2015). Other borrowing risks include financial distress (Denison, 2009) and the
likelihood of dissolution (Lu et al., 2020).
Bowman (2015) encouraged nonprofit management to consider that they are not
risking their assets when borrowing but are risking the public’s assets and that they
should assess and reduce that risk. Lam et al. (2020) stated, “To some stakeholders,
nonprofit debt service represents an unacceptable diversion of resources away from
current programs, calling into question the organization’s legitimacy” (p.147). A study
conducted by Calabrese and Grizzle (2012) showed the effect of debt on donations.
Calabrese and Grizzle’s (2012) study considered how donations are affected by
the existence of debt on the nonprofit’s financial statements. The results of their testing
indicated a crowding-out effect; that increased borrowing results in decreased donations.
However, liquidity issues may increase donations. Testing results showed that unsecured
debt has no effect or a positive effect on donations and that secured debt crowds out
future donations. Calabrese and Grizzle (2012) stated, “Donors may view the use of this
debt as problematic for nonprofits because it ties up future cash flows and revenues to
service the debt rather than provide current and future programmatic output” (p.244).
The use of debt generally raises concern about solvency (Yan et al., 2009).
Studies indicate a negative relationship between the maintenance of debt by a nonprofit
organization and the amount of donations received by that organization (Calabrese &

PREDICTING THE FINANCIAL VULNERABILITY OF U.S. PUBLIC CHARITIES 30
Grizzle, 2012; Homonoff et al., 2020). The decrease in donations may have a negative
impact on nonprofit financial health. Yan et al. (2009) also noted, “When the internal
revenue components interact with the external macro-environment, such as trends in the
business cycle, it causes the fluctuation of revenue streams, which is financial risk” (pgs.
55-56). In other words, the risk from debt increases when there is an outside factor, such
as the Great Recession.
Predictive tests of the bankruptcy of for-profit organizations include measures of
debt. Beaver (1966) tested specific ratios’ ability to predict the failure of for-profit firms.
Testing results indicate that the ratio of cash flow to total debt had the strongest ability to
predict the failure of for-profit firms. According to Beaver (1966), “The cash-flow to
total-debt ratio has the ability to correctly classify both failed and nonfailed firms to a
much greater extent than would be through random prediction” (p. 101). The ratio of net
income to total assets had the second strongest ability, and the ratio of total debt to total
assets had the third strongest predictive ability. Other ratios included in the testing were
working capital to total assets, the current ratio, and the no credit interval.
Altman (1968) and Ohlson (1980) also tested certain metrics that predict the
bankruptcy of for-profit firms. Altman’s (1968) testing results included a liquidity ratio,
which is working capital divided by total assets; and a ratio of solvency, which is the
market value of equity divided by the book value of total debt. Both are considered
statistically significant in the bankruptcy prediction model. Ohlson’s (1980) testing
resulted in three factors that are statistically significant in predicting bankruptcy. The
factors are the organization’s size based on assets, total assets, and working capital to
total assets.

PREDICTING THE FINANCIAL VULNERABILITY OF U.S. PUBLIC CHARITIES 31
There are few studies on debt’s effect on a nonprofit organization’s financial
health. However, some studies show that debt has a negative impact on the total amount
of donations received by a charitable organization (Calabrese & Grizzle, 2012). Trussel
(2002) modified the Tuckman and Chang (1991) financial vulnerability model by
including the debt ratio, which is total liabilities over total assets. Results of Trussel’s
testing showed that the debt ratio was statistically significant in predicting financial
vulnerability.
Vermeer et al. (2013) used the debt ratio as a measure of a nonprofit
organization’s financial difficulties. The testing results indicated that nonprofits that are
smaller, maintain minimal surplus, and have lower cash flows from operations are
financially distressed and more likely to dissolve.
Zietlow et al. (2018) argued that liquidity is key to financial sustainability and that
only looking at solvency is a deficient view. They defined liquidity as “being able to meet
present and future draws on cash without impairing the mission or programs of the
organization, incurring significant expenses, or diminishing the financial health of the
organization” (pgs. 30-39). An organization is solvent when its assets exceed its
liabilities, resulting in positive net assets for nonprofit organizations. They also noted that
a fundamental objective of liquidity management is to ensure solvency and to maintain “a
liquidity target adequate to protect the organization and its mission against seasonal and
cyclical cash shortfalls and to build a financial resources base for future programs and
facility expansion” (p. 42).
Smith (2010) studied the effect of debt on an organization’s liquidity and
profitability. The debt ratio variables used in the study are as follows: total liability ratio,

PREDICTING THE FINANCIAL VULNERABILITY OF U.S. PUBLIC CHARITIES 32
operationalized as total liabilities over total assets; financial debt ratio, which is financial
debt over financial capital; outside debt ratio, calculated as all outside debt divided by
financial capital; taxable debt ratio, operationalized as the sum of loans from insiders and
mortgages divided by financial capital; and tax-exempt debt-ratio, which is the total of
tax-exempt bonds over financial capital. The testing results indicated that debt is
negatively related to the organization’s age, liquidity, and profitability. It is noted that a
change from the 25th to the 75th percentile in liquidity results in a 15 to 16 percentage
point drop in the financial debt, outside debt, and taxable debt ratios and a 13 percentage
point drop in the total liabilities ratio. This testing shows that debt has a negative
influence on an organization’s liquidity.
Tirumalsety and Gurtoo (2019) studied the impact of the financial debt ratio on
the financial performance of 207 social enterprises in India. The study’s financial
performance measures were return on fixed assets, return on equity, and return on capital
employed. The study’s results showed that only the return on capital employed has a
statistically significant and negative relationship with the financial debt ratio. The authors
note that a “negative influence of the financial debt ratio on returns on capital employed
indicates repayment of loans, as well as capital to the lenders, may cause a strain on the
efficient utilization of capital to achieve the dual goals of social enterprises” (p. 15).
Lam et al. (2020) tested the impact of return on assets, liquidity, maintenance of
an endowment or quasi-endowment, and the organization’s size (measured by the natural
log of total revenue) on the debt ratio. Return on assets is the only one with statistical
significance, and it has a negative relationship with the debt ratio. In other words, higher
levels of profitability result in lower levels of debt (Denison & Beard, 2003).

PREDICTING THE FINANCIAL VULNERABILITY OF U.S. PUBLIC CHARITIES 33
Chapter 3 – Method
This chapter discusses the method used to answer the research question and test
the hypotheses noted in Chapter 1 using the information discussed in Chapter 2.
Information provided in this section includes the research design, data, measures, and
method used.
Research Rationale and Design
The Tuckman and Chang (1991) model of financial vulnerability was the subject,
directly and indirectly, of multiple empirical tests the results of which indicate that the
model is statistically significant in predicting a nonprofit organization’s financial
vulnerability. However, those studies neither applied a standard definition of financial
vulnerability, nor considered an actual financial shock. Nonprofit charitable organizations
may experience financial pressure during the time of an economic shock. As such, the
nonprofit sector may benefit from further understanding of these financial metrics.
This research study is quantitative in nature and utilized a binary logistic
regression model. A logistic regression model is distinguished from a linear regression
model by the outcome or dependent variables that are dichotomous rather than
continuous (Hosmer et al., 2013). This study utilized a binary logistic regression model
similar to the model used by Trussel and Greenlee (2004). Their model has the form
𝑝(𝑖, 𝑡) =1
1 + 𝑒−𝛽𝑥(𝑖,𝑡)
where p(i,t) is the probability that charity i will be financially distressed in period t, x(i,t)
is a vector of the charity’s attributes to be measured, and β is a vector of unknown
parameters to be estimated.
PREDICTING THE FINANCIAL VULNERABILITY OF U.S. PUBLIC CHARITIES 34
Research Question and Hypotheses
The aim of this study was to determine if the Tuckman-Chang model of financial
vulnerability can predict an organization’s survival using an actual financial shock.
Though prior studies indicate that the Tuckman-Chang model is statistically significant
and can accurately predict a nonprofit organization’s financial vulnerability, none of
those studies took into consideration an actual financial shock, which is an underlying
aspect of financial vulnerability. The most recent and impactful financial shock is the
Great Recession. With this in mind, the research question and associated null and
alternative hypotheses for this study were:
RQ: Does the Tuckman and Chang model of financial vulnerability accurately
predict a charitable organization’s survival of a financial shock?
HO1: A charitable organization’s financial vulnerability has no effect on the
organization’s ability to survive a financial shock.
HA1: More financially vulnerable charitable organizations are less likely to
survive a financial shock than charitable organizations that are not financially
vulnerable.
Denison and Beard (2003) noted that “support for a broader definition [of
financial vulnerability] necessitates the use of the Tuckman-Chang measures plus the
Trussel debt ratio” (p. 29). As noted in Chapter 2, Trussel (2002) extended the work of
Tuckman and Chang (1991) by removing the equity ratio and administrative cost ratio
and adding the debt ratio. The model was considered statistically significant. This study
intended to determine if the debt ratio’s inclusion improves the predictive ability of the

PREDICTING THE FINANCIAL VULNERABILITY OF U.S. PUBLIC CHARITIES 35
Tuckman-Chang model. Additional null and alternative hypotheses for this study were as
follows:
HO2: Debt does not affect a charitable organization’s financial vulnerability or its
ability to survive a financial shock.
HA2: Charitable organizations that are more financially vulnerable due to debt are
less likely to survive a financial shock than charitable organizations that are not
financially vulnerable.
Data
This study utilized the 2006 IRS Statistics of Income Exempt Organizations
Sample File (SOI), hosted by the National Center for Charitable Statistics (NCCS) Data
Archive. The SOI files were weighted sample files of organizations filing a Form 990 or
990-EZ and included information reported by those organizations on Form 990 or 990-
EZ (National Center for Charitable Statistics, n.d.). The data file used for this study was
the 2006 SOI 990 C3 file containing Form 990 information for a weighted sample of
organizations that are tax-exempt under IRC section 501(c)3 and that filed a Form 990
during 2006.
The 2006 SOI file contained information for 15,941 organizations that are tax-
exempt under IRC Section 501(c)3. Data-cleaning procedures were performed to ensure
more accurate testing. Table 2 provides a list of the data cleaning attributes used, the
number of organizations removed because of the data-cleaning attribute, and the number
of remaining organizations used in this testing.

PREDICTING THE FINANCIAL VULNERABILITY OF U.S. PUBLIC CHARITIES 36
Table 2: Summary of Population and Data Cleaning
Summary of Population and Data Cleaning
Beginning population size 15,941
Less observations with exact duplicate of EIN 0
Less observations with missing sector 0
Less observations that are not public charities 28
Less observations with negative value for contributions, dues,
government grants, and program revenue
8
Less observations with a negative or zero value for total revenue 29
Less observations with a negative or zero value for total expenses 47
Less observations with negative values for beginning total assets,
ending total assets, beginning total liabilities, or ending total
liabilities
35
Final population size 15,794
Measures
The following section discusses the dependent and independent variables used in
this study.
Nonprofit Organization Survival (Dependent Variable)
The dependent or outcome variable for this study was whether or not the
charitable organization survived the Great Recession. The 2006 SOI file represents the
charitable organizations that filed a Form 990 for the year before the Great Recession
began. The EINs listed in the 2006 SOI file are compared to the EINs listed in the 2011
SOI file. Any 2006 EINs not found in the 2011 EINs are considered to belong to
organizations that did not survive the Great Recession, though an organization may not
appear on the list for other reasons, such as loss of public charity status, failure to file, or

PREDICTING THE FINANCIAL VULNERABILITY OF U.S. PUBLIC CHARITIES 37
falling below the filing thresholds (Dietz et al., 2014). This process results in a
dichotomous dependent variable. Following convention, dummy variables of 0 and 1
were assigned to organizations that are considered not to have survived the Great
Recession and those that did survive the Great Recession, respectively.
Determination of the Independent Variable to Test Hypothesis 1
Tuckman and Chang’s (1991) study classified nonprofit organizations as at-risk if
they were in the bottom quintile for any one of the four financial metrics, which are
defined below. An organization was classified as severely-at-risk if it was in the bottom
quintile for all four metrics. For this study, the four financial metrics were calculated for
each organization listed in the 2006 SOI file. The organizations were then sorted by the
metrics and labeled not-at-risk if the organization is not in the bottom quintile for any
metric, at-risk if it is in the bottom quintile for any one metric, and severely-at-risk if it is
in the bottom quintile for all four metrics. The organizations were assigned the dummy
variables 0, 1, and 2, respectively.
The following defines the four financial metrics and how they are operationalized
for this study.
Net Assets (NA). Tuckman and Chang (1991) referred to this metric as an equity
ratio. However, the technical term for a nonprofit’s equity is net assets, which is the
difference between its assets and liabilities. Tuckman and Chang (1991) operationalized
this ratio as total equity over total revenue. For this study, the net asset ratio is calculated
as total net assets over total revenue. This metric is expected to have an inverse
relationship with financial vulnerability.

PREDICTING THE FINANCIAL VULNERABILITY OF U.S. PUBLIC CHARITIES 38
Revenue Concentration (RC). Tuckman and Chang (1991) used a Herfindahl
Index to measure revenue concentration. A similar index is used for this study and is
formulated as
∑(𝑅𝑒𝑣𝑒𝑛𝑢𝑒 𝑆𝑜𝑢𝑟𝑐𝑒
𝑇𝑜𝑡𝑎𝑙 𝑅𝑒𝑣𝑒𝑛𝑢𝑒)2
This study utilized six categories of revenue sources: contributions, program
revenue, portfolio income, dues, government grants, and other revenue. In its current
form, this metric has a positive relationship with financial vulnerability. This study
followed Thomas and Trafford (2013) by revising the metric as
1 − ∑(𝑅𝑒𝑣𝑒𝑛𝑢𝑒 𝑆𝑜𝑢𝑟𝑐𝑒
𝑇𝑜𝑡𝑎𝑙 𝑅𝑒𝑣𝑒𝑛𝑢𝑒)2
to make it comparative to the other metrics. The metric was expected to have an inverse
relationship with financial vulnerability.
Administrative Costs (AC). Tuckman and Chang (1991) used administrative
expenses to total expenses ratio as a metric for financial vulnerability. This study used the
same ratio. It was expected to have an inverse relationship with financial vulnerability.
Operating Margin (OM). The operating margin is a measure of the
organization’s surplus (Tuckman & Chang, 1991), and operationalized as
𝑅𝑒𝑣𝑒𝑛𝑢𝑒 − 𝐸𝑥𝑝𝑒𝑛𝑠𝑒𝑠
𝐸𝑥𝑝𝑒𝑛𝑠𝑒𝑠
It is expected to have an inverse relationship with financial vulnerability.
Determination of the Independent Variable to Test Hypothesis 2
A debt ratio is not used in the Tuckman-Chang model. This study extends the
Tuckman-Chang model by including a debt ratio as a fifth financial metric. Trussel
(2002) and others used the standard debt ratio, operationalized as total liabilities over

PREDICTING THE FINANCIAL VULNERABILITY OF U.S. PUBLIC CHARITIES 39
total assets, when testing the financial health of a nonprofit organization. This study used
the same ratio, and it was expected to have an inverse relationship with financial
vulnerability.
The data used to determine the independent variable to test the first hypothesis
was expanded to include the debt ratio as a fifth financial metric. The debt ratio was
calculated for each organization listed. The organizations were then sorted to determine
which were in the bottom quintile. The organizations not in the bottom quintile for any of
the financial metrics were labeled not-at-risk, in the bottom quintile for any one of the
five financial metrics was labeled at-risk, and in the bottom quintile for all five financial
metrics was labeled severely-at-risk. These organizations were given the dummy
variables 0, 1, and 2, respectively. Table 3 provides a summary of the financial metrics
used in this study.
Table 3: Financial Metrics with Corresponding Measures and Expected Signs
Financial Metrics with Corresponding Measures
Financial Metric Measure
Net Assets (NA) 𝑁𝑒𝑡 𝑎𝑠𝑠𝑒𝑡𝑠
𝑇𝑜𝑡𝑎𝑙 𝑟𝑒𝑣𝑒𝑛𝑢𝑒
Revenue Concentration
(RC) 1 − ∑(
𝑅𝑒𝑣𝑒𝑛𝑢𝑒 𝑆𝑜𝑢𝑟𝑐𝑒
𝑇𝑜𝑡𝑎𝑙 𝑅𝑒𝑣𝑒𝑛𝑢𝑒)2
Administrative Costs (AC) 𝐴𝑑𝑚𝑖𝑛𝑖𝑠𝑡𝑟𝑎𝑡𝑖𝑣𝑒 𝑒𝑥𝑝𝑒𝑛𝑠𝑒
𝑇𝑜𝑡𝑎𝑙 𝑒𝑥𝑝𝑒𝑛𝑠𝑒𝑠
Operating Margin (OM) (𝑇𝑜𝑡𝑎𝑙 𝑟𝑒𝑣𝑒𝑛𝑢𝑒 − 𝑡𝑜𝑡𝑎𝑙 𝑒𝑥𝑝𝑒𝑛𝑠𝑒𝑠)
𝑇𝑜𝑡𝑎𝑙 𝑒𝑥𝑝𝑒𝑛𝑠𝑒𝑠
Debt Ratio (DR) 𝑇𝑜𝑡𝑎𝑙 𝑙𝑖𝑎𝑏𝑖𝑙𝑖𝑒𝑠
𝑇𝑜𝑡𝑎𝑙 𝑒𝑥𝑝𝑒𝑛𝑠𝑒𝑠

PREDICTING THE FINANCIAL VULNERABILITY OF U.S. PUBLIC CHARITIES 40
Data Analysis
The purpose of this study was to test the predictability of the Tuckman and Chang
(1991) model of financial vulnerability using an actual financial shock, the Great
Recession. Binary logistic regression analysis was used to test both null hypotheses of
this study. After cleaning the data set, all measures were prepared for data entry.
The first hypothesis was tested by applying the four financial metrics of the
Tuckman-Chang model to the data listed in the 2006 SOI File to determine which
organizations are not-at-risk, at-risk, and severely-at-risk. The EINs of these
organizations were compared to the EINs listed in the 2011 SOI File. Organizations with
an EIN listed were considered to have survived the Great Recession and received the
variable of 1. Organizations with an EIN not located in the 2011 SOI File were
considered not to have survived the Great Recession and received the variable of 0. These
represent the variables used to test the first hypothesis. These variables were loaded into
the statistical software package for testing. Descriptive statistics and results of the testing
are discussed in Chapter 4.
A debt ratio was added to the Tuckman-Chang model’s four financial metrics to
test this study’s second hypothesis. A new list was prepared of organizations labeled not-
at-risk, at-risk, or severely-at-risk if they are not in the bottom quintile for any metric, in
the bottom quintile for any one metric, or in the bottom quintile for all metrics,
respectively. The EINs of the organizations in this list were compared to the EINs listed
in the 2011 SOI File. If the EIN was located, then the organization was considered to
have survived the Great Recession and was assigned the variable of 1. If the EIN was not
located, then the organization was considered to have not survived the Great Recession
PREDICTING THE FINANCIAL VULNERABILITY OF U.S. PUBLIC CHARITIES 41
and was assigned the variable of 0. These represent the variables used to test the second
hypothesis. These variables were loaded into the statistical software package for testing.
Descriptive statistics and results of the testing are discussed in Chapter 4.

PREDICTING THE FINANCIAL VULNERABILITY OF U.S. PUBLIC CHARITIES 42
Chapter 4 – Results
This study’s objective was to test the predictive ability of the Tuckman and Chang
(1991) model of financial vulnerability using the Great Recession as a financial shock to
the charitable sector. This study also considered the impact of debt on a charitable
organization’s financial vulnerability by adding the debt ratio to the Tuckman-Chang
model of financial vulnerability. The following research question and hypotheses were
presented and tested:
RQ: Does the Tuckman and Chang model of financial vulnerability accurately
predict a charitable organization’s survival of a financial shock?
HO1: A charitable organization’s financial vulnerability has no effect on the
organization’s ability to survive a financial shock.
HA1: More financially vulnerable charitable organizations are less likely to
survive a financial shock than charitable organizations that are not financially
vulnerable.
HO2: Debt does not affect a charitable organization’s financial vulnerability or its
ability to survive a financial shock.
HA2: Charitable organizations that are more financially vulnerable due to debt are
less likely to survive a financial shock than charitable organizations that are
financially vulnerable.
This chapter discusses the results of testing and presents the descriptive statistics
of the data and additional findings.
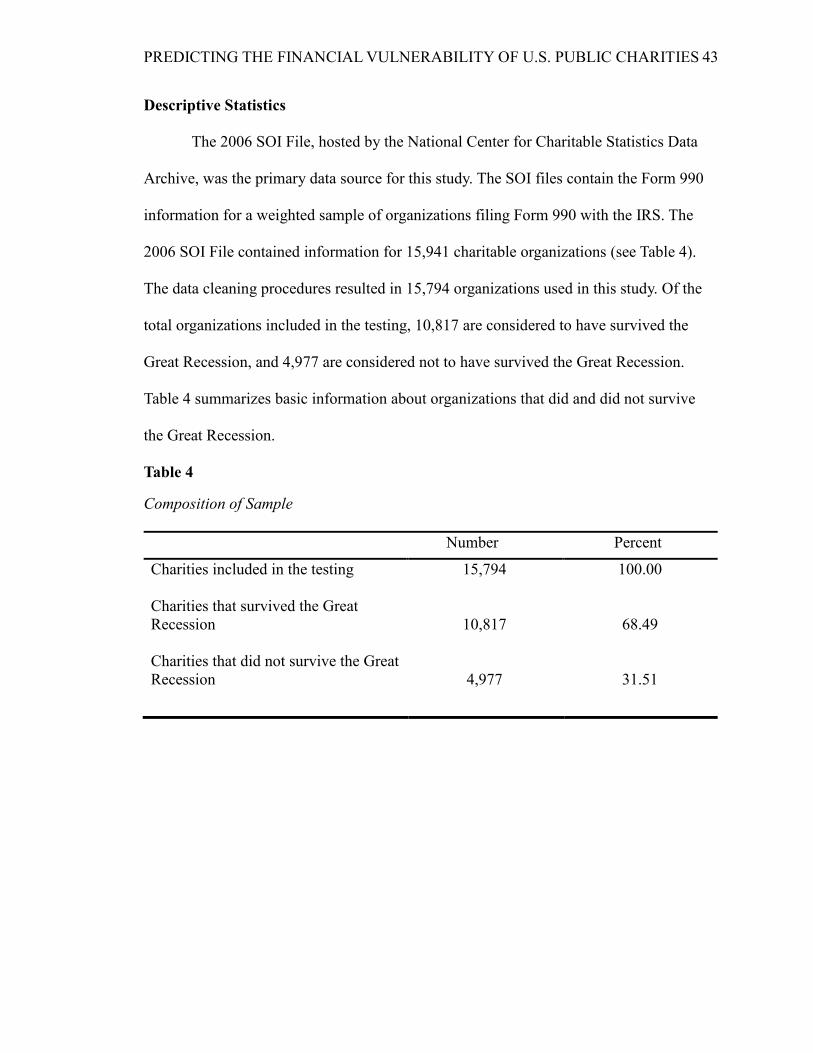
PREDICTING THE FINANCIAL VULNERABILITY OF U.S. PUBLIC CHARITIES 43
Descriptive Statistics
The 2006 SOI File, hosted by the National Center for Charitable Statistics Data
Archive, was the primary data source for this study. The SOI files contain the Form 990
information for a weighted sample of organizations filing Form 990 with the IRS. The
2006 SOI File contained information for 15,941 charitable organizations (see Table 4).
The data cleaning procedures resulted in 15,794 organizations used in this study. Of the
total organizations included in the testing, 10,817 are considered to have survived the
Great Recession, and 4,977 are considered not to have survived the Great Recession.
Table 4 summarizes basic information about organizations that did and did not survive
the Great Recession.
Table 4: Composition of Sample
Composition of Sample
Number Percent
Charities included in the testing
15,794 100.00
Charities that survived the Great
Recession
10,817
68.49
Charities that did not survive the Great
Recession
4,977
31.51

PREDICTING THE FINANCIAL VULNERABILITY OF U.S. PUBLIC CHARITIES 44
Table 5 presents a more detailed view of the number of organizations by subsector
that survived or did not survive the Great Recession.
Table 5: NTEE Subsectors, Survival Rates in the Great Recession
NTEE Subsectors, Survival Rates in the Great Recession
Subsector Survived Did Not Survive
Number Percent Number Percent
Arts, culture, and humanities 696 63.85 394 36.15
Education 2470 76.92 741 23.08
Environment 286 62.31 173 37.69
Health 3249 75.05 1080 24.95
Human Services 2638 60.69 1709 39.31
International 169 71.01 69 28.99
Mutual benefit 62 72.09 24 27.91
Public and social benefit 1041 63.24 605 36.76
Religion 205 52.97 182 47.03
Unknown 1 100.00 0 0.00
The first hypothesis was tested by classifying charitable organizations as not-at-
risk, at-risk, and severely-at-risk based on their performance in the four financial metrics
in the Tuckman and Chang (1991) model of charitable organization financial
vulnerability. There were 6,883 organizations classified as not-as-risk, 8,868
organizations classified as at-risk, and 43 organizations classified as severely-at-risk. The
second hypothesis was tested by adding a fifth financial metric to the Tuckman-Chang
model. Organizations were reclassified based on their performance in the five financial
metrics, resulting in 6,298 organizations labeled as not-at-risk, 9,463 organizations

PREDICTING THE FINANCIAL VULNERABILITY OF U.S. PUBLIC CHARITIES 45
labeled at-risk, and 33 organizations labeled severely-at-risk. Table 6 summarizes this
information.
Table 6: Classifications of Risk
Classifications of Risk among charitable organizations, Hypothesis One and Two
Number Percent of Total
Hypothesis 1 Classifications
Not-at-risk 6,883 43.58
At-risk 8,868 56.15
Severely-at-risk 43 0.27
Hypothesis 2 Classifications
Not-at-risk 6,298 39.88
At-risk 9,463 59.92
Severely-at-risk 33 0.20
The inclusion of the debt ratio for hypothesis two testing had a noticeable effect
on the organizations’ financial vulnerability classification. The number of organizations
classified as at-risk increased for hypothesis two testing due to the debt ratio’s inclusion.
There were 585 organizations classified as not-at-risk for hypothesis one but classified as
at-risk for hypothesis two because they were in the bottom quintile of the debt ratio only.
The number of organizations classified as severely-at-risk decreased for hypothesis two
testing because ten organizations were not in the bottom quintile for the debt ratio,
though they were in the bottom quintile for the other four ratios.

PREDICTING THE FINANCIAL VULNERABILITY OF U.S. PUBLIC CHARITIES 46
Regression Results
Using SPSS, binary logistic regression analysis was used to test the predictive
ability of the Tuckman-Chang model of financial vulnerability. This section discusses the
results of the testing.
Results for Hypothesis One
The first hypothesis of this study examined the Tuckman-Chang model’s
predictability using the Great Recession as an actual financial shock. Table 7 provides the
predicted values of organization survival based on the full model. The full model
correctly predicted 68.5 percent of organization survival or nonsurvival.
Table 7: Classification of Tablea, b Hypothesis One
Classification of Tablea, b Hypothesis One
Predicted Survival of the Great Recession
Observed Did not survive Survived Percent Correct
Did not survive 0 4,977 .0
Survived 0 10,817 100.0
Overall Percentage 68.5
a. constant is included in the model
b. The cut value is .500
The predictor variable was the organization’s classification of not-at-risk, at-risk,
or severely-at-risk. A test of the full model versus a model with intercept only was
statistically significant, 𝑥2(2) = 353.467, < .001, as shown in Table 8. Based on this
information, the Tuckman-Chang model is a significant improvement in fit over the null
model.

PREDICTING THE FINANCIAL VULNERABILITY OF U.S. PUBLIC CHARITIES 47
Table 8: Omnibus Test of Model Coefficients, Hypothesis One
Omnibus Test of Model Coefficients, Hypothesis One
Chi-square df Sig.
Step 1 Step 353.467 2 .000
Block 353.467 2 .000
Model 353.467 2 .000
Statistical Test of Predictors. The Wald chi-square statistic tests the statistical
significance of the individual regression coefficients. In Table 9, the at-risk organizations
and the severely-at-risk organizations are represented by the dummy variables 1 and 2,
respectively. The first dummy variable is a comparison of those at-risk (coded 1) and not-
at-risk (the reference category coded 0). The negative coefficient suggests that the at-risk
category organizations were less likely to survive than those in the not-at-risk category.
Being at-risk is a negative and significant (b = .658, s.e. = .036, p < .000) predictor of the
probability of a charitable organization not surviving a financial shock. The odds ratio
(OR) indicates that becoming financially at-risk increases an organization’s odds of not
surviving a financial shock by a factor of .518. In other words, an organization that meets
the definition of being financially at-risk is two times more likely not to survive a
financial shock
Similarly, the second dummy variable compares the severely-at-risk group (coded
2) to the not-at-risk group (coded 0). The negative coefficient suggests that the severely-
at-risk category organizations were less likely to survive the Great Recession than those
in the not-at-risk category. Being severely-at-risk is a negative and significant (b = -
1.123, s.e. = .30b, p < .001) predictor of the probability of a charitable organization not
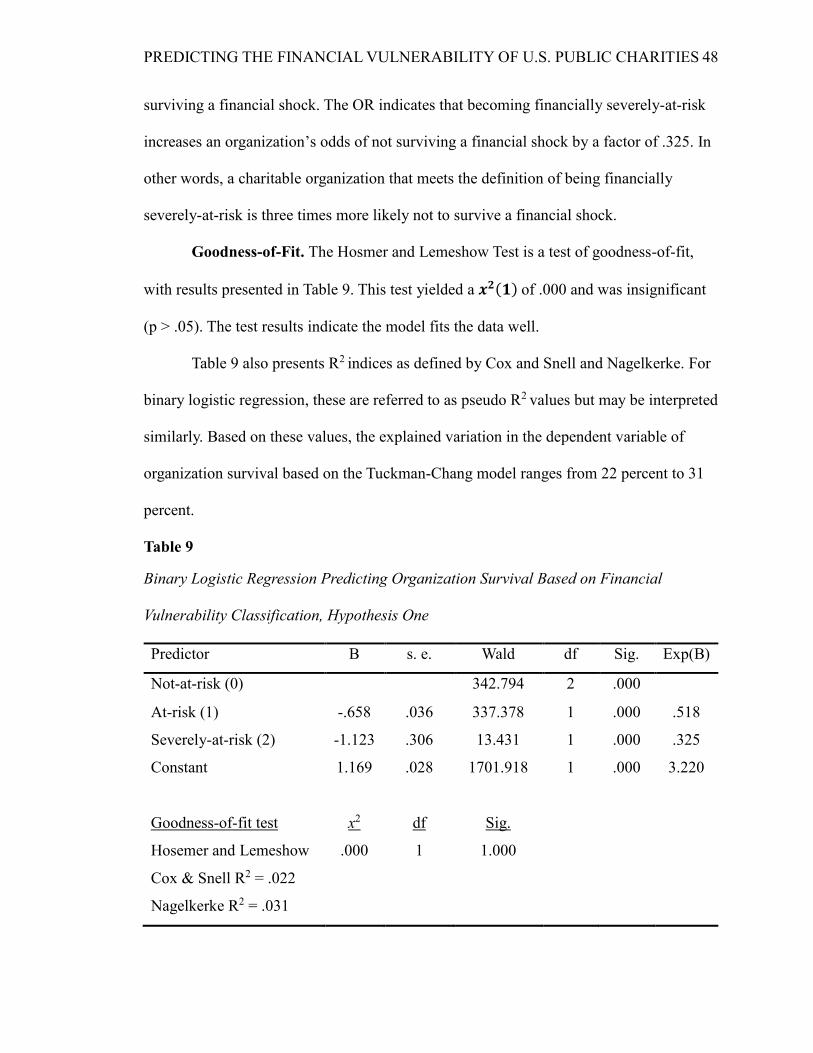
PREDICTING THE FINANCIAL VULNERABILITY OF U.S. PUBLIC CHARITIES 48
surviving a financial shock. The OR indicates that becoming financially severely-at-risk
increases an organization’s odds of not surviving a financial shock by a factor of .325. In
other words, a charitable organization that meets the definition of being financially
severely-at-risk is three times more likely not to survive a financial shock.
Goodness-of-Fit. The Hosmer and Lemeshow Test is a test of goodness-of-fit,
with results presented in Table 9. This test yielded a 𝒙𝟐(𝟏) of .000 and was insignificant
(p > .05). The test results indicate the model fits the data well.
Table 9 also presents R2 indices as defined by Cox and Snell and Nagelkerke. For
binary logistic regression, these are referred to as pseudo R2 values but may be interpreted
similarly. Based on these values, the explained variation in the dependent variable of
organization survival based on the Tuckman-Chang model ranges from 22 percent to 31
percent.
Table 9: Binary Logistic Regression and Financial Vulnerability, Hypothesis One
Binary Logistic Regression Predicting Organization Survival Based on Financial
Vulnerability Classification, Hypothesis One
Predictor B s. e. Wald df Sig. Exp(B)
Not-at-risk (0) 342.794 2 .000
At-risk (1) -.658 .036 337.378 1 .000 .518
Severely-at-risk (2) -1.123 .306 13.431 1 .000 .325
Constant 1.169 .028 1701.918 1 .000 3.220
Goodness-of-fit test x2 df Sig.
Hosemer and Lemeshow .000 1 1.000
Cox & Snell R2 = .022
Nagelkerke R2 = .031

PREDICTING THE FINANCIAL VULNERABILITY OF U.S. PUBLIC CHARITIES 49
Results for Hypothesis Two
The second hypothesis of this study the extended Tuckman-Chang model’s
predictability by adding the debt ratio and using the Great Recession as an actual
financial shock. Table 10 provides the output for a model that includes only the intercept.
Given the base rates for the two outcomes and no other information, organizations that
did not survive the Great Recession would be correctly classified 68.5 percent of the
time. The results are the same as those for hypothesis one.
Table 10: Classification of Tablea, b Hypothesis Two
Classification of Tablea, b Hypothesis Two
Predicted Survival of the Great Recession
Observed Did not survive Survived Percent Correct
Did not survive 0 4,977 .0
Survived 0 10,817 100.0
Overall Percentage 68.5
a. constant is included in the model
b. The cut value is .500
The predictor variable was the organization’s classification as not-at-risk, at-risk,
or severely-at-risk based on the results of five financial metrics. A test of the full model
versus a model with intercept only was statistically significant, 𝑥2(2) = 299.106, p
< .001, as shown in Table 11. Based on this information, the Tuckman-Chang model
extended by adding the debt ratio is a significant improvement in fit over the null model.

PREDICTING THE FINANCIAL VULNERABILITY OF U.S. PUBLIC CHARITIES 50
Table 11::Omnibus Test of Model Coefficients, Hypothesis Two
Omnibus Test of Model Coefficients, Hypothesis Two
Chi-square df Sig.
Step 1 Step 299.106 2 .000
Block 299.106 2 .000
Model 299.106 2 .000
Statistical Test of Predictors. The statistical significance of the individual
regression coefficients was tested using the Wald chi-square statistic. In Table 12, the at-
risk and the severely-at-risk organizations are represented by the dummy variables 1 and
2, respectively. The first dummy variable is a comparison of those at-risk (coded 1) and
not-at-risk (the reference category coded 0). The negative coefficient suggests that the at-
risk category organizations were less likely to survive than those in the not-at-risk
category. Being at-risk is a negative and significant (b = -.616, s.e. = .036, p < .001)
predictor of the probability of charitable organization not surviving a financial shock. The
OR indicates that being financially at-risk increases an organization’s odds of not
surviving a financial shock by a factor of .540. In other words, an organization that meets
the definition of being financially at-risk is almost two times more likely not to survive a
financial shock than an organization that is financially not-at-risk.
Similarly, the second dummy variable compared the severely-at-risk group (coded
2) to the not-at-risk group (coded 0). The negative coefficient suggests that the severely-
at-risk category organizations were less likely to survive the Great Recession than those
in the not-at-risk category. Being severely-at-risk is a negative and significant (b = -
1.105, s.e. = .350, p = .002) predictor of the probability of a charitable organization not

PREDICTING THE FINANCIAL VULNERABILITY OF U.S. PUBLIC CHARITIES 51
surviving a financial shock. The OR indicates that becoming financially severely-at-risk
increases an organization’s odds of not surviving a financial shock by a factor of .331. In
other words, a charitable organization that meets the definition of being financially
severely-at-risk is three times more likely not to survive a financial shock than an
organization that is financially not-at-risk.
Goodness-of-Fit. The results of the Hosmer and Lesmeshow Test of goodness-of-
fit are shown in Table 12. This test yielded a 𝒙𝟐(1) of .000 and was insignificant (p
> .005). The test results indicated that the model for hypothesis two fits the data well.
Table 12 also presents R2 indices as defined by Cox and Snell and Nagelkerke.
For binary logistic regression, these are referred to as pseudo R2 values but may be
interpreted similarly. Based on these values, the explained variation in the dependent
variable of organization survival based on the Tuckman-Chang extended model ranges
from 19 percent to 26 percent.
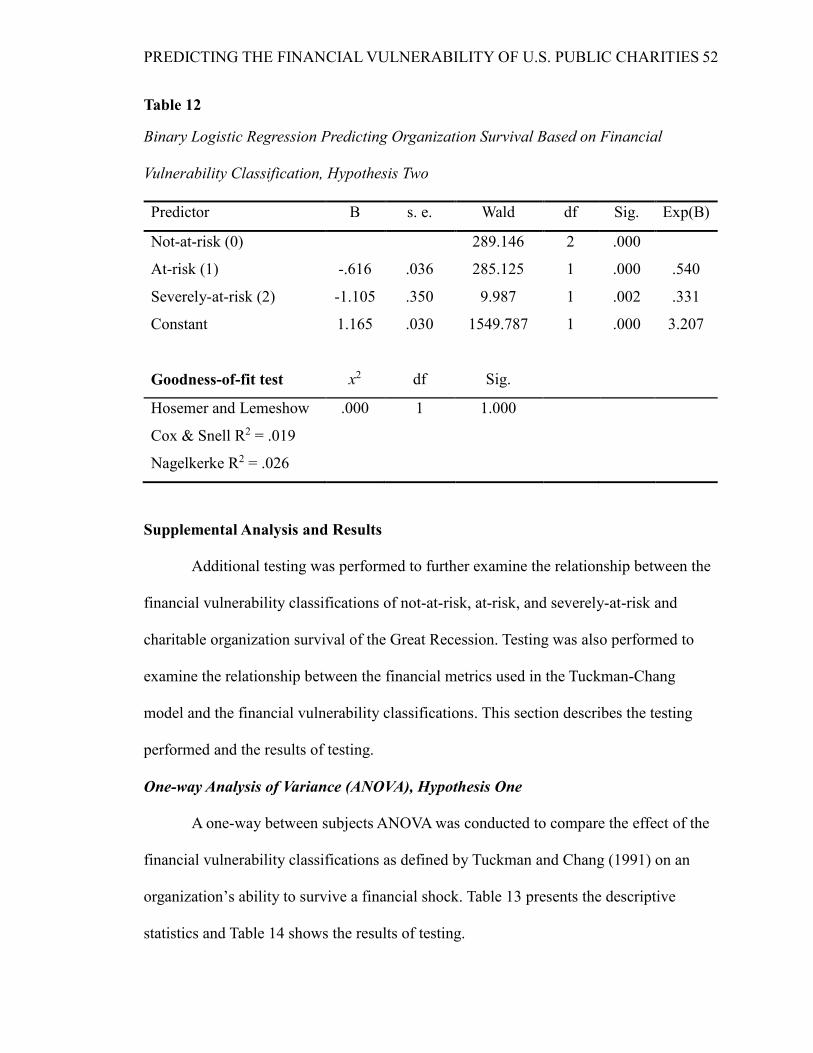
PREDICTING THE FINANCIAL VULNERABILITY OF U.S. PUBLIC CHARITIES 52
Table 12: Binary Logistic Regression and Financial Vulnerability, Hypothesis Two
Binary Logistic Regression Predicting Organization Survival Based on Financial
Vulnerability Classification, Hypothesis Two
Predictor B s. e. Wald df Sig. Exp(B)
Not-at-risk (0) 289.146 2 .000
At-risk (1) -.616 .036 285.125 1 .000 .540
Severely-at-risk (2) -1.105 .350 9.987 1 .002 .331
Constant 1.165 .030 1549.787 1 .000 3.207
Goodness-of-fit test x2 df Sig.
Hosemer and Lemeshow .000 1 1.000
Cox & Snell R2 = .019
Nagelkerke R2 = .026
Supplemental Analysis and Results
Additional testing was performed to further examine the relationship between the
financial vulnerability classifications of not-at-risk, at-risk, and severely-at-risk and
charitable organization survival of the Great Recession. Testing was also performed to
examine the relationship between the financial metrics used in the Tuckman-Chang
model and the financial vulnerability classifications. This section describes the testing
performed and the results of testing.
One-way Analysis of Variance (ANOVA), Hypothesis One
A one-way between subjects ANOVA was conducted to compare the effect of the
financial vulnerability classifications as defined by Tuckman and Chang (1991) on an
organization’s ability to survive a financial shock. Table 13 presents the descriptive
statistics and Table 14 shows the results of testing.

PREDICTING THE FINANCIAL VULNERABILITY OF U.S. PUBLIC CHARITIES 53
Table 13: ANOVA, Hypothesis One Descriptive Statistics
ANOVA, Hypothesis One Descriptive Statistics
Classifications Number M SD
Not-at-risk 6,883 .76 .425
At-risk 8,868 .63 .484
Severely-at-risk 43 .51 .506
* The main difference is significant at the 0.05 level.
As shown in Table 14, the results of the test demonstrate that financial
vulnerability classification has a significant effect on organizational survival at the p
< .05 level for the three classifications (F(2, 15791) = 177.815, p < .001).
Table 14: ANOVA, Hypothesis One Results
ANOVA, Hypothesis One Results
Sum of Squares df Mean
Square
F Sig.
Between Groups 75.076 2 37.538 177.815 .000
Within Groups 3333.574 15791 .211
Total 3408.649 15793
Because a statistically significant result was found in this test, the Tukey HSD
post hoc test was computed (Table 15). This test compares the not-at-risk and at-risk
conditions and the at-risk and severely-at-risk conditions. Post hoc comparisons using the
Tukey HSD test indicated that the mean score for the not-at-risk classification (M = .76,
SD = .425) was significantly different from the at-risk classification (M = .63, SD = .484)
and the severely-at-risk classification (M = .51, SD = .506). However, the severely-at-risk
classification did not significantly differ from the at-risk classification.

PREDICTING THE FINANCIAL VULNERABILITY OF U.S. PUBLIC CHARITIES 54
Table 15: Post Hoc Test – Tukey HSD, Hypothesis One
Post Hoc Test – Tukey HSD, Hypothesis One
Dependent variable:
Did not survive the Great Recession = 0; Survived the Great Recession = 1
(I)Hypothesis 1
(J) Hypothesis 1 Mean
Difference (I-J)
Std.
Error
Sig.
0 1 .138 * .007 .000
2 .251* .070 .001
1 2 .113 .070 .239
Note: (I)-Hypothesis 1: Not-at-Risk = 0; At-Risk = 1; Severely-At-Risk = 2. (J)
Hypothesis 1: Not-at-Risk = 0; At-Risk = 1; Severely-At-Risk = 2
* The main difference is significant at the 0.05 level.
One-way Analysis of Variance (ANOVA), Hypothesis Two
The debt ratio was added to the Tuckman-Chang model of financial vulnerability
resulting in the use of five financial metrics to classify charitable organizations as not-at-
risk, at-risk, and severely-at-risk to test the second hypothesis of this study (see Table 16).
Table 16: ANOVA, Hypothesis Two Descriptive Statistics
ANOVA, Hypothesis Two Descriptive Statistics
Classifications Number M SD
Not-at-risk 6,298 .76 .426
At-risk 9,463 .63 .482
Severely-at-risk 33 .52 .508
A one-way between subjects ANOVA was conducted to compare the effect of
these modified financial vulnerability classifications on an organization’s ability to
survive a financial shock. As shown in Table 17, the results of the test indicate that there

PREDICTING THE FINANCIAL VULNERABILITY OF U.S. PUBLIC CHARITIES 55
was a significant effect of classification on organizational survival at the p < .05 level for
the modified classification (F(2, 15791) = 149.296, p < .000).
Table 17: ANOVA, Hypothesis Two Results
ANOVA, Hypothesis Two Results
Sum of Squares df Mean
Square
F Sig.
Between Groups 63.258 2 31.629 149.296 .000
Within Groups 3345.391 15791 .212
Total 3408.649 15793
As shown in Table 18, post hoc comparisons using the Tukey HSD test indicated
that the mean score for the modified not-at-risk classification (M = .76, SD = .426) was
significantly different from the modified at-risk classification (M = .63, SD = .484) and
the modified severely-at-risk classification (M = .52, SD = .508). However, the modified
severely-at-risk classification did not significantly differ from the modified at-risk
classification.
Table 18: Post Hoc Test – Tukey HSD, Hypothesis Two
Post Hoc Test – Tukey HSD, Hypothesis Two
Dependent variable:
Did not survive the Great Recession = 0; Survived the Great Recession = 1
(I)-Hypothesis 1
(J) Hypothesis 1
Mean
Difference
(I-J)
Std.
Error
Sig.
0 1 .128 * .007 .000
2 .247 * .080 .006
1 2 .119 .080 .301
Note: (I)-Hypothesis 1: Not-at-Risk = 0; At-Risk = 1; Severely-At-Risk = 2. (J)
Hypothesis 1: Not-at-Risk = 0; At-Risk = 1; Severely-At-Risk = 2
* The main difference is significant at the 0.05 level.

PREDICTING THE FINANCIAL VULNERABILITY OF U.S. PUBLIC CHARITIES 56
Multinomial Logistic Regression
A multinomial logistic regression was performed to model the relationship
between the hypothesis one financial metrics used to classify the charitable organizations
as not-at-risk, at-risk, and severely-at-risk and membership in those three groups. A
separate multinomial logistic regression was also performed to model the relationship
between the hypothesis two financial metrics used to classify the charitable organizations
and membership in those groups. The model for hypothesis one is a significant
improvement over the null model, x2 (8, N = 15794) = 1798.009, Nagelkerke R2 = .143, p
< .001. The model for hypothesis two was also a significant improvement over the null
model, x2 (10, N = 15794) = 3194.219, Nagelkerke R2 = .245, p < .001. As shown in
Table 19, significant unique contributions were made by all financial metrics.

PREDICTING THE FINANCIAL VULNERABILITY OF U.S. PUBLIC CHARITIES 57
Table 19: Likelihood Ratio Tests
Likelihood Ratio Tests
Model for Hypothesis 1
Model Fitting Criteria Likelihood Ratio Tests
Effect
-2 Log of Likelihood of
Reduced Model
Chi-Square
df
Sig.
Intercept 21060.016 679.511 2 .000
Net Assets Ratio 20414.837 34.332 2 .000
Revenue Concentration 21943.293 1562.788 2 .000
Administrative Cost Ratio 20446.014 65.509 2 .000
Operating Margin Ratio 20454.671 74.166 2 .000
Model for Hypothesis 2
Model Fitting Criteria Likelihood Ratio Tests
Effect
-2 Log of Likelihood of
Reduced Model
Chi-Square
df
Sig.
Intercept 20337.767 1849.304 2 .000
Net Assets Ratio 18737.704 249.241 2 .000
Revenue Concentration 19712.077 1223.614 2 .000
Administrative Cost Ratio 18531.165 42.703 2 .000
Operating Margin Ratio 18558.901 70.439 2 .000
Debt Ratio 20031.496 1543.033 2 .000
For both models, the reference group was those organizations classified as
financially not-at-risk. Accordingly, each predictor has two parameters, one for predicting
membership in the financially at-risk group rather than the not-at-risk group and one for
predicting membership in the financially severely-at-risk group. The parameter estimates
are shown in Table 20.

PREDICTING THE FINANCIAL VULNERABILITY OF U.S. PUBLIC CHARITIES 58
Table 20: Parameter Estimates Not-At-Risk Group versus Each of the Other Groups:
Parameter Estimates Contrasting the Not-At-Risk Group versus Each of the Other
Groups
Model for Hypothesis 1
Predictor NAR vs OR Sig.
Net Assets Ratio AR
SAR
.011
-.009
1.011
.991
.000
.064
Revenue Concentration AR
SAR
-2.448
-2.432
.086
.088
.000
.000
Administrative Cost Ratio AR
SAR
-.004
-4.148
.996
.016
.234
.000
Operating Margi Ratio AR
SAR
.002
-3.021
1.002
.049
.067
.000
Model for Hypothesis 2
Predictor NAR vs OR Sig.
Net Assets Ratio AR
SAR
.052
.019
1.054
1.019
.000
.084
Revenue Concentration AR
SAR
-2.117
-2.103
.120
.122
.000
.000
Administrative Cost Ratio AR
SAR
-.006
-3.880
.994
.021
.118
.000
Operating Margin Ratio AR
SAR
.005
-3.411
1.005
.033
.017
.000
Debt Ratio AR
SAR
-2.331
-2.331
.097
.097
.000
.000

PREDICTING THE FINANCIAL VULNERABILITY OF U.S. PUBLIC CHARITIES 59
Two financial metrics in the hypothesis one model had a significant parameter for
comparing the not-at-risk group with the at-risk group. For each one standard deviation
decrease in the Net Assets Ratio, the odds of being in the not-at-risk group rather than the
at-risk group are multiplicatively decreased by 0.99. For each one standard deviation
increase in Revenue Concentration, the odds of being in the not-at-risk group rather than
the at-risk group are multiplicatively increased by 11.63.
Three of the predictors in the hypothesis one model had significant parameters for
comparing the not-at-risk group to the severely-at-risk group. For each one standard
deviation increase in Revenue Concentration, the Administrative Cost Ratio, and the
Operating Margin Ratio, the odds of being in the not-at-risk group rather than the
severely-at-risk group are multiplicatively increased by 11.36, 62.50, and 20.41,
respectively.
Four financial metrics in the hypothesis two model had a significant parameter for
comparing the not-at-risk group with the at-risk group. For each one standard deviation
decrease in the Net Assets Ratio and the Operating Margin Ratio, the odds of being in the
not-at-risk group rather than the at-risk group are multiplicatively decreased by .95 and
0.99, respectively. For each one standard deviation increase in Revenue Concentration
and the Debt Ratio, the odds of being in the not-at-risk group rather than the at-risk group
are multiplicatively increased by 8.33 and 10.31, respectively.
Four of the predictors in the hypothesis two model had significant parameters for
comparing the not-at-risk group to the severely-at-risk group. For each one standard
deviation increase in Revenue Concentration, the Administrative Cost Ratio, the
Operating Margin Ratio, and the Debt Ratio, the odds of being in the not-at-risk group

PREDICTING THE FINANCIAL VULNERABILITY OF U.S. PUBLIC CHARITIES 60
rather than the severely-at-risk group are multiplicatively increased by 8.20, 47.62, 30.30,
and 10.31, respectively.
Using the logistic model for hypothesis one to make such predictions results in
59.4 percent correct prediction. Table 21 shows that correct predictions were more
frequent for the financially at-risk-group (69.7 percent) and the financially not-at-risk
group (46.5 percent) than the financially severely-at-risk group (4.7 percent). Table 21
also shows that using the logistic model for hypothesis two to make such predictions
results in 66.8 percent correct prediction. Correct predictions were more frequent for the
financially at-risk-group (75.4 percent) and the financially not-at-risk group (54.3
percent) than the financially severely-at-risk group (6.1 percent).
Table 21: Correct Predictions Based on Logistic Model, Hypothesis One and Two
Correct Predictions Based on Logistic Model, Hypothesis One and Two
Model for Hypothesis One Predicted
Observed 0 1 2 Percent
Correct
0 3198 3685 0 46.5%
1 2681 6185 2 69.7%
2 0 41 2 4.7%
Overall percentage 37.2% 62.8% 0.0% 59.4%
Model for Hypothesis Two Predicted
Observed 0 1 2 Percent
Correct
0 3420 2878 0 54.3%
1 2326 7136 1 75.4%
2 0 31 2 6.1%
Overall percentage 36.4% 63.6% 0.0% 66.8%

PREDICTING THE FINANCIAL VULNERABILITY OF U.S. PUBLIC CHARITIES 61
ANOVA Comparing Metrics of Financial Classifications
An ANOVA was conducted to compare the effects of the financial metrics on the
financial vulnerability classifications used to test hypothesis one. Table 22 presents the
descriptive statistics.
Table 22: Comparing Metrics of Financial Classifications, Hypothesis One
Descriptive Statistics Comparing Metrics of Financial Classifications, Hypothesis One
Number M SD
Net Assets
Ratio
0 6883 2.885 15.828
1 8868 5.119 53.498
2 43 -3.156 16.555
Total 15,794 4.123 41.451
Revenue
Concentration
0 6883 .328 .194
1 8868 -.080 8.101
2 43 -.233 .770
Total 15,794 .097 6.075
Administrative
Cost Ratio
0 6883 .864 .070
1 8868 .837 6.353
2 43 .519 .232
Total 15,794 .848 4.761
Operating
Margin Ratio
0 6883 .796 13.585
1 8868 25.215 1326.225
2 43 -.183 .213
Total 15,794 14.504 993.855
The results, presented in Table 23, show that the Net Assets Ratio (F(2, 15791) =
6.296, p = .002) and Revenue Concentration (F(2,15791) = 8.825, p < .001) have a
significant effect on the organization’s financial vulnerability classification as not-at-risk,
at-risk, or severely-at-risk at the p < .05 level. The Administrative Costs Ratio (F(2,

PREDICTING THE FINANCIAL VULNERABILITY OF U.S. PUBLIC CHARITIES 62
15791) = .166, p = .847) and the Operating Margin Ratio (F(2, 15791) = 1.174, p = .309)
do not have a significant effect on an organization’s financial vulnerability classification.
Table 23: Comparing Metrics of Financial Classifications, Hypothesis One
ANOVA Results Comparing Metrics of Financial Classifications, Hypothesis One
Sum of
Squares
df Mean
Square
F Sig.
Net Assets
Ratio
Between
Groups
21620.394 2 10810.197 6.296 .002
Within
Groups
27113387.18 15,791 1717.015
Total 27135007.57 15,793
Revenue
Concentration
Between
Groups
650.770 2 325.385 8.825 .000
Within
Groups
582217.894 15,791 36.870
Total 582868.665 15,793
Administrative
Costs Ratio
Between
Groups
7.539 2 3.769 .166 .847
Within
Groups
357944.938 15,791
Total 357952.477 15,793
Operating
Margin Ratio
Between
Groups
2320010.940 2 1160005.470 1.174 .309
Within Groups
1.560E+10 15,791 987726.168
Total 1.560E+10 15,793

PREDICTING THE FINANCIAL VULNERABILITY OF U.S. PUBLIC CHARITIES 63
A Tukey HSD post hoc test was computed to further examine the relationship
between financial vulnerability classifications (see Table 24). Post hoc comparisons
indicated that the mean score for the Net Assets Ratio for charitable organizations
classified as not-at-risk (M = 2.885, SD = 15.828) was significantly different from those
classified as at-risk (M = 5.119, SD = 53.498) but not significantly different from those
classified as severely-at-risk (M = -3.156, SD = 16.555). There was no significant
difference between those classified as at-risk and those classified as severely-at-risk.
Post hoc comparison also indicated that the mean score for revenue concentration
of charitable organizations classified as not-at-risk (M = .328, SD = .194) was
significantly different from those classified as at-risk (M = -.080, SD = 8.101) but not
significantly different from those classified as severely-at-risk (M = -.233, SD = .770).
There was no significant difference between those classified as at-risk and those
classified as severely-at-risk.
Post hoc comparison further shows there is no significant difference in the mean
score for the Administrative Cost Ratio of charitable organizations classified as not-at-
risk (M = .864, SD = .070), at-risk (M = .837, SD = 6.343), and severely-at-risk (M
= .519, SD = .232). It also shows there is no significant difference in the mean score for
the Operating Margin Ratio of charitable organizations classified as not-at-risk (M
= .796, SD = 13.585), at-risk (M = 25.215, SD = 1326.225), and severely-at-risk (M =
-.183, SD = .213).

PREDICTING THE FINANCIAL VULNERABILITY OF U.S. PUBLIC CHARITIES 64
Table 24: Post Hoc Test Metrics of Financial Classifications, Hypothesis One
Post Hoc Test – Tukey HSD Metrics of Financial Classifications, Hypothesis One
Dependent
Variable
(I) Hypothesis
1:
(J) Hypothesis
1:
Mean
Difference
(I-J)
Std. Error Sig.
Net Assets
Ratio
0 1 -2.234* .665 .002
2 6.041 6.339 .607
1 2 8.275 6.334 .392
Revenue
Concentration
0 1 .408* .097 .000
2 .561 .929 .818
1 2 .153 .928 .985
Administrative
Cost Ratio
0 1 .027 .076 .932
2 .345 .728 .884
1 2 .317 .728 .900
Operating
Margin Ratio
0 1 -24.419 15.965 .277
2 .979 152.032 1.000
1 2 25.398 151.927 .985
Note: (I) Hypothesis 1: Not-at-Risk = 0; At-Risk = 1; Severely-At-Risk = 2; (J)
Hypothesis 1: Not-at-Risk = 0; At-Risk = 1; Severely-At-Risk = 2
* The main difference is significant at the 0.05 level.
An ANOVA was also conducted to compare the effects of the financial metrics on
the financial vulnerability classifications used to test hypothesis two (see Table 25).

PREDICTING THE FINANCIAL VULNERABILITY OF U.S. PUBLIC CHARITIES 65
Table 25: Comparing Metrics of Financial Classifications, Hypothesis One
Descriptive Statistics Comparing Metrics of Financial Classifications, Hypothesis Two
Number M SD
Net Assets Ratio 0 6298 3.043 16.532
1 9463 4.869 51.798
2 33 -4.166 18.847
Total 15,794 4.123 41.451
Revenue
Concentration
0 6298 .332 .194
1 9463 -.058 7.843
2 33 -.255 .853
Total 15,794 .097 6.075
Administrative Cost
Ratio
0 6298 .863 .069
1 9463 .839 6.150
2 33 .527 .232
Total 15,794 .848 4.761
Operating Margin
Ratio
0 6298 .822 14.141
1 9463 23.661 1283.863
2 33 -.220 .231
Total 15,794 14.504 993.855
Debt Ratio 0 6298 .783 .184
1 9463 -.308 72.626
2 33 -.502 1.284
Total 15794 .127 56.218
As presented in Table 26, the test results show that the Net Assets Ratio (F(2,
15791) = 4.334, p = .013) and Revenue Concentration (F(2, 15791) = 7.857, p < .001)
have a significant effect on the organization’s financial vulnerability classification as not-
at-risk, at-risk, or severely-at-risk at the p < .05 level. The Administrative Cost Ratio

PREDICTING THE FINANCIAL VULNERABILITY OF U.S. PUBLIC CHARITIES 66
(F(2, 15791) = .120, p = .887), the Operating Margin Ratio (F(2, 15791) = 1.002, p
= .367), and the Debt Ratio (F(2, 15791) = .714, p = .490) do not have a significant effect
on an organization’s financial vulnerability classification.
Table 26: Comparing Metrics of Financial Classifications, Hypothesis Two
ANOVA Results Comparing Metrics of Financial Classifications, Hypothesis Two
Sum of
Squares
df Mean
Square
F Sig.
Net Assets
Ratio
Between
Groups
14886.417 2 7443.209 4.334 .013
Within Groups
27120121.16 15,791 1717.442
Total 27135007.57 15,793
Revenue
Concentration
Between
Groups
579.440 2 289.720 7.857 .000
Within Groups
582289.225 15,791 36.875
Total 582868.665 15,793
Administrative
Costs Ratio
Between
Groups
5.439 2 2.719 .120 .887
Within Groups
357947.038 15,791 22.668
Total 357952.477 15,793
Operating
Margin Ratio
Between
Groups
1979529.906 2 989764.953 1.002 .367
Within Groups
1.560E+10 15,791 987747.730
Total 1.560E+10 15,793
Debt Ratio Between
Groups
4512.360 2 2256.180 .714 .490
Within Groups 49908430.68 15,791 3160.562
Total 49912943.04 15,793

PREDICTING THE FINANCIAL VULNERABILITY OF U.S. PUBLIC CHARITIES 67
A Tukey HSD post hoc test was computed to further examine the relationship
between financial vulnerability classifications (see Table 27). Post hoc comparisons
indicated that the mean score for the Net Asset Ratio for charitable organizations
classified as not-at-risk (M = 3.043, SD = 16.532) was significantly different from
organizations classified as at-risk (M = 4.869, SD = 51.798) but not significantly different
from those classified as severely-at-risk (M = -4.166, SD = 18.847). There was no
significant difference between those classified as at-risk and those classified as severely-
at-risk.
Post hoc comparisons also indicated that the mean score of Revenue
Concentration for charitable organizations classified as not-at-risk (M = .332, SD = .194)
was significantly different from organizations classified as at-risk (M = -.058, SD =
7.843) but not significantly different from those classified as severely-at-risk (M = -.255,
SD = .853). There was no significant difference between those classified as at-risk and
those classified as severely-at-risk.
Post hoc comparison further shows there is no significant difference in the mean
score for the Administrative Cost Ratio of charitable organizations classified as not-at-
risk (M = .864, SD = .070), at-risk (M = .837, SD = 6.343), and severely-at-risk (M
= .519, SD = .232). It also shows there is no significant difference in the mean score for
the Operating Margin Ratio of charitable organizations classified as not-at-risk (M
= .796, SD = 13.585), at-risk (M = 25.215, SD = 1326.225), and severely-at-risk (M =
-.183, SD = .213).

PREDICTING THE FINANCIAL VULNERABILITY OF U.S. PUBLIC CHARITIES 68
Table 27: Post Hoc Test Metrics of Financial Classifications Hypothesis Two
:Post Hoc Test – Tukey HSD Metrics of Financial Classifications, Hypothesis Two
Dependent
Variable
(I) Hypothesis 1 (J) Hypothesis 1 Mean
Difference
(I-J)
Std.
Error
Sig.
Net Assets
Ratio
0
1 -1.83 * .674 .018
2 7.21 7.23 .579
1 2 9.036 7.23 .424
Revenue
Concentration
0 1 .390 * .099 .000
2 .588 1.06 .844
1 2 .198 1.06 .981
Administrative
Cost Ratio
0 1 .023 .077 .952
2 .335 .831 .914
1 2 .312 .830 .925
Operating
Margin Ratio
0 1 -22.839 16.162 .334
2 1.043 173.460 1.000
1 2 23.881 173.309 .990
Debt Ratio 0 1 1.091 .9142 .457
2 1.285 9.812 .991
1 2 .194 9.803 1.000
Note: (I) Hypothesis 1: Not-at-Risk = 0; At-Risk = 1; Severely-At-Risk = 2; (J)
Hypothesis 1: Not-at-Risk = 0; At-Risk = 1; Severely-At-Risk = 2
* The main difference is significant at the 0.05 level.

PREDICTING THE FINANCIAL VULNERABILITY OF U.S. PUBLIC CHARITIES 69
Chapter 5 – Discussion
In 1991, Tuckman and Chang published the seminal article that considered the
financial vulnerability of nonprofit organizations. They presented a model comprised of
four financial metrics that can assess if a nonprofit organization is financially vulnerable.
The four financial metrics are:
The net asset ratio,
Revenue concentration,
The administrative cost ratio, and
The operating margin ratio.
This model was the direct and indirect subject of empirical testing, indicating that
the model predicts financial vulnerability. However, prior testing did not use an actual
financial shock. An actual financial shock that negatively affected the charitable sector
was the Great Recession from December 2007 through 2009. This study’s objective was
to test the predictability of the Tuckman-Chang model by considering the following
research question: Does the Tuckman and Chang model of financial vulnerability
accurately predict charitable organization survival of a financial shock?
This study used binary logistic regression analysis to explore this question. The
results of this analysis indicate that the Tuckman-Chang model of financial vulnerability
can predict if a nonprofit organization will survive a financial shock. In other words,
nonprofit organizations classified as financially at-risk or financially severely-at-risk are
more likely not to survive a financial shock than organizations that are not financially at-
risk. Because of these results, we reject the null of the first hypothesis. The ANOVA
results indicated a significant difference in a charitable organization’s survival of a

PREDICTING THE FINANCIAL VULNERABILITY OF U.S. PUBLIC CHARITIES 70
financial shock between the financial vulnerability classification groups; thus, providing
further support that the Tuckman-Chang model can predict if a charitable organization
will survive a financial shock. This study’s results align with the results of prior studies
of the Tuckman-Chang model discussed in Chapter 2.
The second objective of this study was to consider the effect of debt on financial
vulnerability. To test the second hypothesis, the Tuckman-Chang model was expanded by
adding the debt ratio. The testing results indicated that the extended model accurately
predicts which organizations will survive a financial shock and that a relationship exists
between the financial vulnerability classifications that include the debt ratio and the
organization’s survival of a financial shock. These results align with the study presented
by Trussel (2002). Because of these results, I reject the null of the second hypothesis.
There are few studies on debt’s effect on a charitable organization’s financial
vulnerability, though measures of debt are included in predictive tests of for-profit
organizations (Altman, 1968; Beaver, 1966; Ohlson, 1980). Though this study’s results
indicate that the Tuckman-Chang model extended by adding the debt ratio is a predictive
model of charitable organization financial vulnerability, the results do not indicate that
the debt ratio strengthens the explanatory nature of the model. This result is evident when
comparing the F value of the one-way between-subjects ANOVA for hypothesis one
(F(2,15791) = 177.815, p < .001) and the F value of the one-way between-subjects
ANOVA for hypothesis two (F(2,15791) = 149.296, p < .001). The decrease in the F
value of the tests indicates that adding the debt ratio does not strengthen the model’s
explanatory nature.

PREDICTING THE FINANCIAL VULNERABILITY OF U.S. PUBLIC CHARITIES 71
The predictive ability of the Tuckman-Chang model of nonprofit organization
financial vulnerability as noted in this study is consistent with prior literature and
research (Greenlee and Trussel, 2000; Hager, 2001; Thomas and Trafford, 2013; Trussel,
2002; Trussel and Greenlee, 2004). This study adds to the literature by using an actual
financial shock to the nonprofit sector to test the Tuckman-Chang model’s predictive
ability.
Additional testing was performed to consider the relationship between the
financial metrics used in the Tuckman-Chang model and the financial vulnerability
classifications. The administrative cost ratio, operating margin ratio, and the
organization’s revenue concentration have a strong relationship with the financially
severely-at-risk classification. There is not a strong relationship between the net assets
ratio and financially severely-at-risk classification.
Likewise, there was a strong relationship between being financially-at-risk and
the net assets ratio, the debt ratio, and the organization’s revenue concentration. However,
the administrative costs ratio does not have a strong relationship with being financially
at-risk. The operating margin ratio does not have a strong relationship with being
financially at-risk as defined by the Tuckman-Chang model. However, the relationship is
strengthened when the model is extended by adding the debt ratio. The change in the
relationship may be due to the impact of debt on the organization’s amount of donations
(Calabrese and Grizzle, 2012; Homonoff et al., 2020) and on the organization’s overall
profitability (Lam et al., 2020).
Finally, additional testing was performed to evaluate the relationship between the
Tuckman-Chang model’s financial metrics plus the debt ratio and the organizations’

PREDICTING THE FINANCIAL VULNERABILITY OF U.S. PUBLIC CHARITIES 72
survival of the Great Recession. Only the administrative cost ratio had a significant
relationship with organization survival, though it had mixed results with its relationship
with financial vulnerability classifications. The administrative cost ratio is also widely
used as an efficiency ratio. The results of this study could add to the literature about the
use of this ratio and its effectiveness as a measure of financial vulnerability.
Implications
The results of this study have potential implications for stakeholders of the
charitable sector, including but not limited to those who oversee and govern nonprofit
organizations, current and potential donors, lenders, charitable organization consultants,
and the public at large. The charitable sector is a large contributor to the U.S. economy,
and many benefit from the services provided by these organizations. The board of
directors and organization management can implement decisions that improve the
organization’s financial health and longevity by utilizing a matrix of financial measures
that can predict a charitable organization’s survival of a financial shock.
Current and potential donors and lenders may use the financial vulnerability
models to determine in which charitable organizations they should make a financial
investment. Current and potential donors may use these financial metrics to assess a
charitable organization’s financial health and use that information for donation decision-
making. Donors may elect to improve the charity’s financial health by increasing the
amount given, or donors may choose to give to organizations that exhibit financial
stability. Lenders may use the models to assess the risk of loaning money to the
organization.
PREDICTING THE FINANCIAL VULNERABILITY OF U.S. PUBLIC CHARITIES 73
Accounting practitioners and those who consult with nonprofit organizations
generally rely on ratios and other financial metrics to assess the financial health and
performance of organizations. The results of this study indicate that the Tuckman-Chang
model can assess the financial vulnerability of a charitable organization and its ability to
survive a financial shock. Practitioners must remain aware that assessment of only the
metrics does not provide full information. The metrics must be assessed together and
compared to other charitable organizations to develop a comprehensive analysis.
Nonprofit organization management and those who audit those organizations
could use the Tuckman-Chang model or the extended model to evaluate the
organization’s ability to continue as a going concern. Many of the conditions and events
suggested in FASB ASU No. 2014-15 and examples provided in the Accounting and
Audit Guide for Not-for-Profit Entities are represented in the model’s financial metrics.
Management’s use of this model could allow them to make strategic decisions to
strengthen the organization’s financial health. Auditors could use this model as a test for
the going concern assumption and provide support for the issuance of a going concern
modified audit opinion.
Limitations and Further Research
Certain limitations are inherent in this study. First, this study includes data only
from organizations deemed public charities and exempt from federal income taxation
under Internal Revenue Code Section 501(c)3. The nonprofit industry is vast and contains
many other organizations that are tax-exempt under other IRC Sections. Furthermore, the
charitable sector contains a variety of subsectors. Each subsector may respond to a
financial shock in different ways. With this in mind, this study’s results may not be

PREDICTING THE FINANCIAL VULNERABILITY OF U.S. PUBLIC CHARITIES 74
generalizable across the entirety of the nonprofit industry or the charitable sector. Hagar
(2001) applied the Tuckman-Chang model to charitable arts organizations, and Prentice
(2016a) applied an expanded model to nonprofit human service organizations and higher
education institutions. The results of both studies indicate that the Tuckman-Chang model
can be applied to organizations in these charitable subsectors; however, an actual
financial shock was not utilized in either study. A binary logistic regression analysis
should be used to determine if the Tuckman-Chang model can be used to assess the
financial vulnerability of organizations tax-exempt under other IRC sections and in other
charitable subsectors.
The data set used for this study was compiled from the Form 990 information
filed with the IRS. Not all charitable organizations are required to file a Form 990. These
organizations include those with annual gross receipts less than $25,000 and religious
congregations. These organizations may respond to a financial shock differently than
those included in the data set. The financial vulnerability literature would benefit from
studies of smaller charitable organizations and religious congregations.
The Tuckman-Chang model classified nonprofit organizations as financially at-
risk if they were in the bottom quintile for one financial metric and financially severely-
at-risk if they were in the bottom quintile for all four financial metrics. Classifications are
not given to the organizations in the bottom quintile of two or three financial metrics.
Further research to test the relationship between being in the bottom quintile for two or
three of the financial metrics and the organization’s ability to survive a financial shock
would provide more information on viable application of the Tuckman-Chang model and
add to the financial vulnerability literature.

PREDICTING THE FINANCIAL VULNERABILITY OF U.S. PUBLIC CHARITIES 75
Conclusion
At the time of this writing, the world has been subject to the coronavirus
(COVID-19) pandemic, which has affected the health of many individuals and the
economy. Such an economic shock could have a negative impact on the financial stability
of charitable organizations. Many of these organizations provide services that support the
public good. The demise of these organizations could result in certain needs going unmet.
The results of this study provide strength to prior studies by indicating that the Tuckman-
Chang model of nonprofit financial vulnerability can predict whether or not a charitable
organization can survive a financial shock. The use of this model for strategic decision-
making by nonprofit organization management can promote these organizations’
longevity, resulting in the continuation of a vast array of charitable services.

PREDICTING THE FINANCIAL VULNERABILITY OF U.S. PUBLIC CHARITIES 76
References
Altman, E. (1968). Financial ratios, discriminant analysis, and the predictions of
corporate bankruptcy. Journal of Finance, 23(4), 589-609. doi:10.1111/j.1540-
6261.1968.tb00843.x
American Institute of Certified Public Accountants. (2017). Audit & accounting guide:
Not-for-profit entities. American Institute of Certified Public Accountants, Inc.
Andres-Alonso, P., Garcia-Rodriguez, L., & Romero-Merion, M. E. (2016).
Disentangling the financial vulnerability of nonprofits. International Society for
Third-Sector Research, 27(6), 2539-2560. doi:10.1007/s11266-016-9764-6
Arnsberger, P., Ludlum, M., Riley, M., & Stanton, M. (2008). A history of the tax-exempt
sector: An SOI perspective. Statistics of Income SOI Bulletin, 27(3), 105-135.
Retrieved from https://www.irs.gov/pub/irs-soi/tehistory.pdf
Beaver, W. H. (1966). Financial ratios as predictors of failure. Nonprofit Management
and Leadership, 22(1), 37-51.
Boris, E. T., & Steuerle, C. E. (2006). Scope and dimensions of the nonprofit sector. In I.
W. Steiberg (Ed.), The nonprofit sector: A research handbook (2nd ed., pp. 66-
88). Yale University Press.
Bowman, W. (2002). The uniqueness of nonprofit finance and the decision to borrow.
Nonprofit Management and Leadership, 12(3), 293-311. doi:10.1002/nml.12306
Bowman, W. (2011). Financial capacity and sustainability of ordinary nonprofits.
Nonprofit Management and Leadership, 22(1), 37-51. doi:10.1002/nml.20039
Bowman, W. (2015, August 06). The price of nonprofit debt. Retrieved from Nonprofit
Quarterly: http://nonprofitquarterly.org/2015/08/06/the-price-of-nonprofit-debt/
PREDICTING THE FINANCIAL VULNERABILITY OF U.S. PUBLIC CHARITIES 77
Bridgeland, L. M., Dunkelman, M., McNaught, M., & Reed, B. (2009). The quiet crisis:
The impact of the the economic downturn on the nonprofit sector. W.K. Kellogg
Foundation. Retrieved from https://files.eric.ed.gov/fulltext/ED513451.pdf
Brooks, C. (2018). How did the Great Recession affect charitable giving. Public Finance
Review, 46(5), 715-742. doi:10.1177/1091142117691604
Calabrese, T., & Grizzle, C. (2012). Debt, donors, and the decision to give. Journal of
Public Budgeting, Accounting, and Financial Management, 24(2), 221-254.
doi:10.1108/JPBAFM-24-02-2012-B003
Carroll, D. A., & Stater, K. J. (2008). Revenue diversification in nonprofit organizations:
Does it lead to financial stability? Journal of Public Administration Revenue and
Theory, 19, 947-966. doi:10.1093/jopart/mun025
Charles, C. (2018). Nonprofit arts organizations: Debt ratio does not influence donations-
interest expense ratio does. American Review of Public Administration, 48(7),
659-667. doi:10.1177;0275074017724227
Chikoto-Schultz, G. L., & Neely, D. G. (2016). Exploring the nexus of nonprofit financial
stability and financial growth. Voluntas, 27, 2561-2575. doi:10.1007/s11266-016-
9786-0
Cordery, C. J., Sim, D., & Baskerville, R. F. (2013). Three models, one goal: Assessing
financial vulnerability in New Zealand amateur sports clubs. Sport Management
Review, 16(2), 186-199. doi:10.1016/j.smr.2012.08.002
Denison, D. V. (2009). Which nonprofit organizations borrow? Public Budgeting &
Finance, 29(3), 110-123. doi:10.1111/j.1540-5850.2009.00939.x

PREDICTING THE FINANCIAL VULNERABILITY OF U.S. PUBLIC CHARITIES 78
Denison, D. V., & Beard, A. (2003). Financial vulnerability of charitable organizations:
Lessons from research. Journal for Nonprofit Management, 23-31.
Dietz, N., McKeever, B., Brown, M., Koulish, J., & Pollak, T. (2014). The impact of the
Great Recession on the number of charities by subsector and revenue range.
Washington DC: Urban Institute.
FASB. (2008). Statement of financial accounting concepts no. 6: Elements of financial
statements. Retrieved from
https://www.fasb.org/jsp/FASB/Document_C/DocumentPage?cid=121822013283
1&acceptedDisclaimer=true
FASB. (2014). ASU No. 2014-15: Presentation of financial statements-going concern
(Subtopic 205-40). Disclosure of uncertainties about an entity's ability to continue
as a going concern. Retrieved from
https://www.fasb.org/resources/ccurl/599/128/ASU 2014-15.pdf
FASB. (2016). ASU No. 2016-14 Not-for-profit entities (Topic 958): Presentation of
financial statements of not-for-profit entities. Retrieved from
https://asc.fasb.org/imageRoot/56/92564756.pdf
Froelich , K. A., & Knoepfle , T. W. (1996). Internal Revenue Service 990 data: Fact or
fiction? Nonprofit and Voluntary Sector Quarterly, 25(1), 40-52.
doi:10.1177/0899764096251004
Froelich, K. A., Knoepfle , T. W., & Pollak, T. H. (2000). Financial measures in nonprofit
organization research: Comparing IRS 990 return and audited financial statement
data. Nonprofit and Voluntary Sector Quarterly, 29(2), 232-254.
doi:10.1177/0899764000292002

PREDICTING THE FINANCIAL VULNERABILITY OF U.S. PUBLIC CHARITIES 79
Giving USA. (2008). Giving during recessions and economic slowdowns. Giving USA
Spotlight, 2008(3), 1-19. Retrieved from http://www.ruotoloassoc.com/Spotlight3-
2008Final.pdf
Giving USA. (2020). [2020 Infographic].
Gordon, T. P., Fischer, M., Greenlee, J., & Keating, E. K. (2013). Warning signs:
Nonprofit insolvency indicators. International Research Journal of Applied
Finance, 4(3), 343-378.
Greenlee, J. S., & Trussel, J. M. (2000). Predicting the financial vulnerability of
charitable organizations. Nonprofit Management and Leadership, 11(2), 199-209.
doi:10.1002/nml.11205
Hager, M. A. (2001). Financial vulnerability among arts organizations: A test of the
Tuckman-Chang measures. Nonprofit and Voluntary Sector Quarterly, 30(2), 376-
392. doi:10.1177/0899764001302010
Hodge, M. M., & Piccolo, R. F. (2005). Funding source, board involvement techniques,
and financial vulnerability in nonprofit organizations: A test of resource
dependence. Nonprofit Management and Leadership, 16(2), 171-190.
doi:10.1002/nml.99
Homonoff, T., Spreen, T. L., & St. Clair, T. (2020). Balance sheet insolvency and
contribution revenue in public charities. Journal of Public Economies, 186, 1-13.
doi:10.1016/j.jpubeco.2020.104177
Hosmer, D. W., Lemeshow, S., & Sturdivant, R. X. (2013). Applied Logistic Regression
(3rd Ed.). Hoboken, NJ: John Wiley & Sons Inc.

PREDICTING THE FINANCIAL VULNERABILITY OF U.S. PUBLIC CHARITIES 80
Hurd, M. D., & Robwedder, S. (2010). Effects of the financial crisis and Great Recession
on American households. Nonprofit and Voluntary Sector Quarterly, 7(2), 65-72.
doi:10.2139/ssrn.1713953
Keating, E. K., Fischer, M., Gordon, T. P., & Greenlee, J. (2005, January). Assessing
financial vulnerability in the nonprofit sector. KSG Working Paper No RWP05-
002, Hauser Center for Nonprofit Organizations Paper No. 27. Retrieved from
https://papers.ssrn.com/sol3/papers.cfm?abstract_id=647662
Kim, M. (2017). The relationship of nonprofits' financial health to program outcomes:
Empirical evidence from nonprofit arts organizations. Nonprofit and Voluntary
Sector Quarterly, 46(3), 525-548. doi:10.1177/089974016662914
Lam, M., Searing, E., Prentice, C., & Grasse, N. (2020). Capital structure and financial
health. In I. G.-R. Romero-Merino (Ed.), Financing Nonprofit Organizations (pp.
145-158). Oxfordshire, England: Routledge.
Lin, W., & Wang, Q. (2016). What helped nonprofits weather the Great Recession?
Evidence from human services and community improvement organisations.
Nonprofit Management and Leadership, 26(3), 257-276. doi:10.1002/nml.21197
Lu, J., Shon, J., & Zhang, P. (2020). Understanding the dissolution of nonprofit
organizations: A financial management perspective. Nonprofit and Voluntary
Sector Quarterly, 49(1), 29-52. doi:10.1177/0899764019872006
Marx, J. D., & Carter, V. B. (2014). Factors influencing US charitable giving during the
Great Recession: Implications for nonprofit administration. Administrative
Sciences, 2014(4), 350-372. doi:10.3390/admsci4030350

PREDICTING THE FINANCIAL VULNERABILITY OF U.S. PUBLIC CHARITIES 81
Meer, J., Miller, D. H., & Wulfsberg, E. (2016). The Great Recession and Charitable
Giving. Cambridge, MA: National Bureau of Economic Research.
Michalski, G., Blendiger, G., Rozsa, Z., Cierniak-Emerych, A., Svidronova, M., Buleca,
J., & Bulsara, H. (2018). Can we determine debt to equity levels in nonprofit
organisations? Answers based on Polish case. Inzinerine Ekonomika -
Engineering Economics, 29(5), 526-535. doi:10.5755/j.01.ee.29.5.19666
Mitchell, G. E., & Calabrese, T. D. (2018). Proverbs of nonprofit financial management.
American Review of Public Administration, 49(6), 649-661.
doi:10.1177/0275074018770458
Morreale, J. C. (2011). The impact of the "Great Recession" on the financial resources of
nonprofit organizations. Retrieved from
https://digitalcommons.pace.edu/wilson/5/
National Center for Charitable Statistics. (n.d.). Guide to using NCCS data. Retrieved
from https://nccs-data.urban.org/NCCS-data-guide.pdf
NCCS Project Team. (2020, June). The nonprofit sector in brief 2019. Retrieved from
National Center for Charitable Statistics:
http://nccs.urban.org/publication/nonprofit-sector-brief-2019#the-nonprofit-
sector-in-brief-2019
Ohlson, J. (1980). Financial ratios and the probabilistic prediction of bankruptcy. Journal
of Accounting Research, 18(1), 31-109. doi:10.2307/2490395
Osili, U. O., Clark, C. J., & Han, X. (2019). Heterogeneity and giving: Evidence from the
U.S. households before and after the Great Recession of 2008. American
Behavioral Scientist, 63(14), 1841-1862. doi:10.1177/0002764219850859

PREDICTING THE FINANCIAL VULNERABILITY OF U.S. PUBLIC CHARITIES 82
Prentice, C. R. (2016a). Understanding nonprofit financial health: Exploring the effects of
organizational and environmental variables. Nonprofit and Voluntary Sector
Quarterly, 45(5), 888-909. doi:10.1177/0899764015601243
Prentice, C. R. (2016b). Why so many measures of nonprofit financial performance?
Analyzing and improving the use of financial measures in nonprofit research.
Nonprofit and Voluntary Sector Quarterly, 45(4), 715-740.
doi:10.1177/0899764015595722
Reich, R., & Wimer, C. (2012). Charitable giving and the Great Recession. Stanford, CA:
Stanford Center on Poverty and Inequality.
Salamon, L. M., Geller, S. L., & Spence, K. L. (2009). Impacts of the 2007-09 economic
recession on nonprofit organizations (Communique No. 14). Retrieved from Johns
Hopkins Listening Post Project website: http://ccss.jhu.edu/wp-
content/uploads/downloads/2011/09/LP_Communique14_2009.pdf
Searing, E. A. (2018). Determinants of the recovery of financially distressed nonprofits.
Nonprofit Management and Leadership, 28, 313-328. doi:10.1002/nml.21296
Smith , G. P. (2010). What are the capital structure determinants for tax-exempt
organizations? The Financial Review, 45(3), 845-872. doi:10.1111/j.1540-
6288.2010.00274.x
Tevel, E., Katz, H., & Brock, D. M. (2015). Nonprofit financial vulnerabilty: Testing
competing models, recommended improvements, and implications. Voluntas,
26(6), 2500-2516. doi:10.1007/s11266-014-9523-5
Thomas, R., & Trafford, R. (2013). Were UK culture, sport and recreation charities
prepared for the 2008 economic downturn? An application of Tuckman and
PREDICTING THE FINANCIAL VULNERABILITY OF U.S. PUBLIC CHARITIES 83
Chang's measures of financial vulnerability. Voluntas, 24(3), 630-648.
doi:10.1007/s11266-012-9273-1
Tirumalsety, R., & Gurtoo, A. (2019). Financial sources, capital structure and
performance of social enterprises: Empirical evidence from India. Journal of
Sustainable Finance & Investment, 1-20. doi:10.1080/20430795.2019.1619337
Trussel, J. M. (2002). Revisiting the prediction of financial vulnerability. Nonprofit
Management and Leadership, 13(1), 17-31. doi:10.1002/nml.13103
Trussel, J. M., & Greenlee, J. S. (2004). A financial risk rating system for charitable
nonprofit organizations. Research in Governmental and Nonprofit Accounting,
11(2), 93-116. doi:10.1016/s0884-0741(04)1105-7
Trussel, J., Greenlee, J. S., & Brady, T. (2002). Predicting financial vulnerability in
charitable organizations (Not-for-Profit Organizations). The CPA Journal, 72(6),
pp. 66-69.
Tuckman, H. P., & Chang, C. F. (1991). A methodology for measuring the financial
vulnerability of charitable nonprofit organizations. Nonprofit and Voluntary
Sector Quarterly, 20(4), 445-461. doi:10.1177/089976409102000407
Tuckman, H. P., & Chang, C. F. (1993). How well is debt managed by nonprofits?
Nonprofit Management and Leadership, 3(4), 347-361.
doi:10.1002/nml.4130030403
Tzifakis, N., Petropoulos, S., & Huliaras, A. (2017). The impact of economic crises on
NGOs: The case of Greece. Voluntas, 28(1), 2176-2199. doi:10.1007/s11266-017-
9851-3

PREDICTING THE FINANCIAL VULNERABILITY OF U.S. PUBLIC CHARITIES 84
Vermeer, T. E., Raghunandan, K., & Forglone, D. A. (2013). Going-concern modified
audit opinions for non-profit organizations. Journal of Public Budgeting,
Accounting, and Financial Management, 25(1), 113-134. doi:10.1108/JPBAFM-
25-01-2013-B006
Yan, W., Denison, D. V., & Butler, J. S. (2009). Revenue structure and nonprofit
borrowing. Public Finance Review, 37(1), 47-67. doi:10.1177/1091142108321239
Zietlow, J., Hankin, J. A., Seidner, A., & O'Brien, T. (2018). Financial management for
nonprofit organizations: Policies and practices. John Wiley & Sons, Inc.