predicting international student enrollment in u.s
TRANSCRIPT
Note: The authors would like to thank Zeliha Bicak for her support.
Journal of Educational Research & Practice 2020, Volume 10, Issue 1, Pages 221–241
DOI: 10.5590/JERAP.2020.10.1.15 © The Author(s)
Original Research
Predicting International Student Enrollment in U.S. Institutions by Institutional Characteristics: Using Fixed and Random Effects
Ibrahim Bicak, M.S. The University of Texas at Austin, Austin, Texas, United States https://orcid.org/0000-0001-7993-548X
Z. W. Taylor, Ph.D. The University of Texas at Austin, Austin, Texas, United States https://orcid.org/0000-0002-6085-2729
Contact: [email protected]
Abstract For the first time, international student enrollment in U.S. institutions of higher education declined for a second straight year in 2017–2018. As a result, we sought to understand which institutional characteristics predict international student enrollment, informing the international education community regarding possible institutional factors responsible for the decline in international student enrollment by using five-year panel data from 2013 Fall to 2017 Fall. Results from institutional fixed effects models revealed positive relationships between first-time international undergraduate enrollment and different variables such as institutional grant aid in bachelor’s institutions and student services expenses at private non-profit institutions in suburban settings. Contrary to earlier research, this study’s findings revealed that there is no relationship between state appropriations and first-time international undergraduate enrollment. We address implications for research, practice, and international student choice.
Keywords: international students, higher education, enrollment, random effects, fixed effects, panel data analysis
Date Submitted: April 20, 2020 | Date Published: July 29, 2020
Recommended Citation
Bicak, I., & Taylor, Z. W. (2020). Predicting international student enrollment in U.S. institutions by institutional characteristics: Using fixed and random effects. Journal of Educational Research and Practice, 10, 221–241. https://doi.org/10.5590/JERAP.2020.10.1.15
Introduction International students are an important populatiom of U.S. higher education students. For decades, international education researchers have analyzed why students who primarily reside outside of the U.S, enroll in U.S. institutions (Agarwal & Winkler, 1985; Bodycott, 2009; Bohman, 2009, 2014; Bruhn, 2016; Darby, 2015; Stafford et al., 1980; Zhang & Hagedorn, 2018). Since the mid-1970s, international student enrollment in U.S. institutions has maintained a steady upward trajectory, as around 300,000 international
Bicak & Taylor, 2020
Journal of Educational Research and Practice 222
students were enrolled in U.S. institutions in 1975 compared to over one million international students in 2017 (Zong & Batalova, 2018).
However, since U.S. institutions of higher education have captured and analyzed international student enrollment data, international student enrollment in four-year U.S. institutions has decreased in consecutive years—from 2016–2017 and 2017–2018—for the first time (Institute of International Education, 2018). Educational researchers, policy makers, and members of the U.S. press have hypothesized that these consecutive years of enrollment decline could be owed to a strong U.S. dollar, which has resulted in relatively higher U.S. tuition prices, more stringent Visa application policies and procedures, and a real or perceived anti-immigration sentiment held by U.S. executive leadership and felt by prospective international students (Redden, 2018; Torbati, 2018).
Subsequently, we need to understand which four-year institutional characteristics drive international student enrollment, as these students are critical for the U.S. higher education system in terms of social, cultural, intellectual, and economic impact (Bound et al., 2016; Bruhn, 2016; Cantwell, 2015; Hagedorn & Zhang, 2011; Mukherjee, 2016; Stafford et al., 1980). Extant research has attempted to examine institutional characteristics to model international student enrollment, but these studies have been limited to public institutions (Bound et al.; Cantwell), community colleges (Zhang & Hagedorn, 2018), and non-resident student enrollment which did not clearly delineate out-of-state applicants from international students (Curs & Jaquette, 2017). These studies have also not considered the characteristics of private institutions, for-profit institutions, and institutional characteristics such as student services expenses and endowment alongside an analysis of longitudinal data to articulate international student enrollment changes over time. Moreover, a plethora of qualitative and survey work has examined international student experiences in applying to and enrolling in U.S. institutions; however, these studies are limited to small sample sizes in terms of international students and institution types (Bodycott, 2009; Bohman, 2009, 2014; Bruhn, 2016; Darby, 2015; Hagedorn & Zhang, 2011; Mukherjee, 2016; Shenoy, 2013).
A recent longitudinal analysis of international student enrollment is crucial to understanding international student enrollment trends, given that many four-year institutional characteristics do not change over time (e.g., institutional sector, geographic location), yet international student enrollment has changed (Zong & Batalova, 2018). In addition, no extant research has used Integrated Postsecondary Education Data System (IPEDS) information to explore four-year institutional characteristics before, during, and after the decline in international student enrollment in four-year U.S. institutions of higher education. As a result, we employ institutional fixed effects and random effects models to answer two research questions critical for international education in the United States:
R1: Which time varying four-year institutional characteristics are most associated with international student enrollment since the 2012–2013 academic year?
R2: Which time invariant four-year institutional characteristics are most associated with international student enrollment since the 2012–2013 academic year?
Answering these questions will inform the international education community—namely institutional leaders and policy makers—regarding how to best position institutions, including two- and four-year institutions, to attract international students to study in the U.S. Moreover, international education researchers will better understand how four-year institutional characteristics drive international student enrollment, leading to possible policy recommendations for providing a supportive, nurturing postsecondary learning experience for international students seeking higher education in the United States.
Bicak & Taylor, 2020
Journal of Educational Research and Practice 223
Literature Review A longitudinal body of research has already documented why international students choose to study at U.S. institutions (Agarwal & Winkler, 1985; Bodycott, 2009; Bohman, 2009, 2014; Bruhn, 2016; Darby, 2015; Hagedorn & Zhang, 2011; Mukherjee, 2016; Shenoy, 2013; Stafford et al., 1980; Zhang & Hagedorn, 2018). As the focus of this study is to fill a gap in the research and determine which institutional characteristics are most associated with international student enrollment in U.S. institutions, this literature review will address work focused on institutional characteristics and international student enrollment.
Although not specific to U.S. institutions, many models of international student choice have emerged from the research (Chen, 2008; Cubillo et al., 2006; Gatfield & Chen, 2006; Mazzarol & Soutar, 2002). These models of international student choice, such as Cubillo, Sánchez, and Cerviño’s (2006) model, include institutional characteristics such as the cost of the institution, the availability of a preferred degree program, and the level of perceived international student support provided by the institution. However, many of these models include institutional characteristics as one of many sources influencing international student choice, and studies including these models have not quantitatively examined institutional characteristics as they relate to international student enrollment in U.S. institutions.
In a survey of Chinese students and their parents regarding the decision to study in the U.S., Bodycott (2009) learned these students and parents perceived U.S. institutions of higher education as providing a higher quality of education and teaching, albeit without pointing to specific institutional characteristics which contribute to these qualities. When making the decision of which specific U.S. institution to attend, Bodycott found these Chinese students and parents valued an institution’s social and emotional support services (p = 0.001), language and academic support services (p = 0.05), cost of tuition (p = 0.001), institutional reputation (p = 0.001), and the institution’s general facilities (p = 0.001). However, subsequent quantitative research has not explored these institutional characteristics as they relate to international student enrollment in U.S. institutions of higher education. Darby’s (2015) qualitative study of international students studying in a large, four-year institution in California echoed many of Bodycott’s findings, suggesting institutional reputation and the cost were strong factors informing international student choice.
Before the decline in international student enrollment in 2017, Cantwell’s (2015) study of international student enrollment in four-year U.S. institutions employed an institutional fixed-effects model using two levels of Carnegie classification: research/doctoral institutions and bachelor’s/master’s institutions. Therein, Cantwell used a panel regression of data between 2000 and 2009 with fixed effects between international student enrollment and net tuition revenue to explore relationships between international students and the tuition revenue generated by an institution, given extant research demonstrating that some U.S. institutions view international student tuition dollars as important drivers of institutional economic stability and growth. Cantwell found net tuition revenue at research/doctoral institutions significantly related to new international undergraduate students (p = 0.05), total number of graduate students (p = 0.01), total in-state students (p = 0.05), total out-of-state students (p = 0.05), and international student enrollment over time (p = 0.05). However, Cantwell also learned net tuition revenue at bachelor’s/master’s institutions was only related to number of faculty members (p = 0.05) and international student enrollment over time (p = 0.05). These results suggest international students may prefer larger, research-intensive institutions over smaller, less research-intensive institutions, while larger, research intensive institutions drive more net tuition revenue through international student enrollment than do smaller, less research-intensive institutions.
Bruhn (2016) built upon Cantwell’s (2015) work, learning that institutions often view international students as important streams of revenue and sources of cultural knowledge for U.S. students, outweighing the costs of recruiting and supporting these students through education agencies and recruitment fairs, international
Bicak & Taylor, 2020
Journal of Educational Research and Practice 224
student services offices, and English language support programs. However, Bruhn’s (2016) study did not specifically identify institutional characteristics that drive international student enrollment, nor did the study employ quantitative methods to generalize the findings across multiple institution types in the United States.
At the two-year institution level, Bohman (2009) interviewed international students choosing to study in community colleges, asserting that these students preferred to enroll in community colleges that charged lower tuition rates and had lower entrance requirements, such as not requiring standardized test scores or having lower English language proficiency thresholds for conditional or unconditional admission. Building from these findings, Bohman learned international students viewed community colleges as cost-effective institutions to improve their English fluency and save money, in hopes of transferring to a four-year institution in the future. Yet, Bohman only found that the presence of transfer agreements between two- and four-year institutions was an important institutional characteristic to inform international student choice of four-year institutions: Bohman did not explore these students’ preferences for four-year institutions and which four-year institutional characteristics are important to consider when planning to transfer beyond the presence of transfer and/or articulation agreements. Finally, international students informed Bohman that institutional support services were critical when informing student choice, as housing, transportation, and language services were helpful for international students during their transition period from their home country to the United States.
In a later study, Bohman (2014) affirmed his earlier (2009) findings and learned international student services, such as dedicated international student services offices at community colleges, were an important factor driving international students toward specific two-year institutions. Similarly, Zhang & Hagedorn (2018) reasoned that international students use community colleges as a way of accessing four-year institutions, while international student support services are important institutional factors to attract international students to community colleges and other two-year institutions.
Ultimately, four-year institutional characteristics such as overall student enrollment, number of faculty members, (Cantwell, 2015), cost of tuition, and international student support services (Bodycott, 2009; Darby, 2015) have been found to be important factors of international student enrollment in four-year U.S. institutions of higher education, as well as the quality of international student websites (Taylor & Bicak, 2018, 2019). However, these studies have been limited to public institutions or small, qualitative sample sizes which may not be generalizable to larger numbers and types of U.S. institutions over long periods of time. As a result, we seek to move beyond the limitations of these aforementioned studies and analyze institutional characteristics driving international student enrollment in four-year U.S. institutions.
Methods The following sections will explain how we selected variables, statistical models, and addressed limitations in the study.
Selection of Variables
We employed the Integrated Postsecondary Education Data System for this study, using data from academic years 2012–2013 through 2016–2017, including full institutional enrollment data from 2017. Cantwell’s (2015) foundational study used Carnegie classification, institutional aid, state appropriations, total graduate students, total in-state students, total out-of-state students, number of faculty members, and international student enrollment over time to predict how international student enrollment affected the net tuition revenue raised by public institutions. We also use these variables, with the exception of number of faculty members, total in-state students, and total graduate students. We instead use student-to-faculty ratio to better control
Bicak & Taylor, 2020
Journal of Educational Research and Practice 225
for institutional size and institutional resources, as larger institutions by enrollment or endowment may be able to staff larger numbers of faculty members.
Time invariant variables included in this study’s fixed and random effects models are Carnegie classification (very high research, high research, doctoral institutions, master’s institutions, and bachelor’s institutions), sector (public, private non-profit, private for-profit), and geographic location (urban, suburban, and rural). Time varying variables in the models include student services expenses per FTE, instruction expenses per FTE, academic support expenses per FTE, published out-of-state tuition and fees, average amount of institutional aid awarded to full-time first-time undergraduates, undergraduate admission rate (as a proxy for institutional selectivity and perceived quality), endowment assets for public and private non-profit institutions (per FTE), revenues from state appropriations for public institutions (per FTE), revenues from tuition and fees (per FTE), student-to-faculty ratio, and out-of-state enrollment (total number of first-time undergraduates). Total undergraduate enrollment was not used, as this figure was highly collinear with total number of first-time undergraduates from out-of-state, and Li’s (2017) study found total out-of-state students was highly predictive of international student enrollment.
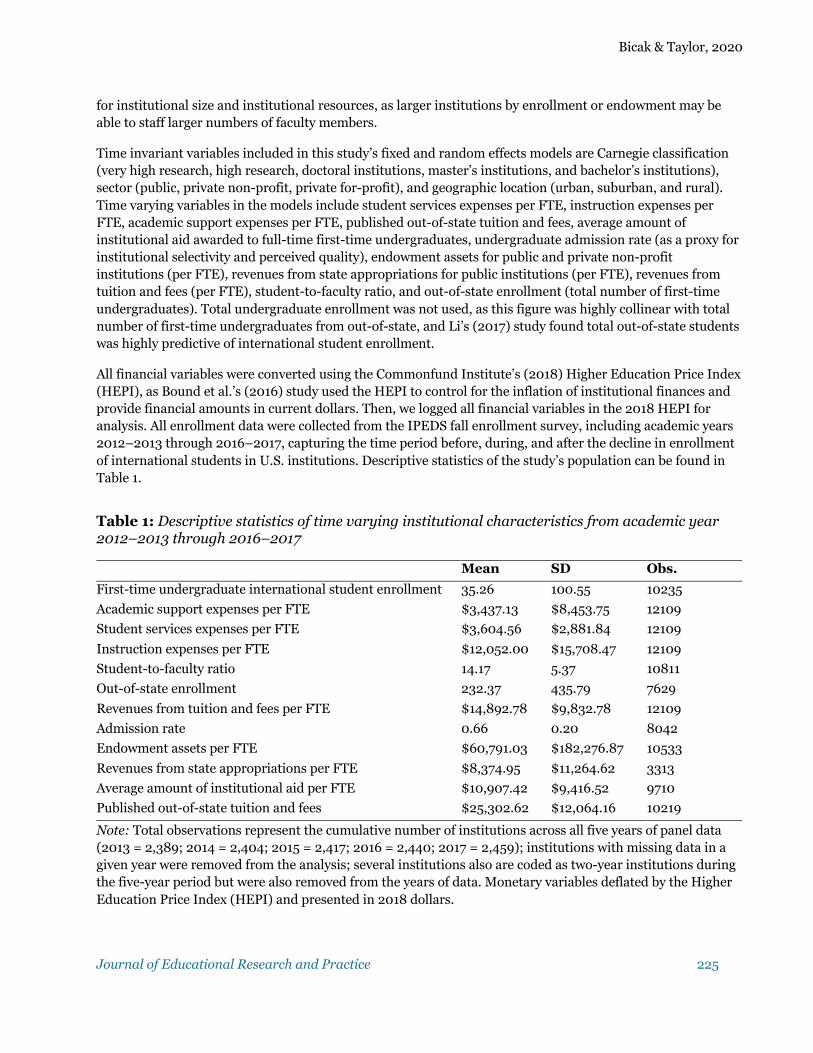
All financial variables were converted using the Commonfund Institute’s (2018) Higher Education Price Index (HEPI), as Bound et al.’s (2016) study used the HEPI to control for the inflation of institutional finances and provide financial amounts in current dollars. Then, we logged all financial variables in the 2018 HEPI for analysis. All enrollment data were collected from the IPEDS fall enrollment survey, including academic years 2012–2013 through 2016–2017, capturing the time period before, during, and after the decline in enrollment of international students in U.S. institutions. Descriptive statistics of the study’s population can be found in Table 1.
Table 1: Descriptive statistics of time varying institutional characteristics from academic year 2012–2013 through 2016–2017
Mean SD Obs.
First-time undergraduate international student enrollment 35.26 100.55 10235
Academic support expenses per FTE $3,437.13 $8,453.75 12109
Student services expenses per FTE $3,604.56 $2,881.84 12109
Instruction expenses per FTE $12,052.00 $15,708.47 12109
Student-to-faculty ratio 14.17 5.37 10811
Out-of-state enrollment 232.37 435.79 7629
Revenues from tuition and fees per FTE $14,892.78 $9,832.78 12109
Admission rate 0.66 0.20 8042
Endowment assets per FTE $60,791.03 $182,276.87 10533
Revenues from state appropriations per FTE $8,374.95 $11,264.62 3313
Average amount of institutional aid per FTE $10,907.42 $9,416.52 9710
Published out-of-state tuition and fees $25,302.62 $12,064.16 10219
Note: Total observations represent the cumulative number of institutions across all five years of panel data (2013 = 2,389; 2014 = 2,404; 2015 = 2,417; 2016 = 2,440; 2017 = 2,459); institutions with missing data in a given year were removed from the analysis; several institutions also are coded as two-year institutions during the five-year period but were also removed from the years of data. Monetary variables deflated by the Higher Education Price Index (HEPI) and presented in 2018 dollars.
Bicak & Taylor, 2020
Journal of Educational Research and Practice 226
Detailed descriptive statistics by institutional sector, Carnegie classification, and geographic location can be found in the online appendices of this study.
Analytical Approach
Working with five-year panel data, the research team needed to decide whether to use fixed-effects, random-effects, or pooled ordinary least squares (OLS) models. As the purpose of this study was to predict international enrollment using time-varying and time-invariant institutional characteristics, the research team faced a complicated situation in terms of deciding which model(s) best fit the available data and the purpose of the study.
Considering time-varying institutional characteristics, the research team could use a random effects model, fixed effects model, or pooled OLS regression, while with time-invariant institutional characteristics, the team was limited to only a random effects model or pooled OLS regression (Torres-Reyna, 2007). To explore the most appropriate approach, the research team performed a Breusch-Pagan Lagrange multiplier (LM) test to determine the most appropriate model between random effects and an OLS regression for time-invariant and time varying variables. The Breusch-Pagan Lagrange multiplier LM test evaluated the heteroskedasticity of the data (Prob>chi = 0.000) and found that there was significant difference across institutions. Results of the LM test suggested that the research team use a random effects model over a pooled OLS regression.
To explore whether to use random or fixed effects, the research team performed a Hausman test to determine the most appropriate model given the time varying institutional characteristics in the dataset (Hausman, 1978). The results of the Hausman test result suggested (Prob>chi = 0.000) that the research team should use fixed effects over random effects with time varying variables. From the results of the aforementioned tests and the data available, the research team decided upon three fixed effects models and one random effects model using robust standard errors to best understand time varying and time invariant institutional characteristics which predict international student enrollment in four-year U.S. institutions.
This study’s fixed effects models included time varying institutional characteristics by institutional sector (Table 3), geographic location (Tables 4, 5, and 6), and Carnegie classification (Table 7):
!it ="1Xit + #i +%t + &it (1)
The random effects model (Table 8) included all time varying and invariant variables:
!it = "0 + "1Xit + "2Zit+ #i +%t + &it. (2)
The outcome variable of interest—"it —represents an institution i’s first-time undergraduate international enrollment in a given year (t). Xit represents institution i’s time-varying characteristics (such as student services expenses per FTE) in a given year (t). Institutional fixed effects (#i) takes into account all time-varying and time invariant institutional characteristics within the institutions. Zit represents institution i’s time invariant characteristics (such as geographic location) in a given year (t) in the equation 2. $t represents time dummy variables, which control for unobserved events that may affect international student enrollment over the time (such as the 2016 U.S. Presidential Election; see Redden, 2018). %it is the error term.
Fixed effects models are commonly used with panel data to control for unobserved variables, with individual specific effects being correlated with independent variables, thus holding constant the average effects for a given time invariant variable. Cantwell’s (2015) study used two separate fixed effects models for research/doctoral institutions and bachelor’s/master’s institutions. To provide a more robust, rigorous analysis of institutional characteristics to predict international student enrollment, the research team decided to explore this enrollment through the fixed effects of institutional sector, Carnegie classification (see

Bicak & Taylor, 2020
Journal of Educational Research and Practice 227
Cantwell), and geographic location. By adopting a multiple fixed effects approach, this study provides the most comprehensive evaluation of institutional characteristics known to predict international student enrollment in four-year U.S. institutions of higher education.
Finally, the research team decided to also include a random effects model to capture all time varying and time invariant variables in our study, thus providing ample opportunity to evaluate and discuss differences in international student enrollment trends across different institutional sectors, Carnegie classifications, and geographic locations across an important time period in U.S. higher education: academic years 2012–2013 through 2016–2017, the years in which international student enrollment peaked (2015) and began a two-year decline (Institute of International Education, 2018). By adopting a random effects approach in our final model, we were able to include all time invariant variables alongside time varying variables, treating all variables as random effects (Torres-Reyna, 2007) which could predict international student enrollment. This random-effects model allowed the research team to examine intra-institutional differences when predicting international student enrollment, assuming no fixed effects by institutional sector, Carnegie classification, and geographic location.
Limitations
As the largest quantitative study of four-year U.S. institutional characteristics predicting international student enrollment to date, this study is primarily limited by the time frame of the data. We capture 2012–2013 through 2016–2017 institutional IPEDS data, yet international student enrollment in U.S. institutions may continue to fluctuate in certain institutional sectors, across Carnegie classifications, and geographic regions of the United States. In addition, we only examine four-year institutions of higher education, yet extant research has suggested two-year institutions are attractive to prospective international students for a variety of reasons (Bohman, 2009, 2014; Zhang & Hagedorn, 2018).
However, given the current sociopolitical climate of the United States and the real or perceived anti-immigration sentiment in the country (Redden, 2018; Torbati, 2018), it was important to evaluate institutional characteristics which predict—or do not predict—international student enrollment at four-year U.S. institutions of higher education. The research team hopes that this timely analysis serves as a catalyst for further research into the decision making and enrollment choices of international students seeking higher education in the U.S. Ideally, this work can inform institutional leadership and policymakers to provide the most nurturing and supportive educational environment for a valuable and important cohort of postsecondary students in the United States.
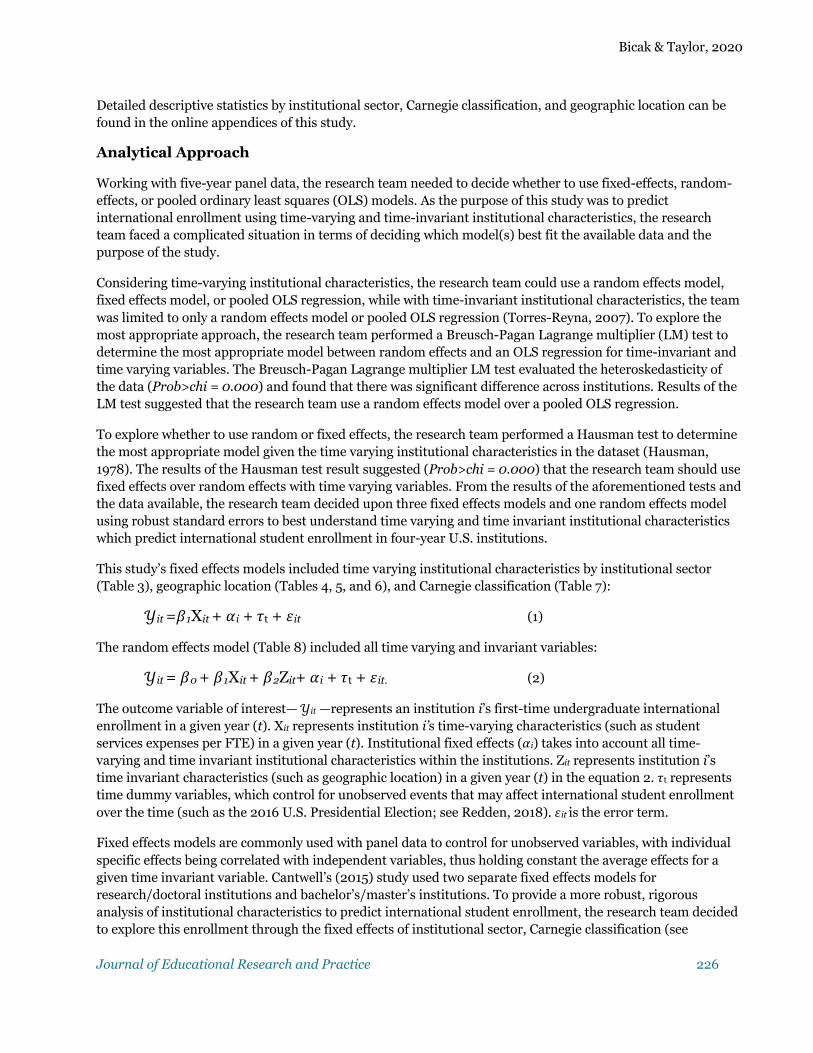
Results Descriptive statistics of first-time international undergraduate student enrollment by institutional sector, Carnegie classification, and geographic location from 2013 to 2017 can be found in Table 2.
Results from Table 2 suggest average fall first-time undergraduate freshmen international student enrollment (ISE) has increased over time at bachelor’s institutions 2017 (11.58 students in fall 2013 to 15.58 students in fall 2017) and very high research institutions (256.26 students in fall 2013 to 293.72 students in fall 2017), while new ISE has remained steady or has slightly declined over the same time period at all other Carnegie classified institutions. Regarding sector, public institutions experienced the sharpest drop in ISE between fall 2016 and fall 2017 (68.53 students to 63.2 students), while ISE slightly rose at private non-profit and private for-profit institutions during the same time period. ISE enrollment has also increased between fall 2013 and fall 2017 at institutions in urban settings and suburban settings, while ISE enrollment has declined at institutions in town/rural settings over the same time period.
Bicak & Taylor, 2020
Journal of Educational Research and Practice 228
Table 2: Descriptive statistics for average fall first-time undergraduate freshmen international student enrollment (ISE) from Fall 2013 to 2017 by institutional characteristics
Average ISE, 2013–2017
Fall 2013 ISE
Fall 2014 ISE
Fall 2015 ISE
Fall 2016 ISE
Fall 2017 ISE
Mean SD Mean SD Mean SD Mean SD Mean SD Mean SD Carnegie, 2005/2010
Bachelor's 13.9 40.2 11.6 31.7 13.1 37.0 13.6 38.3 15.4 45.1 15.6 46.5
Master’s 22.6 39.7 21.4 38.0 22.6 39.8 24.0 41.4 23.2 41.5 21.5 37.4
Doctoral 43.2 65.9 41.9 61.5 44.4 65.3 44.6 65.9 45.2 70.2 39.9 67.9
Research, high 91.5 92.7 87.2 91.5 93.5 94.1 97.6 92.7 91.6 92.4 87.4 94.1
Research, very high 284.7 294.7 256.3 270.4 276.8 287.7 294.5 310.5 302.2 306.0 293.7 300.4
Sector
Public 64.5 149.6 59.2 138.3 63.8 146.6 67.5 156.7 68.5 156.0 63.2 149.6
Private non-profit 25.2 65.8 23.4 59.5 25.3 64.8 25.8 66.5 25.6 67.6 25.7 70.2
Private for-profit 5.0 25.2 4.5 21.7 4.3 24.1 5.5 27.0 5.2 27.7 5.7 25.4
Location
Urban 49.7 128.1 45.3 118.1 49.1 125.2 51.1 131.7 52.4 135.5 50.4 129.5
Suburban 27.6 77.6 24.6 67.1 27.0 76.6 28.0 81.7 28.6 75.0 29.5 86.2
Town/rural 14.1 25.9 13.4 20.3 14.0 22.3 15.6 32.3 14.4 27.2 13.1 25.6
Bicak & Taylor, 2020
Journal of Educational Research and Practice 229
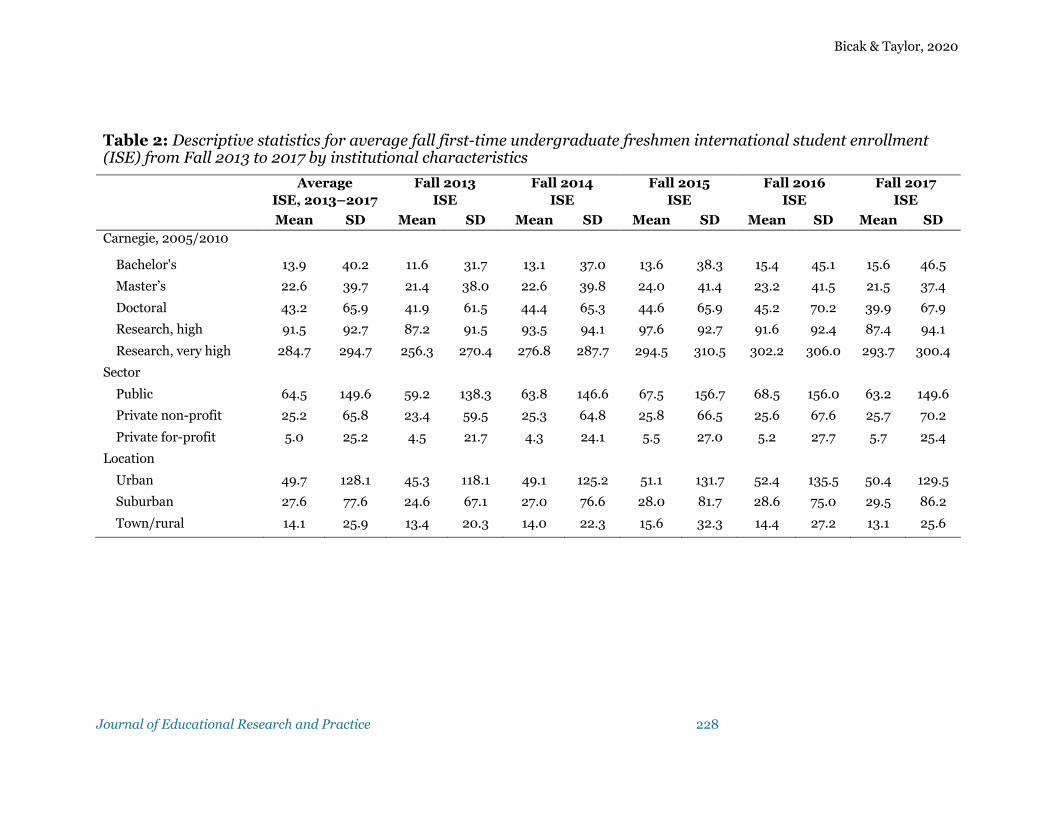
Fixed effects models predicting fall first-time undergraduate freshmen international student enrollment (ISE) by institutional sector can be found in Table 3.
Table 3: Fixed Effects Models Predicting Fall First-Time Undergraduate Freshmen International Student Enrollment, by Institutional Sector
Public institutions
Private non-profit institutions
Private for-profit institutions
Student services expenses per FTE 0.046 0.024 0.010 (0.138) (0.046) (0.019) Academic support expenses per FTE 0.210 -0.092 -0.016 (0.130) (0.047) (0.076) Instruction expenses per FTE -0.118 -0.112 0.239 (0.202) (0.140) (0.177) Student-to-faculty ratio 0.014 0.013 -0.006 (0.014) (0.011) (0.011) Out-of-state enrollment 0.128* 0.097* 0.083 (0.050) (0.045) (0.065) Average amount of institutional aid 0.083 0.073 -0.007 (0.079) (0.062) (0.040) Published out-of-state tuition and fees -0.009 0.052 0.312 (0.227) (0.258) (0.777) Revenues from tuition and fees -0.398 0.100 -0.167 (0.234) (0.108) (0.293) Undergraduate admission rate -0.007 0.053 -0.862 (0.234) (0.131) (0.738) Endowment assets 0.028* 0.006 (0.012) (0.014) Revenues from state appropriations 0.058 (0.046) Year (reference = 2015) 2013 -0.151*** -0.081* 0.203 (0.038) (0.035) (0.678) 2014 -0.080* 0.011 0.049 (0.028) (0.028) (0.109) 2016 -0.028 -0.019 0.137 (0.029) (0.028) (0.130) 2017 -0.106* -0.053 0.128 (0.036) (0.032) (0.150) Constant 3.594 0.806 -2.152 (3.018) (2.754) (6.181) Observations 2,248 3,471 221 R-squared 0.031 0.010 0.129 Number of universities 506 1,023 81 Note: Robust standard errors in parentheses; 2015 data used as reference group; *** p <0.001, * p <0.01, * p <0.05
Bicak & Taylor, 2020
Journal of Educational Research and Practice 230
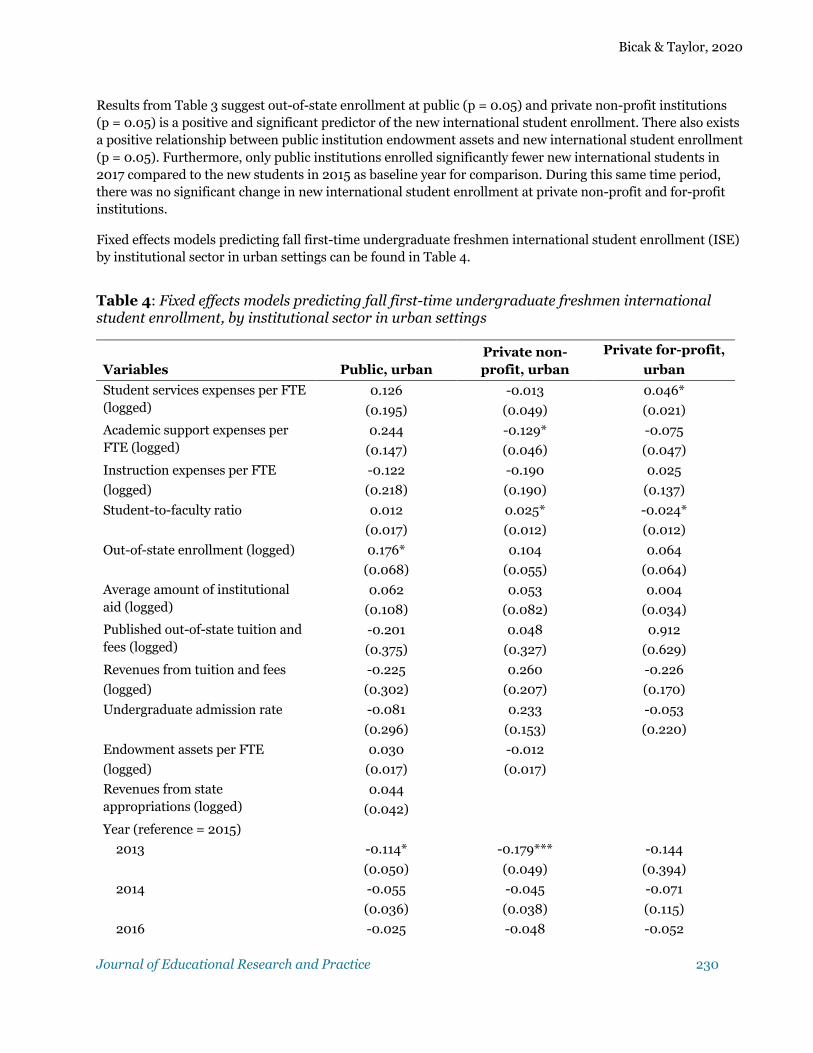
Results from Table 3 suggest out-of-state enrollment at public (p = 0.05) and private non-profit institutions (p = 0.05) is a positive and significant predictor of the new international student enrollment. There also exists a positive relationship between public institution endowment assets and new international student enrollment (p = 0.05). Furthermore, only public institutions enrolled significantly fewer new international students in 2017 compared to the new students in 2015 as baseline year for comparison. During this same time period, there was no significant change in new international student enrollment at private non-profit and for-profit institutions.
Fixed effects models predicting fall first-time undergraduate freshmen international student enrollment (ISE) by institutional sector in urban settings can be found in Table 4.
Table 4: Fixed effects models predicting fall first-time undergraduate freshmen international student enrollment, by institutional sector in urban settings
Variables
Public, urban Private non-profit, urban
Private for-profit,
urban
Student services expenses per FTE (logged)
0.126
(0.195)
-0.013
(0.049)
0.046*
(0.021)
Academic support expenses per FTE (logged)
0.244
(0.147)
-0.129*
(0.046)
-0.075
(0.047)
Instruction expenses per FTE -0.122 -0.190 0.025
(logged) (0.218) (0.190) (0.137)
Student-to-faculty ratio 0.012 0.025* -0.024*
(0.017) (0.012) (0.012)
Out-of-state enrollment (logged) 0.176* 0.104 0.064
(0.068) (0.055) (0.064)
Average amount of institutional aid (logged)
0.062
(0.108)
0.053
(0.082)
0.004
(0.034)
Published out-of-state tuition and fees (logged)
-0.201
(0.375)
0.048
(0.327)
0.912
(0.629)
Revenues from tuition and fees -0.225 0.260 -0.226
(logged) (0.302) (0.207) (0.170)
Undergraduate admission rate -0.081 0.233 -0.053
(0.296) (0.153) (0.220)
Endowment assets per FTE 0.030 -0.012
(logged) (0.017) (0.017)
Revenues from state appropriations (logged)
0.044
(0.042)
Year (reference = 2015)
2013 -0.114* -0.179*** -0.144
(0.050) (0.049) (0.394)
2014 -0.055 -0.045 -0.071
(0.036) (0.038) (0.115)
2016 -0.025 -0.048 -0.052
Bicak & Taylor, 2020
Journal of Educational Research and Practice 231
(0.038) (0.038) (0.112)
2017 -0.060 -0.109* 0.001
(0.043) (0.037) (0.126)
Constant 3.690 0.968 -5.593
(4.081) (3.221) (6.255)
Observations 1,122 1,656 144
R-squared 0.042 0.030 0.213
Number of universities 251 488 51 Notes: Robust standard errors in parentheses; *** p<0.001, * p<0.01, * p<0.05
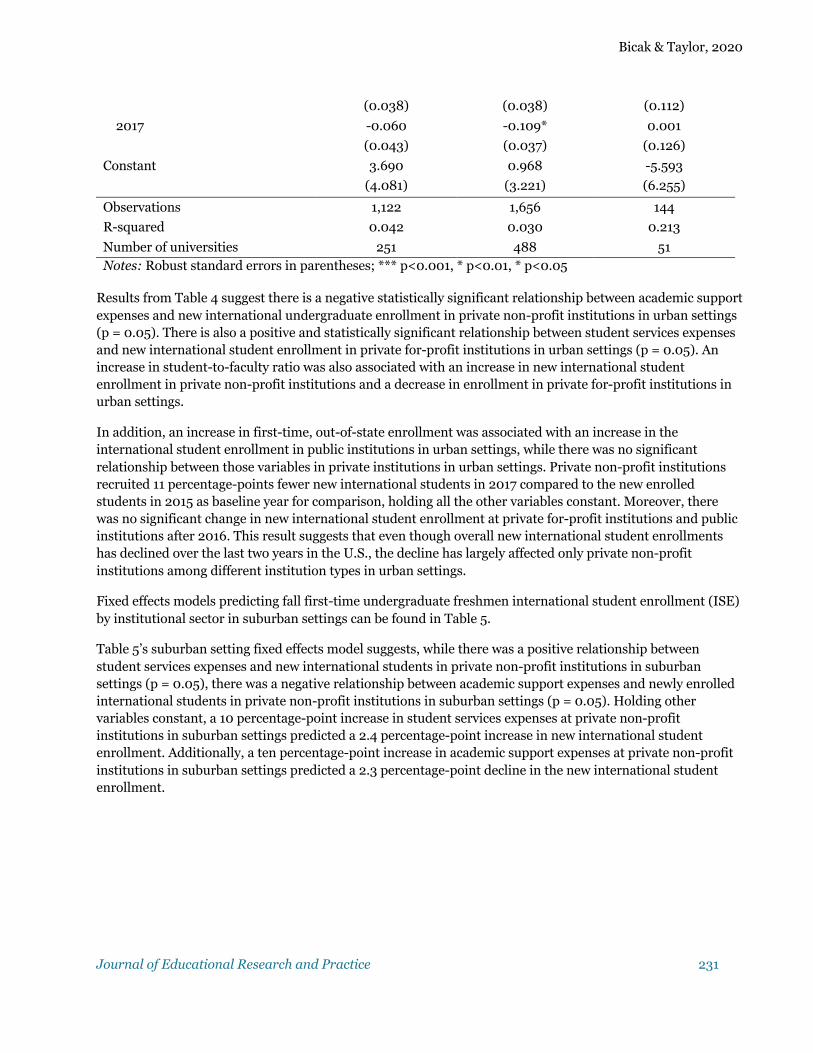
Results from Table 4 suggest there is a negative statistically significant relationship between academic support expenses and new international undergraduate enrollment in private non-profit institutions in urban settings (p = 0.05). There is also a positive and statistically significant relationship between student services expenses and new international student enrollment in private for-profit institutions in urban settings (p = 0.05). An increase in student-to-faculty ratio was also associated with an increase in new international student enrollment in private non-profit institutions and a decrease in enrollment in private for-profit institutions in urban settings.
In addition, an increase in first-time, out-of-state enrollment was associated with an increase in the international student enrollment in public institutions in urban settings, while there was no significant relationship between those variables in private institutions in urban settings. Private non-profit institutions recruited 11 percentage-points fewer new international students in 2017 compared to the new enrolled students in 2015 as baseline year for comparison, holding all the other variables constant. Moreover, there was no significant change in new international student enrollment at private for-profit institutions and public institutions after 2016. This result suggests that even though overall new international student enrollments has declined over the last two years in the U.S., the decline has largely affected only private non-profit institutions among different institution types in urban settings.
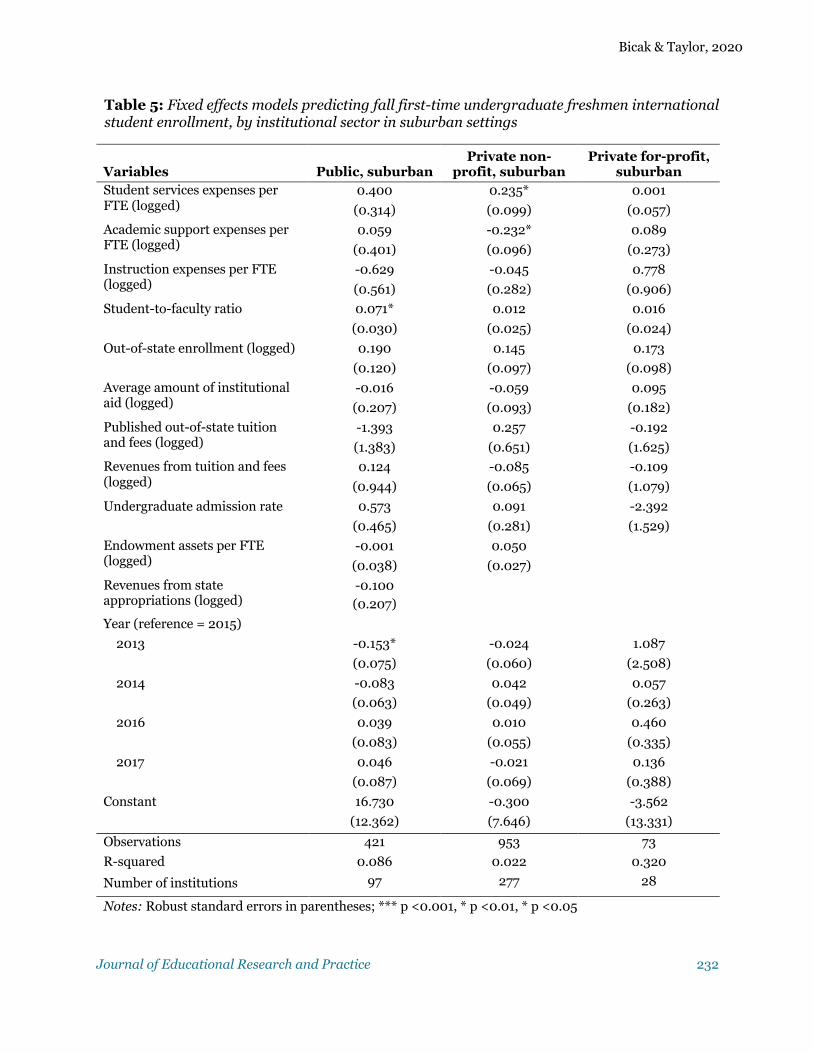
Fixed effects models predicting fall first-time undergraduate freshmen international student enrollment (ISE) by institutional sector in suburban settings can be found in Table 5.
Table 5’s suburban setting fixed effects model suggests, while there was a positive relationship between student services expenses and new international students in private non-profit institutions in suburban settings (p = 0.05), there was a negative relationship between academic support expenses and newly enrolled international students in private non-profit institutions in suburban settings (p = 0.05). Holding other variables constant, a 10 percentage-point increase in student services expenses at private non-profit institutions in suburban settings predicted a 2.4 percentage-point increase in new international student enrollment. Additionally, a ten percentage-point increase in academic support expenses at private non-profit institutions in suburban settings predicted a 2.3 percentage-point decline in the new international student enrollment.
Bicak & Taylor, 2020
Journal of Educational Research and Practice 232
Table 5: Fixed effects models predicting fall first-time undergraduate freshmen international student enrollment, by institutional sector in suburban settings
Variables
Public, suburban Private non-
profit, suburban Private for-profit,
suburban Student services expenses per FTE (logged)
0.400 0.235* 0.001
(0.314) (0.099) (0.057)
Academic support expenses per FTE (logged)
0.059 -0.232* 0.089
(0.401) (0.096) (0.273)
Instruction expenses per FTE (logged)
-0.629 -0.045 0.778
(0.561) (0.282) (0.906)
Student-to-faculty ratio 0.071* 0.012 0.016
(0.030) (0.025) (0.024)
Out-of-state enrollment (logged) 0.190 0.145 0.173
(0.120) (0.097) (0.098)
Average amount of institutional aid (logged)
-0.016 -0.059 0.095
(0.207) (0.093) (0.182)
Published out-of-state tuition and fees (logged)
-1.393 0.257 -0.192
(1.383) (0.651) (1.625)
Revenues from tuition and fees (logged)
0.124 -0.085 -0.109
(0.944) (0.065) (1.079)
Undergraduate admission rate 0.573 0.091 -2.392
(0.465) (0.281) (1.529)
Endowment assets per FTE (logged)
-0.001 0.050
(0.038) (0.027)
Revenues from state appropriations (logged)
-0.100 (0.207)
Year (reference = 2015)
2013 -0.153* -0.024 1.087
(0.075) (0.060) (2.508)
2014 -0.083 0.042 0.057
(0.063) (0.049) (0.263)
2016 0.039 0.010 0.460
(0.083) (0.055) (0.335)
2017 0.046 -0.021 0.136
(0.087) (0.069) (0.388)
Constant 16.730 -0.300 -3.562
(12.362) (7.646) (13.331)
Observations 421 953 73
R-squared 0.086 0.022 0.320
Number of institutions 97 277 28
Notes: Robust standard errors in parentheses; *** p <0.001, * p <0.01, * p <0.05
Bicak & Taylor, 2020
Journal of Educational Research and Practice 233
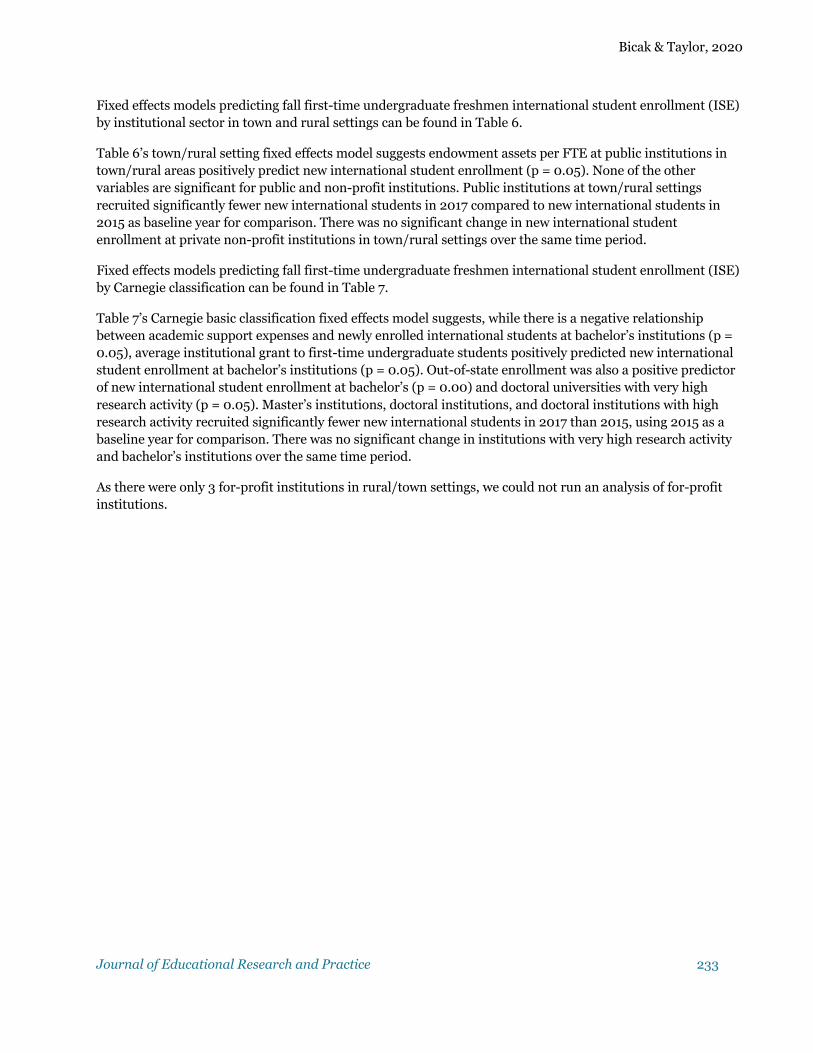
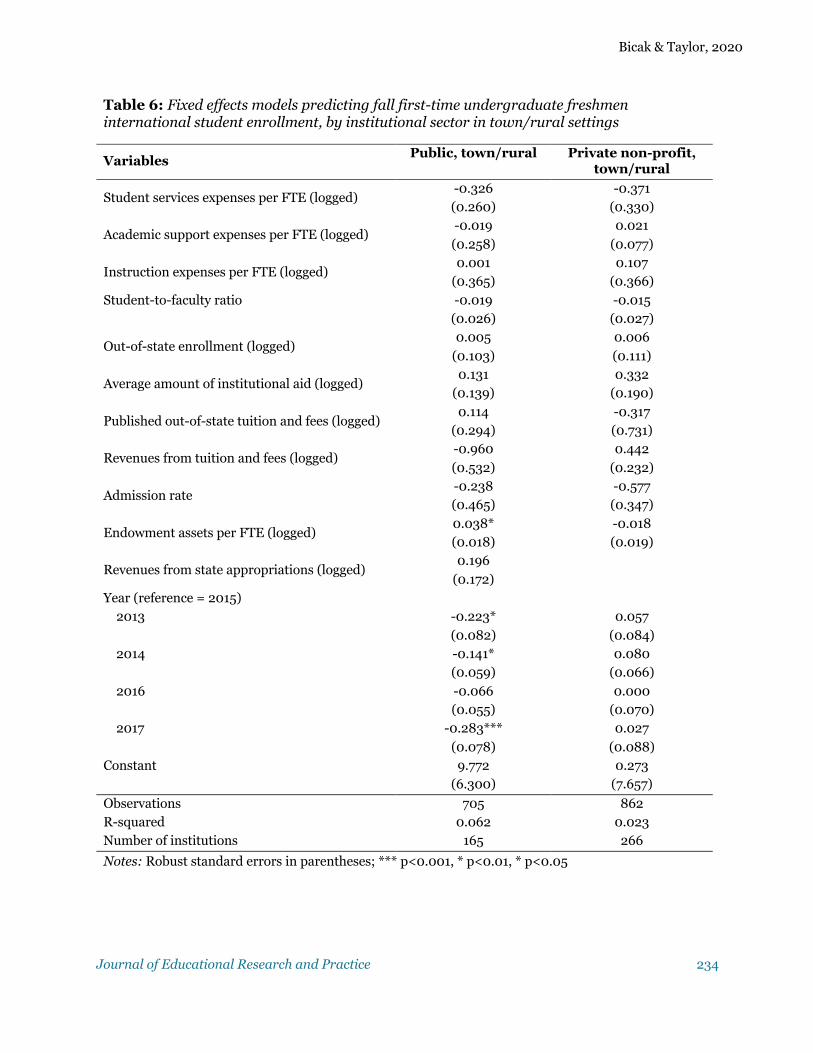
Fixed effects models predicting fall first-time undergraduate freshmen international student enrollment (ISE) by institutional sector in town and rural settings can be found in Table 6.
Table 6’s town/rural setting fixed effects model suggests endowment assets per FTE at public institutions in town/rural areas positively predict new international student enrollment (p = 0.05). None of the other variables are significant for public and non-profit institutions. Public institutions at town/rural settings recruited significantly fewer new international students in 2017 compared to new international students in 2015 as baseline year for comparison. There was no significant change in new international student enrollment at private non-profit institutions in town/rural settings over the same time period.
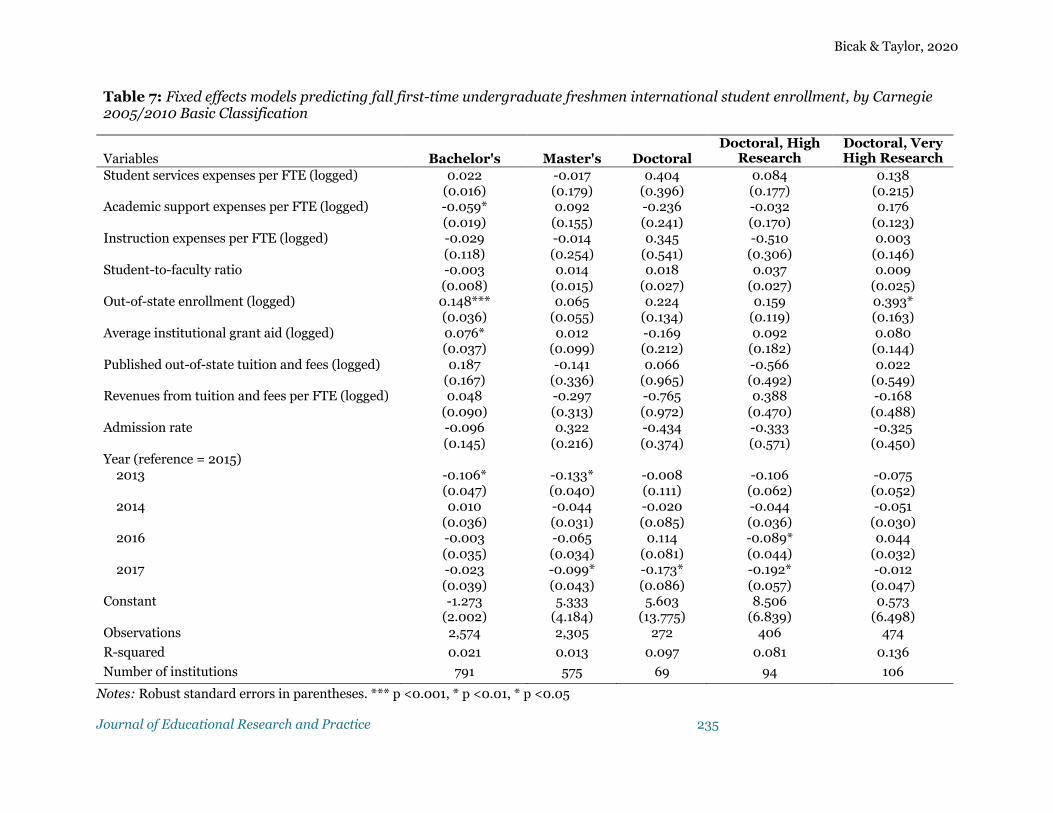
Fixed effects models predicting fall first-time undergraduate freshmen international student enrollment (ISE) by Carnegie classification can be found in Table 7.
Table 7’s Carnegie basic classification fixed effects model suggests, while there is a negative relationship between academic support expenses and newly enrolled international students at bachelor’s institutions (p = 0.05), average institutional grant to first-time undergraduate students positively predicted new international student enrollment at bachelor’s institutions (p = 0.05). Out-of-state enrollment was also a positive predictor of new international student enrollment at bachelor’s (p = 0.00) and doctoral universities with very high research activity (p = 0.05). Master’s institutions, doctoral institutions, and doctoral institutions with high research activity recruited significantly fewer new international students in 2017 than 2015, using 2015 as a baseline year for comparison. There was no significant change in institutions with very high research activity and bachelor’s institutions over the same time period.
As there were only 3 for-profit institutions in rural/town settings, we could not run an analysis of for-profit institutions.
Bicak & Taylor, 2020
Journal of Educational Research and Practice 234
Table 6: Fixed effects models predicting fall first-time undergraduate freshmen international student enrollment, by institutional sector in town/rural settings
Variables Public, town/rural Private non-profit,
town/rural
Student services expenses per FTE (logged) -0.326 -0.371 (0.260) (0.330)
Academic support expenses per FTE (logged) -0.019 0.021 (0.258) (0.077)
Instruction expenses per FTE (logged) 0.001 0.107
(0.365) (0.366) Student-to-faculty ratio -0.019 -0.015 (0.026) (0.027)
Out-of-state enrollment (logged) 0.005 0.006
(0.103) (0.111)
Average amount of institutional aid (logged) 0.131 0.332
(0.139) (0.190)
Published out-of-state tuition and fees (logged) 0.114 -0.317
(0.294) (0.731)
Revenues from tuition and fees (logged) -0.960 0.442 (0.532) (0.232)
Admission rate -0.238 -0.577 (0.465) (0.347)
Endowment assets per FTE (logged) 0.038* -0.018 (0.018) (0.019)
Revenues from state appropriations (logged) 0.196
(0.172) Year (reference = 2015) 2013 -0.223* 0.057 (0.082) (0.084) 2014 -0.141* 0.080 (0.059) (0.066) 2016 -0.066 0.000 (0.055) (0.070) 2017 -0.283*** 0.027 (0.078) (0.088) Constant 9.772 0.273 (6.300) (7.657)
Observations 705 862 R-squared 0.062 0.023 Number of institutions 165 266
Notes: Robust standard errors in parentheses; *** p<0.001, * p<0.01, * p<0.05
Bicak & Taylor, 2020
Journal of Educational Research and Practice 235
Table 7: Fixed effects models predicting fall first-time undergraduate freshmen international student enrollment, by Carnegie 2005/2010 Basic Classification
Variables
Bachelor's
Master's
Doctoral
Doctoral, High Research
Doctoral, Very High Research
Student services expenses per FTE (logged) 0.022 (0.016)
-0.017 (0.179)
0.404 (0.396)
0.084 (0.177)
0.138 (0.215)
Academic support expenses per FTE (logged) -0.059* (0.019)
0.092 (0.155)
-0.236 (0.241)
-0.032 (0.170)
0.176 (0.123)
Instruction expenses per FTE (logged) -0.029 (0.118)
-0.014 (0.254)
0.345 (0.541)
-0.510 (0.306)
0.003 (0.146)
Student-to-faculty ratio -0.003 (0.008)
0.014 (0.015)
0.018 (0.027)
0.037 (0.027)
0.009 (0.025)
Out-of-state enrollment (logged) 0.148*** (0.036)
0.065 (0.055)
0.224 (0.134)
0.159 (0.119)
0.393* (0.163)
Average institutional grant aid (logged) 0.076* (0.037)
0.012 (0.099)
-0.169 (0.212)
0.092 (0.182)
0.080 (0.144)
Published out-of-state tuition and fees (logged) 0.187 (0.167)
-0.141 (0.336)
0.066 (0.965)
-0.566 (0.492)
0.022 (0.549)
Revenues from tuition and fees per FTE (logged) 0.048 (0.090)
-0.297 (0.313)
-0.765 (0.972)
0.388 (0.470)
-0.168 (0.488)
Admission rate -0.096 (0.145)
0.322 (0.216)
-0.434 (0.374)
-0.333 (0.571)
-0.325 (0.450)
Year (reference = 2015) 2013 -0.106*
(0.047) -0.133* (0.040)
-0.008 (0.111)
-0.106 (0.062)
-0.075 (0.052)
2014 0.010 (0.036)
-0.044 (0.031)
-0.020 (0.085)
-0.044 (0.036)
-0.051 (0.030)
2016 -0.003 (0.035)
-0.065 (0.034)
0.114 (0.081)
-0.089* (0.044)
0.044 (0.032)
2017 -0.023 (0.039)
-0.099* (0.043)
-0.173* (0.086)
-0.192* (0.057)
-0.012 (0.047)
Constant -1.273 (2.002)
5.333 (4.184)
5.603 (13.775)
8.506 (6.839)
0.573 (6.498)
Observations 2,574 2,305 272 406 474
R-squared 0.021 0.013 0.097 0.081 0.136
Number of institutions 791 575 69 94 106
Notes: Robust standard errors in parentheses. *** p <0.001, * p <0.01, * p <0.05
Bicak & Taylor, 2020
Journal of Educational Research and Practice 236
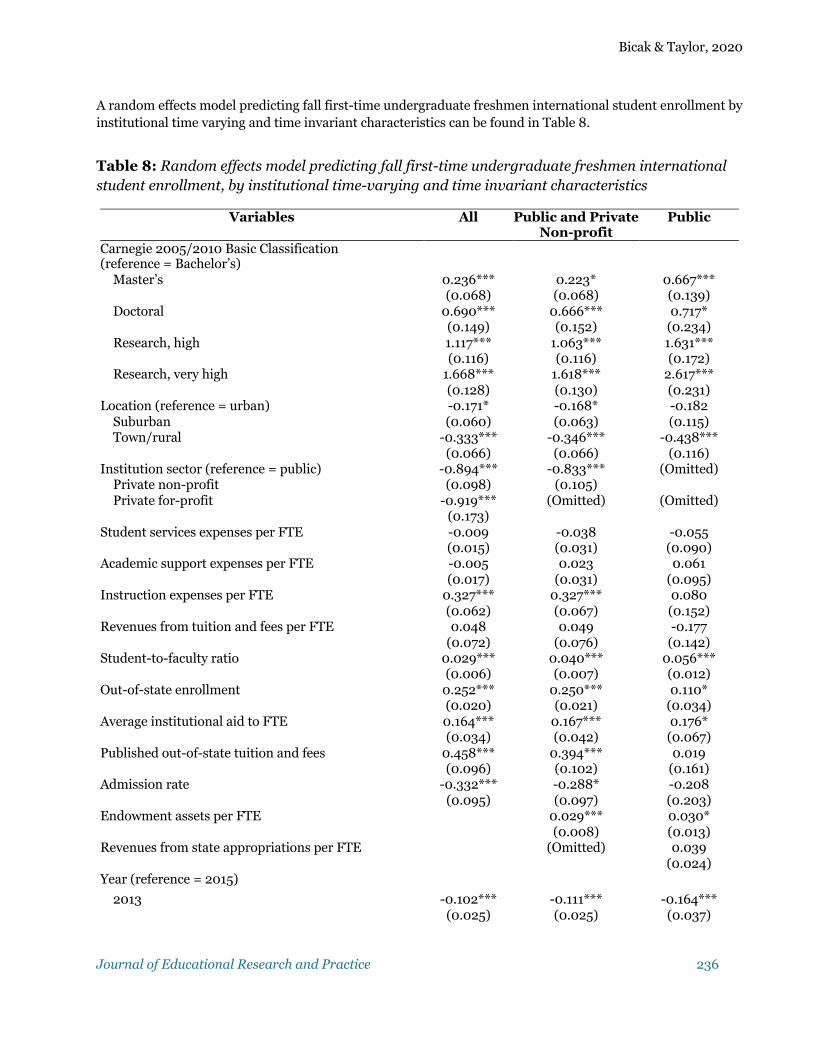
A random effects model predicting fall first-time undergraduate freshmen international student enrollment by institutional time varying and time invariant characteristics can be found in Table 8.
Table 8: Random effects model predicting fall first-time undergraduate freshmen international student enrollment, by institutional time-varying and time invariant characteristics
Variables All Public and Private Non-profit
Public
Carnegie 2005/2010 Basic Classification (reference = Bachelor’s)
Master’s 0.236*** (0.068)
0.223* (0.068)
0.667*** (0.139)
Doctoral 0.690*** (0.149)
0.666*** (0.152)
0.717* (0.234)
Research, high 1.117*** (0.116)
1.063*** (0.116)
1.631*** (0.172)
Research, very high 1.668*** (0.128)
1.618*** (0.130)
2.617*** (0.231)
Location (reference = urban) Suburban
-0.171* (0.060)
-0.168* (0.063)
-0.182 (0.115)
Town/rural -0.333*** (0.066)
-0.346*** (0.066)
-0.438*** (0.116)
Institution sector (reference = public) Private non-profit
-0.894*** (0.098)
-0.833*** (0.105)
(Omitted)
Private for-profit -0.919*** (0.173)
(Omitted) (Omitted)
Student services expenses per FTE -0.009 (0.015)
-0.038 (0.031)
-0.055 (0.090)
Academic support expenses per FTE -0.005 (0.017)
0.023 (0.031)
0.061 (0.095)
Instruction expenses per FTE 0.327*** (0.062)
0.327*** (0.067)
0.080 (0.152)
Revenues from tuition and fees per FTE 0.048 (0.072)
0.049 (0.076)
-0.177 (0.142)
Student-to-faculty ratio 0.029*** (0.006)
0.040*** (0.007)
0.056*** (0.012)
Out-of-state enrollment 0.252*** (0.020)
0.250*** (0.021)
0.110* (0.034)
Average institutional aid to FTE 0.164*** (0.034)
0.167*** (0.042)
0.176* (0.067)
Published out-of-state tuition and fees 0.458*** (0.096)
0.394*** (0.102)
0.019 (0.161)
Admission rate -0.332*** (0.095)
-0.288* (0.097)
-0.208 (0.203)
Endowment assets per FTE 0.029*** (0.008)
0.030* (0.013)
Revenues from state appropriations per FTE (Omitted) 0.039 (0.024)
Year (reference = 2015)
2013 -0.102*** (0.025)
-0.111*** (0.025)
-0.164*** (0.037)
Bicak & Taylor, 2020
Journal of Educational Research and Practice 237
2014 -0.020 (0.020)
-0.026 (0.020)
-0.085* (0.028)
2016 -0.039* (0.020)
-0.043* (0.020)
-0.026 (0.029)
2017 -0.066* (0.024)
-0.072* (0.024)
-0.096* (0.037)
Constant -8.039*** (0.831)
-7.875*** (0.895)
-0.507 (1.812)
Observations 6,031 5,810 2,248
Number of institutions 1,635 1,555 506
Notes: Robust standard errors in parentheses; *** p <0.001, * p <0.01, * p <0.05
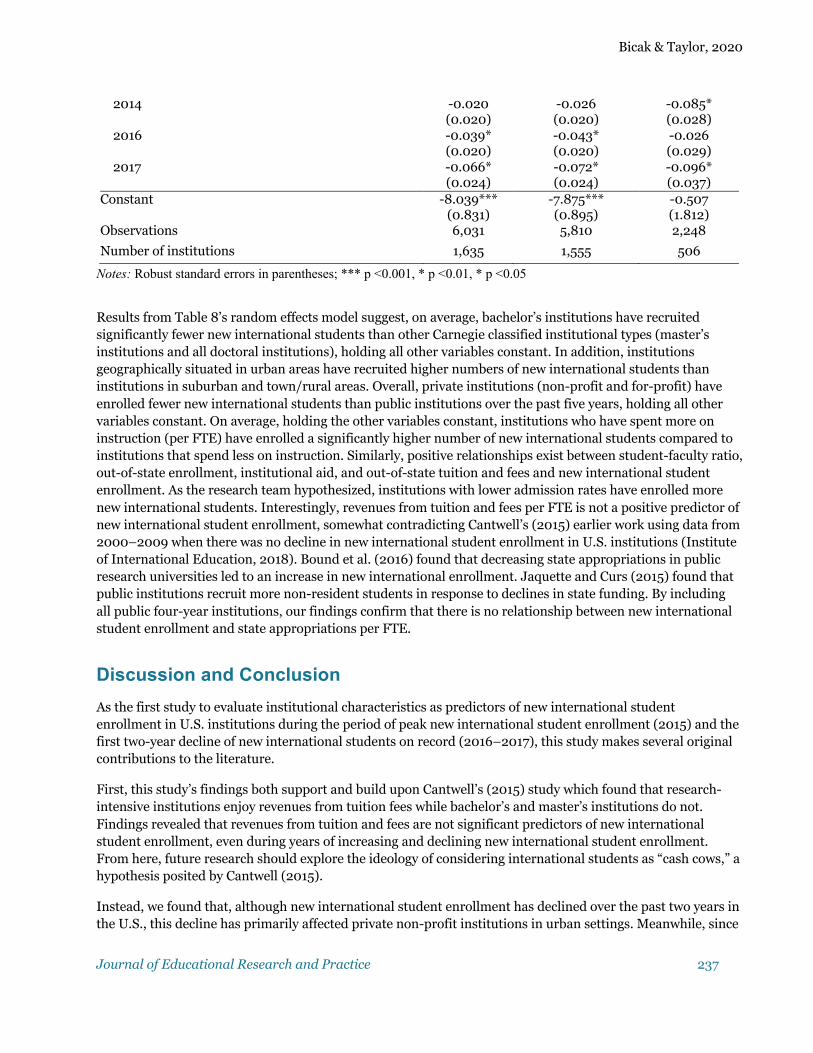
Results from Table 8’s random effects model suggest, on average, bachelor’s institutions have recruited significantly fewer new international students than other Carnegie classified institutional types (master’s institutions and all doctoral institutions), holding all other variables constant. In addition, institutions geographically situated in urban areas have recruited higher numbers of new international students than institutions in suburban and town/rural areas. Overall, private institutions (non-profit and for-profit) have enrolled fewer new international students than public institutions over the past five years, holding all other variables constant. On average, holding the other variables constant, institutions who have spent more on instruction (per FTE) have enrolled a significantly higher number of new international students compared to institutions that spend less on instruction. Similarly, positive relationships exist between student-faculty ratio, out-of-state enrollment, institutional aid, and out-of-state tuition and fees and new international student enrollment. As the research team hypothesized, institutions with lower admission rates have enrolled more new international students. Interestingly, revenues from tuition and fees per FTE is not a positive predictor of new international student enrollment, somewhat contradicting Cantwell’s (2015) earlier work using data from 2000–2009 when there was no decline in new international student enrollment in U.S. institutions (Institute of International Education, 2018). Bound et al. (2016) found that decreasing state appropriations in public research universities led to an increase in new international enrollment. Jaquette and Curs (2015) found that public institutions recruit more non-resident students in response to declines in state funding. By including all public four-year institutions, our findings confirm that there is no relationship between new international student enrollment and state appropriations per FTE.
Discussion and Conclusion As the first study to evaluate institutional characteristics as predictors of new international student enrollment in U.S. institutions during the period of peak new international student enrollment (2015) and the first two-year decline of new international students on record (2016–2017), this study makes several original contributions to the literature.
First, this study’s findings both support and build upon Cantwell’s (2015) study which found that research-intensive institutions enjoy revenues from tuition fees while bachelor’s and master’s institutions do not. Findings revealed that revenues from tuition and fees are not significant predictors of new international student enrollment, even during years of increasing and declining new international student enrollment. From here, future research should explore the ideology of considering international students as “cash cows,” a hypothesis posited by Cantwell (2015).
Instead, we found that, although new international student enrollment has declined over the past two years in the U.S., this decline has primarily affected private non-profit institutions in urban settings. Meanwhile, since
Bicak & Taylor, 2020
Journal of Educational Research and Practice 238
2016 and the election of perceived anti-immigration executive leadership in the U.S. (Redden, 2018), new international student enrollment at private, for-profit institutions and public institutions has remained relatively unchanged. Researchers and policymakers should investigate how these institutions have remained viable educational destinations for international students, despite anti-immigration or anti-international student sentiment in certain political circles (Redden, 2018).
We also found that certain institutional characteristics have significantly predicted new international student enrollment, including average institutional grant aid to first-time undergraduate students at bachelor’s institutions. Although institutions with very high research activity continue to enroll new international students at high rates, smaller, less research-intensive institutions—such as bachelor’s institutions—have seemingly adapted to the marketplace and are incenting students with institutional grant aid. Although it is unclear whether this aid went directly to new international students, it is important to note how less research-intensive institutions can still attract and enroll new international students through fiscal means.
Inversely, spending on academic support negatively predicted new international student enrollment at bachelor’s institutions, while instructional expenses and being located in urban settings positively predicted new international student enrollment at public and private non-profit institutions. Here, there seems to be a certain blending of institutional expenses, geographic location, and research intensity that has the ability to attract new international students: Smaller, less research-intensive institutions may need to incent new international students unless the institution is in an urban setting and spends its money on instruction. Other scenarios prove viable, as master’s institutions, doctoral institutions, and doctoral institutions with high research activity recruited significantly fewer new international students in 2017 than 2015, using 2015 as a baseline year for comparison. From here, it seems bachelor’s institutions have handled changing international student enrollment behaviors better than peers, yet admission rate was one of the strongest predictors of new international students across all variables from 2013 to 2017. Ultimately, the real or perceived exclusivity of the institution—regardless of location, expenses, or research intensity—seems to continue to be an important predictor of new international students.
If institutions are concerned with declining international student enrollment, many of the strongest predictors of enrolling these students are fixed: geography, institutional sector, and Carnegie classification. Improving the latter, a measure of institutional research output, is a common institutional goal, with extant research suggesting many institutions often invest in research to improve their ranking and their appeal to prospective students, international students included (Bohman, 2014; Bound et al.,2016; Curs & Jaquette, 2017). This study suggests—among seemingly fixed institutional characteristics—the competition for improving an institution’s Carnegie classification could be important in terms of attracting and enrolling new international students.
How institutions spend their money is a different discussion. Across different institution types, expenses on student services, instructional expenses, and institutional aid was only strongly predictive of new international student enrollment when also considering an institution’s fixedness, such as their sector or geographic location. If institutions are hoping to attract more new international students in the future, perhaps the best approach to understand how institutional spending influences international students would be to perform institution-specific research to articulate international student behaviors as they relate to institutional spending. This study suggests a specific institution type can spend in certain areas, but if one’s geography is unattractive, new international students may not follow. This study also suggests an institution could adopt methods of driving down acceptance rates to become more exclusive, but such methods require a considerable change in institutional mission and/or financial resources.
Ultimately, future research should explore more institution-specific drivers of new international student enrollment, in addition to institutional fixed effects of new international student enrollment. As an important

Bicak & Taylor, 2020
Journal of Educational Research and Practice 239
population of U.S. higher education students, researchers should continue to develop an understanding of how international students make decisions and how institutions themselves—despite their fixedness—can provide a nurturing and supportive education for students from around the world.
References Agarwal, V. B., & Winkler, D. R. (1985). Migration of foreign students to the United States. The Journal of
Higher Education, 56(5), 509–522. https://doi.org/10.1080/00221546.1985.11778715
Bodycott, P. (2009). Choosing a higher education study abroad destination: What mainland Chinese parents and students rate as important. Journal of Research in International Education, 8(3), 349–373. https://doi.org/10.1177/1475240909345818
Bohman, E. (2009). Headed for the heartland: Decision making process of community college bound international students. Community College Journal of Research and Practice, 34(1–2), 64–77. https://doi.org/10.1080/10668920903385848
Bohman, E. (2014). Attracting the world: Institutional initiatives’ effects on international students’ decision to enroll. Community College Journal of Research and Practice, 38(8), 710–720. https://doi.org/10.1080/10668926.2014.897081
Bound, J., Braga, B., Khanna, G., & Turner, S. (2016). NBER Working Paper: A passage to America: University funding and international students (Research Report No. 22981). https://www.nber.org/papers/w22981
Bruhn, T. (2016). Strategic importance of recruiting international students for community colleges framed in the context of an institution’s fiscal health (Doctoral dissertation, Rowan University). Rowan University digital archive. https://rdw.rowan.edu/etd/839/
Cantwell, B. (2015). Are international students cash cows? Examining the relationship between new international undergraduate enrollments and institutional revenue at public colleges and universities in the US. Journal of International Students, 5(4), 512–525. http://ojed.org/index.php/jis/article/view/412
Chen, L. (2008). Internationalization or international marketing? Two frameworks for understanding international students’ choice of Canadian universities. Journal of Marketing for Higher Education, 18(1), 1–33. https://doi.org/10.1080/08841240802100113
Commonfund Institute. (2018). Commonfund higher education price index: 2018 update. http://info.commonfund.org/commonfund-higher-education-price-index
Cubillo, J. M., Sánchez, J., & Cerviño, J. (2006). International students’ decision-making process. International Journal of Education Management, 20(2), 101–115. https://doi.org/10.1108/09513540610646091
Curs, B. R., & Jaquette, O. (2017). Crowded out? The effect of nonresident enrollment on resident access to public research universities. Educational Evaluation and Policy Analysis, 39(4), 644–669. https://doi.org/10.3102/0162373717704719
Darby, M. G. (2015). Understanding why international student applicants choose a public four-year institution (Doctoral dissertation, California State University – San Bernadino (CSUSB). CSUSB digital archive. https://scholarworks.lib.csusb.edu/etd/132/
Bicak & Taylor, 2020
Journal of Educational Research and Practice 240
Gatfield, T., & Chen, C. (2006). Measuring student choice criteria using the theory of planned behaviour: The case of Taiwan, Australia, UK, and USA. Journal of Marketing for Higher Education, 16(1), 77–95. https://doi.org/10.1300/J050v16n01_04
Hagedorn, L. S., & Zhang, Y. L. (2011). The use of agents in recruiting Chinese undergraduates. Journal of Studies in International Education, 15(2), 186–202. https://doi.org/10.1177/1028315310385460
Hausman, J. A. (1978). Specification tests in econometrics. Econometrica, 46(6), 1251–1271. https://doi.org/10.2307/1913827
Institute of International Education. (2018). 2018 open doors report. https://www.iie.org/Research-and-Insights/Open-Doors/Data/International-Students/Enrollment
Ishitani, T. T. (2016). Time-varying effects of academic and social integration on student persistence for first and second years in college: National data approach. Journal of College Student Retention: Research, Theory & Practice, 18(3), 263–286. https://doi.org/10.1177/1521025115622781
Jaquette, O., & Curs, B. R. (2015). Creating the out-of-state university: Do public universities increase nonresident freshman enrollment in response to declining state appropriations? Research in Higher Education, 56(6), 535–565. https://doi.org/10.1007/s11162-015-9362-2
Li, X. (2017). College admissions policy of international students: Theory and evidence. Social Science Research Network, 1–61. https://dx.doi.org/10.2139/ssrn.2889858
Mazzarol, T., & Soutar, G. N. (2002). “Push-pull” factors influencing international student destination choice. International Journal of Educational Management, 16(2), 82–90. https://doi.org/10.1108/09513540210418403
Mukherjee, M. (2016). Understanding academic momentum and enrollment outcomes for international students at an urban community college system (Doctoral dissertation, University of Houston). University of Houston digital archive. https://uh-ir.tdl.org/uh-ir/handle/10657/3229
Redden, E. (2018). New international enrollments decline again. Inside Higher Ed. https://www.insidehighered.com/news/2018/11/13/new-international-student-enrollments-continue-decline-us-universities
Shenoy, G. (2013). Information mismatch: What international students thought their community college experience would be like (Doctoral dissertation, University of Illinois at Urbana-Champaign). IDEAL Digital archive. http://hdl.handle.net/2142/44293
Stafford, T. H., Jr., Marion, P. B., & Salter, M. L. (1980). Adjustment of international students. NASPA Journal, 18(1), 40–45. https://www.tandfonline.com/doi/abs/10.1080/00220973.1980.11071771
Taylor, Z. W. & Bicak, I. (2018) Institutional, informational, international: Predicting international student enrollment and rate by online information. Journal of Comparative & International Higher Education, 10(Winter), 61–65. https://doi.org/10.32674/jcihe.v10iWinter.693
Taylor, Z. W., & Bicak, I. (2019) Institutional, international: A Texas case study of international student websites. Journal of International Students. https://doi.org/10.32674/jis.v0i0.756
Torbati, Y. (2018). Fewer foreign students coming to United States for second year in row: Survey. https://www.reuters.com/article/us-usa-immigration-students/fewer-foreign-students-coming-to-united-states-for-second-year-in-row-survey-idUSKCN1NI0EN
Torres-Reyna, O. (2007). Panel data analysis fixed and random effects using Stata (v. 4.2). https://www.princeton.edu/~otorres/Panel101.pdf

Bicak & Taylor, 2020
Journal of Educational Research and Practice 241
Zhang, Y. L., & Hagedorn, L. S. (2018). International student enrollment in US community colleges: Joint endeavors by individuals and institutions. In J. S. Levin & S. T. Kater (Eds.), Understanding community colleges (2nd ed., pp. 89–108). Routledge.
Zong, J., & Batalova, J. (2018). International students in the United States. https://www.migrationpolicy.org/article/international-students-united-states
The Journal of Educational Research and Practice is a peer-reviewed journal that provides a forum for studies and dialogue about developments and change in the field of education and learning. The journal includes research and related content that
examine current relevant educational issues and processes. The aim is to provide readers with knowledge and with strategies to use that knowledge in educational or learning environments. JERAP focuses on education at all levels and in any setting, and includes peer-reviewed research reports, commentaries, book reviews, interviews of prominent individuals, and reports about educational practice. The journal is sponsored by the Richard W. Riley College of Education and Leadership at Walden University, and publication in JERAP is always free to authors and readers.